Structural characterization of human RPA70N association with DNA damage response proteins
- School of Public Health & Sir Run Run Shaw Hospital, Zhejiang University School of Medicine, China
Figures
Figure 1 with 1 supplement
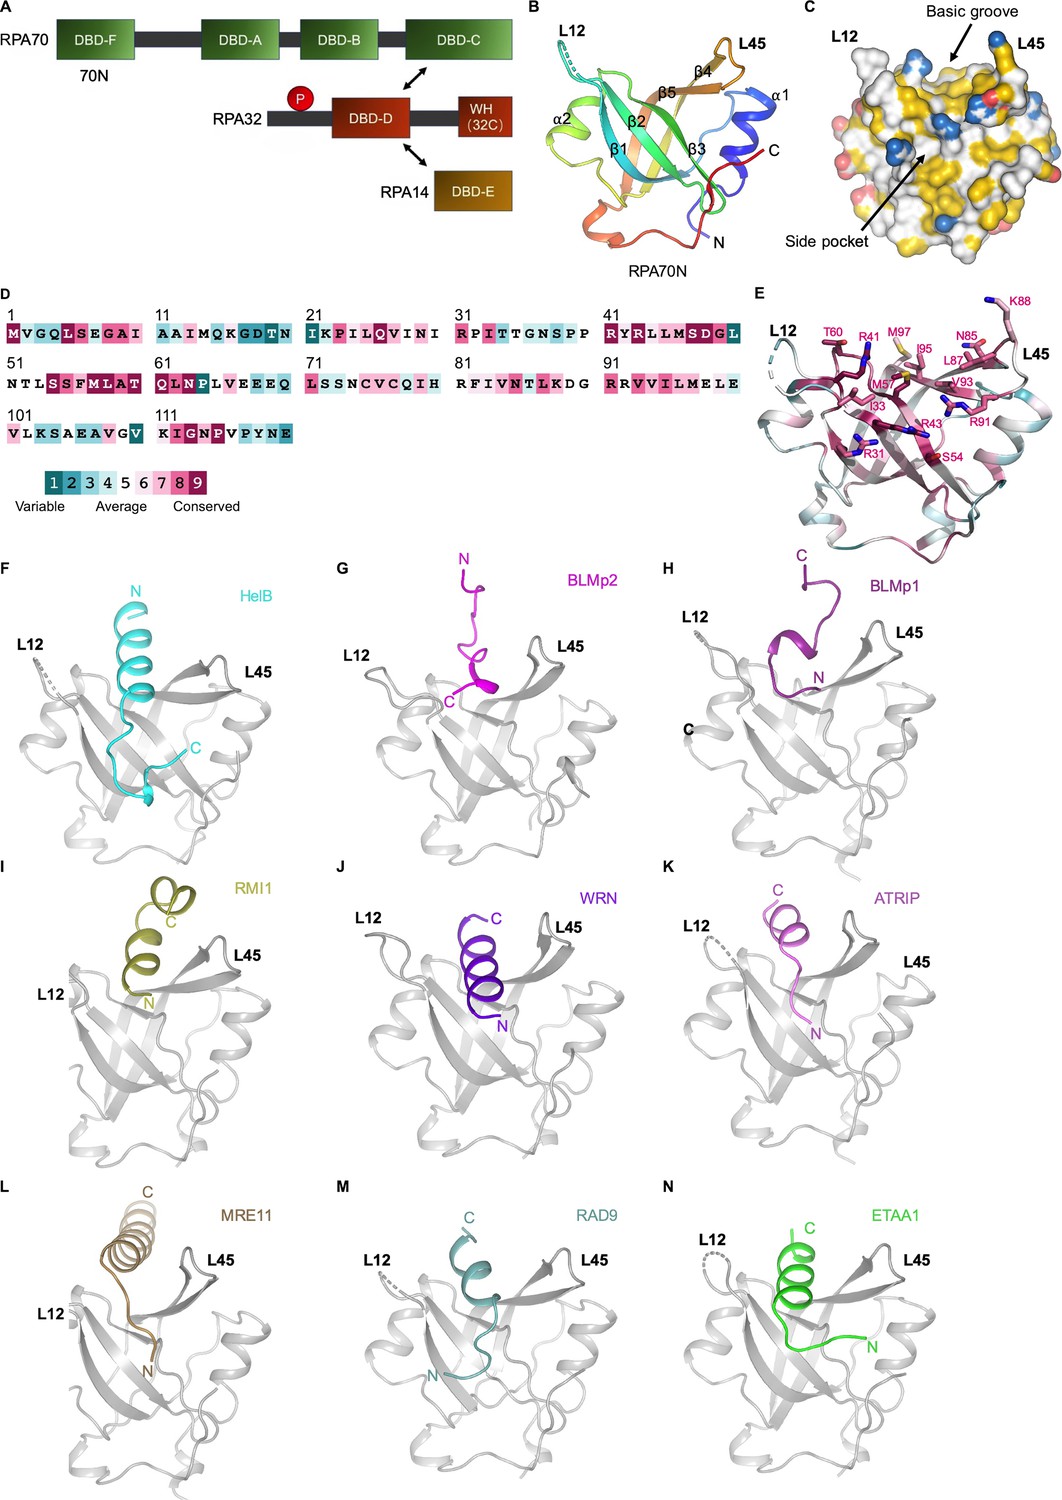
RPA70N–peptide complex structures determined in this study.
(A).Linear domain diagram of the RPA heterotrimer. (B) Ribbon representation of human RPA70N from PDB 5EAY. L12 denotes the loop between β1 and β2, L45 is the loop between β4 and β5. (C) Surface representation of RPA70N from PDB 5EAY, showing the basic groove and the side pocket, with hydrophobic, positively and negatively charged atoms in yellow, blue and red, respectively, and other atoms in white. (D) Conservation of the human RPA70N sequence. (E) Most of the conserved residues in RPA70N are located at the basic groove region. (F–N) Ribbon representation of the RPA70N–peptide complex structures determined in this study displayed in the same view. RPA70N is colored in gray.
-
Figure 1—source data 1
Data collection and refinement statistics.
- https://cdn.elifesciences.org/articles/81639/elife-81639-fig1-data1-v1.docx
Figure 1—figure supplement 1
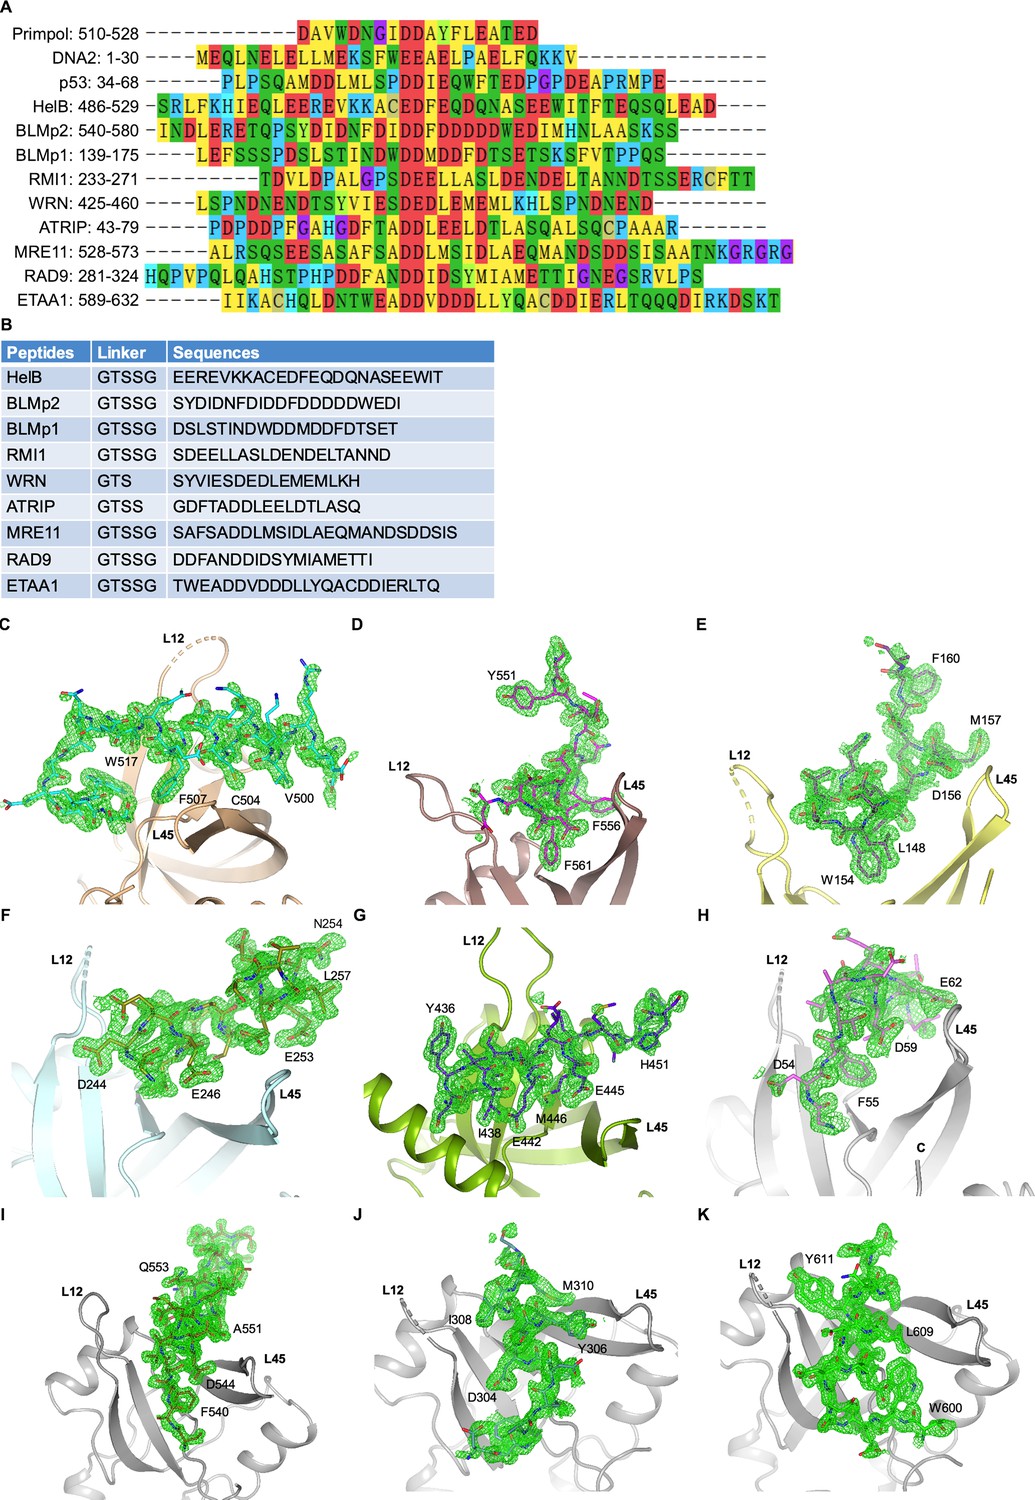
Sequence alignment and omit maps of bound peptides (related to Figure 1).
(A) Alignment of human RPA70N-interacting motif sequences from different proteins. (B) Linker and peptide sequences used in RPA70N fusion constructs. (C–K) mFo-DFc electron density maps (green mesh) of RPA70N–peptide complex structures determined in this study contoured at 2.0 σ.
Figure 2 with 1 supplement
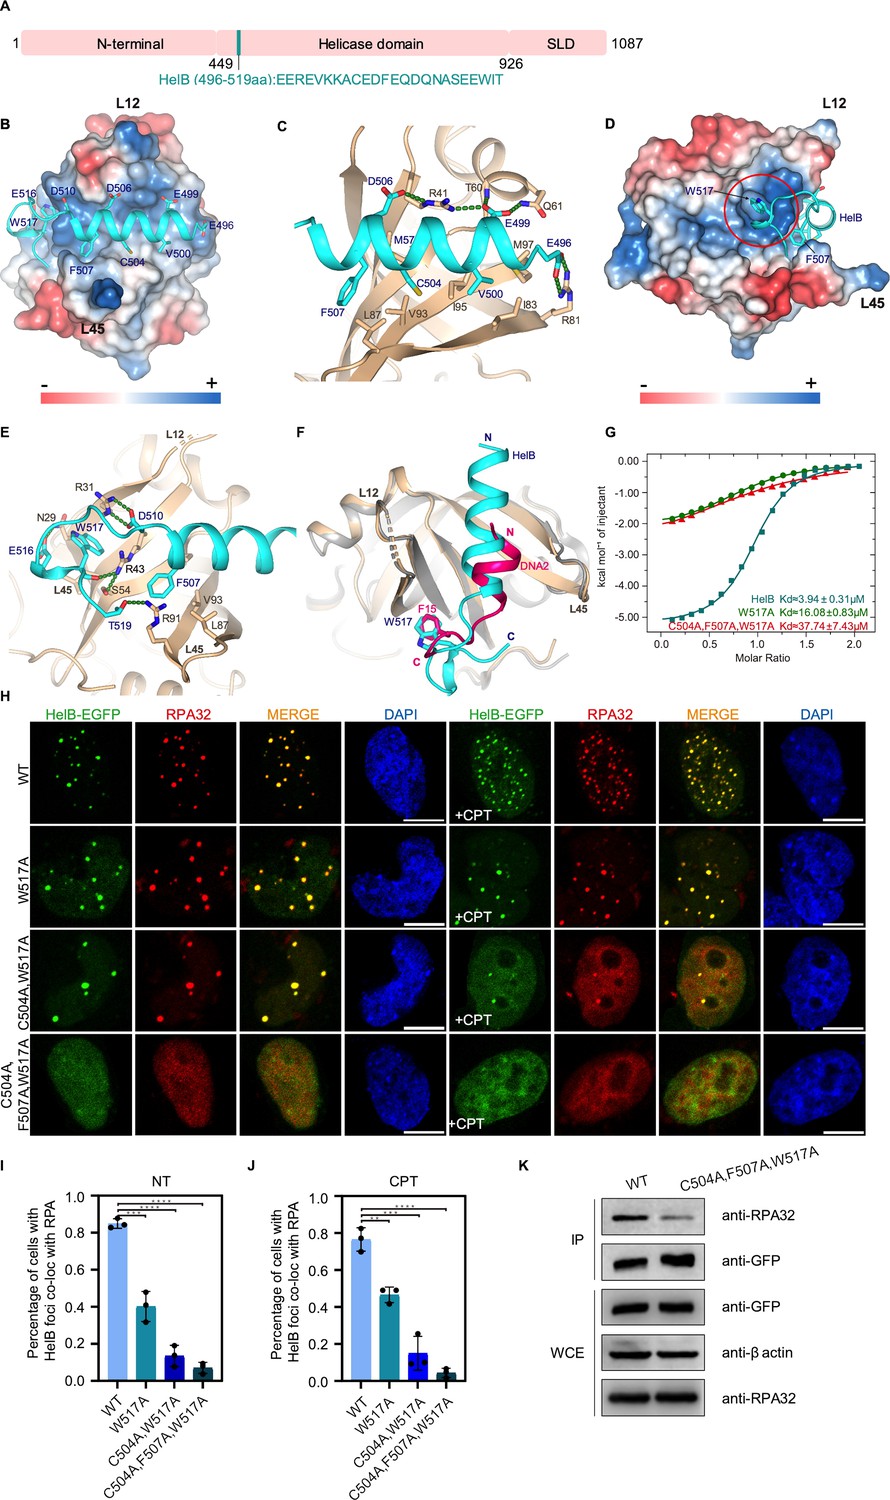
Structure of the RPA70N–HelB complex.
(A) Linear domain diagram of HelB showing the position and sequence of the RPA70N interacting motif. SLD: subcellular domain. (B) Structure of RPA70N in complex with HelB, showing the surface charges of RPA70N; hydrophobic and negatively charged residues of HelB are displayed as sticks, the HelB peptide is colored in cyan. (C) Close-up view of the amphipathic HelB helix interacting with the groove of RPA70N. HelB peptide is colored in cyan and RPA70N in beige. Green dashed lines indicate hydrogen bonds or salt bridges. (D) Side view of the RPA70N–HelB structure, the electrostatic surface of RPA70N is displayed and the side pocket is highlighted. The representation is rotated 90° compared to (B). (E) Close-up view of the side-pocket residues coordinating the C-terminal part of the HelB peptide. Green dashed lines indicate hydrogen bonds or salt bridges. (F) Superposition of RPA70N–HelB structure with the RPA70N–DNA2 structure (PDB:5EAY). HelB is colored in cyan, DNA2 in light-magenta. The direction of the HelB and DNA2 peptides in the RPA70N groove is the same in both structures. Both proteins have a hydrophobic residue inserted into the side pocket of RPA70N. (G) Isothermal titration calorimetry (ITC) results for WT HelB (496–519aa), W517A or C504A/F507A/W517A mutant peptides with RPA70N. (H) HeLa cells expressing HelB–EGFP, HelB (W517A)–EGFP, HelB (C504A/W517A)–EGFP, or HelB (C504A/F507A/W517A)–EGFP were treated with medium control (NT) or camptothecin (CPT) (2 μM, 2 h), fixed and immunostained with an anti-RPA32 antibody. The scale bar is 10 μm. (I) and (J). Quantification of data from (H). Data are presented as mean ± s.d. of three independent experiments. 100 cells from each experiment were analyzed, and cells containing more than three bright HelB and RPA co-localization foci were defined as positive. Statistical analysis was performed using a two-tailed Student’s t-test (**** P<0.0001, *** P<0.001, ** P<0.01, * P<0.05). (K) Immunoprecipitation and western blot showing that mutation of HelB residues reduced RPA association. Anti-EGFP magnetic beads were used to carry out immunoprecipitations, followed by probing with an anti-RPA32 antibody. IP, immunoprecipitation; WCE, whole cell extract.
-
Figure 2—source data 1
Raw data of all western blots from Figure 2.
- https://cdn.elifesciences.org/articles/81639/elife-81639-fig2-data1-v1.zip
Figure 2—figure supplement 1
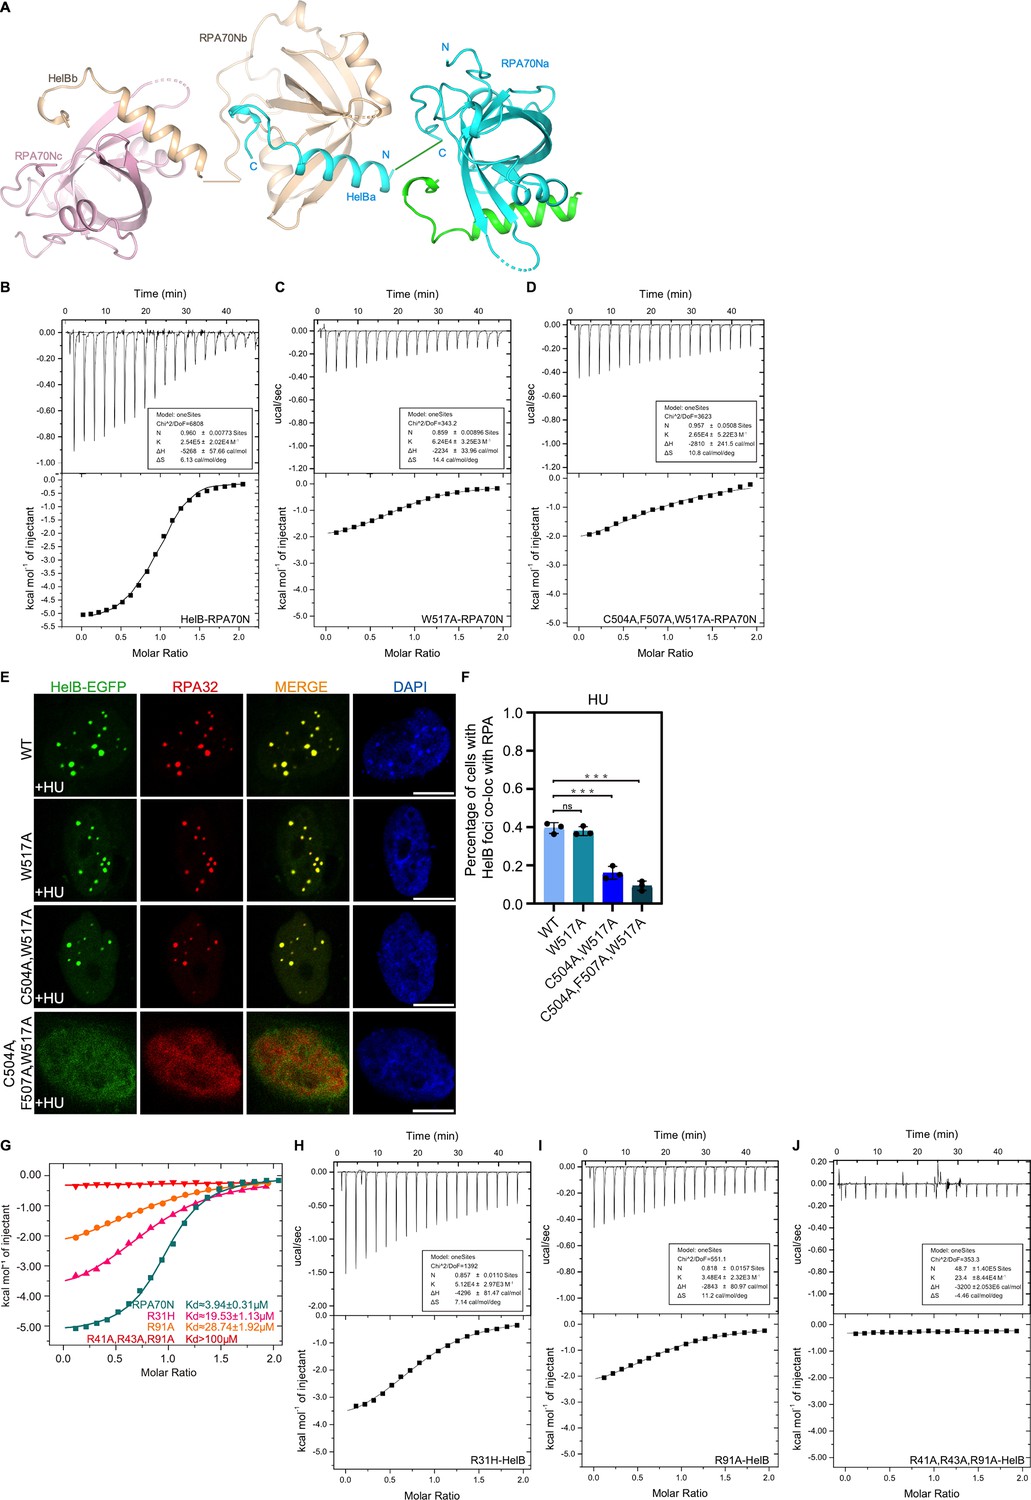
Characterization of RPA70N–HelB interaction (related to Figure 2).
(A) Crystal packing analysis indicates that a HelB peptide from one RPA70N–HelB fusion molecule binds to the RPA70N portion of a neighboring molecule in the crystal. (B–D) ITC titration profiles of (B) WT HelB (496–519aa) peptide, (C) W517A mutant peptide or (D) C504A/F507A/W517A mutant peptide with RPA70N. (E) HeLa cells expressing HelB–EGFP, HelB (W517A)–EGFP, HelB (C504A/W517A)–EGFP or HelB (C504A/F507A/W517A)–EGFP were treated with hydroxyurea (HU) (2 mM, 3 h), fixed and immunostained with an anti-RPA32 antibody. The scale bar is 10 μm. (F) Quantification of data from (E). Data are presented as mean ± s.d. of three independent experiments. 100 cells from each experiment were analyzed, cells containing more than three bright HelB and RPA co-localization foci were defined as positive. Statistical analysis was performed using a two-tailed Student’s t-test (**** P<0.0001, *** P<0.001, ** P<0.01, * P<0.05). (G) ITC titration results for WT RPA70N(1–120aa), R31H, R91A or R41A/R43A/R91A mutant protein with HelB peptide. R31H was found in some cancer samples. (H–J) ITC titration profiles of (H) R31H mutant protein, (I) R91A mutant protein or (J) R41A/R43A/R91A mutant protein with HelB peptide.
Figure 3 with 2 supplements
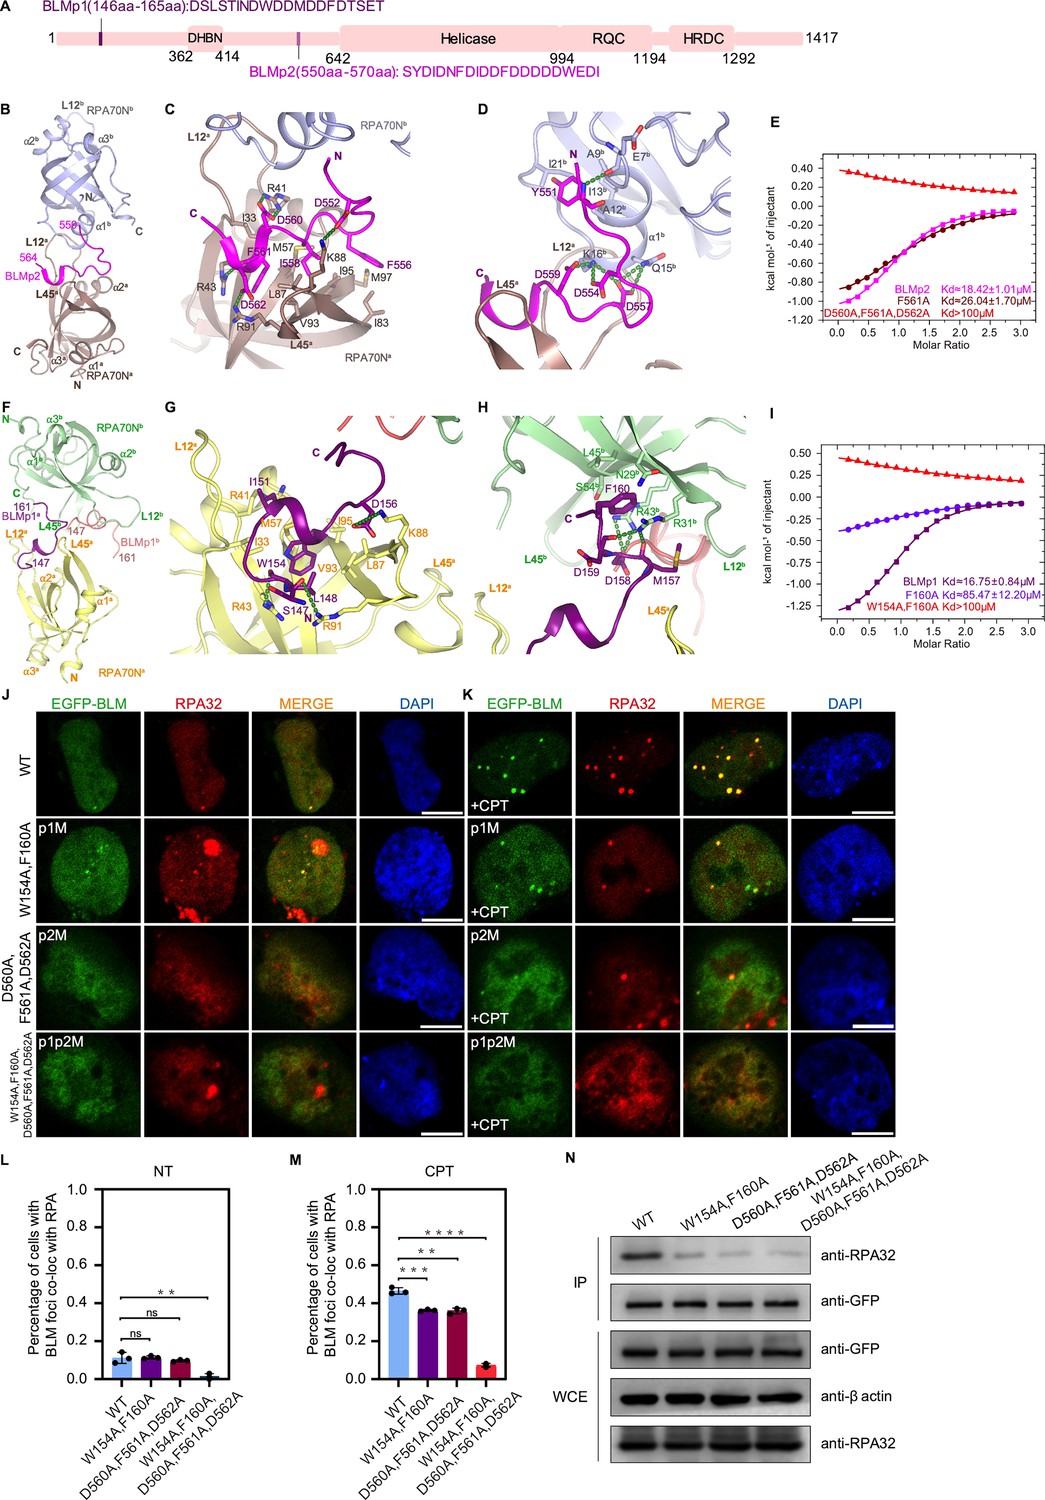
Structures of two RPA70N–BLM complexes.
(A) Linear domain diagram of BLM showing the position and sequence of RPA70N interacting motifs. DHBN, dimerization helical bundle in N-terminal region; RDC, RecQ-conserved domain; HRDC, helicase and RNaseD in C-terminal region. (B) Ribbon representation of the RPA70N–BLMp2 crystal structure, the BLMp2 peptide is coordinated by two RPA70N molecules. BLMp2 is colored in magenta and the two RPA70N molecules are colored in brown and light-blue, respectively. (C) Close-up view of BLMp2 interacting with the RPA70Na groove. Interacting residues are shown as sticks, green dashed lines indicate hydrogen bonds or salt bridges. (D) Close-up view of BLMp2 interacting with RPA70Nb α1, interacting residues are shown as sticks, green dashes indicate hydrogen bonds or salt bridges. (E) ITC titration results for WT BLMp2 (550–570aa), F561A or D560A/F561A/D562A mutant peptide with RPA70N. (F) Ribbon representation of the RPA70N–BLMp1 crystal structure: the BLMp1 peptide is coordinated by two RPA70N molecules. BLMp1a is colored in purple, BLMp1b is colored in pink and the two RPA70N molecules are colored in yellow and light-green, respectively. (G) Close-up view of BLMp1 interacting with the RPA70Na groove. Interacting residues are shown as sticks, green dashes indicate hydrogen bonds or salt bridges. (H) Close-up view of BLMp1 interacting with the RPA70Nb side-pocket. Interacting residues are shown as sticks, green dashes indicate hydrogen bonds or salt bridges. (I) ITC titration results for WT BLMp1 (146–165aa), F160A or W154A/F160A mutant peptide with RPA70N. (J, K) HeLa cells expressing EGFP–BLM, EGFP–BLM(W154A/F160A, p1M), EGFP–BLM (D560A/F561A/D562A, p2M), or EGFP–BLM(W154A/F160A/D560A/F561A/D562A, p1p2M) were treated with medium control (NT) or CPT (2 μM, 2 h), fixed and immunostained with an anti-RPA32 antibody. The scale bar is 10 μm. (L, M). Quantification of data from (J) and (K). Data are presented as mean ± s.d. of three independent experiments. 100 cells from each experiment were analyzed, cells containing more than three bright BLM and RPA co-localization foci were defined as positive. Statistical analysis was performed using a two-tailed Student’s t-test (**** P<0.0001, *** P<0.001, ** P<0.01, * P<0.05). (N) Immunoprecipitation and western blot showing that mutation of BLM residues reduced RPA association. Anti-EGFP magnetic beads were used to carry out immunoprecipitations, followed by probing with an anti-RPA32 antibody. IP, immunoprecipitation; WCE, whole cell extract.
-
Figure 3—source data 1
Raw data from all western blots shown in Figure 3.
- https://cdn.elifesciences.org/articles/81639/elife-81639-fig3-data1-v1.zip
Figure 3—figure supplement 1
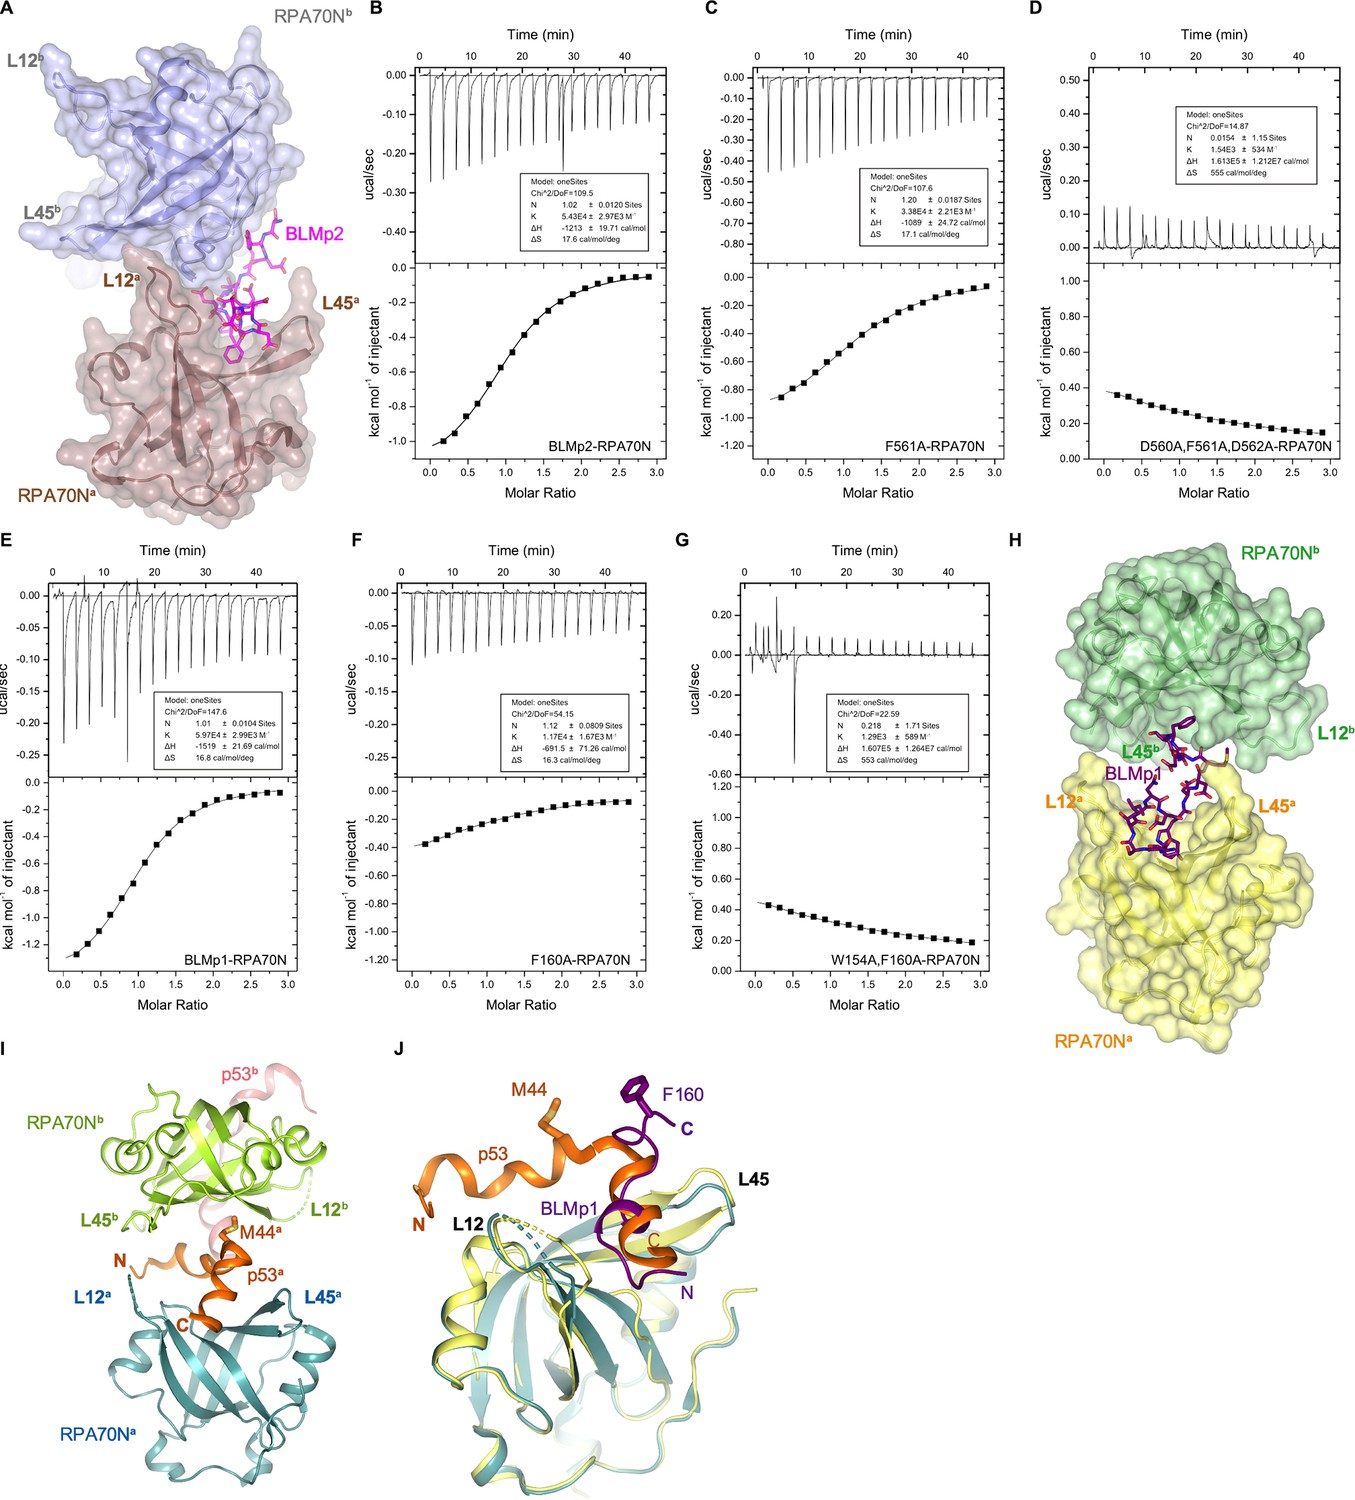
Characterization of RPA70N–BLM interaction (related to Figure 3).
(A) Surface representation of the two RPA70N molecules interacting with a BLMp2 peptide, which is displayed as magenta sticks. (B–D) ITC titration profiles of (B) WT BLMp2 (550–570 aa) peptide, (C) F561A mutant peptide or (D) D560A/F561A/D562A mutant peptide with RPA70N. (E–G) ITC titration profiles of (E) WT BLMp1 (146–165aa) peptide, (F) F160A mutant peptide or (G) W154A/F160A mutant peptide with RPA70N. (H) Like BLMp1, p53 (orange) also binds two RPA70N molecules with M44A inserts into the side pocket of a neighboring RPA70N (as shown in PDB 2B3G). (I, J) Superposition of the RPA70N–BLMp1 structure with that of RPA70N–p53 (2B3G), showing the different positions of p53 M44 and BLM F160. In addition, the two peptides are positioned in different directions.
Figure 3—figure supplement 2
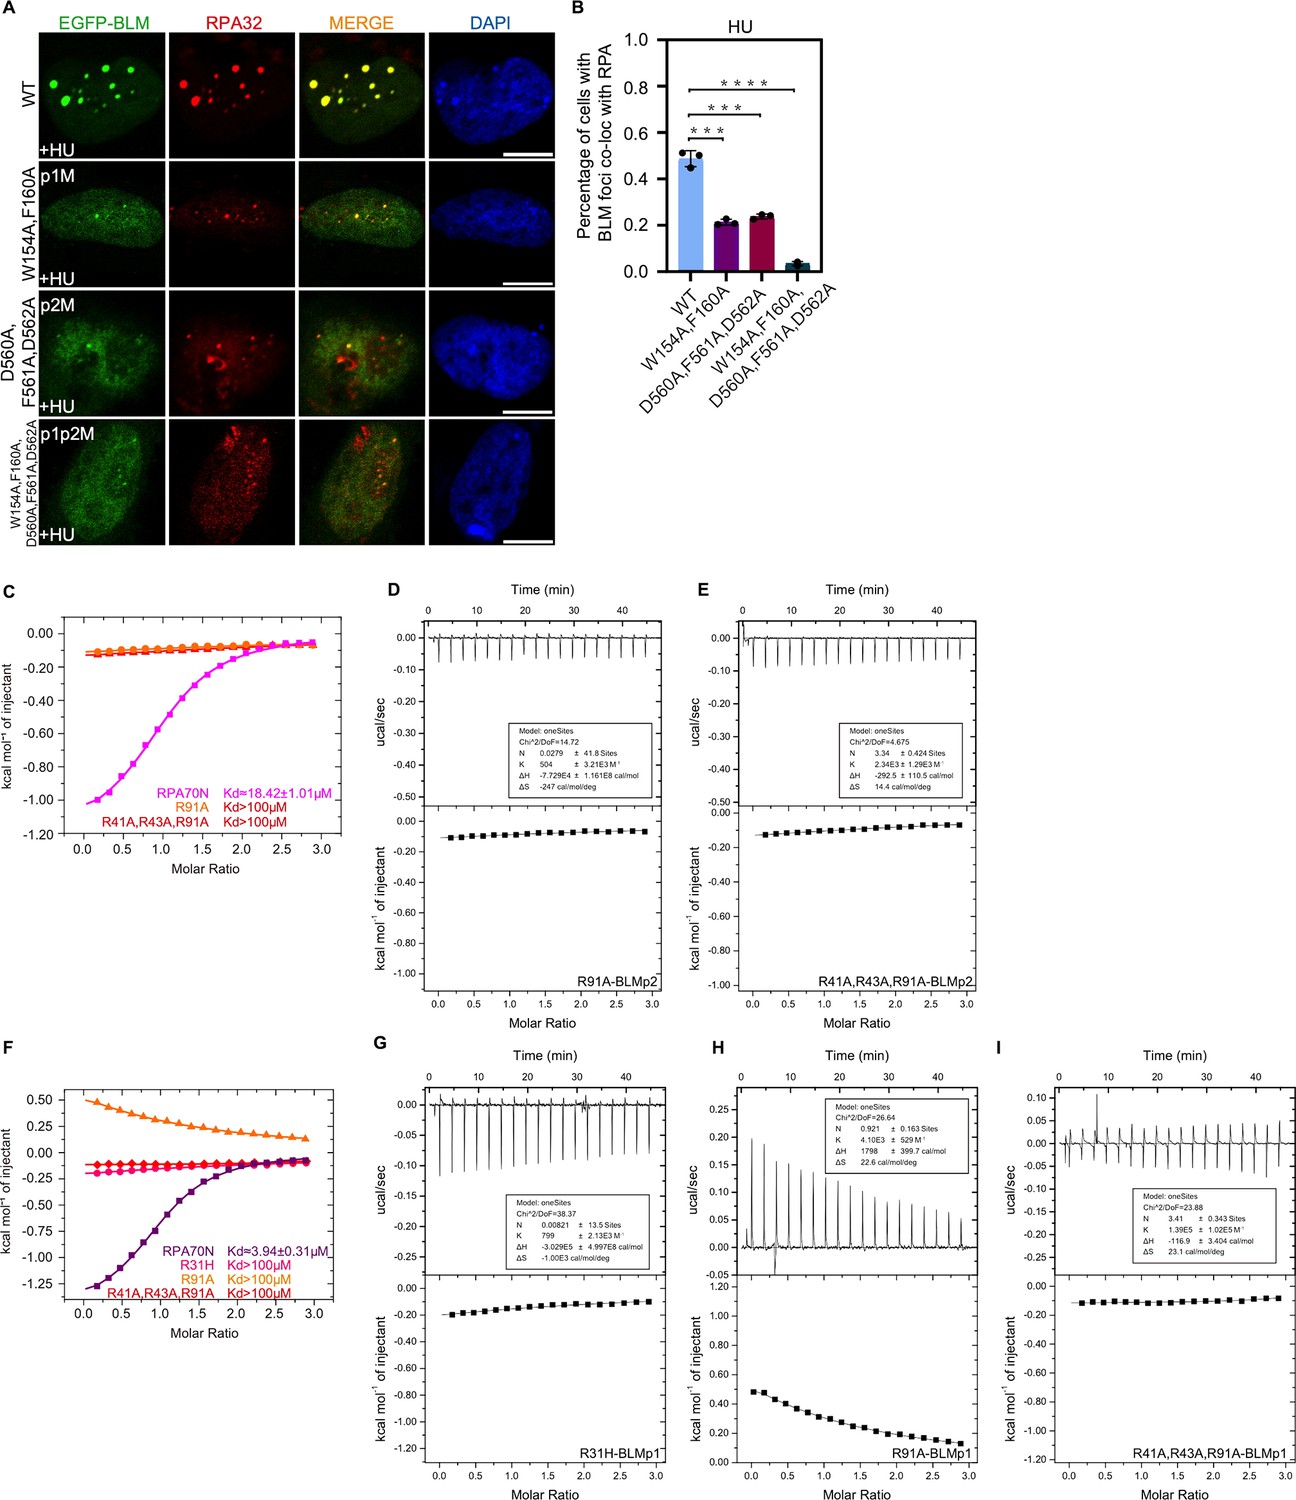
Characterization of the RPA70N–BLM interaction (related to Figure 3).
(A) HeLa cells expressing EGFP–BLM, EGFP–BLM (W154A/F160A, p1M), EGFP–BLM (D560A/F561A/D562A, p2M) or EGFP–BLM (W154A/F160A/D560A/F561A/D562A, p1p2M) were treated with HU (2 mM, 3 h), fixed and immunostained with an anti-RPA32 antibody. The scale bar is 10 μm. (B) Quantification of data from (A) and (B). Data are presented as mean ± s.d. of three independent experiments. 100 cells from each experiment were analyzed, and cells containing more than three bright BLM and RPA co-localization foci were defined as positive. Statistical analysis was performed using a two-tailed Student’s t-test (**** P<0.0001, *** P<0.001, ** P<0.01, * P<0.05). (C) ITC titration results for WT RPA70N (1–120aa), R91A or R41A/R43A/R91A mutant protein with BLMp2 peptide. (D–E) ITC titration profiles of (D) R91A mutant protein or (E) R41A/R43A/R91A mutant protein with BLMp2 peptide. (F) ITC titration results for WT RPA70N (1–120aa), R31H, R91A or R41A/R43A/R91A mutant protein with BLMp1 peptide. (G–I) ITC titration profiles of (G) R31H mutant protein, (H) R91A mutant protein and (I) R41A/R43A/R91A mutant protein with BLMp1 peptide.
Figure 4 with 1 supplement
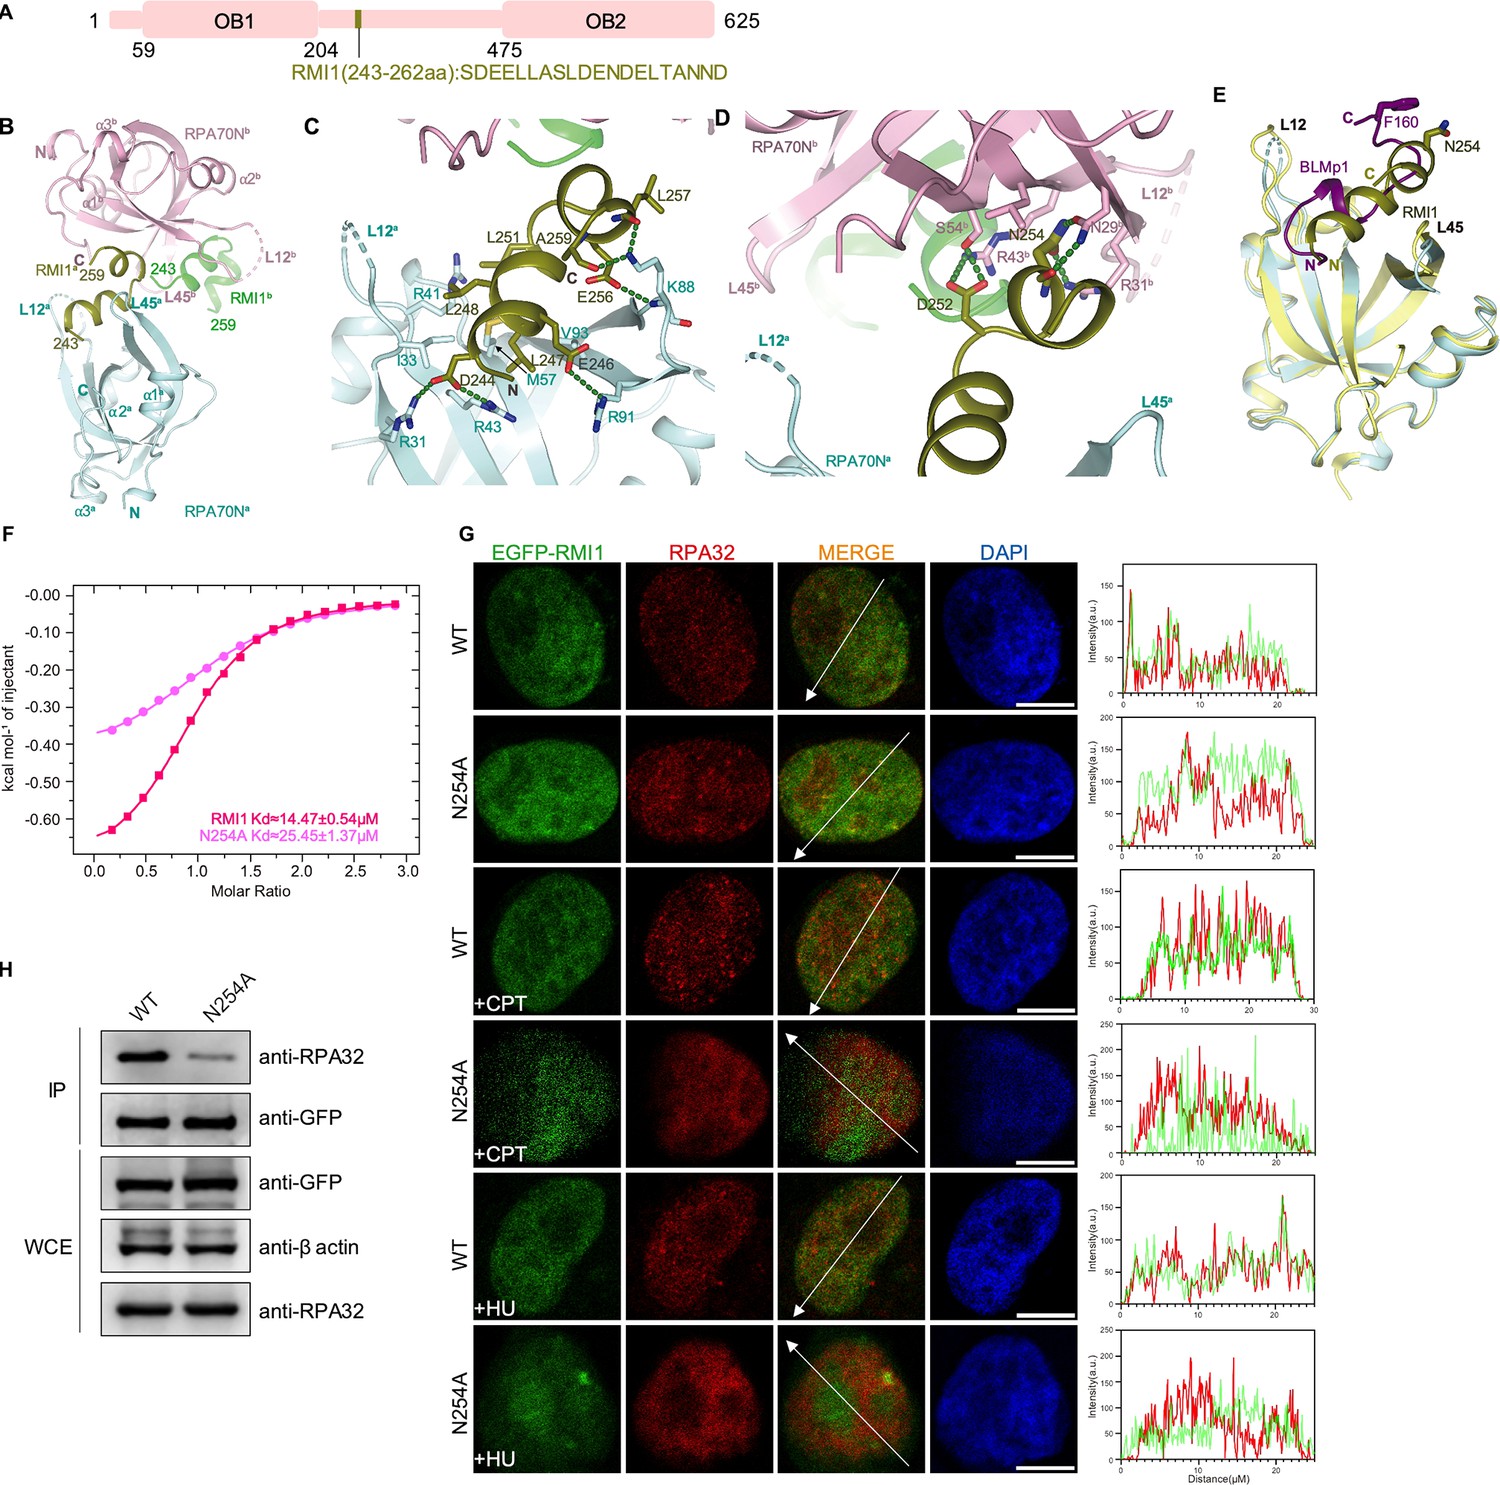
Structure of the RPA70N–RMI1 complex.
(A) Linear domain diagram of RMI1, showing the position and sequence of the RPA70N interacting motif. (B) Ribbon representation of the RPA70N–RMI1 crystal structure, the RMI1 peptide is coordinated by two RPA70N molecules. RMI1 is colored in olive and the two RPA70N molecules are colored pale-cyan and light-pink. The other RMI1 peptide in RPA70Nb is colored green. (C) Close-up view of RMI1 interacting with the RPA70Na groove, interacting residues are shown as sticks, green dashed lines indicate hydrogen bonds or salt bridges. (D) Close-up view of RMI1 interacting with the RPA70Nb side-pocket. Interacting residues are shown as sticks, and green dashed lines indicate hydrogen bonds or salt bridges. (E) Superposition of the RPA70N–RMI1 structure with that of the RPA70N–BLMp1 complex: RMI1 and BLMp1 interact with RPA70N in a similar manner. (F) ITC titration results for the WT RMI1 peptide (243–262aa) or the N254A mutant peptide with RPA70N. (G) HeLa cells expressing EGFP–RMI1 or EGFP–RMI1(N254A) were treated with medium control, CPT (2 μM, 2 h) or HU (2 mM, 3 h), fixed and immunostained with an anti-RPA32 antibody. The scale bar is 10 μm. The intensities of the fluorescent signals for EGFP–RMI1 or EGFP RMI1(N254A) and RPA32 are displayed on the right. (H) Immunoprecipitation and western blotting showed that mutation of RMI1 residues reduced the RPA association. Anti-EGFP magnetic beads were used to carry out immunoprecipitation, which was followed by probing with an anti-RPA32 antibody. IP, immunoprecipitation; WCE, whole cell extract.
-
Figure 4—source data 1
Raw data for all all western blots shown in Figure 4.
- https://cdn.elifesciences.org/articles/81639/elife-81639-fig4-data1-v1.zip
Figure 4—figure supplement 1
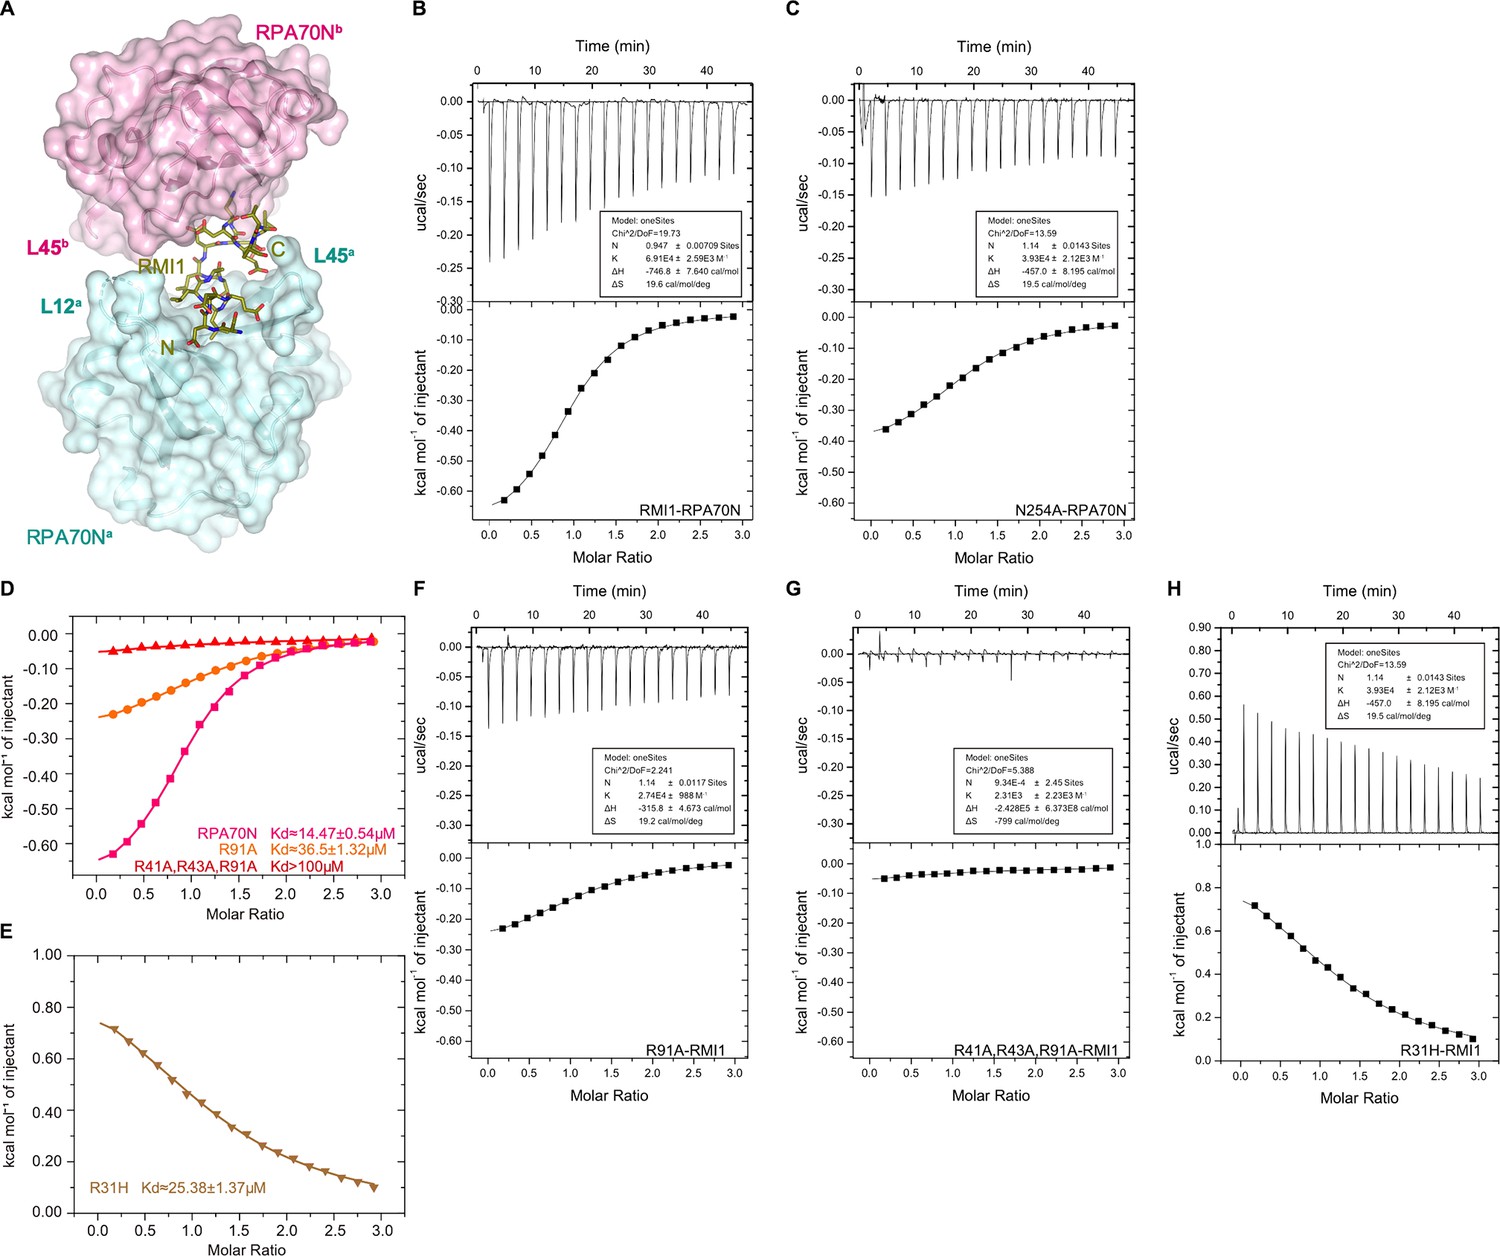
Characterization of the RPA70N–RMI1 interaction (related to Figure 4).
(A) Surface representation of the two RPA70N molecules interacting with an RMI1 peptide, which is displayed as olive-colored sticks. (B–C) ITC titration profiles of WT RMI1 (243–262aa) peptide (B) and N254A mutant peptid (C) with RPA70N. (D–E) ITC titration results for WT RPA70N (1–120aa), R31H, R91A or R41A/R43A/R91A mutant protein with RMI1 peptide. (F–H) ITC titration profiles of R91A mutant protein (F), R41A/R43A/R91A mutant protein (G) or R31H mutant protein (H) with RMI1 peptide.
Figure 5 with 1 supplement
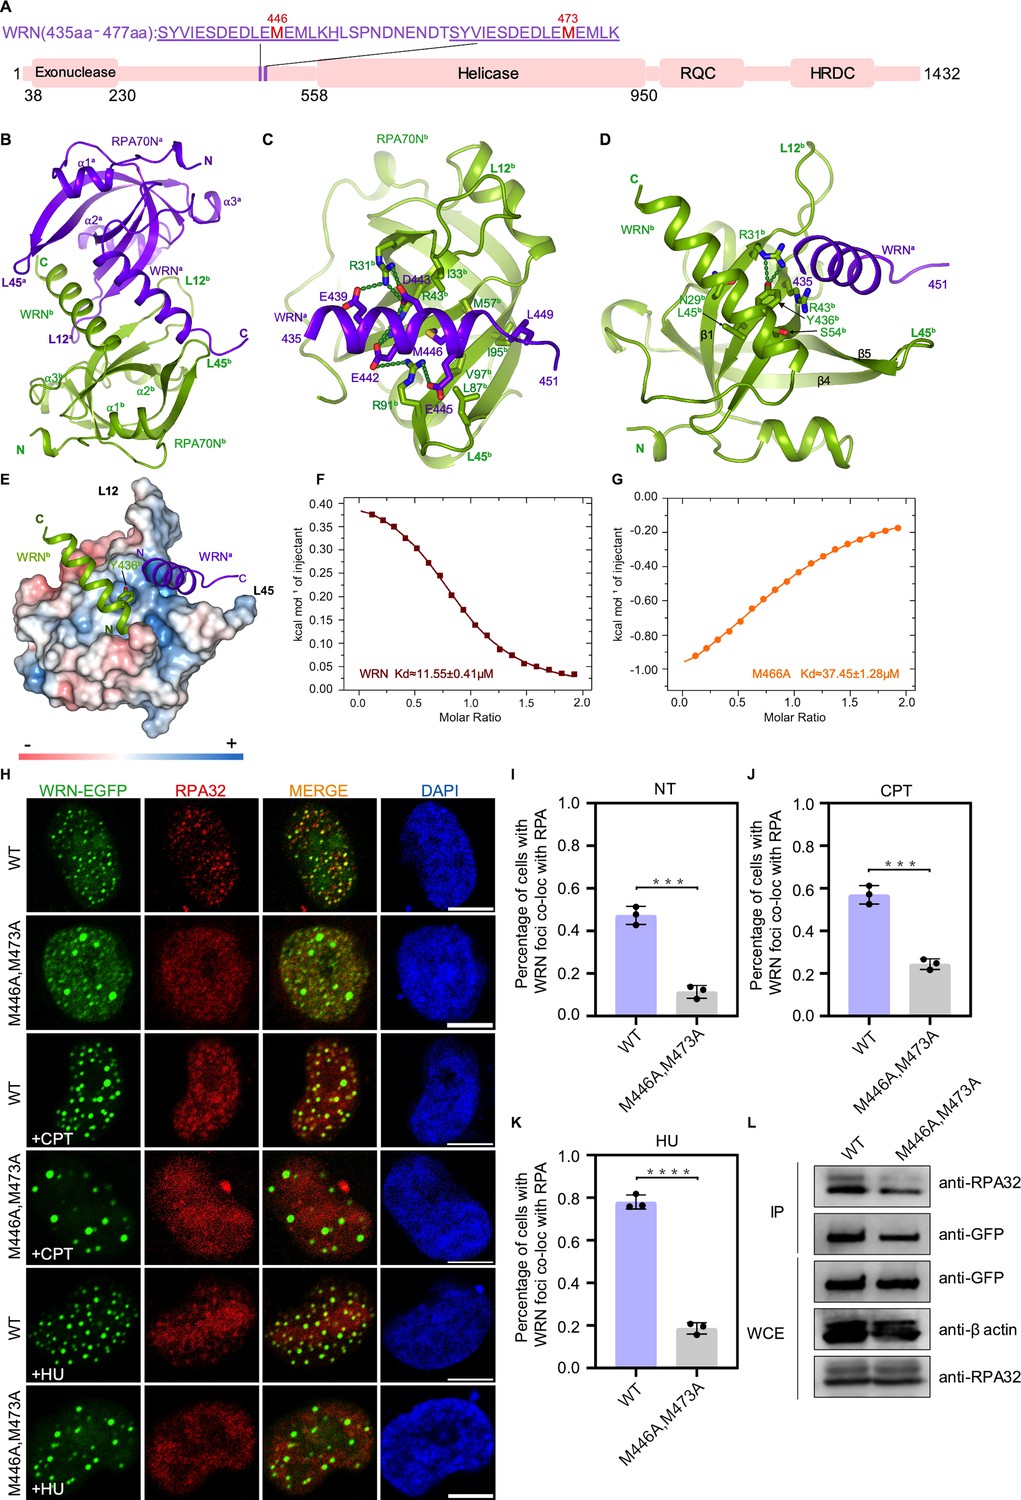
Structure of the RPA70N–WRN complex.
(A) Linear domain diagram of WRN showing the position and sequence of RPA70N-interacting motifs. (B) Ribbon representation of the RPA70N–WRN crystal structure. The fused WRN peptide forms an α helix and inserts into the groove of the symmetry-related RPA70N molecule. The two RPA70N molecules and linked WRN peptides are colored in purple-blue and light-green, respectively. (C) Close-up view of WRNa interacting with the RPA70Nb groove, interacting residues are shown as sticks, green dashed lines indicate hydrogen bonds or salt bridges. (D) Close-up view of WRNb interacting with the RPA70Nb side-pocket. Interacting residues are shown as sticks, whereas green dashed lines indicate hydrogen bonds or salt bridges. (E) Y436b from WRNb inserts into the side pocket of RPA70Nb while WRNa sits in the basic groove of RPA70Nb. (F) ITC titration data for the WT WRN peptide (435–451aa) with RPA70N: the titration appears to be endothermic. (G) ITC titration data for the M466A mutant WRN peptide (435–451aa) with RPA70N. (H) HeLa cells expressing WRN–EGFP or WRN (M446A/M473A)–EGFP were treated with medium control (NT), CPT (2 μM, 2 h) or HU (2 mM, 3 h), fixed and immunostained with an anti-RPA32 antibody. The scale bar is 10 μm. (I, J and K) Quantification of data from (H), data are presented as mean ± s.d. of three independent experiments. 100 cells from each experiment were analyzed. Cells containing more than three bright WRN and RPA co-localization foci were defined as positive. Statistical analysis was performed using a two-tailed Student’s t-test (**** P<0.0001, *** P<0.001, ** P<0.01, * P<0.05). (L) Immunoprecipitation and western blot showing that the mutation of WRN residues reduced RPA association. Anti-EGFP magnetic beads were used to carry out immunoprecipitation, which was followed by probing with an anti-RPA32 antibody. IP, immunoprecipitation; WCE, whole cell extract.
-
Figure 5—source data 1
Raw data for all of the western blots shown in Figure 5.
- https://cdn.elifesciences.org/articles/81639/elife-81639-fig5-data1-v1.zip
Figure 5—figure supplement 1
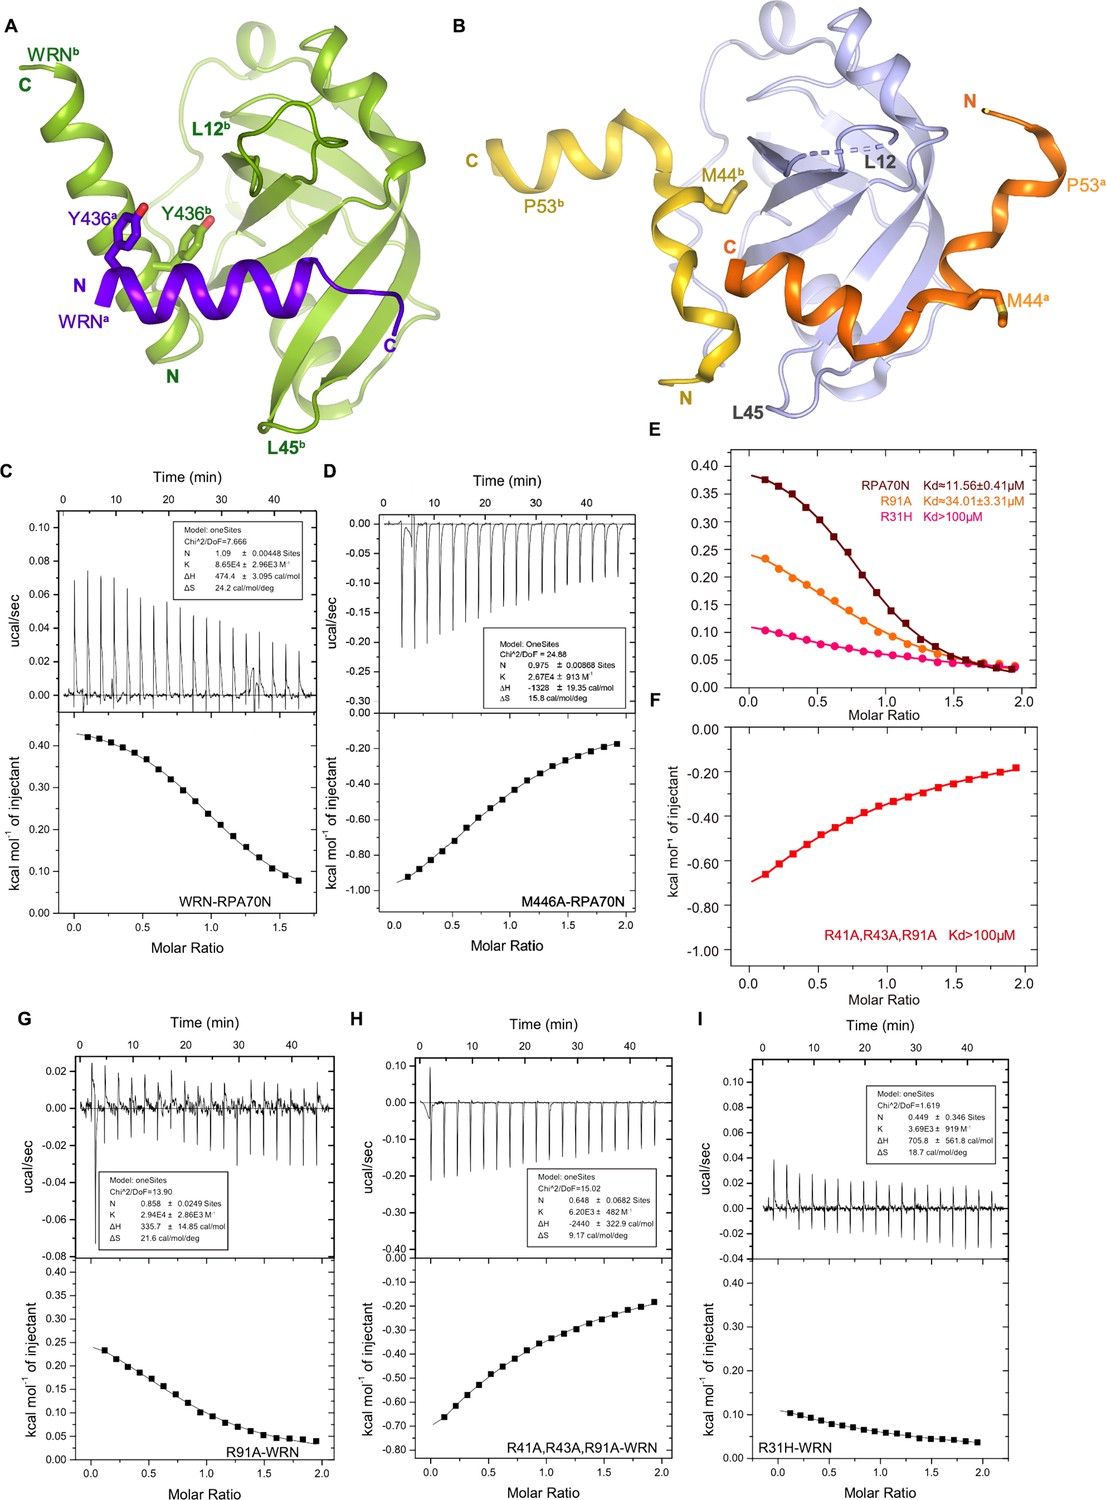
Characterization of the RPA70N–WRN interaction (related to Figure 5).
(A) Ribbon representation of the two WRN peptides interacting with RPA70N. WRNa (purple-blue) binds to the groove, while WRNb (light green) binds to the side pocket with Y436b.(B) Ribbon representation of two p53 peptides binding to one RPA70N molecule (PDB:2B3G). p53a (orange) binds to the groove, while p53b (yellow) binds to the side pocket with M44b. The direction of the p53a peptide is reversed compared to that of WRNa, and as a result, Y436a is at a different location when compared to M44a.(C–D.) ITC titration profiles of the WT WRN (435–451aa) peptide (C) and the M446A mutant peptide (D) with RPA70N. (E–F) ITC titration data for WT RPA70N (1–120aa), R31H, R91A or R41A/R43A/R91A mutant proteins with the WRN peptide. (G–I) ITC titration profiles of R91A mutant protein (G), R41A/R43A/R91A mutant protein (H) or R31H mutant protein (I) with the WRN peptide.
Figure 6 with 1 supplement
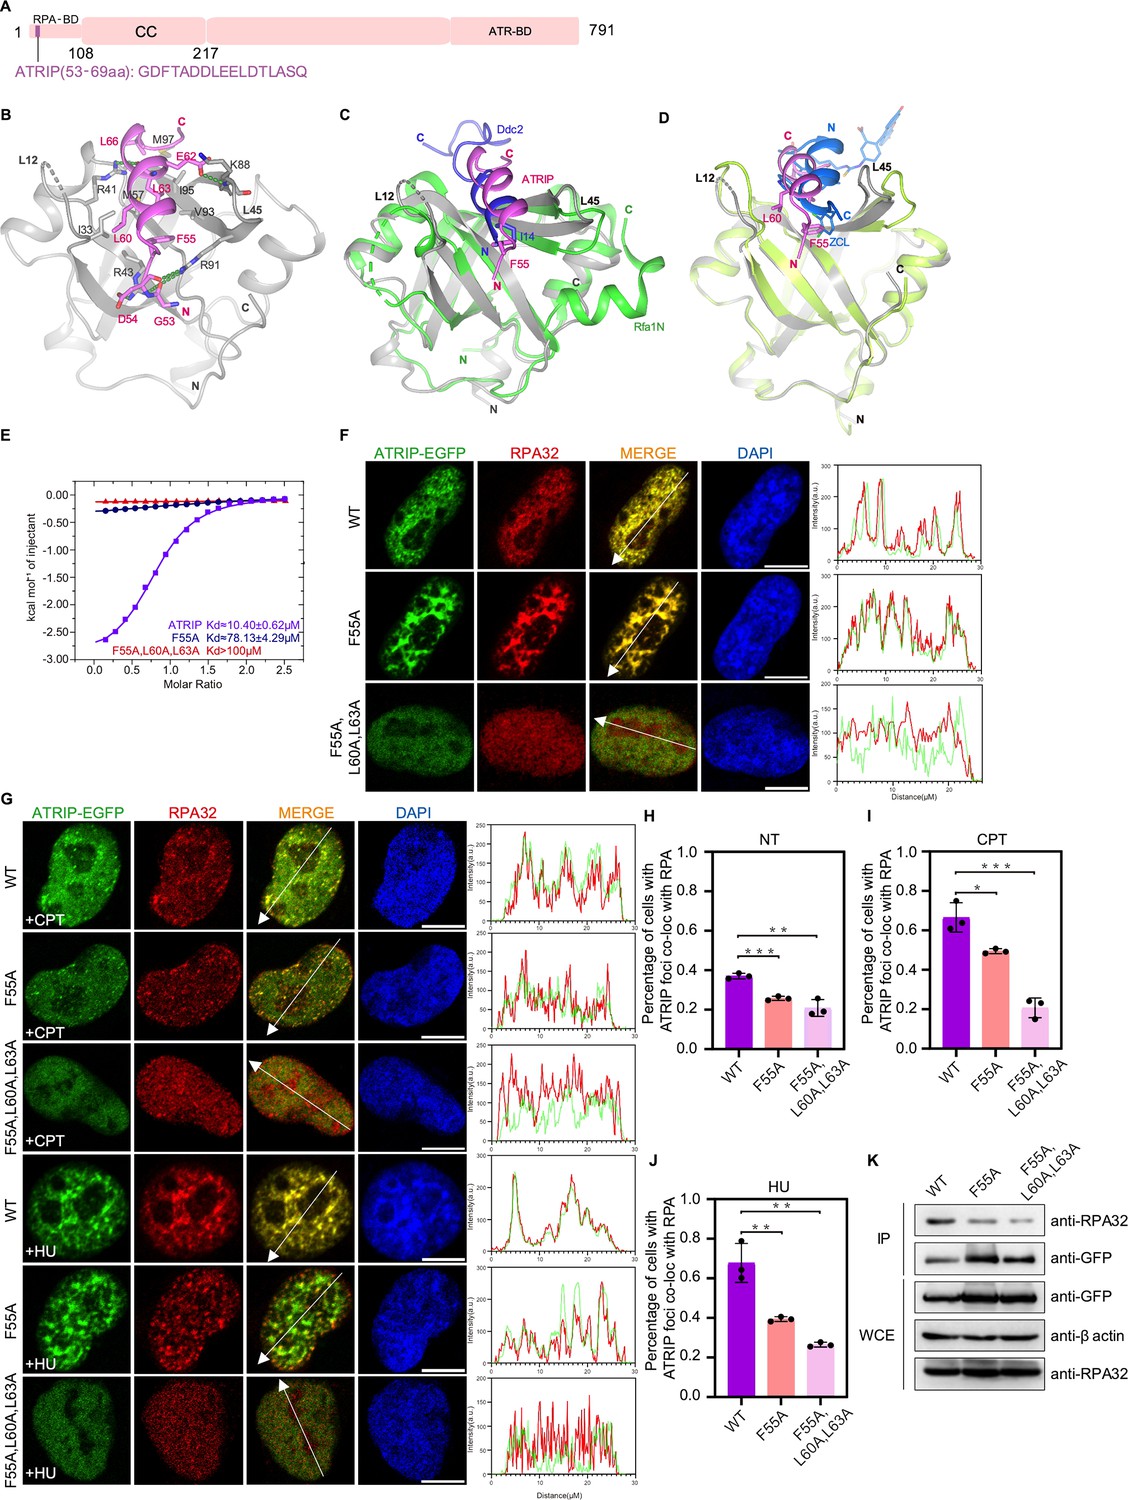
Structure of the RPA70N–ATRIP complex.
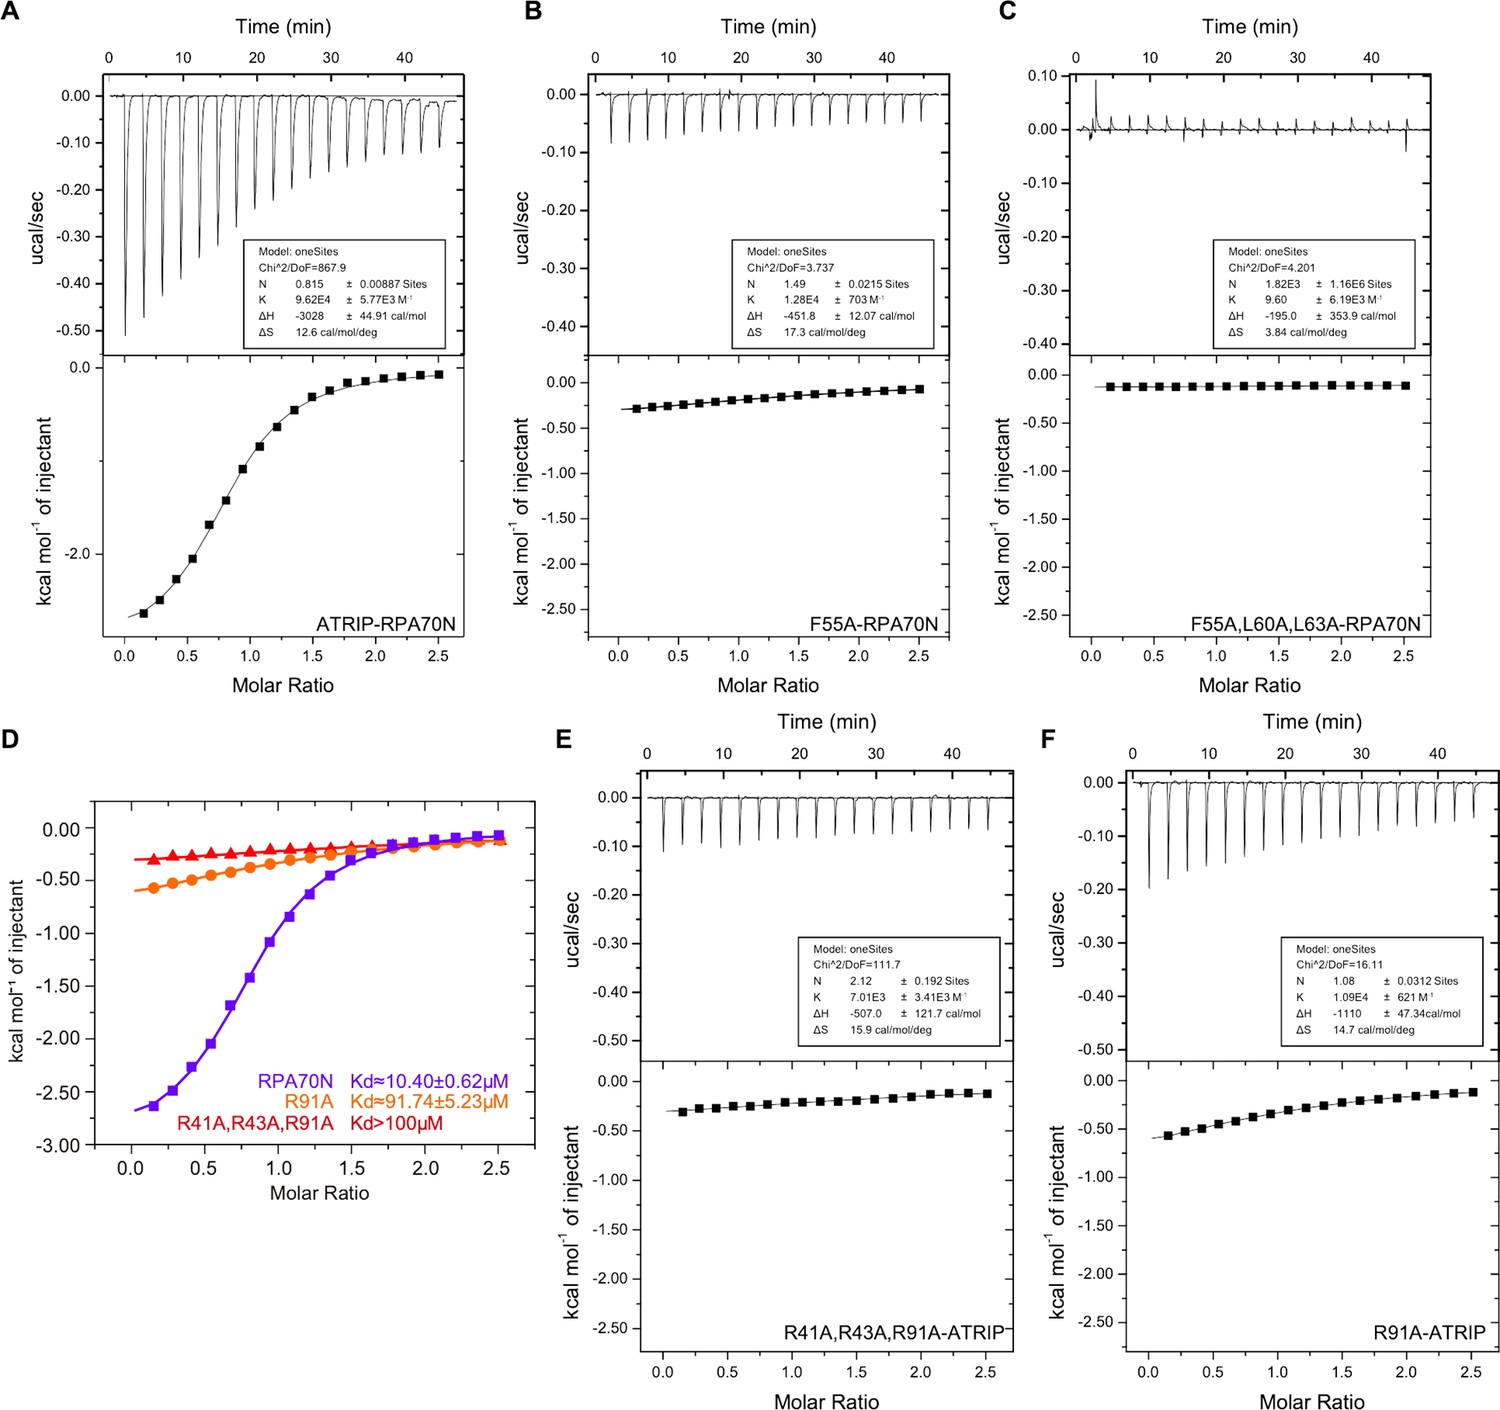
(A) Linear domain diagram of ATRIP, showing the position and sequence of the RPA70N-interacting motif. CC, coiled-coiled domain; ATR-BD, ATR binding domain. (B) Ribbon representation of the RPA70N–ATRIP crystal structure. The ATRIP peptide is colored in violet and RPA70N in light grey. Important interacting residues are shown as sticks, and green dashed lines indicate hydrogen bonds or salt bridges. (C) Alignment of the RPA70N–ATRIP structure with the Ddc2–Rfa1N structure (PDB: 5OMB), showing that ATRIP and Ddc2 bind to RPA70N in the same direction. RPA70N–ATRIP components are colored as in (B), Ddc2 is colored in green and Rfa1N is colored in blue. (D) Superposition of the RPA70N–ATRIP structure with that of the RPA70N-stapled peptide complex (PDB:4NB3). For 4NB3, RPA70N is colored in light-green and the stapled peptide is colored in marine. ZCL is 3,4-dichloro-substituted phenylalanine. The direction of the stapled peptide is reversed when compared to that of ATRIP. (E) ITC titration data for WT ATRIP (53–69 aa) and for F55A or F55A/L60A/L63A mutant peptides with RPA70N. (F, G) HeLa cells expressing ATRIP–EGFP, ATRIP (F55A)–EGFP, or ATRIP (F55A/L60A/L63A)–EGFP were treated with medium control (NT), CPT (2 μM, 2 h) or HU (2 mM, 3 h), fixed and immunostained with an anti-RPA32 antibody. The scale bar is 10 μm. The intensities of the fluorescent signals for ATRIP–EGFP, ATRIP (F55A)–EGFP or ATRIP (F55A/L60A/L63A)–EGFP and RPA32 are displayed on the right. (H, I and J) Quantification of data from (F) and (G), data are presented as mean ± s.d. of three independent experiments. 100 cells from each experiment were analyzed, and cells containing more than three bright ATRIP and RPA co-localization foci were defined as positive. Statistical analysis was performed using a two-tailed Student’s t-test (**** P<0.0001, *** P<0.001, ** P<0.01, * P<0.05). (K) Immunoprecipitation and western blots showed that mutation of ATRIP residues reduced RPA association. Anti-EGFP magnetic beads were used to carry out immunoprecipitations, which were followed by probing with an anti-RPA32 antibody. IP, immunoprecipitation; WCE, whole cell extract.
-
Figure 6—source data 1
Raw data for all of the western blots shown in Figure 6.
- https://cdn.elifesciences.org/articles/81639/elife-81639-fig6-data1-v1.zip
Figure 6—figure supplement 1
Characterization of the RPA70N–ATRIP interaction (related to Figure 6).
(A–C) ITC titration profiles of WT ATRIP peptide (53–69aa) (A), F55A mutant peptide (B) or F55A/L60A/L63A mutant peptide (C) with RPA70N. (D) ITC titration data for WT RPA70N (1–120aa), R91A or R41A/R43A/R91A mutant proteins with ATRIP peptide. (E–F) ITC titration profiles of the R41A/R43A/R91A mutant protein (E) and the PA70N R91A mutant protein (F) with ATRIP peptide.
Figure 7 with 1 supplement
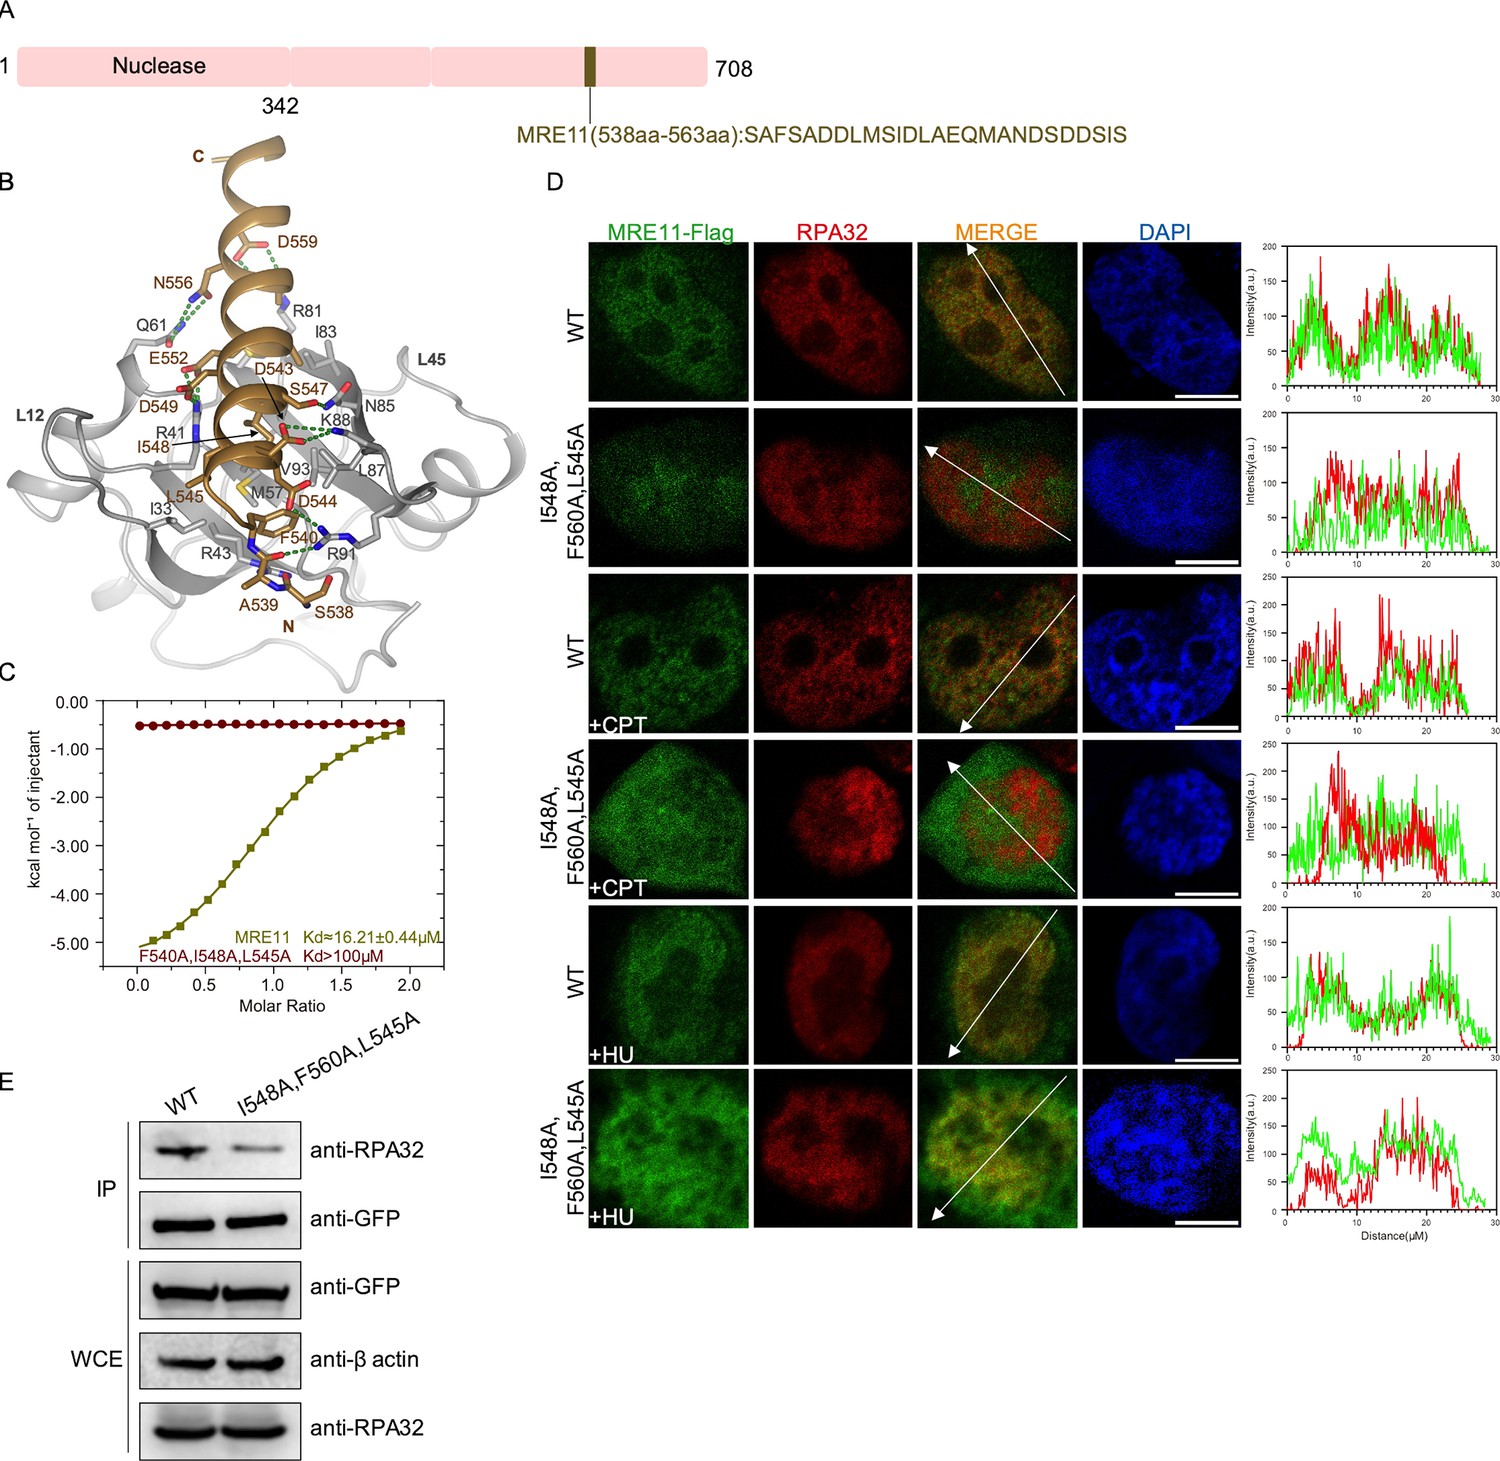
Structure of the RPA70N–MRE11 complex.
(A) Linear domain diagram of MRE11, showing the position and sequence of the RPA70N-interacting motif. (B) Ribbon representation of the RPA70N–MRE11 crystal structure. The MRE11 peptide is colored in brown and RPA70N in light grey. Interacting residues are shown as sticks, and green dashed lines indicate hydrogen bonds or salt bridges. (C) ITC titration data for WT MRE11 (538–563aa) or F540A/I548A/L545A mutant peptide with RPA70N. (D) HeLa cells expressing MRE11–Flag or MRE11–Flag (F540A/I548A/L545A) were treated with medium control, CPT (2 μM, 2 h) or HU (2 mM, 3 h), fixed and immunostained with anti-Flag and anti-RPA32 antibodies. The scale bar is 10 μm. The intensity of fluorescent signals for MRE11–Flag, MRE11–Flag (F540A/I548A/L545A) and RPA32 are displayed on the right. (E) Immunoprecipitation and western blot showed that mutation of MRE11 residues reduced RPA association. Anti-EGFP magnetic beads were used to carry out immunoprecipitations, which were followed by probing with an anti-RPA32 antibody. IP, immunoprecipitation; WCE, whole cell extract.
-
Figure 7—source data 1
Raw data for all of the western blots shown in Figure 7.
- https://cdn.elifesciences.org/articles/81639/elife-81639-fig7-data1-v1.zip
Figure 7—figure supplement 1
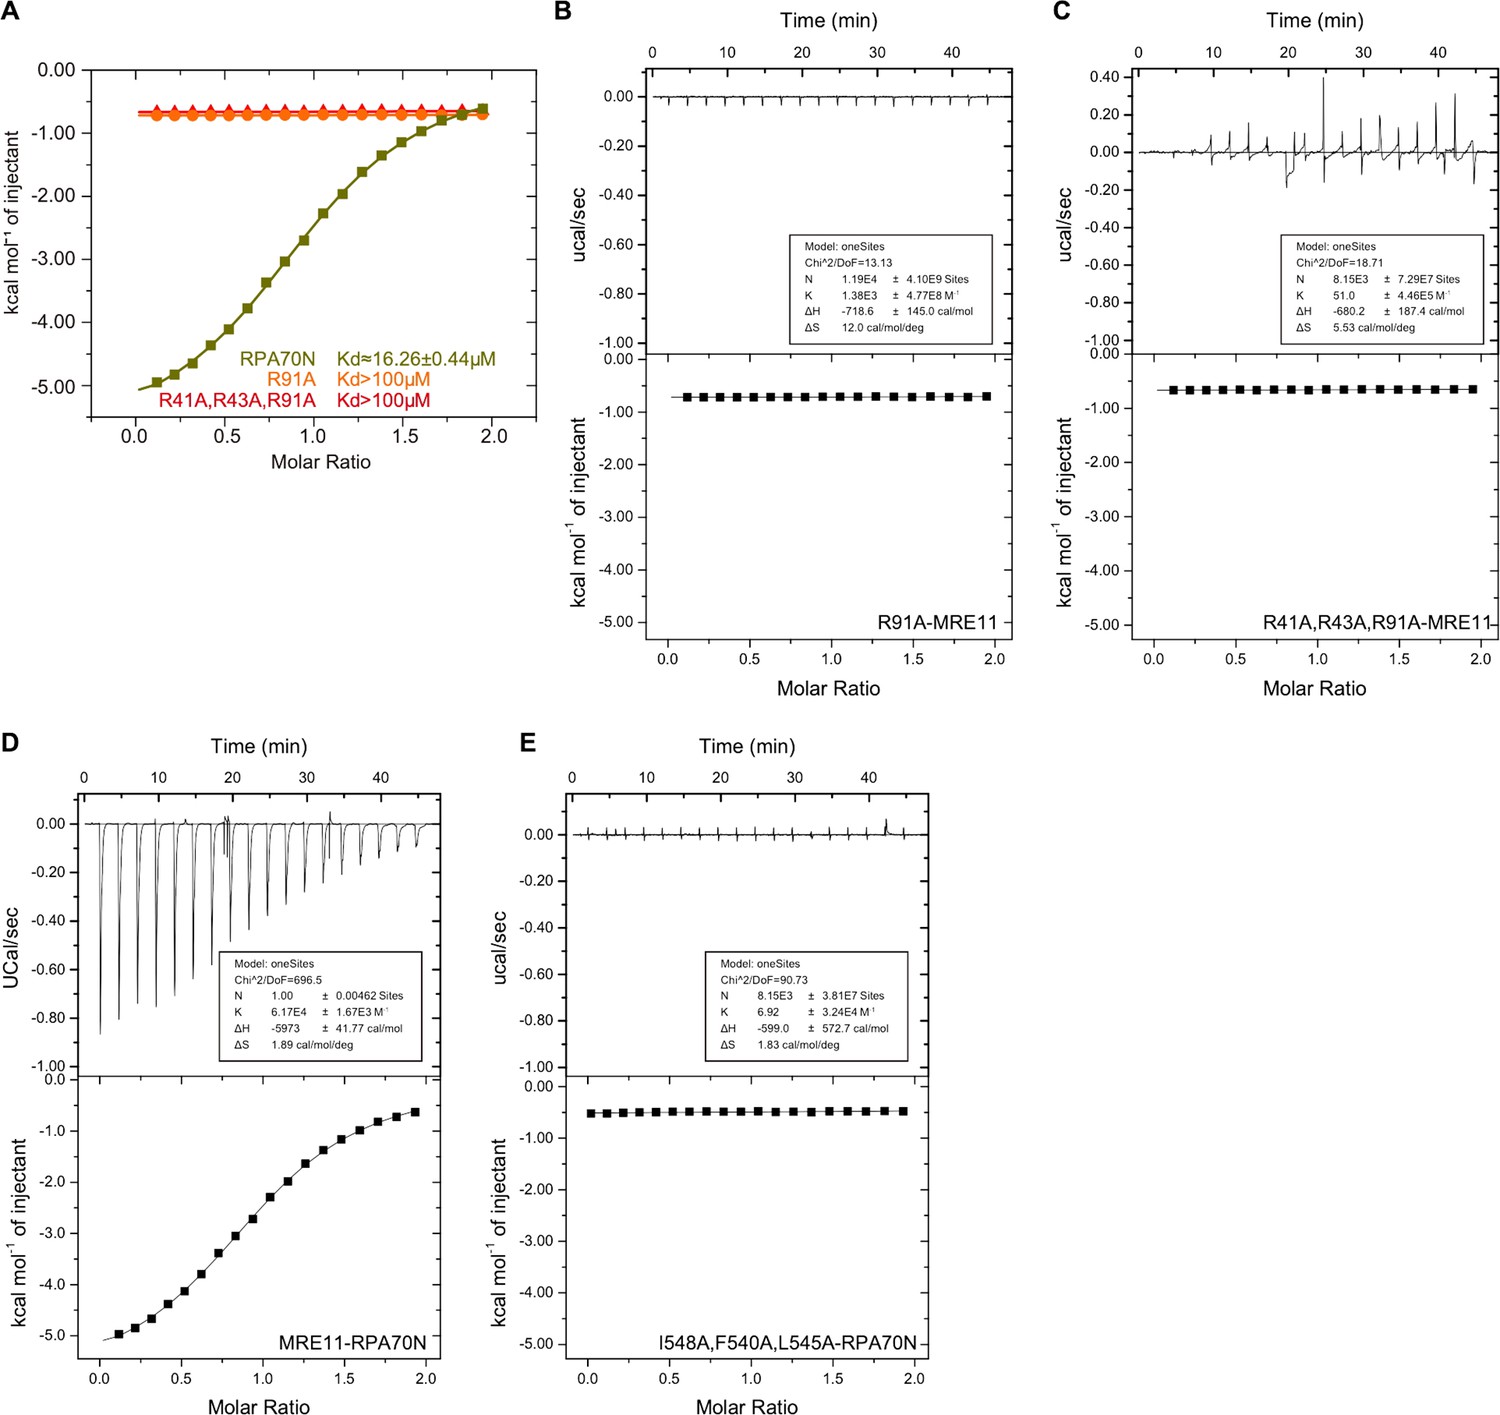
Characterization of the RPA70N–MRE11 interaction (related to Figure 7).
(A) ITC titration data for WT RPA70N (1–120aa) and R91A or R41A/R43A/R91A mutant proteins with MRE11 peptide (538–563aa). (B–C) ITC titration profiles of RPA70N R91A mutant protein (B) and R41A/R43A/R91A mutant protein (C) with MRE11 peptide. (D–E) ITC titration profiles of WT MRE11 peptide (D) or MRE11 I548A/F540A/L545A mutant peptide (E) with RPA70N.
Figure 8 with 1 supplement
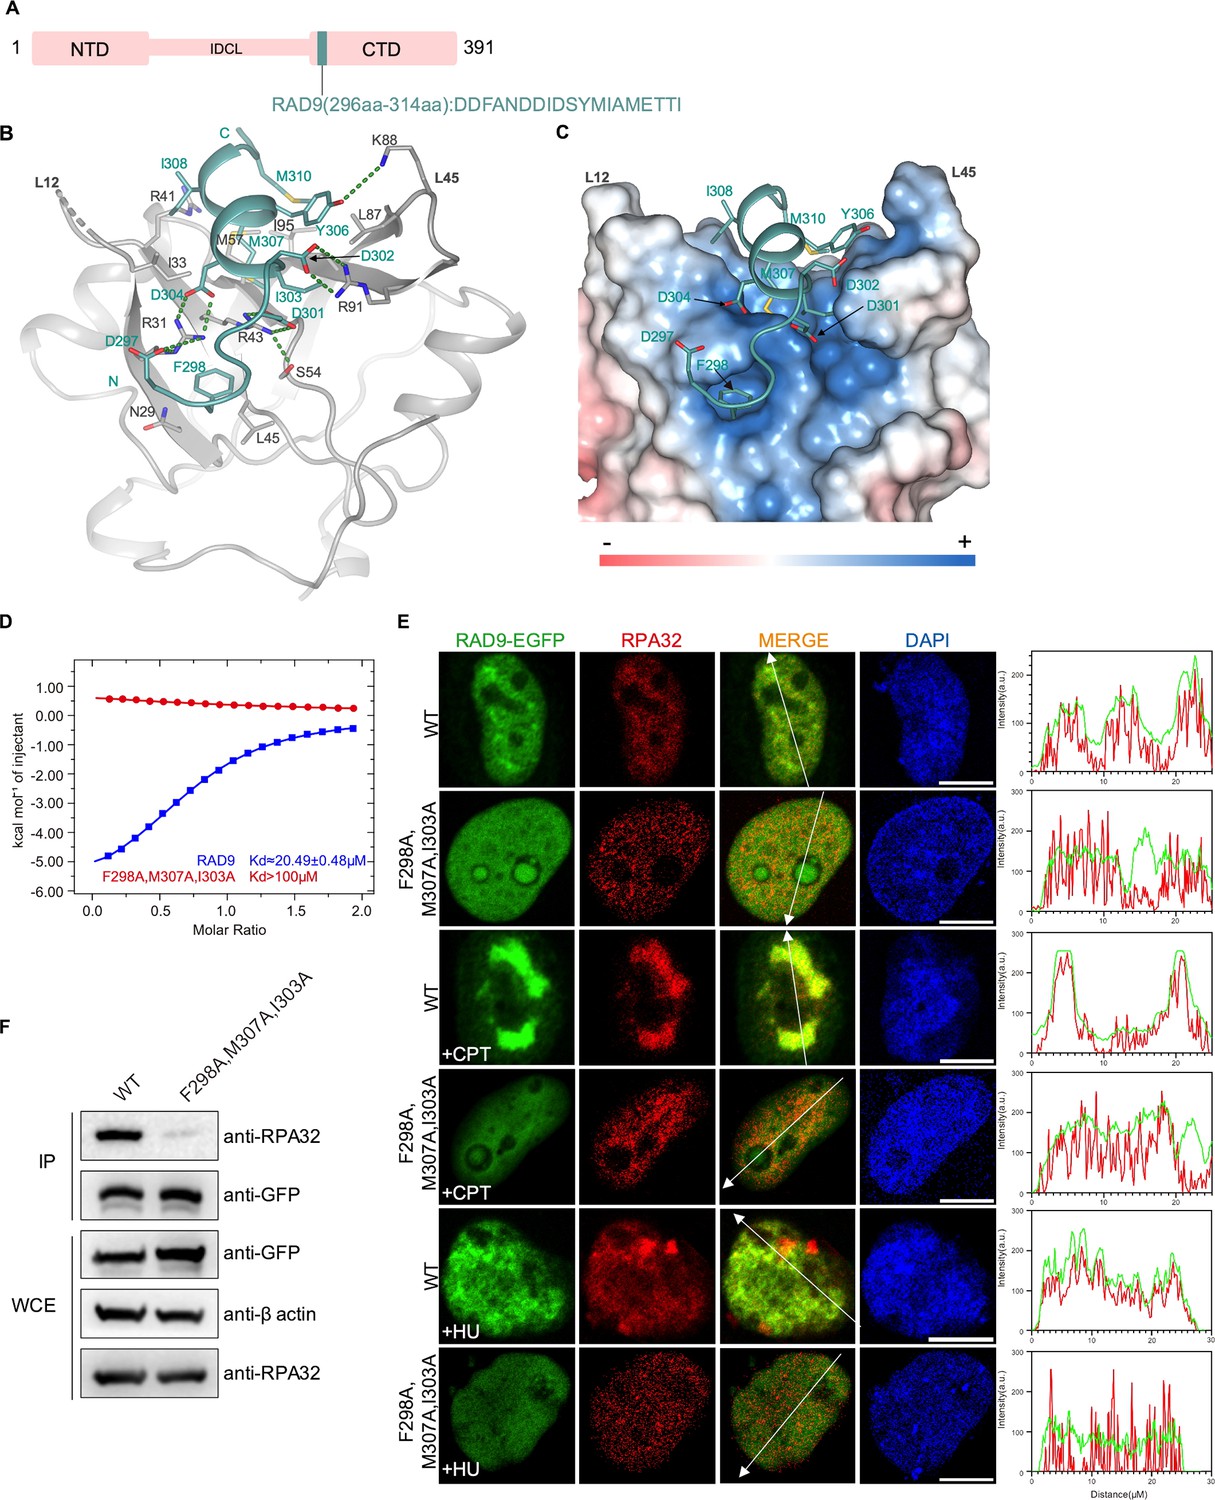
Structure of the RPA70N–RAD9 complex.
(A) Linear domain diagram of RAD9, showing the position and sequence of the RPA70N-interacting motif. IDCL, interdomain connecting loop. (B) Ribbon representation of the RPA70N–RAD9 crystal structure. The RAD9 peptide is colored in teal and RPA70N in light grey. Interacting residues are displayed as sticks, and green dashed lines indicate hydrogen bonds or salt bridges. (C) Structure of RPA70N in complex with RAD9, showing the surface charge of RPA70N. Hydrophobic and negatively charged residues of RAD9 are displayed as sticks, while the RAD9 peptide is colored in teal. F298 inserts into the side pocket. (D) ITC titration data for WT RAD9 (296–314aa) or F298A/M307A/I303A mutant peptide with RPA70N. (E) HeLa cells expressing RAD9–EGFP or RAD9 (F298A/M307A/I303A)–EGFP were treated with medium control, CPT (2 μM, 2 h) or HU (2 mM, 3 h), fixed and immunostained with an anti-RPA32 antibody. The scale bar is 10 μm. The intensities of fluorescent signals for RAD9–EGFP, RAD9 (F298A/M307A/I303A)–EGFP and RPA32 are displayed on the right. (F) Immunoprecipitation and western blots show that mutation of RAD9 residues reduced RPA association. Anti-EGFP magnetic beads were used to carry out immunoprecipitations, which were followed by probing with an anti-RPA32 antibody. IP, immunoprecipitation; WCE, whole cell extract.
-
Figure 8—source data 1
Raw data for all of the western blots shown in Figure 8.
- https://cdn.elifesciences.org/articles/81639/elife-81639-fig8-data1-v1.zip
Figure 8—figure supplement 1
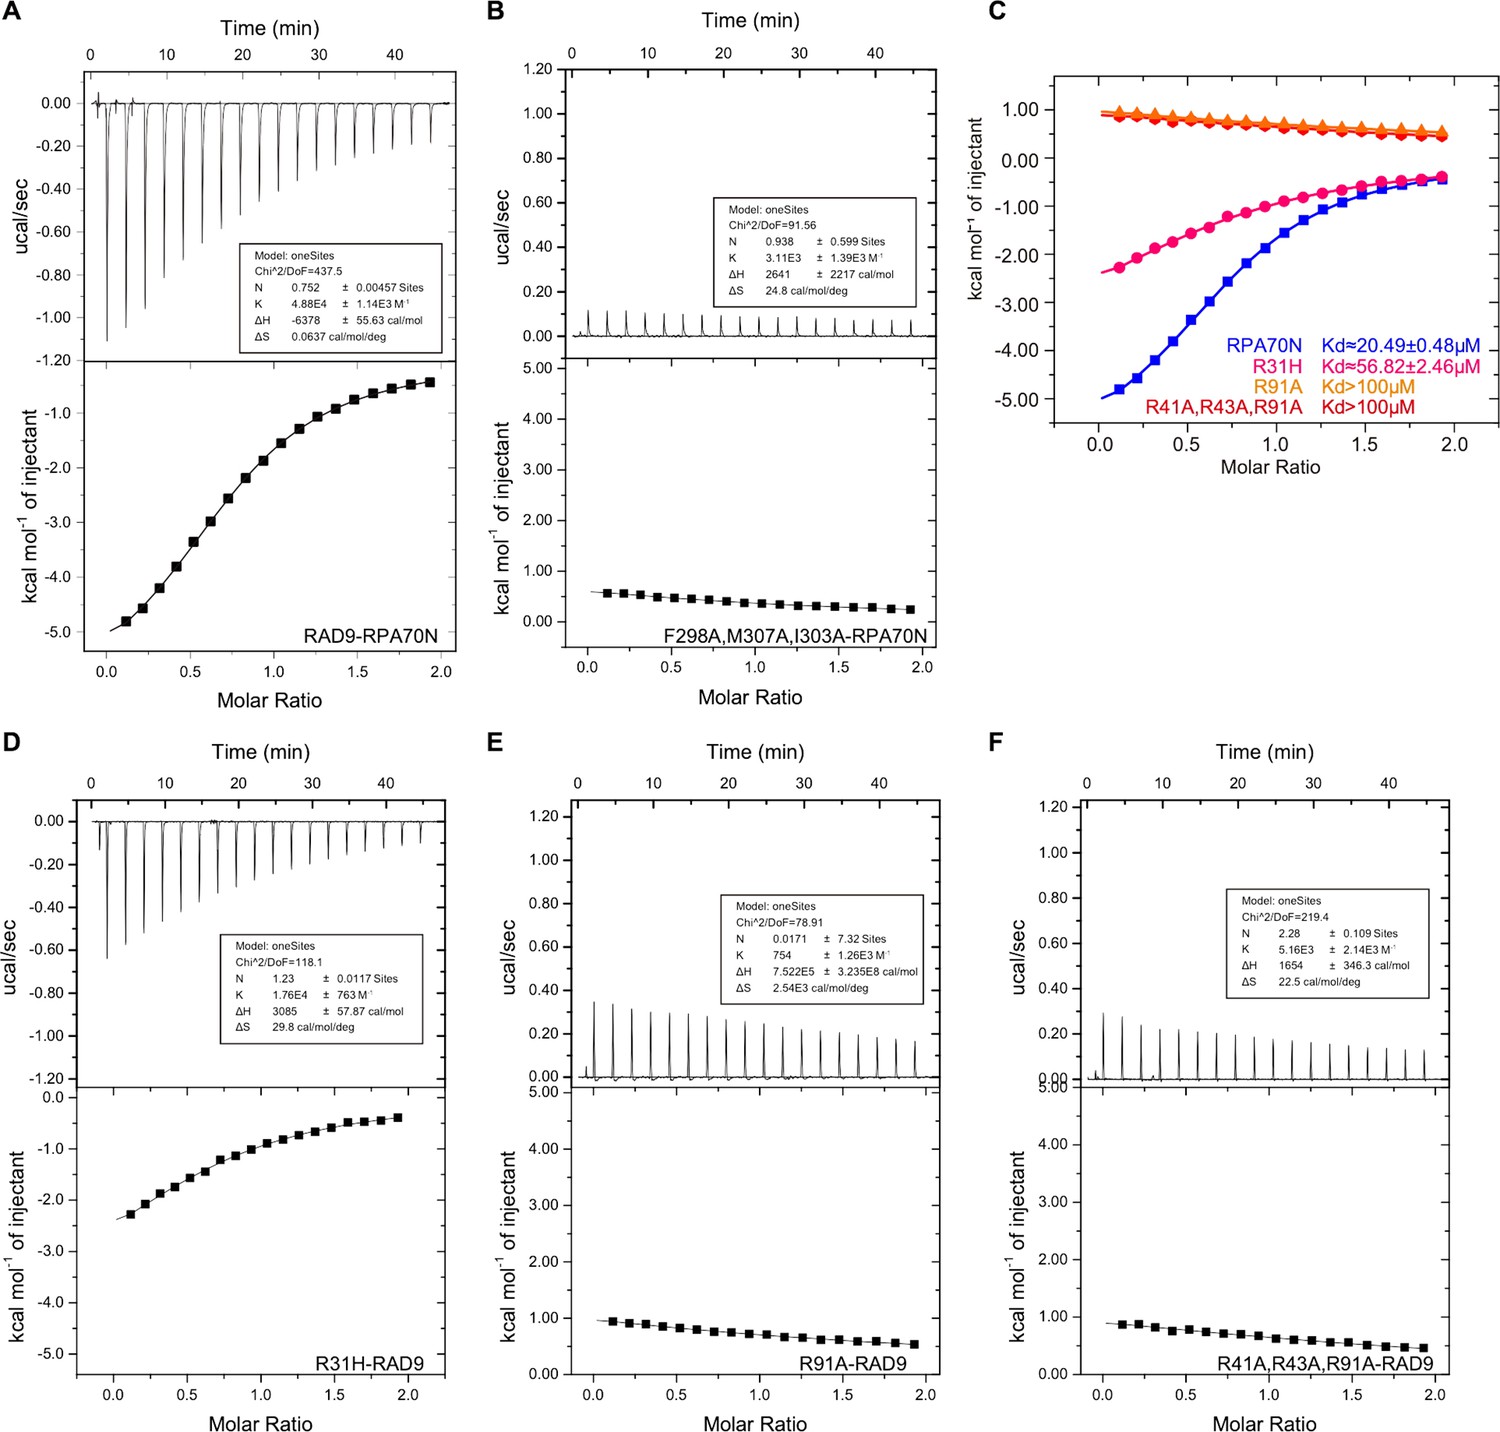
Characterization of the RPA70N–RAD9 interaction (related to Figure 8).
(A–B) ITC titration profiles of WT RAD9 (296–314aa) peptide (A) and F298A/M307A/I303A mutant peptide (B) with RPA70N. (C) ITC titration data for WT RPA70N (1–120aa) and for R31H, R91A or R41A/R43A/R91A mutant proteins with RAD9 peptide. (D–F) ITC titration profiles of RPA70N R31H mutant protein (D), R91A mutant protein (E) or R41A/R43A/R91A mutant protein (F) with RAD9 peptide.
Figure 9 with 1 supplement
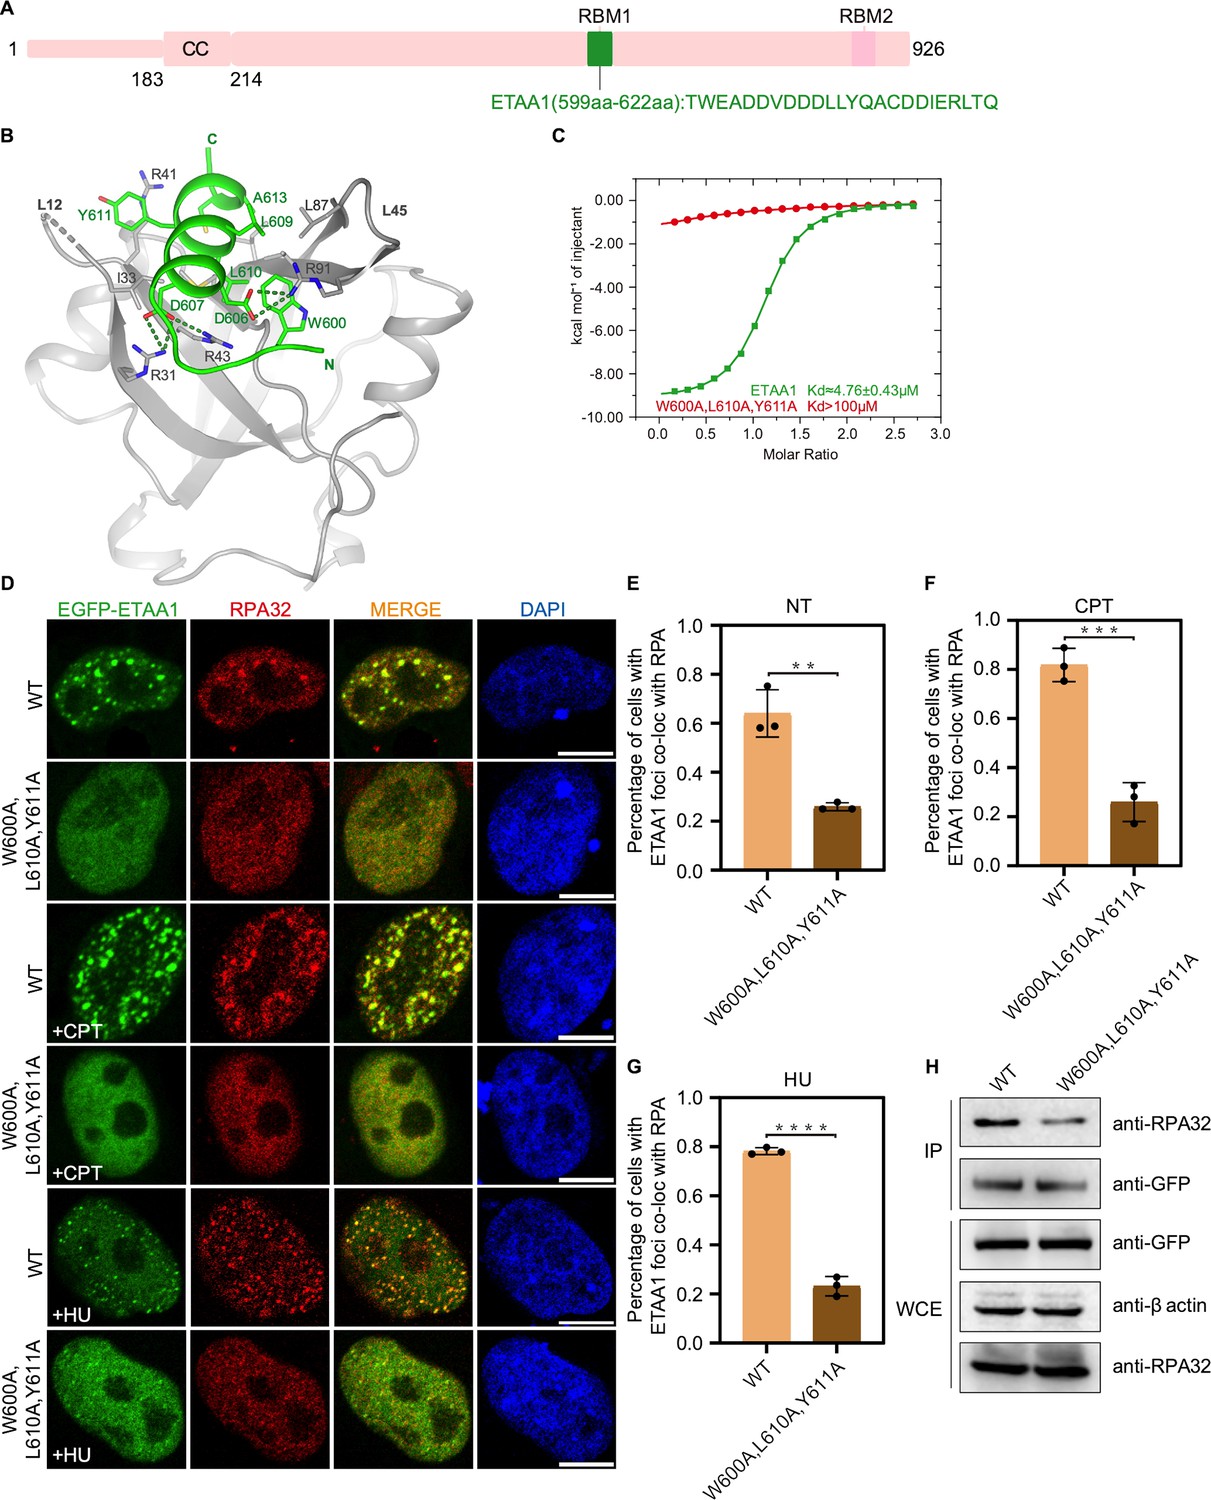
Structure of the RPA70N–ETAA1 complex.
(A) Linear domain diagram of ETAA1, showing the position and sequence of the RPA70N-interacting motif. ETAA1 has a coiled-coiled domain (CC) and two RPA-binding motifs (RBM1, RBM2). (B) Ribbon representation of the RPA70N–ETAA1 crystal structure. ETAA1 peptide is colored in bright green and RPA70N in light grey. Interface residues are shown as sticks, and green dashed lines indicate hydrogen bonds or salt bridges. (C) ITC titration data for the WT ETAA1 peptide (599–622 aa) or for the W600A/L610A/Y611A mutant peptide with RPA70N. (D) HeLa cells expressing EGFP–ETAA1 or EGFP–ETAA1(W600A/L610A/Y611A) were treated with medium control (NT), CPT (2 μM, 2 h) or HU (2 mM, 3 h), fixed and immunostained with an anti-RPA32 antibody. The scale bar is 10 μm. (E–G) Quantification of data from (D), data are presented as mean ± s.d. of three independent experiments. 100 cells from each experiment were analyzed, and cells containing more than three bright ETAA1 and RPA co-localization foci were defined as positive. Statistical analysis was performed using a two-tailed Student’s t-test (**** P<0.0001, *** P<0.001, ** P<0.01, * P<0.05). (H) Immunoprecipitation and western blotting showed that mutation of ETAA1 residues reduced RPA association. Anti-EGFP magnetic beads were used to carry out immunoprecipitations, which were followed by probing with an anti-RPA32 antibody. IP, immunoprecipitation; WCE, whole cell extract.
-
Figure 9—source data 1
Raw data for all of the western blots shown in Figure 9.
- https://cdn.elifesciences.org/articles/81639/elife-81639-fig9-data1-v1.zip
Figure 9—figure supplement 1
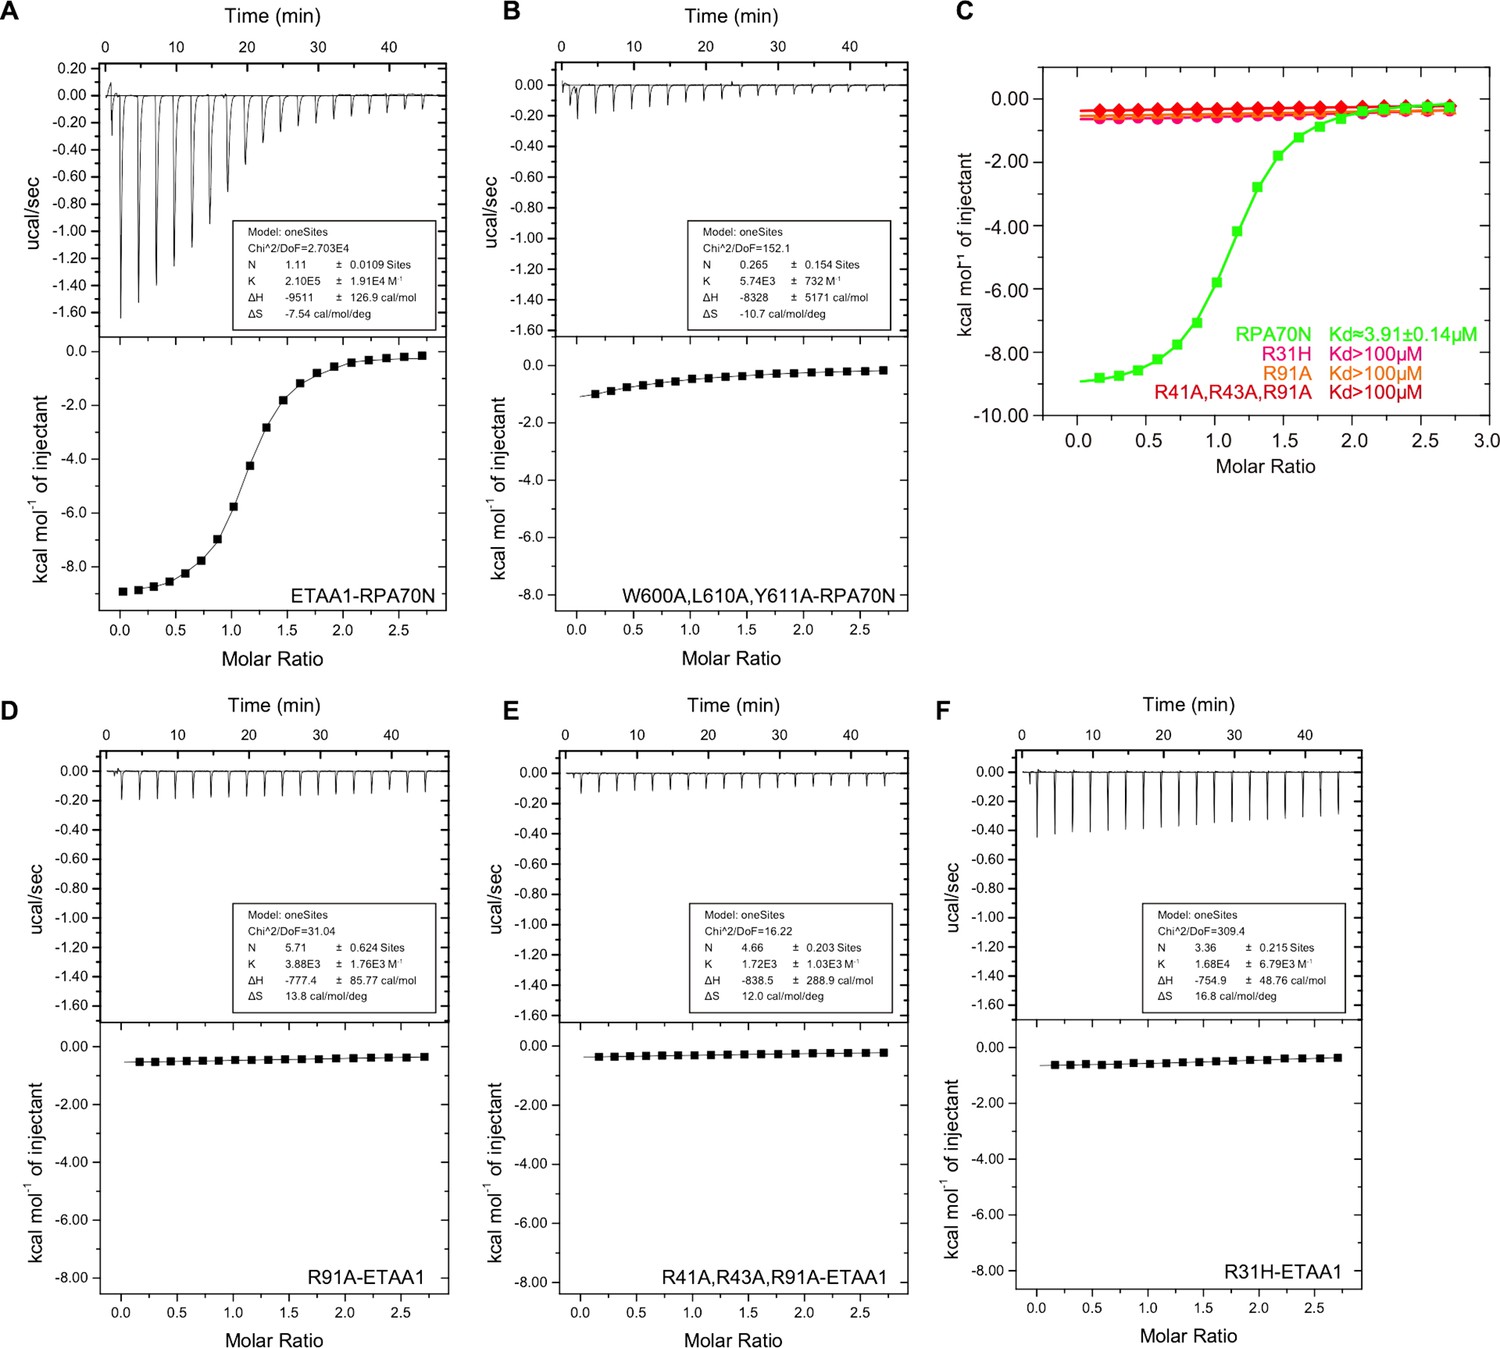
Characterization of the RPA70N–ETAA1 interaction (related to Figure 9).
(A–B) ITC titration profiles of the WT ETAA1 (599–622 aa) peptide (A) and the W600A/L610A/Y611A mutant peptide (B) with RPA70N. (C) ITC titration data for WT RPA70N (1-120aa) and for R31H, R91A or R41A/R43A/R91A mutant proteins with ETAA1 peptide. (D–F) ITC titration profiles of RPA70N R91A mutant protein (D), R41A/R43A/R91A mutant protein (E) or R31H mutant protein (F) with ETAA1 peptide.
Figure 10 with 1 supplement
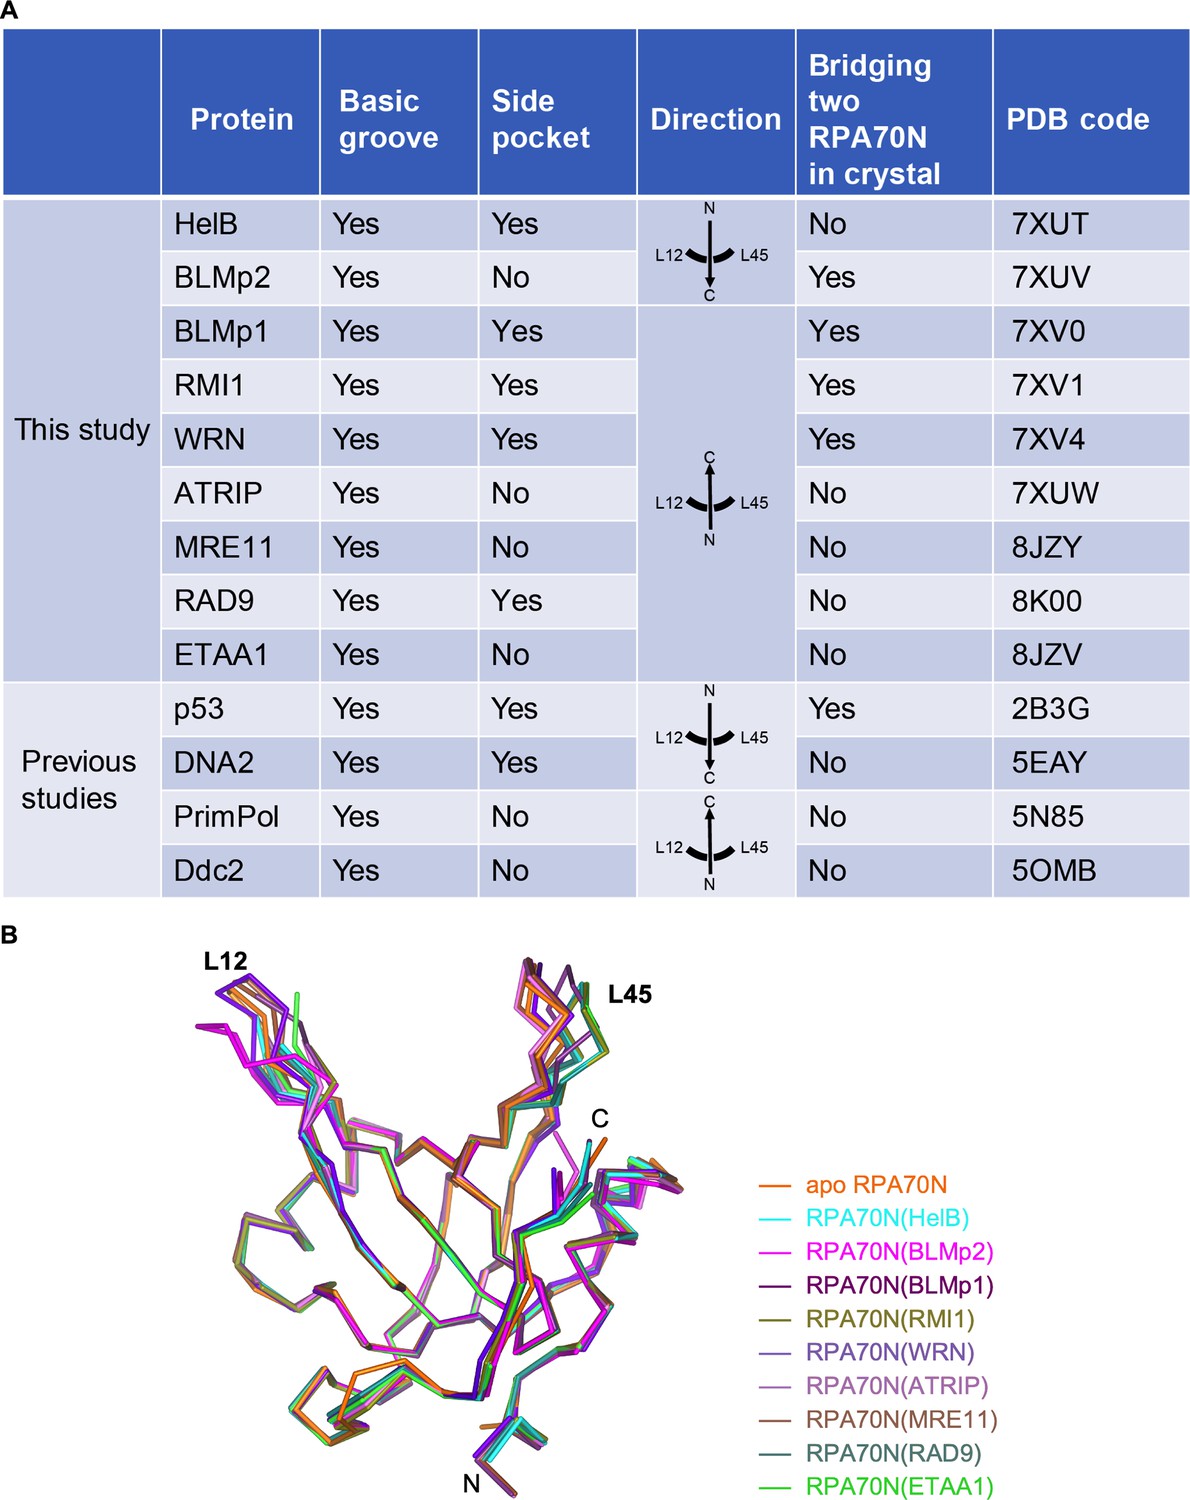
Comparison of RPA70N–peptide complex structures.
(A) Summary of the RPA70N-binding proteins for which RPA70N complex structures are available (Ddc2 binds to Rfa1N). (B) Superposition of apo RPA70N (orange, PDB: 2B29) with RPA70N structures determined in this study, colored using the peptide color code used in Figure 1F–N.
-
Figure 10—source data 1
Editable word file of Figure 10A.
- https://cdn.elifesciences.org/articles/81639/elife-81639-fig10-data1-v1.docx
Figure 10—figure supplement 1
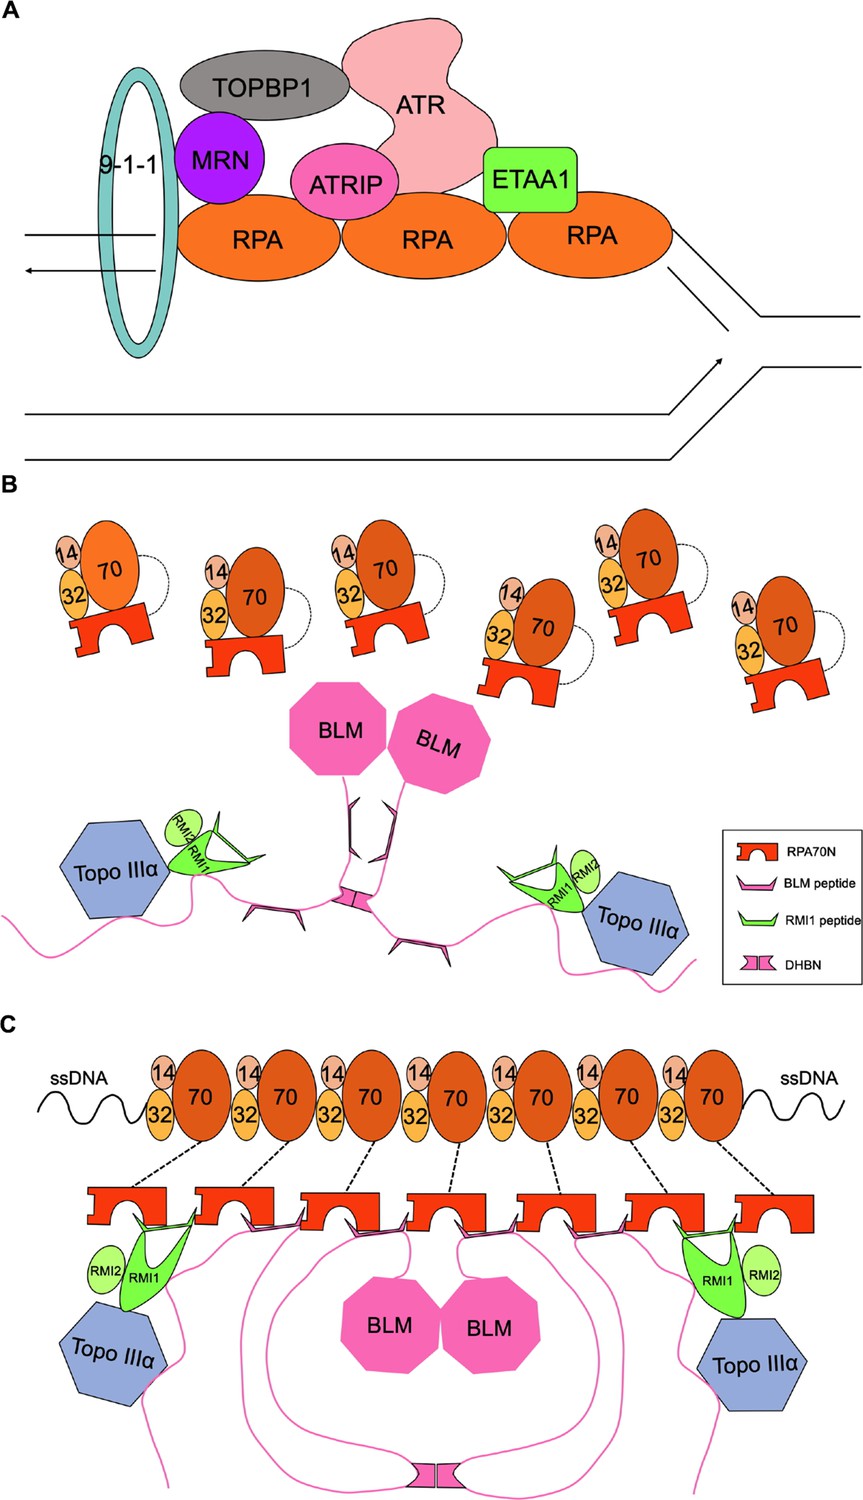
Model of protein recruitment in the RPA70N-mediated DNA damage response (related to Figure 10).
(A) A simplified model showing how exposed ssDNA attracts RPA molecules, which recruit many DNA damage response proteins including ATR/ATRIP, the 9-1-1 clamp, MRN, ETAA1 and TOPBP1 to the stalled replication fork. (B) Without ssDNA, RPA molecules are not associated with the dimeric BTR complex because of the relatively weak affinity between RPA70N and the interacting sequences in the BTR complex. (C) Multiple RPA molecules nucleate on ssDNA, the increased avidity of RPA70N promotes BTR peptides to bind, and some bound peptides in turn promote RPA70N association by interacting with two RPA70N molecules simultaneously.
Tables
Key resources table
| Reagent type (species) or resource | Designation | Source or reference | Identifiers | Additional information |
|---|---|---|---|---|
| Strain, strain background (Escherichia coli) | Rosetta 2(DE3) chemically competent cell | Novagen | 71402 | |
| Strain, strain background (E. coli) | E. coli BL21(DE3) cells | Novagen | 69450 | |
| Strain, strain background (E. coli) | Trelief 5α chemically competent cell | TSINGKE | TSC-C01-100 | |
| Cell line (Homo sapiens) | HEK293T | ATCC | CRL-3216 | Authenticated by STR profiling, no mycoplasma contamination |
| Cell line (H. sapiens) | HeLa | Cell bank of the Chinese Academy of Sciences | SCSP-504 | Authenticated by STR profiling, no mycoplasma contamination |
| Antibody | Anti-GFP rabbit monoclonal antibody | Beyotime | AF1483 | WB (1:5000) |
| Antibody | Anti-RPA32 rabbit monoclonal antibody | Beyotime | AG3115 | WB (1:2000), IF (1:50) |
| Antibody | Anti-β-actin mouse monoclonal antibody | Proteintech | 66009–1-Ig | WB (1:5000) |
| Antibody | Anti-flag tag mouse monoclonal antibody | Beyotime | AF2852 | IF (1:50) |
| Antibody | Horseradish peroxidase labelled goat anti-mouse polyclonal secondary antibody | Beyotime | A0216 | WB (1:5000) |
| Antibody | Horseradish peroxidase labelled goat anti-rabbit polyclonal secondary antibody | Beyotime | A0208 | WB (1:5000) |
| Antibody | Alexa 568 goat anti-rabbit polyclonal antibody IgG (H+L) cross-adsorbed secondary antibody | Thermo Fisher Scientific | A-11036 | IF (1:400) |
| Antibody | Alexa 488 goat anti-mouse polyclonal antibody IgG (H+L) cross-adsorbed secondary antibody | Thermo Fisher Scientific | A32723 | IF (1:400) |
| Recombinant DNA reagent | pcDNA3.1(+) | Invitrogen | V79020 | |
| Recombinant DNA reagent | pRSFDuet-1 vector | Novagen | 71341 | |
| Commercial assay or kit | ClonExpress II One Step Cloning Kit | Vazyme | C112-01/02 | |
| Chemical compound, drug | Hydroxyurea | Beyotime | Cat#S1961 | |
| Chemical compound, drug | (S)-(+)-Camptothecin, 98% | J&K | Cat#7689-03-4 | |
| Chemical compound, drug | 2-(4-Amidinophenyl)–6-indolecarbamidine dihydrochloride | Beyotime | C1006 | DAPI staining solution used to stain nucleus |
Additional files
Download links
A two-part list of links to download the article, or parts of the article, in various formats.
Downloads (link to download the article as PDF)
Open citations (links to open the citations from this article in various online reference manager services)
Cite this article (links to download the citations from this article in formats compatible with various reference manager tools)
Structural characterization of human RPA70N association with DNA damage response proteins
eLife 12:e81639.
https://doi.org/10.7554/eLife.81639


