A toxin-antidote selfish element increases fitness of its host
- School of Biological Sciences, Georgia Institute of Technology, United States
- Interdisciplinary Graduate Program in Quantitative Biosciences, Georgia Institute of Technology, United States
- School of Physics, Georgia Institute of Technology, United States
Figures
Figure 1 with 1 supplement
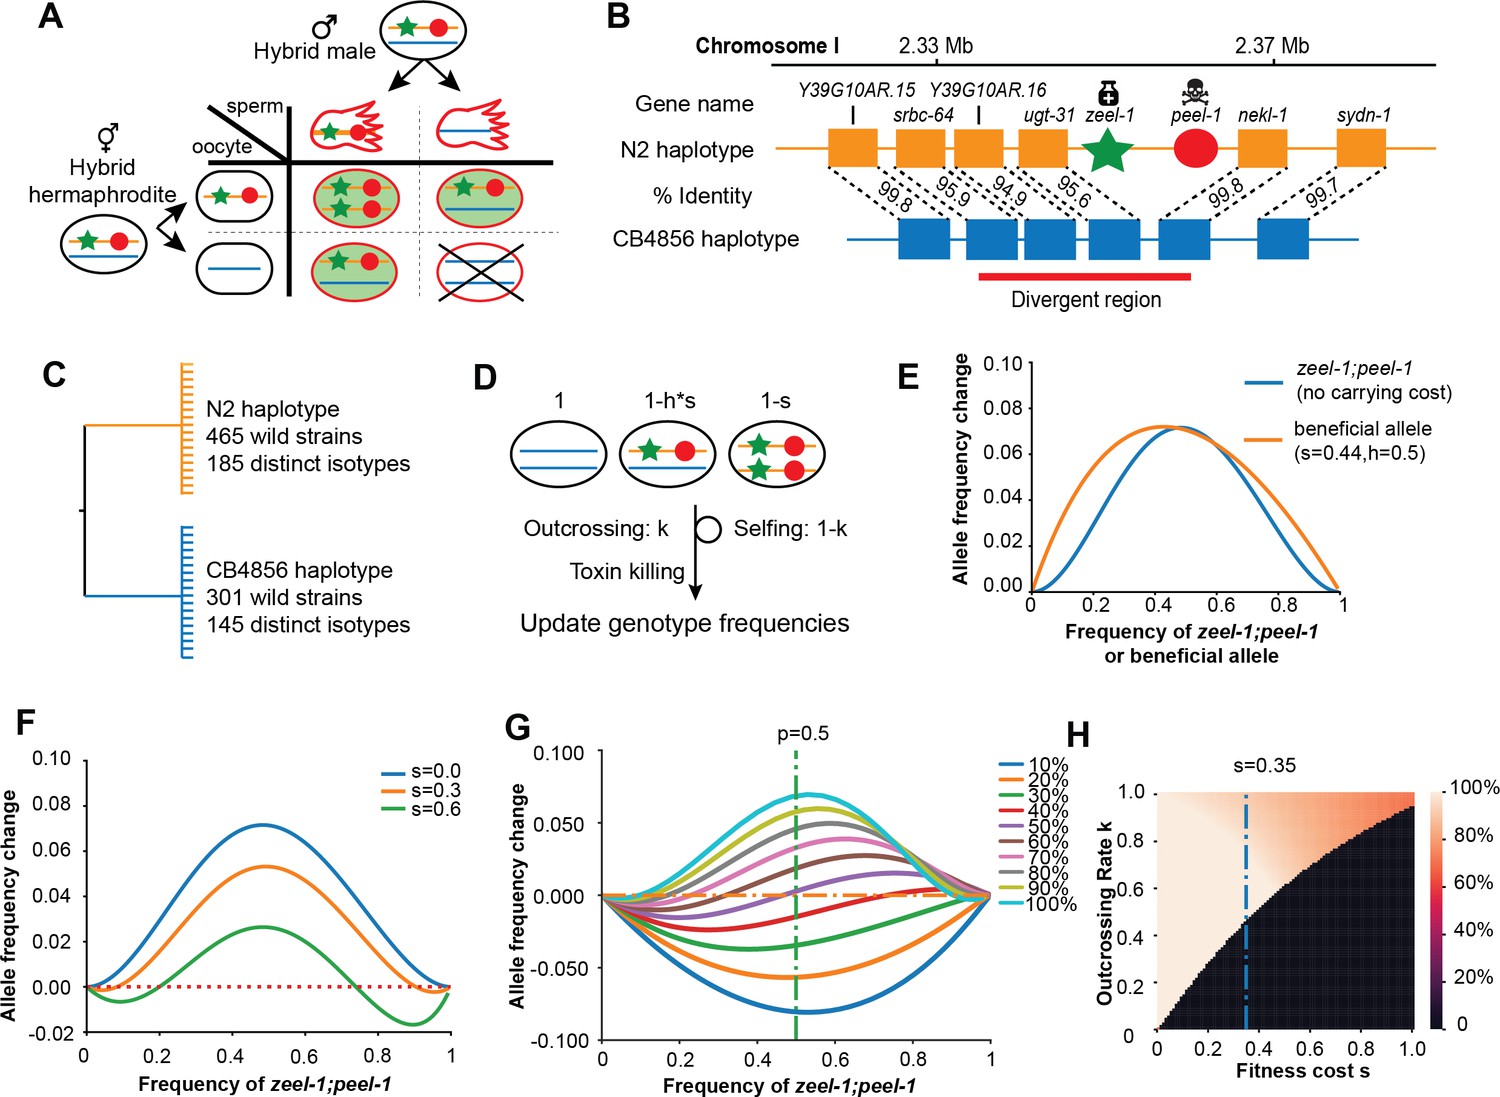
Description and models of selection for zeel-1;peel-1.
(A) Schematic of the progenies created from an F1 hybrid cross, produced through intercrossing. Red outline indicates cytoplasmic inheritance of the PEEL-1 toxin from the hybrid male, independent of genomic inheritance of peel-1 (red circle) or zeel-1 (green star), which counteracts the toxin by zygotic expression (green background). Progeny that die are indicated by the X cross. (B) Schematic of the genomic region surrounding zeel-1;peel-1 for two major haplotypes, N2 and CB4856. zeel-1;peel-1 is present in the N2 genome and deleted in the CB4856 genome. Amino acid identities of each gene are shown between the two haplotypes. The red bar denotes the hyperdivergent region starting in the 5′ end of srbc-64 and ending in the beginning of nekl-1. (C) A gene tree representation of the zeel-1;peel-1 locus from wild strains of C. elegans using the hyperdivergent region (based on Seidel et al., 2008). Two major branches distinguish the N2 and CB4856 haplotypes; the number of wild isolates and distinct isotypes are labeled on each branch. This distribution is consistent with balancing selection acting on each haplotype. (D) Schematic of the simulation of zeel-1;peel-1 population dynamics. The fitness of each genotype is shown on top. Genotype frequencies are updated each generation using Table 1. (E) The allele frequency change per generation (y-axis) of zeel-1;peel-1 (s = 0, k = 1, blue curve) or a beneficial allele (s = 0.44, h = 0.5) as a function of allele frequency (x-axis). (F) The change in allele frequency per generation (y-axis) of zeel-1;peel-1 with three different carrying costs (s = 0, s = 0.3, and s = 0.6), as a function of allele frequency (x-axis). (G) The change in allele frequency per generation (y-axis) of zeel-1;peel-1 with a fixed fitness cost (s = 0.35, h = 0.5) at different rates of outcrossing, as a function of allele frequency (x-axis). (H) Heatmap showing the zeel-1;peel-1 frequency after 1000 generations, over varying outcrossing rates (y-axis) and carrying costs (x-axis). Initial frequency of the element was 50%. Black indicates animals that have lost the element.
-
Figure 1—source data 1
Excel file containing source data for Figure 1.
- https://cdn.elifesciences.org/articles/81640/elife-81640-fig1-data1-v2.xlsx
Figure 1—figure supplement 1

Heatmap of zeel-1;peel-1 frequency after 100 generations.
The x-axis shows carrying costs and the y-axis shows outcrossing rates over a range typical of C. elegans in nature. Initial frequency was 50%.
Figure 2
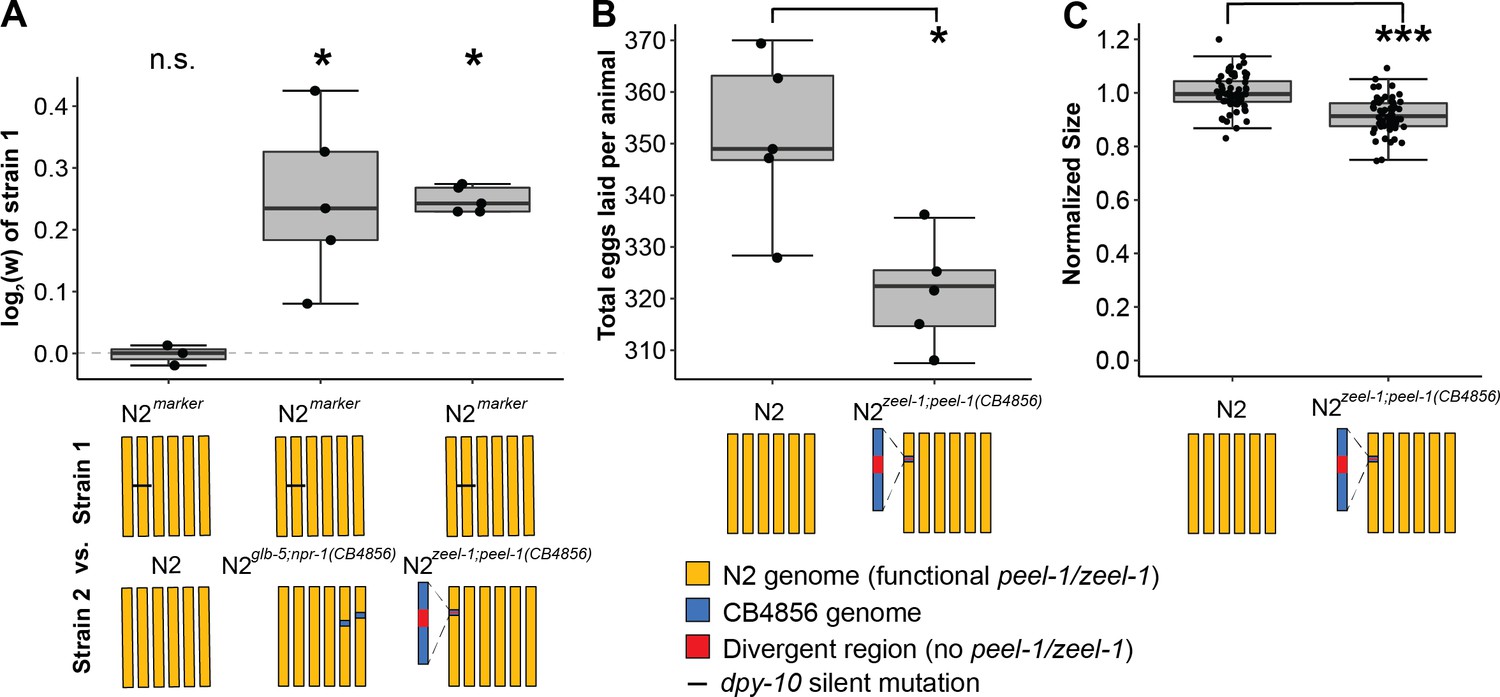
zeel-1;peel-1 is linked to genetic variation that increases fitness in the host genotype in laboratory conditions.
(A) Relative fitness of experimental genotypes competed against N2marker, which has a silent mutation in dpy-10 used as a barcode for digital PCR. This mutation exhibits no fitness effect as there was no significant difference in the competition between N2marker and N2. N2marker, which has the zeel-1;peel-1 element native to N2, outcompeted N2zeel-1;peel-1(CB4856), which has an ~140–370 kb interval spanning the zeel-1;peel-1 locus from CB4856 introgressed into N2 (Ben-David et al., 2017). The relative fitness of N2marker over N2zeel-1;peel-1(CB4856) (w = 1.18, 1.15–1.21, 95% CI) is similar to its relative fitness over N2glb-5;npr-1(CB4856) (w = 1.19, 1.10–1.28, 95% CI), which was used as a positive control. N2glb-5;npr-1(CB4856) carries introgressed CB4856 alleles at npr-1 and glb-5 that were previously shown to decrease fitness relative to N2 alleles in laboratory conditions (McGrath et al., 2009). The N2 vs. N2marker and N2 marker vs. N2zeel-1;peel-1(CB4856) are identical to the data in Figure 3E as the competition were done (McGrath et al., 2009) in parallel. (B) Fecundity of N2 and N2zeel-1;peel-1(CB4856). (C) Growth/size analysis of N2 and N2zeel-1;peel-1(CB4856). The body size of young adult animals was measured at 72 hr and normalized to the average size of N2. The N2 data for (B) and (C) is identical to the data in Figure 3C and D, as all three strains were analyzed on the same day. Box plots show the central 50% of the dataset and the whiskers indicate 1.5× of the interquartile range; ***p<0.001 and *p<0.05 by non-parametric analysis with correction for multiple tests (see ‘Methods’).
-
Figure 2—source data 1
Excel file containing source data for Figure 2.
- https://cdn.elifesciences.org/articles/81640/elife-81640-fig2-data1-v2.xlsx
Figure 3
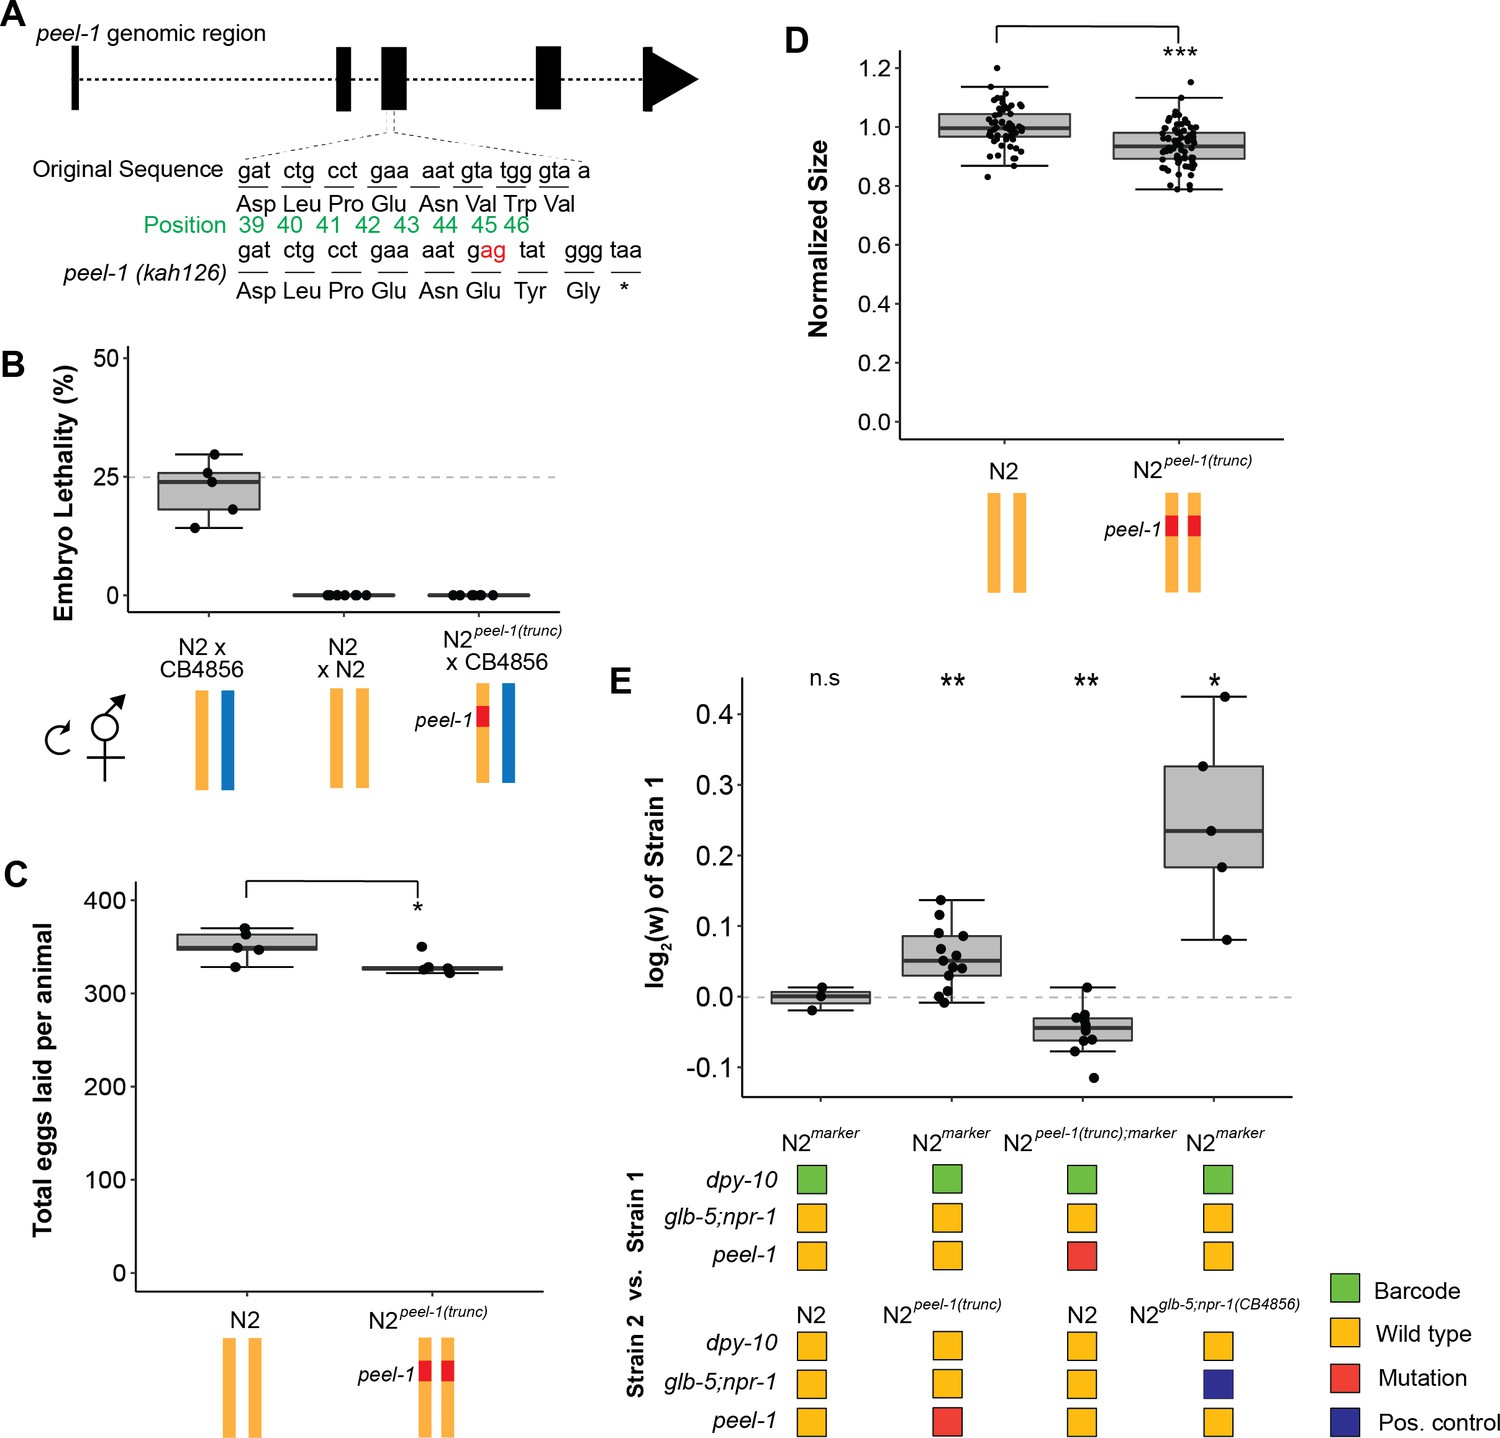
Tests of peel-1 function using CRISPR/Cas9 show the active peel-1 allele increases fitness.
(A) Schematic of the peel-1 loss-of-function allele, N2peel-1(trunc). At peel-1, two additional nucleotides (marked in red) inserted into the third exon generate a frameshift and an early stop codon (marked by *). The green numbers denote the amino acid position of the PEEL-1 protein sequence. (B) N2peel-1(trunc) has lost peel-1 function, as selfed cross-progeny show. As expected, N2 × CB4856 produce ~25% embryonic lethality (p=0.44 compared to null expectation of 25%), and N2 × N2 produce zero dead embryos. N2peel-1(trunc) × CB4856 also produce zero dead embryos, indicating loss of toxicity. (C) Fecundity of the N2 and N2peel-1(trunc) strains. (D) Growth/size analysis of N2 and N2peel-1(trunc). The body size of young adult animals was measured at 72 hr and normalized to the average size of N2. For (B–D), yellow represents the N2 genome, blue represents the CB4856 genome, and red represents the truncated allele of peel-1 on chromosome I. The N2 data for (C) and (D) is identical to the data in Figure 2B and C, as all three strains were analyzed on the same day. (E) Competition assays between strains in standard laboratory conditions; positive values indicate strain 1 is more fit and negative values indicate strain 2 is more fit. Competition between the wild-type N2 peel-1 allele and the peel-1 loss-of-function mutation indicate a fitness benefit for peel-1 (in assays with the marker in both backgrounds), which accounts for 32% of the difference arising from the relative fitness of the CB4856 introgression of zeel-1;peel-1. The N2 vs. N2marker and N2 marker vs. N2zeel-1;peel-1(CB4856) are identical to the data in Figure 2A as the competition were done in parallel. The relative fitness of N2glb-5;npr-1 (CB4856) over N2marker is shown as a positive control. Box plots show the central 50% of the dataset and the whiskers indicate 1.5× of the interquartile range; ***p<0.001, **p<0.01, and *p<0.05 by non-parametric analysis with correction for multiple tests (see ‘Methods’).
-
Figure 3—source data 1
Excel file containing source data for Figure 3.
- https://cdn.elifesciences.org/articles/81640/elife-81640-fig3-data1-v2.xlsx
Figure 4
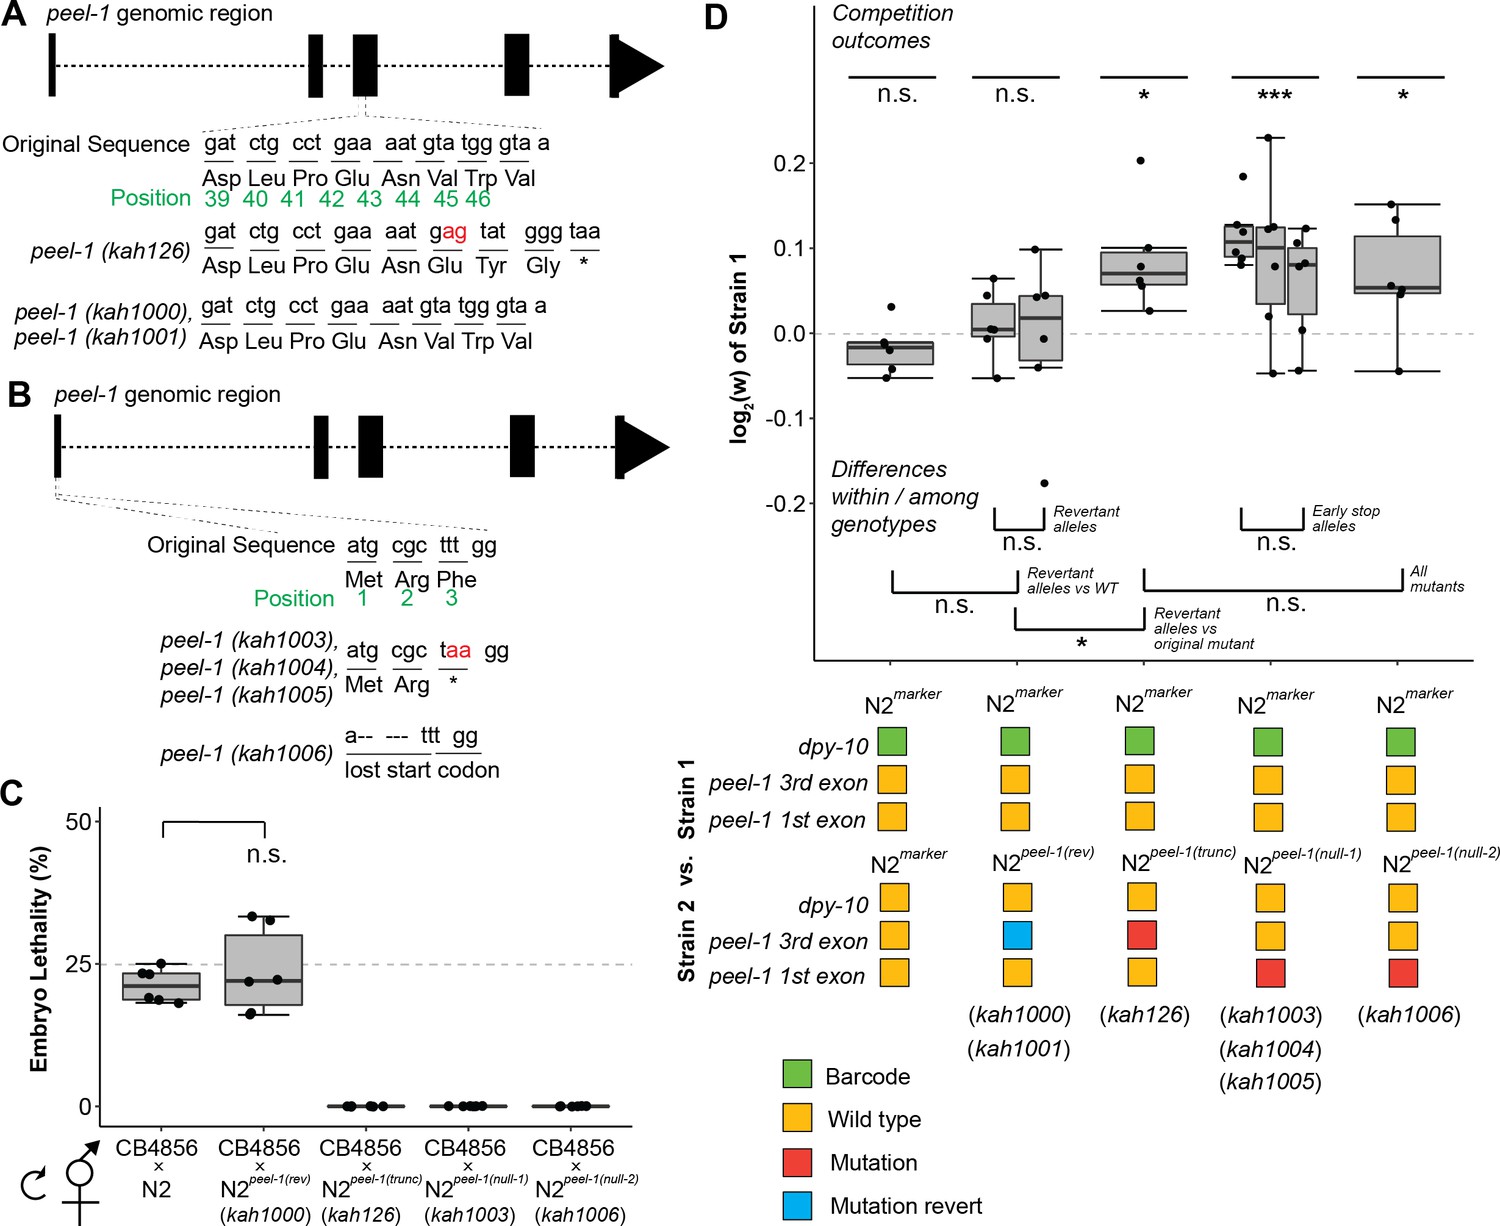
Additional peel-1 alleles phenocopy the peel-1 fitness effects.
(A) Two independently derived peel-1 revertant alleles (kah1000, kah1001) restore the original peel-1 mutation (kah126) to wild-type. (B) Three independently derived peel-1 alleles (kah1003, kah1004, kah1005) introduce an early stop in the third codon of the first exon; a 5 bp deletion in the first exon eliminates the start codon (kah1006). (C) Following crosses to CB4856, the progeny of selfed F1s confirm the expected toxin activity for these alleles: the kah1000 revertant allele restores wild-type toxin activity, as N2peel-1 (rev) selfed cross-progeny show ~25% lethality, similar to N2 (p=0.56, p=0.12, respectively, compared to null expectation of 25%); the kah1003 and kah1006 loss-of-function alleles eliminate toxin activity, as selfed cross-progeny from N2peel-1(null-1) and N2peel-1(null-2) produce zero dead embryos, the same as N2peel-1(trunc) carrying the original kah126 allele. (D) Strains carrying the revertant alleles (N2peel-1 (rev)) show no fitness difference relative to the wild-type control but do show a fitness advantage relative to the original mutant with the truncated peel-1 allele (N2peel-1(trunc)), suggesting that the reversion edits restored peel-1 function. Strains carrying the new peel-1 null alleles (N2peel-1(null-1), N2peel-1(null-2)) show a fitness disadvantage equivalent to the original mutant, N2peel-1(trunc), suggesting that all three mutant allele classes eliminate peel-1 activity. Box plots show the central 50% of the dataset and the whiskers indicate 1.5× of the interquartile range; ***p<0.001, **p<0.01, and *p<0.05 by non-parametric analysis with correction for multiple tests (see ‘Methods’).
-
Figure 4—source data 1
Excel file containing source data for Figure 4.
- https://cdn.elifesciences.org/articles/81640/elife-81640-fig4-data1-v2.xlsx
Tables
Table 1
A family-based model for the zeel-1;peel-1 evolution dynamics.
| Family | Mating types | Frequency | Female fitness | Offspring genotype | |||
|---|---|---|---|---|---|---|---|
| Sire | Dam | PP | P+ | ++ | |||
| 1 | PP | PP | XppXppk | 1-s | 1 | ||
| 2 | P+ | PP | Xp+Xppk | 1-s | 0.5 | 0.5 | |
| 3 | ++ | PP | X++Xppk | 1-s | 1 | ||
| 4 | PP | P+ | XppXp+k | 1-hs | 0.5 | 0.5 | |
| 5 | P+ | P+ | Xp+Xp+k | 1-hs | 0.25 | 0.5 | 0.25(1-t) |
| 6 | ++ | P+ | X++Xp+k | 1-hs | 0.5 | 0.5 | |
| 7 | PP | ++ | XppX++k | 1 | 1 | ||
| 8 | P+ | ++ | Xp+X++k | 1 | 0.5 | 0.5(1-t) | |
| 9 | ++ | ++ | X++X++k | 1 | 1 | ||
| 10 | PP selfing | Xpp(1-k) | 1-s | 1 | |||
| 11 | P+selfing | Xp+(1-k) | 1-hs | 0.25 | 0.5 | 0.25(1-t) | |
| 12 | ++selfing | X++(1-k) | 1 | 1 | |||
-
Parameter X denotes the ratio of a certain genotype in a population. Genotype P denotes zeel-1;peel-1 and +denotes ‘no zeel-1;peel-1’. The parameter k specifies the outcrossing rate. When k = 1, there is complete outcrossing, and partial outcrossing is given by 0 < k < 1. The parameter s is the degree zeel-1;peel-1 might reduce female fecundity. Dominance of the fecundity loss is defined by h. The parameter t models the paternal effect lethality. In the zeel-1;peel-1 case, t is very close to 1.
Additional files
Download links
A two-part list of links to download the article, or parts of the article, in various formats.
Downloads (link to download the article as PDF)
Open citations (links to open the citations from this article in various online reference manager services)
Cite this article (links to download the citations from this article in formats compatible with various reference manager tools)
A toxin-antidote selfish element increases fitness of its host
eLife 12:e81640.
https://doi.org/10.7554/eLife.81640


