Human and macaque pairs employ different coordination strategies in a transparent decision game
- Cognitive Neuroscience Laboratory, German Primate Center – Leibniz Institute for Primate Research, Germany
- Leibniz ScienceCampus Primate Cognition, Germany
- Georg-Elias-Müller-Institute of Psychology, University of Gottingen, Germany
- Max Planck Institute for Dynamics and Self-Organization, Germany
- Campus Institute for Dynamics of Biological Networks, Germany
- Cognitive Ethology Laboratory, German Primate Center – Leibniz Institute for Primate Research, Germany
- Department of Primate Cognition, Johann-Friedrich-Blumenbach Institute for Zoology and Anthropology, University of Gottingen, Germany
- Bernstein Center for Computational Neuroscience, Germany
Figures
Figure 1
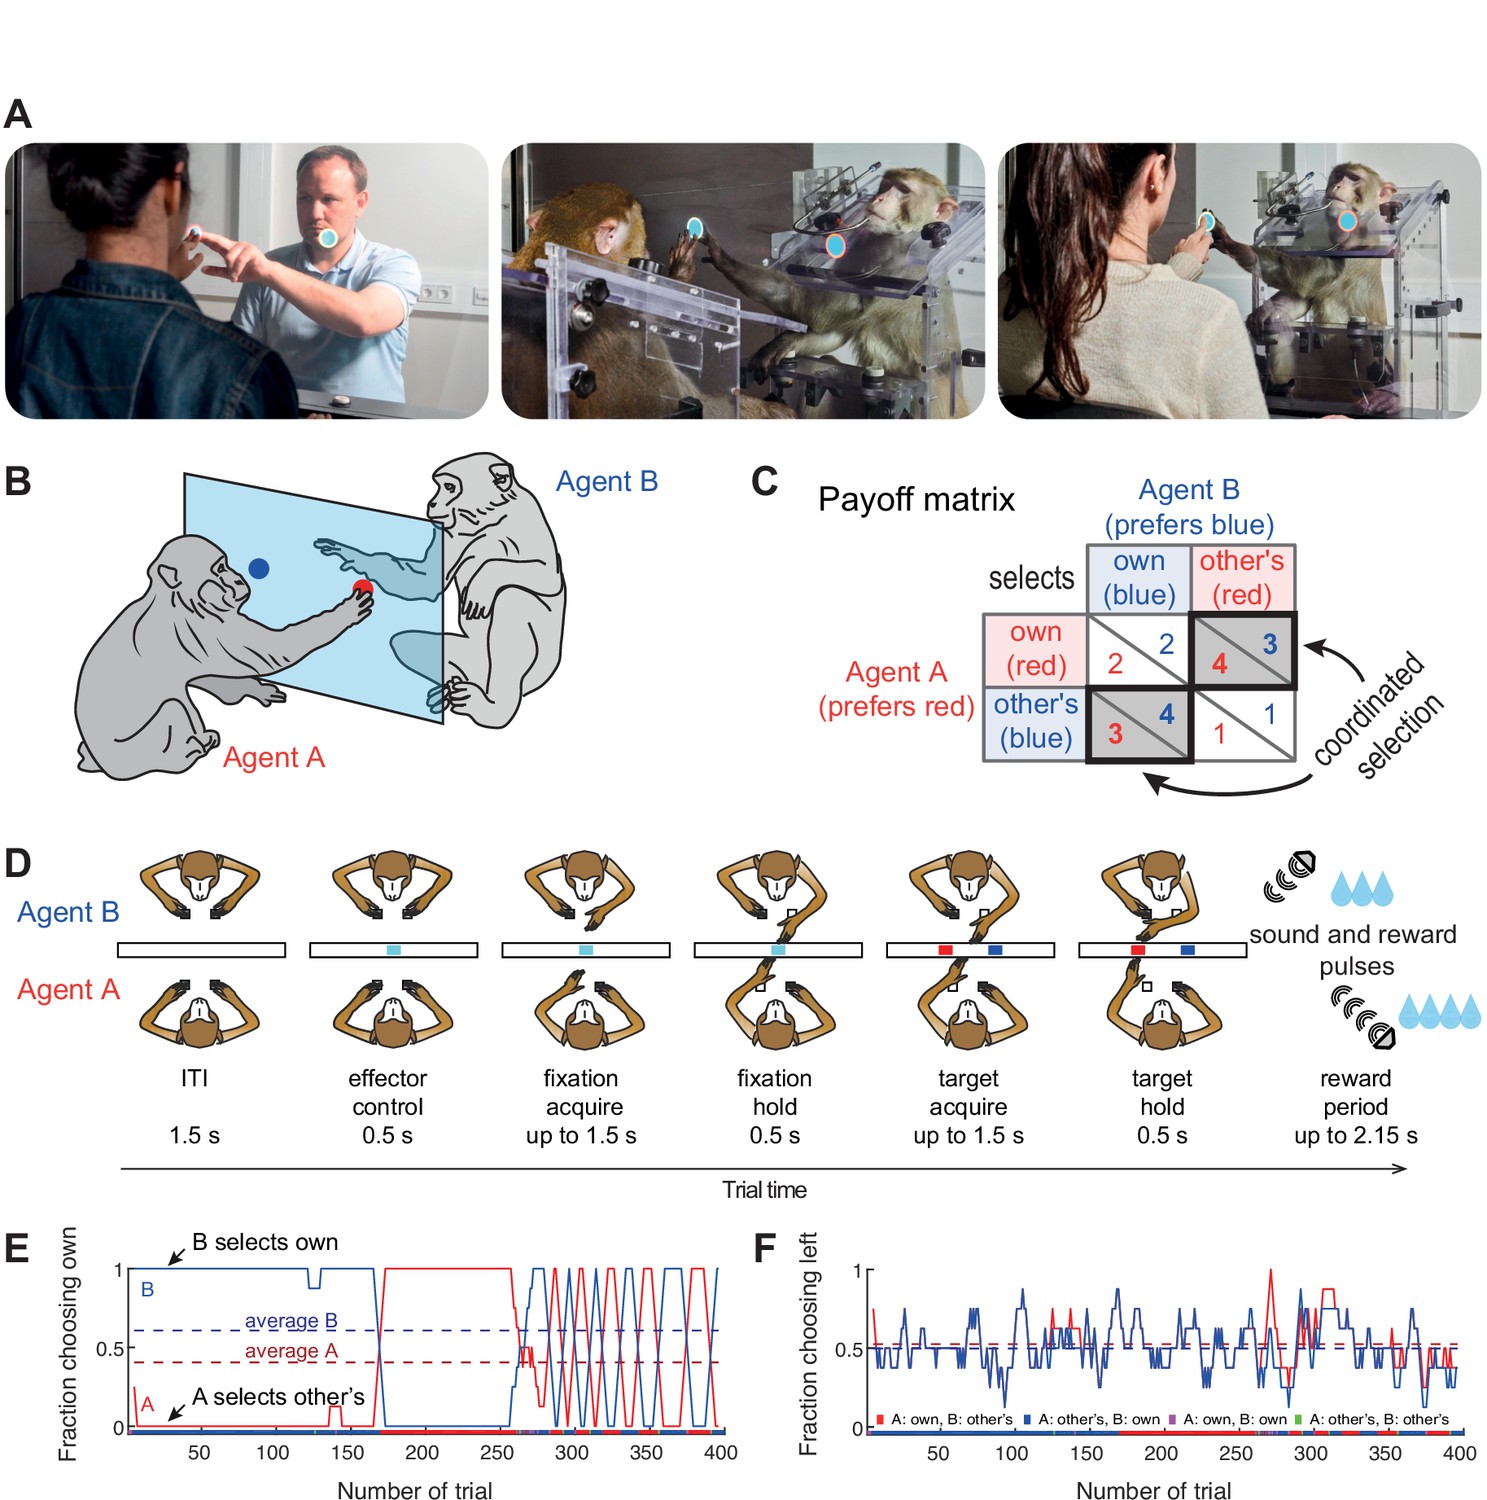
Experimental setup.
(A) Photos of the dyadic interaction platform showing humans and macaques reaching to targets in a shared transparent workspace. (B) A sketch and (C) the payoff matrix describing reward outcomes for each player for four possible combinations of individual choices (numbers show the monetary/liquid reward units for agent A in red and agent B in blue, 1.5 euro cents per ‘unit’ for humans and ~0.14 ml of liquid for monkeys). The coordinated selection of the same target (black bold diagonal) resulted in a ‘bonus’ of two reward units. (D) Schematic top-view of two macaque agents in different stages of the task, and the timing of one trial. (E,F) Session timecourse of an example human pair (pair 2). (E) The fraction of choosing own (FCO) for both agents (A: red; B: blue) as running average over 8 trials. In coordinated trials, one agent always selects the own target (FCO = 1), while the other selects the non-preferred target (FCO = 0). The dashed lines show the session average FCO for each agent. The color bar below shows for each trial the selected combination (red: A and B selected A’s preferred target; blue: A and B selected B’s preferred target; magenta: both agents selected their individually preferred target; green: both agents selected their non-preferred target). Here both human agents coordinated by selecting the same target in blocks. (F) The fraction of choosing left (FCL, from A’s viewpoint) as running average over 8 trials. The dashed lines show the session average FCL for each agent. Here, side selection fluctuated around a random level of 0.5 for both players.
Figure 2 with 3 supplements
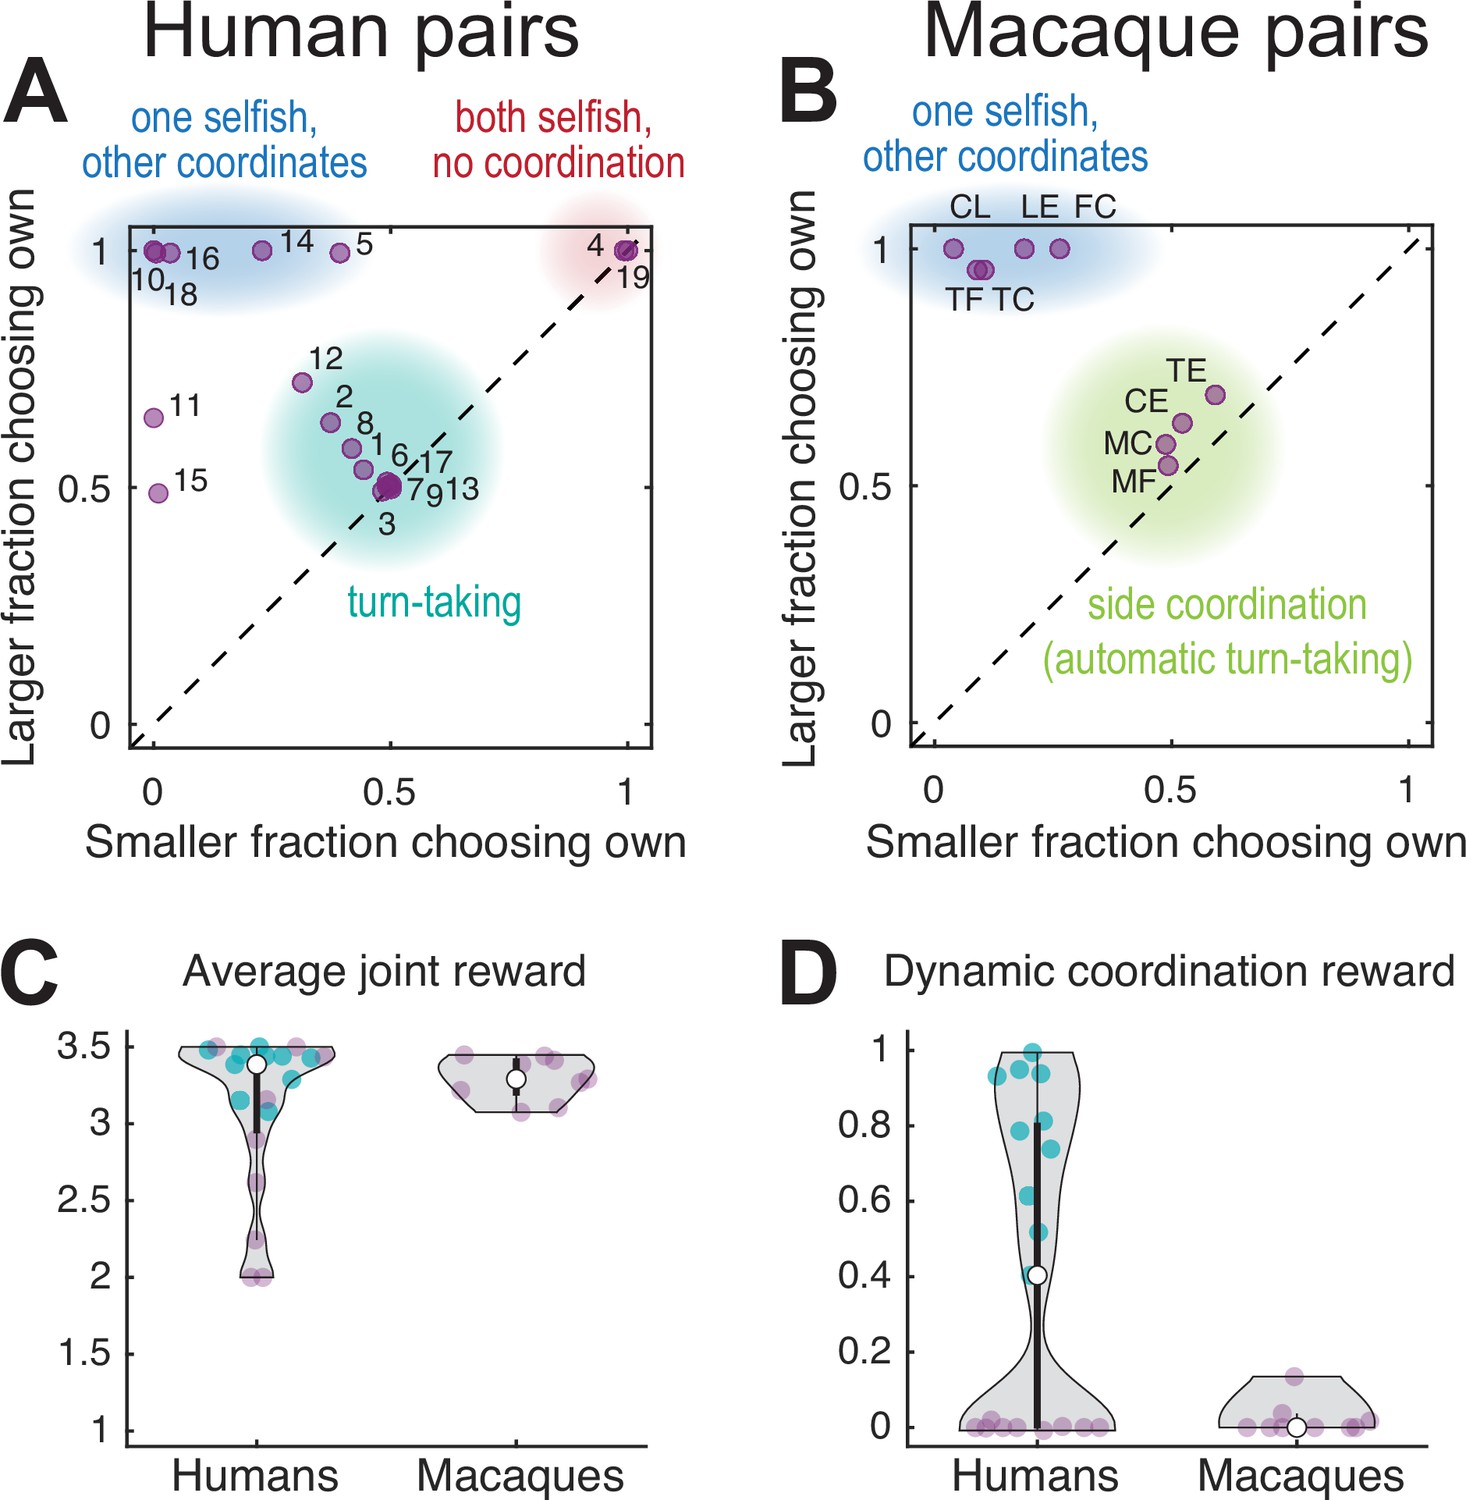
Performance of human and macaque pairs.
(A) Human pairs. The larger of the two average fraction of choosing own (FCO) values in each pair versus the smaller of the two. The diagonal line indicates equal FCO for both agents. Humans converged mainly on three different strategies: balanced turn-taking (teal underlay), static selection of the same color (blue underlay), or static selection of different colors (red underlay); two out of 19 pairs did not converge on any of these strategies. (B) Macaque pairs: same as (A) for a late session for each pair. Macaque pairs converged on jointly selecting either one of the two color targets (blue underlay) or the same side (green underlay). Note that the clusters within the teal underlay in (A) and (B) have different underlying choice behavior: turn-taking for humans and fixed side choices for monkeys which results in an automatic alternation of the color targets; to disambiguate these two strategies see Figure 3. (C) Violin plots of the average joint reward for each pair (purple and teal dots, the latter show 10 turn-taking pairs corresponding to the teal underlay in A); the white dot shows the median of each group. A reward of two indicates uncoordinated choices of the individually preferred targets, a reward of 3.5 indicate perfect coordination, and a reward of 2.5 indicates random independent choices. All but five human pairs and all monkey pairs achieved an average joint reward >3 (no significant difference between species, Wilcoxon rank sum test: human dyads median 3.44, N 14; macaque dyads median 3.29, N 9; rank sum 192.5; p=0.297). Note that the average joint reward cannot disambiguate between balanced and unbalanced rewards for each agent, see Figure 2—figure supplement 2B and G for individual rewards. (D) The dynamic coordination reward (DCR) for human and monkey pairs. Ten turn-taking human pairs showed a significant DCR with amplitude >0.2 (teal dots, corresponding to the teal underlay in A, see also Figure 2—figure supplement 2C) while no monkey pair showed high DCR (only one pair showed a small (<0.2) but significant DCR, see also Figure 2—figure supplement 2H).
Figure 2—figure supplement 1

Performance improvement in human and monkey pairs.
(A) Scatter plot of the average joint reward earned by all 19 human pairs for the first 100 versus the last 200 trials. Note that 1 is the minimal possible average joint reward and 3.5 is the maximum. Filled circles denote pairs with a significant change in the ratio of uncoordinated to coordinated choices between the early (first 100) and late (last 200) trials (p<0.05, Bonferroni-corrected Fisher’s exact test of the proportion of coordinated versus uncoordinated trials early versus late); in 9 of 19 pairs the increase in coordination was significant. Over all pairs, there was a significant increase in median reward from early to late trials (Wilcoxon signed rank test: N 19, first 100 trials median 2.83, last 200 trials median 3.39, signed rank 12, p<0.0011, median change 0.56). (B) Average fraction of choosing left for all human pairs for early versus late trials. Note that human pairs cluster around the main diagonal indicating balanced side choices. (C–F) Dyadic task increased average joint reward in monkey pairs: (C) Average reward increased in early versus late trials in the initial early session of monkey pairs (Wilcoxon signed rank test: N 9, first 100 trials median 2.53, last 200 trials median 2.75, signed rank 0, p<0.004, median change 0.23; 4 of 9 pairs individually significant). (D) The increase was not significant in late sessions (Wilcoxon signed rank test: N 9, first 100 trials median 3.22, last 200 trials median 3.29, signed rank 7, p=0.08, median change 0.08; 3 of 9 pairs individually significant). (E) Comparing the average reward between the last 200 trials of early and late sessions for each monkey pair also showed a significant increase in coordination (Wilcoxon signed rank test: N 9, early session median 2.75, late session median 3.29, signed rank 0, p<0.004, median change: 0.54; 8 of 9 pairs individually significant). Monkeys showed some mild intra-session increase in coordination (as seen in the increased median average reward) but they only reached the human level of increase (~0.5 units) in median average reward/coordination when comparing late with early session data (compare A with E). (F) Average fraction of choosing left for monkey early versus late sessions; note the two groups, those that converged on selecting the same side in the upper right corner (same pairs clustered around an fraction of choosing own (FCO) of 0.5, see Figure 2B), and those that converged on selecting the same target color, around the center of the plot (same pairs clustered at the top left of Figure 2B).
Figure 2—figure supplement 2

Performance of human and macaque pairs.
(A) Human pairs: aggregate measures of choice behavior and coordination for 19 human pairs. Panels C to E are sorted by the average joint reward; the example in Figure 1E and F is from pair 2. Individual measures for A are shown in red, for B in blue, measures for the pair are in purple. (A) The larger of the two average fraction of choosing own (FCO) values in each pair versus the smaller of the two. The diagonal line indicates an equal frequency of own choices for both agents. (B) The average reward for each agent. The dashed line at 2.5 shows the reward value for random choices, the dashed line at 3.5 shows the maximal attainable average joint reward. Here and in the panels C-E, 10 turn-taking pairs corresponding to the teal underlay in A are designated by teal font. (C) The dynamic coordination reward (DCR), the error bars show 95% CIs; 53% of pairs (3, 1, 13, 2, 12, 7, 9, 17, 8, 6 – all turn-taking teal pairs) showed significant dynamic coordination reward (DCR.) (D) Mutual information for target choices. (E) Mutual information for side choices. (F–J) Macaque pairs late session: same measures as in A-E for a late session for each macaque pair. Macaque pairs converged on jointly selecting either the same side (marked by green underlay or font) or on jointly selecting one of the two color targets. (K–O) Macaque pairs early session: same measures as in A-E for an early session for each macaque pair. Macaques tended to insist on their respective individually-preferred color, with only pair MF converging mostly on side coordination.
Figure 2—figure supplement 3
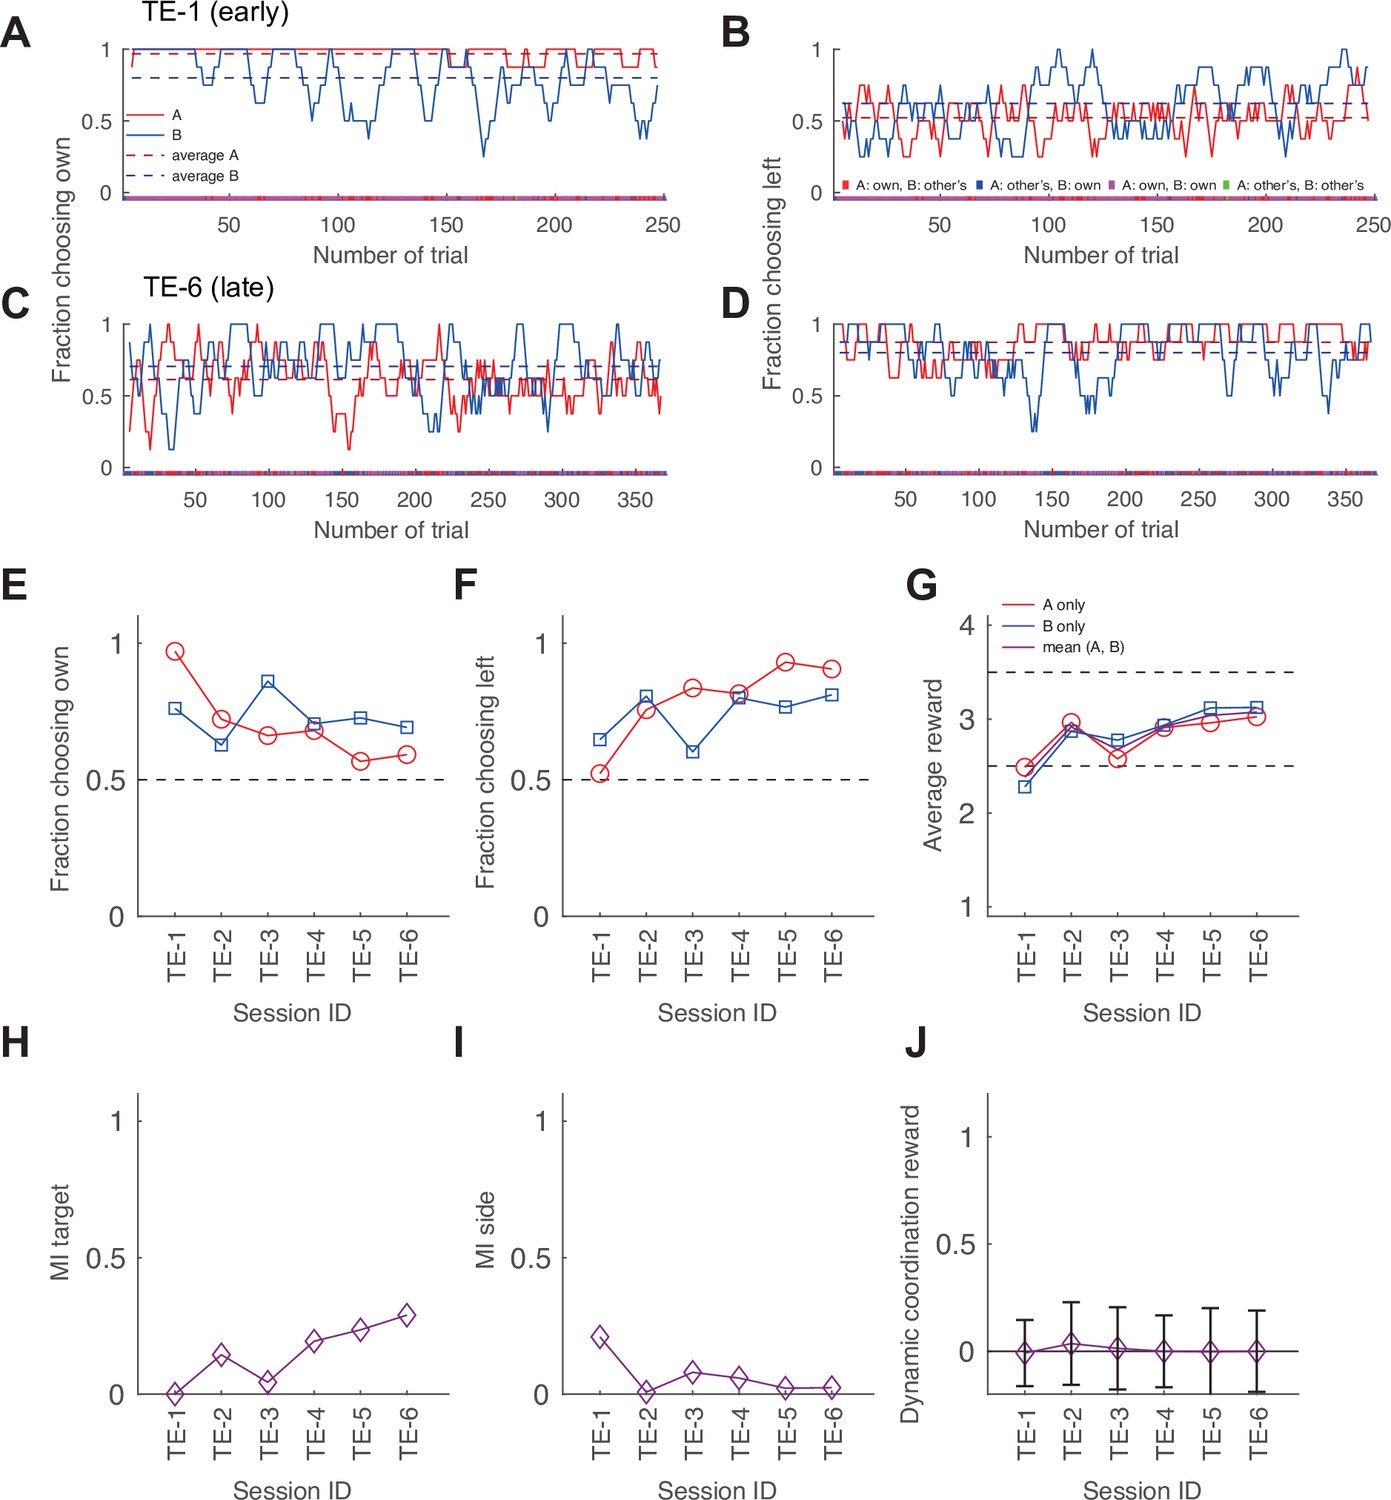
Exemplary development of choice behavior in macaque pair TE over six sessions.
(A, C) The running average of the fraction of choosing own from an early (A) and a late session (C) of pair TE. (B, D) The running average of the fraction of choosing (objective) left from an early (B) and a late session (D) for the same pair. Conventions are the same as in Figure 1E and F. The pair shifted from each selecting their individually preferred target to mostly jointly selecting the objective left side. (E–J) The change in aggregate measures of choice behavior and coordination over the course of six sessions for the last 200 trials of each session. There was a clear development from selecting own targets to coordination by virtue of converging on mostly selecting the target on the same side of the transparent display. This is also reflected in the gradual increase of the target MI and the gradual decrease of the side MI. The zero dynamic coordination reward (DCR) values indicate no significant dynamic coordination. In a typical macaque pair, both agents initially retained a strong preference for their own preferred colors, showed no strong side selection bias and little coordination (A and B, see Figure 2—figure supplement 2K–O for data from all pairs). In the late session the behavior had changed, with both agents exhibiting less own color selection and a stronger convergence on the left side of the display (C and D). This shift in strategy was gradual (E and F) and resulted in a better outcome for both agents with nearly equalized reward (G).
Figure 3

Comparison of coordination strategies in humans and macaques.
Each symbol shows the mutual information between side choices (MI side) and target color choices (MI color) calculated over the last 200 trials of a session, for human and macaque pairs. Since mutual information for a non-varying sequence of choices is zero, sessions in which a pair statically converged on a fixed color have MI color around zero and a non-zero MI side, and sessions in which a pair statically converged on a fixed side have a non-zero MI color and around zero MI side. Pairs/sessions near the y-axis hence indicate static selection of one of the two target colors (i.e. either coordinating on A’s or B’s preferred option, or only selecting their own preferred color; dark gray underlays), while pairs/sessions near the x-axis indicate static coordination on a side. Pairs/sessions with balanced side and color choices fall onto the main diagonal, indicating dynamic coordination or turn-taking (light gray underlay). The distance between each symbol and the (0,0) origin represents the (anti)coordination strength. Ten human pairs showed dynamic coordination, using trial-by-trial or block-wise turn-taking. Eight human pairs converged on color-based strategies: five pairs largely selected one color, i.e., one of the two coordinated options (5, 10, 14, 16, and 18), two pairs did not coordinate (4, 19), and in one pair (11) one agent selected other’s color but the other randomly switched between the colors. In the remaining pair (15), both MI side and MI color did not significantly differ from zero (p>0.01, Materials and methods; in this pair one agent mostly selected one side and the other - one color). In late sessions, macaque pairs either converged on selecting the same color target (pairs FC, LE, TC, TF, and CL) or converged on the same side (TE, CE, MC, and MF).
Figure 4 with 2 supplements
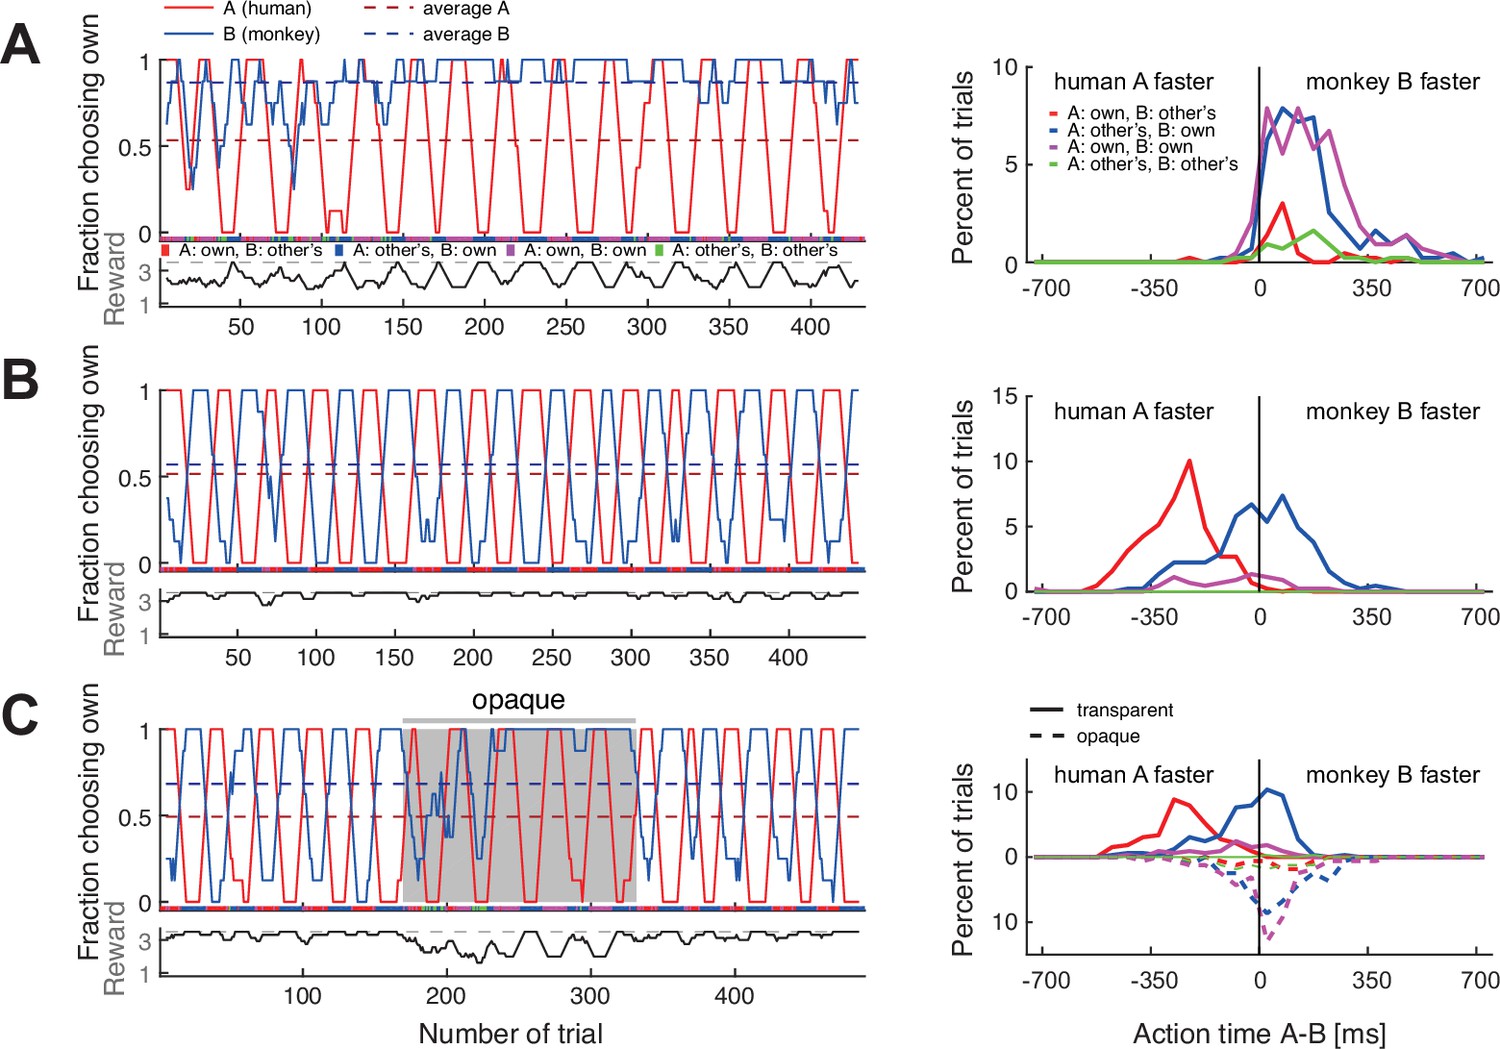
Macaques can be trained to take turns when paired with a human confederate.
A human partner alternated between the two colors in pre-defined blocks. (A) In an early confederate training session, the monkey F (agent B) mostly selected his own target, independent of the human’s choices. The lower sub-panel shows the running average (eight trials) of the average joint reward; the cyclic modulation shows that the macaque did not coordinate with the confederate. The action time (AT) difference (AT A – AT B) histograms on the right (bin size 50 ms) show that in all four choice combinations, the macaque acted faster than the confederate. (B) A late confederate training session. After several sessions (Figure 4—figure supplement 2A–F) the macaque had learned to coordinate (note anti-correlation of the two fraction of choosing own curves, and the average joint reward approaching the maximum 3.5 value). The action time (AT) difference histograms show that in blocks when the pair selected the macaque’s non-preferred red target (red curve), the monkey acted slower than the confederate, waiting to see the human’s action before committing to his own choice (t-test on AT differences: coordination on red (mean –259 ms, SD 113, N 193) versus blue (mean –7 ms, SD 153, N 217), t(395.5) –19.1, p<0.001). (C) Macaque turn-taking with human confederate depended on visibility of the confederate’s actions. The gray background denotes the period in which an opaque barrier was placed over the region of the transparent display encompassing all touch targets; hence, the agents could not see each other’s reach movements but could still see the face. The macaque switched from turn-taking to mainly selecting his own preferred target during the opaque trials. Upward histograms show the transparent condition (solid curves) and downward histograms show the opaque condition (dashed curves). In the transparent condition, the behavior was similar to (B): the monkey waited for the human to act first in blocks of the monkey’s non-preferred target (t-test: coordination on red (mean –248 ms, SD 101, N 123) versus blue (mean –39 ms, SD 124, N 166), t(284.5) –15.9, p<0.001). In the opaque condition, the behavior was similar to (A): the monkey mostly selected his preferred target and there was no AT difference dependence on human’s choices (note the overlap between dashed blue and magenta curves). See Figure 4—figure supplement 1 and Figure 4—figure supplement 2G–L for monkey C.
Figure 4—figure supplement 1

Macaques can be trained to take turns when paired with a human confederate.
Same as the Figure 4, for monkey C. (A) Early confederate-training session, (B) late confederate-training session. The action time (AT) difference histograms of the late session show that in blocks when the pair selected the macaque’s non-preferred target (red curve), the monkey acted slower than the confederate, waiting to see the human’s action before committing to his own choice (t-test on AT differences: coordination on red (mean –142 ms, SD 138, N 86) versus blue (mean 0.5 ms, SD 119, N 108), t(168.4) –7.6, p<2*10–12). (C) Monkey C also ceased to take turns when an opaque barrier was placed over the region of the transparent display containing touch targets (gray background) and mainly selected his own target. The action time difference histograms show that in the transparent condition the behavior was similar to (B): the monkey waited for the human to act first in blocks of the monkey’s non-preferred target (t-test: coordination on red (mean –192 ms, SD 180, N 98) versus blue (mean 27 ms, SD 130, N 169), t(156.3) –10.6, p<5*10–20). In the opaque condition the behavior was similar to (A): the monkey mostly selected his preferred target and there was no AT difference dependence on human’s choices (note the overlap between dashed blue and magenta curves).
Figure 4—figure supplement 2
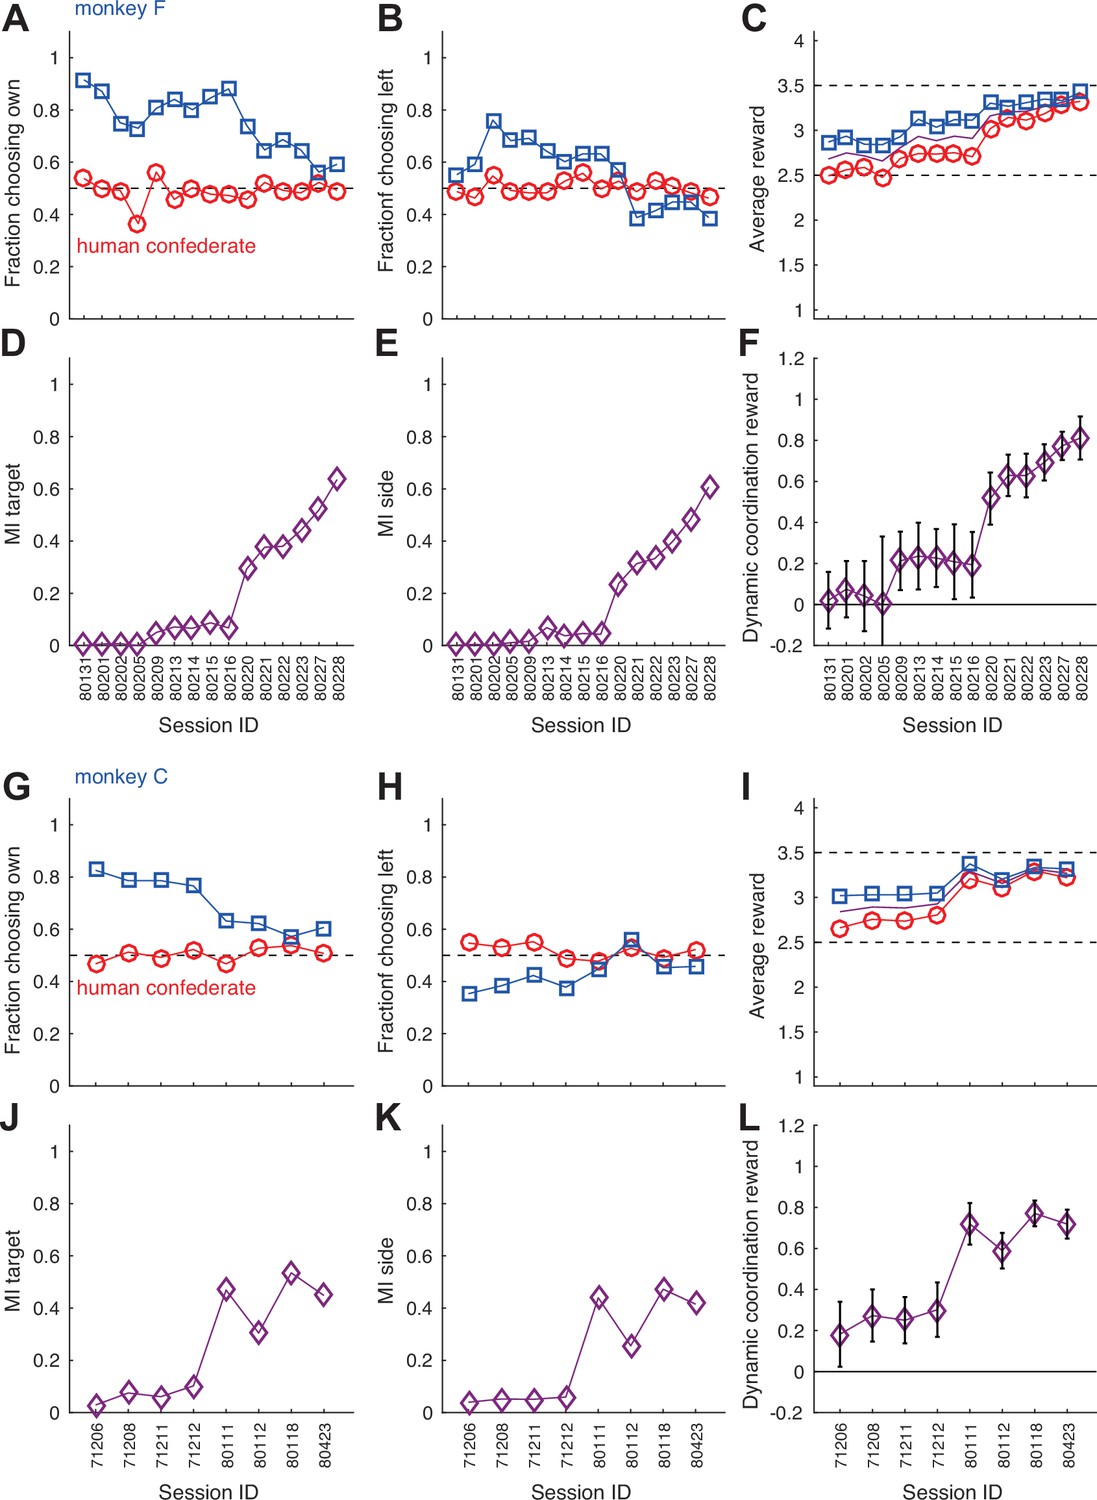
Monkeys gradually learn to follow a human confederate’s turn-taking behavior.
(A–F) The development of aggregate measures of choice behavior and coordination for monkey F (same conventions as Figure 2—figure supplement 3E–J). Note the gradual increase in average rewards, and the overall slow changes in the first nine sessions as compared to the steeper increases in the MIs and the dynamic coordination reward (DCR) in the last six sessions. (G–L) Corresponding data for monkey C.
Figure 5 with 1 supplement
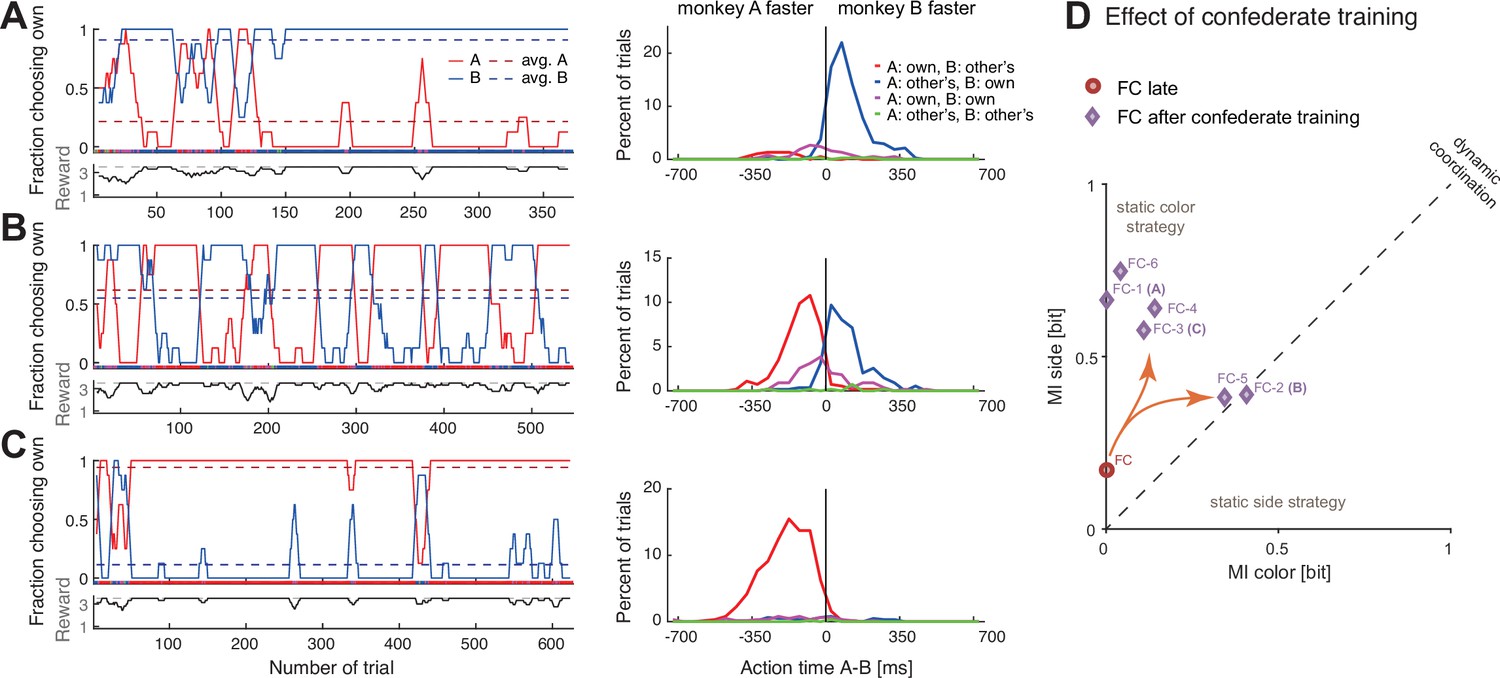
Confederate-trained macaques show competitive turn-taking behavior.
(A) In the first paired session after confederate training (FC-1) indications of turn-taking followed by a convergence on agent B’s target can be seen in the fraction of choosing own curves in the top subpanel; note how agent A occasionally tried selecting his preferred target. The action time (AT) difference histograms show that agent B acted faster when both agents selected his preferred target (t-test on AT differences: coordination on red (mean –211 ms, SD 112, N 27) versus blue (mean 105 ms, SD 98, N 286), t(29.9) –14.1, p<0.001). (B) In the next session (FC-2) the pair developed turn-taking; the action time (AT) difference histograms show that the pair converged on the faster monkey’s target (t-test: coordination on red (mean –117 ms, SD 96, N 238) versus blue (mean 90 ms, SD 104, N 201), t(411.7) –21.4, p<0.001). (C) In the following session (FC-3), the pair mostly converged on A’s preferred target, with A now acting faster (t-test: coordination on red (mean –188 ms, SD 115, N 553) versus blue (mean –31 ms, SD 192, N 33), t(33.4) –4.6, p<0.001); note that as in the first session the agent B occasionally tried his own preferred target, and two of these attempts were reciprocated by A. (D) Change in coordination in pair FC from a late session (red circle), to six sessions after confederate training. The ‘coordination strength’ (distance from the origin) increased, and in two sessions there was a significant dynamic coordination (FC-2, FC-5).
Figure 5—figure supplement 1
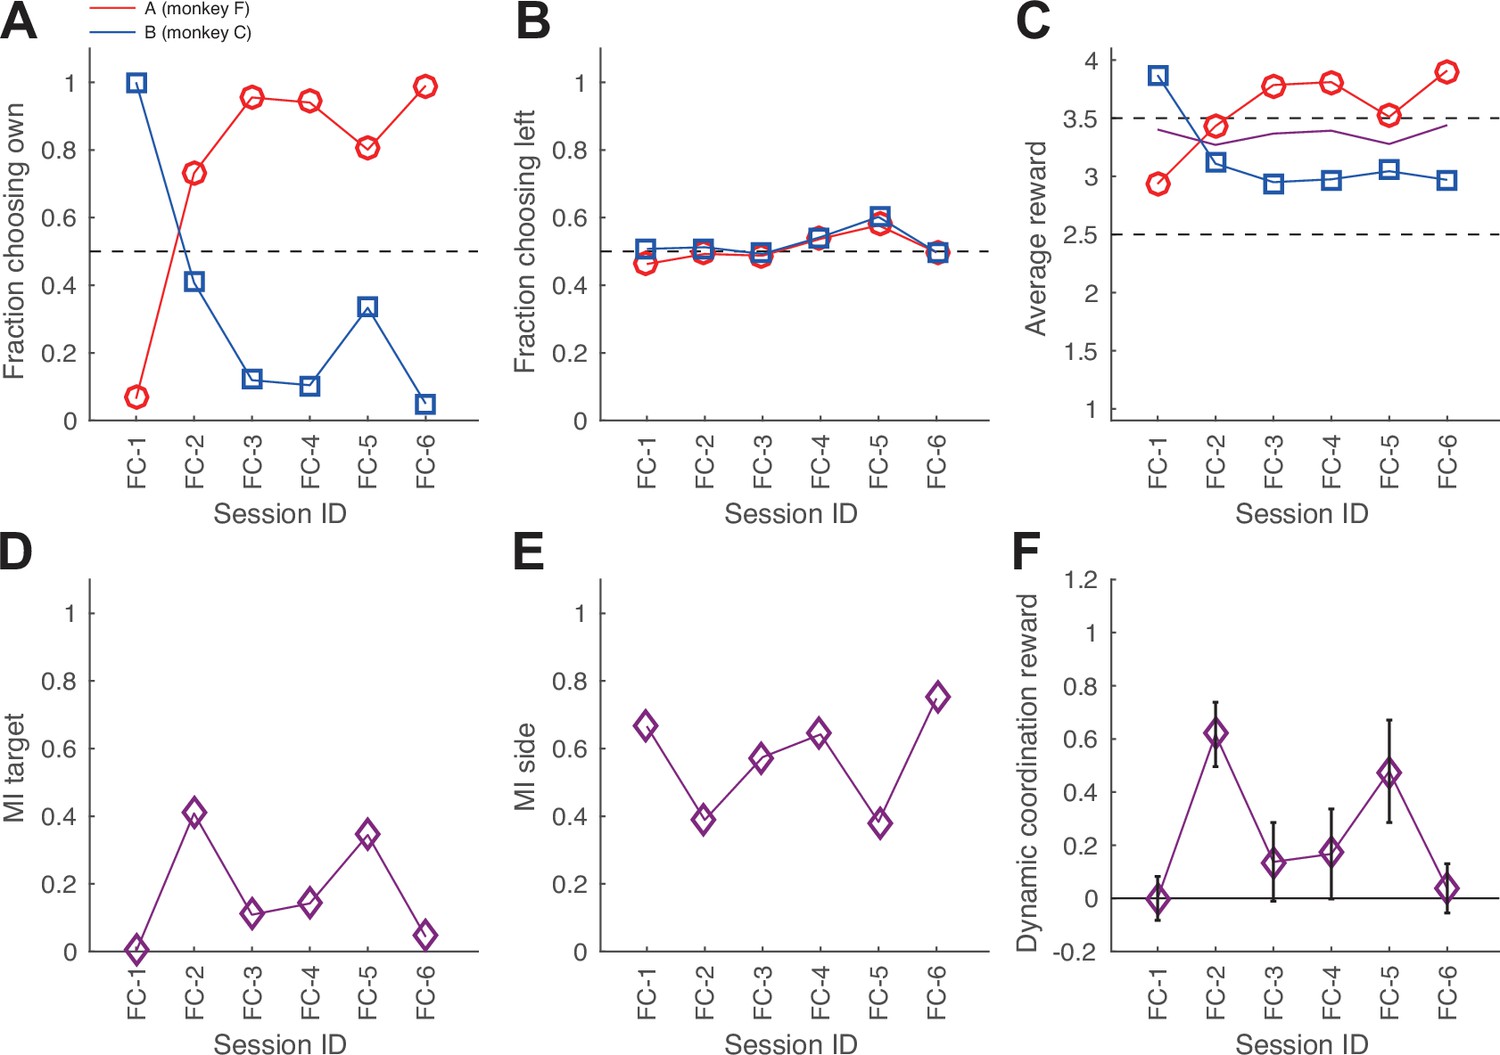
Confederate-trained macaques.
(A–F) The development of aggregate measures of choice behavior and coordination for monkey pair FC after confederate training (same conventions as Figure 2—figure supplement 3E–J). Note sessions FC-2 and FC-5, showing a more equalized fraction of choosing own (FCO) and the average reward between the two monkeys, as well as both non-zero mutual information for side and target and especially significant dynamic coordination reward (DCR) values. To assess if the balance between selfish versus benevolent coordination changed in the course of each session, we analyzed the fraction of coordinating on F’s preferred color among all coordinated trials (note that this is complementary to the fraction of coordinating on C’s color) in first 100 versus last 200 trials (Fisher’s exact test with Bonferroni correction for the number of tested sessions). In several sessions (FC-1, FC-2, FC-3, and FC-6), one of the two agents became more selfishly insistent on his preferred color towards the end of the session – while the other accommodated. Interestingly, the roles reversed in different sessions: in FC-1 C is the leader, while in FC-3 and FC-6 F is the leader. We conclude that during the dynamic coordination, there is a tendency for this pair to gradually adopt more consistent leader-follower roles, potentially because one monkey accommodates and follows more easily in a more sated state.
Figure 6 with 1 supplement
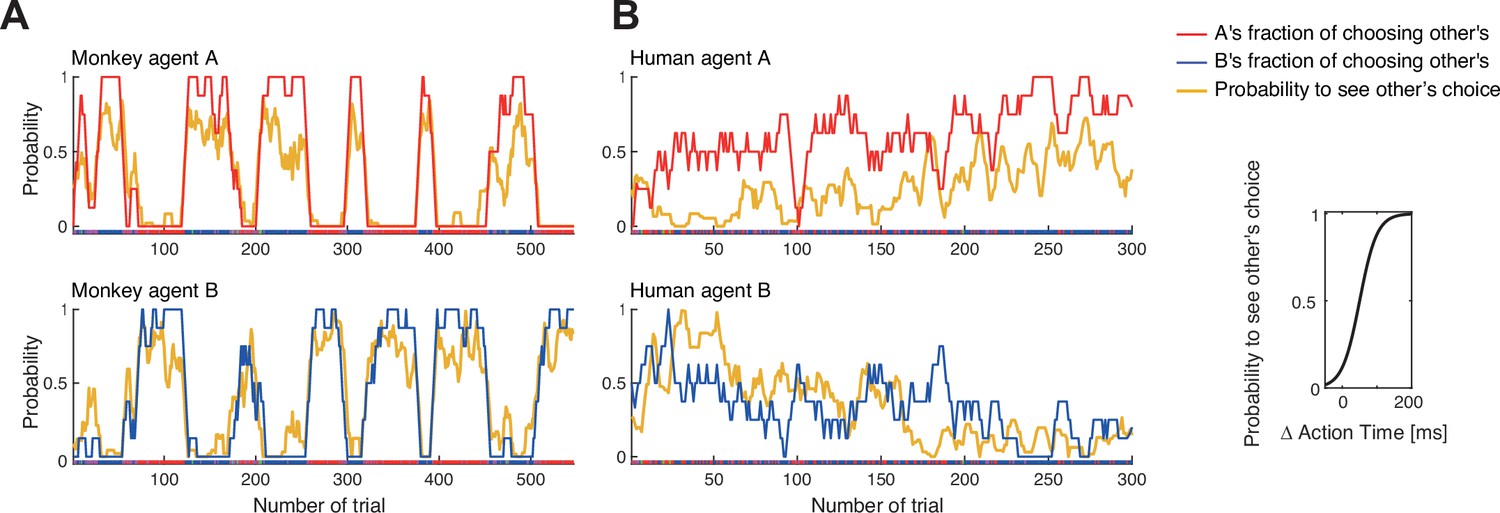
Confederate-trained macaque turn-taking is driven by action visibility.
The inset on the right shows the logistic mapping function from the action time difference to the probability to see the partner’s choice before acting. (A) The 2nd session of confederate-trained macaque pair FC (also shown in Figure 5B). This panel shows the correlation between the probability of seeing the other move first (the probability to see other’s choice) and the probability of following to the other’s preferred target (the fraction of choosing other’s). The fraction of choosing other’s is the inverse of the fraction of choosing own. All curves show running averages of the respective measure over eight trials. For agent A the correlation coefficient r(545) was 0.92 and for agent B 0.91 for smoothed data, and 0.64 and 0.65 for non-smoothed (trial-by-trial) data (all p<0.001). (B) The human pair 12 with the highest positive correlation showed a different pattern: a slow gradual shift from B following A to B leading A over the course of the session. For A, the correlation coefficient r(298) was 0.52 and for B 0.46 for smoothed data, and 0.27 and 0.33 for non-smoothed data (all p<0.001). The same human pair (only one out of ten pairs that exhibited dynamic coordination) showed a significant difference between action time (AT) differences in coordinated choices favoring agent A versus agent B, with each agent being faster when selecting the own preferred color (t-test on AT differences: coordination on A’s red color (mean –88 ms, SD 129, N 96), coordination on B’s blue color (mean 12 ms, SD 109, N 180), t(168.8) –6.5, p<0.001). See Figure 6—figure supplement 1 for data on other human pairs and on other sessions of macaque pair FC.
Figure 6—figure supplement 1
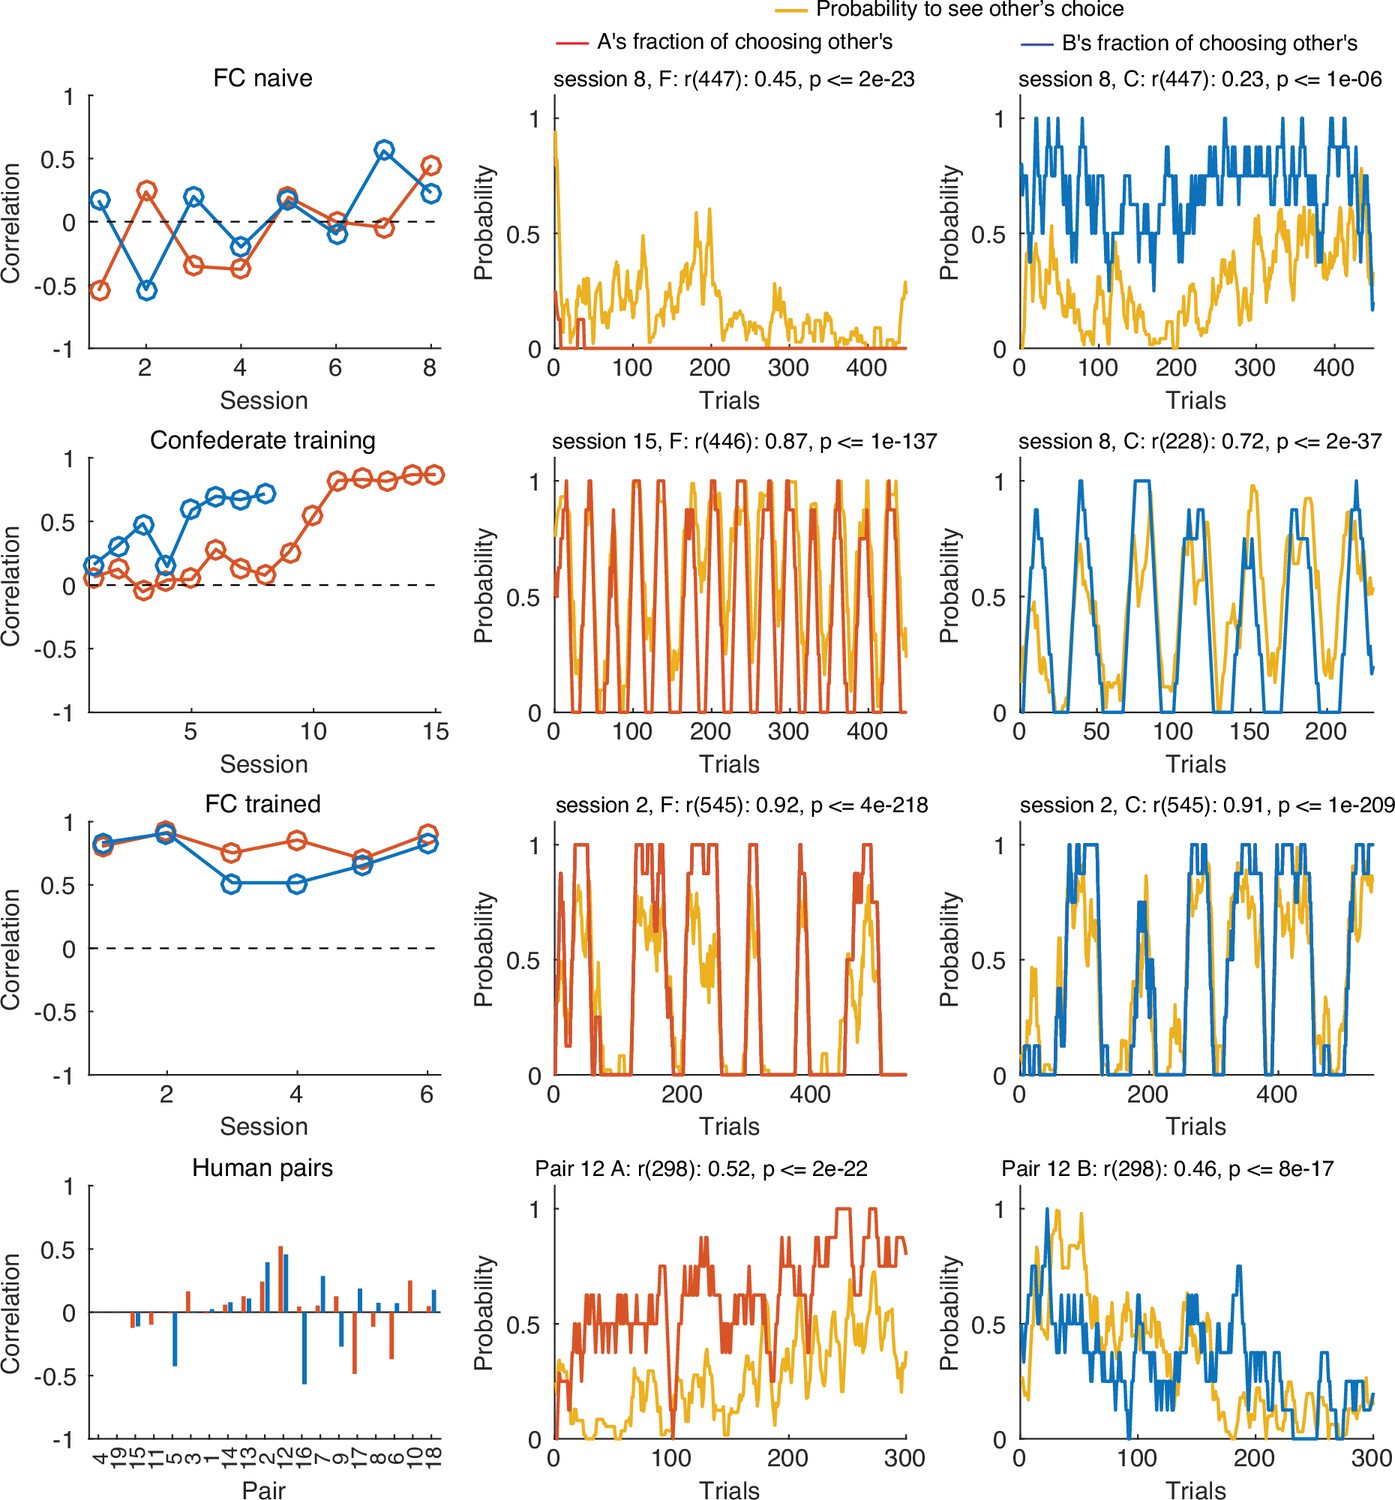
Correlations between the probability to see the partner’s choice and the likelihood to select the partner’s target.
The left column shows the correlations for different sessions of the same pair of macaques (FC) before (FC naïve), during and after the confederate training, as well as different human pairs. The middle and right columns show the probability to see other’s choice and the fraction of choosing own for one exemplary session for each group. Note that training with a confederate increased magnitude of the correlation (Confederate training) and this carried into the post-confederate training sessions of the two macaques (FC trained). Supplementary file 3 and Supplementary file 4 contain the statistical information for each individual correlation.
Figure 7 with 2 supplements
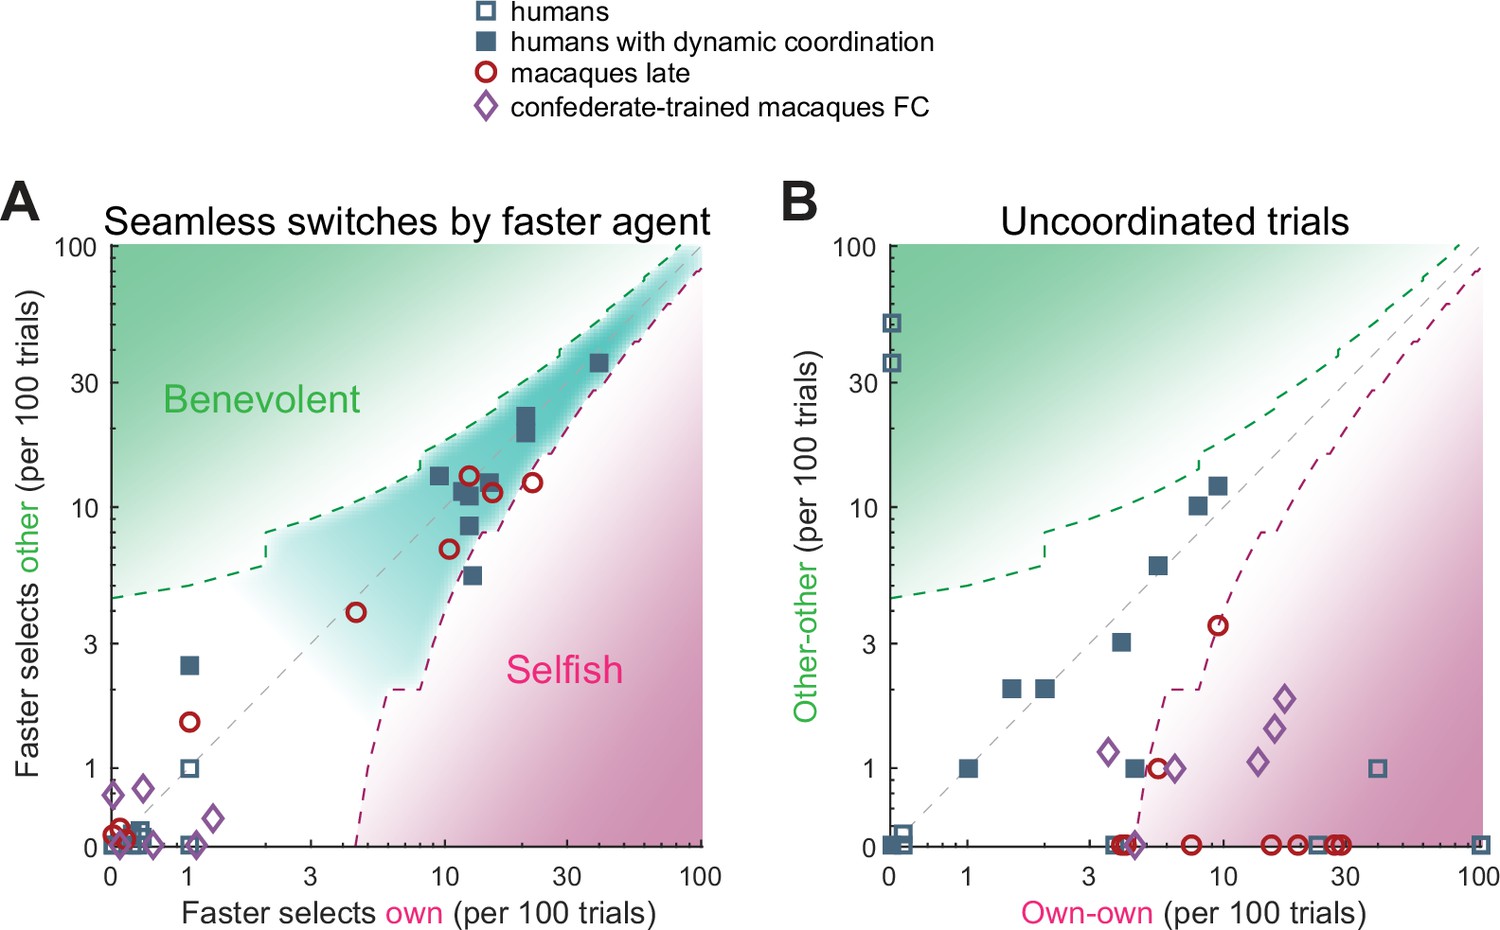
Humans and macaques show different switching behavior.
A quantification of different transition aspects as scatter plots of benevolent choices on the y-axis and selfish choices on the x-axis, in the two species. (A) The behavior of a faster agent for all seamless switches between the two coordination modes (red-to-blue and blue-to-red). Here and in B, the x-axis shows the number of own target selections (selfish), the y-axis the number of non-preferred target selections (benevolent). Turn-taking humans as well as monkey pairs that coordinated on one side showed high and balanced numbers of seamless switches, while the confederate-trained macaque pair and the non turn-taking humans showed only a few seamless switches. The dashed contours show the 95% CI around the diagonal, the teal underlay shows the area with balanced selfish and benevolent choices, the green and the magenta underlays show the area with significantly more benevolent and selfish choices, respectively. (B) The number of uncoordinated trials in which both subjects selected their respective preferred color (own-own) on the x-axis, and the number of trials in which both subjects selected their non-preferred color (other-other) on the y-axis. Turn-taking human pairs mainly lay along the diagonal while macaque pairs cluster in the lower right region (mostly significantly selfish).
Figure 7—figure supplement 1

Humans and macaques show different switching behavior.
(A) A magnification of the middle part of the macaque FC-2 session is shown in Figure 5B (trials 211–495); color bars represent the choice combinations; the magenta arrows point to uncoordinated switches that resulted in a change of the coordination color. (B) Four consequent trials (n−2, n−1, n, n+1) illustrate eight possible switch types occurring in trial n, classified as ‘selfish’ (an agent initiates a transition to own preferred target) and ‘benevolent’ (an agent initiates a transition to other’s preferred target). Seamless switches involve uninterrupted change from one to another coordinated option; uncoordinated switches involve one or more uncoordinated trials. (C–D) A quantification of different transition aspects as scatter plots of benevolent choices on the y-axis and selfish choices on the x-axis, in the two species. (C) The switches from coordination to non-coordination, or ‘challenge initiations’, for the faster agent. Monkey pairs fall below the diagonal (with the two competitive turn-taking sessions in pair FC even below the 95% CIs around the diagonal). Turn-taking human pairs again cluster around the diagonal. (D) The behavior of the faster agent for all switches from non-coordination to coordination, or ‘challenge resolutions’. Turn-taking humans cluster along the diagonal, while the trained monkey pair clustered below the diagonal (with the two competitive turn-taking sessions below 95% CI around the diagonal).
Figure 7—figure supplement 2
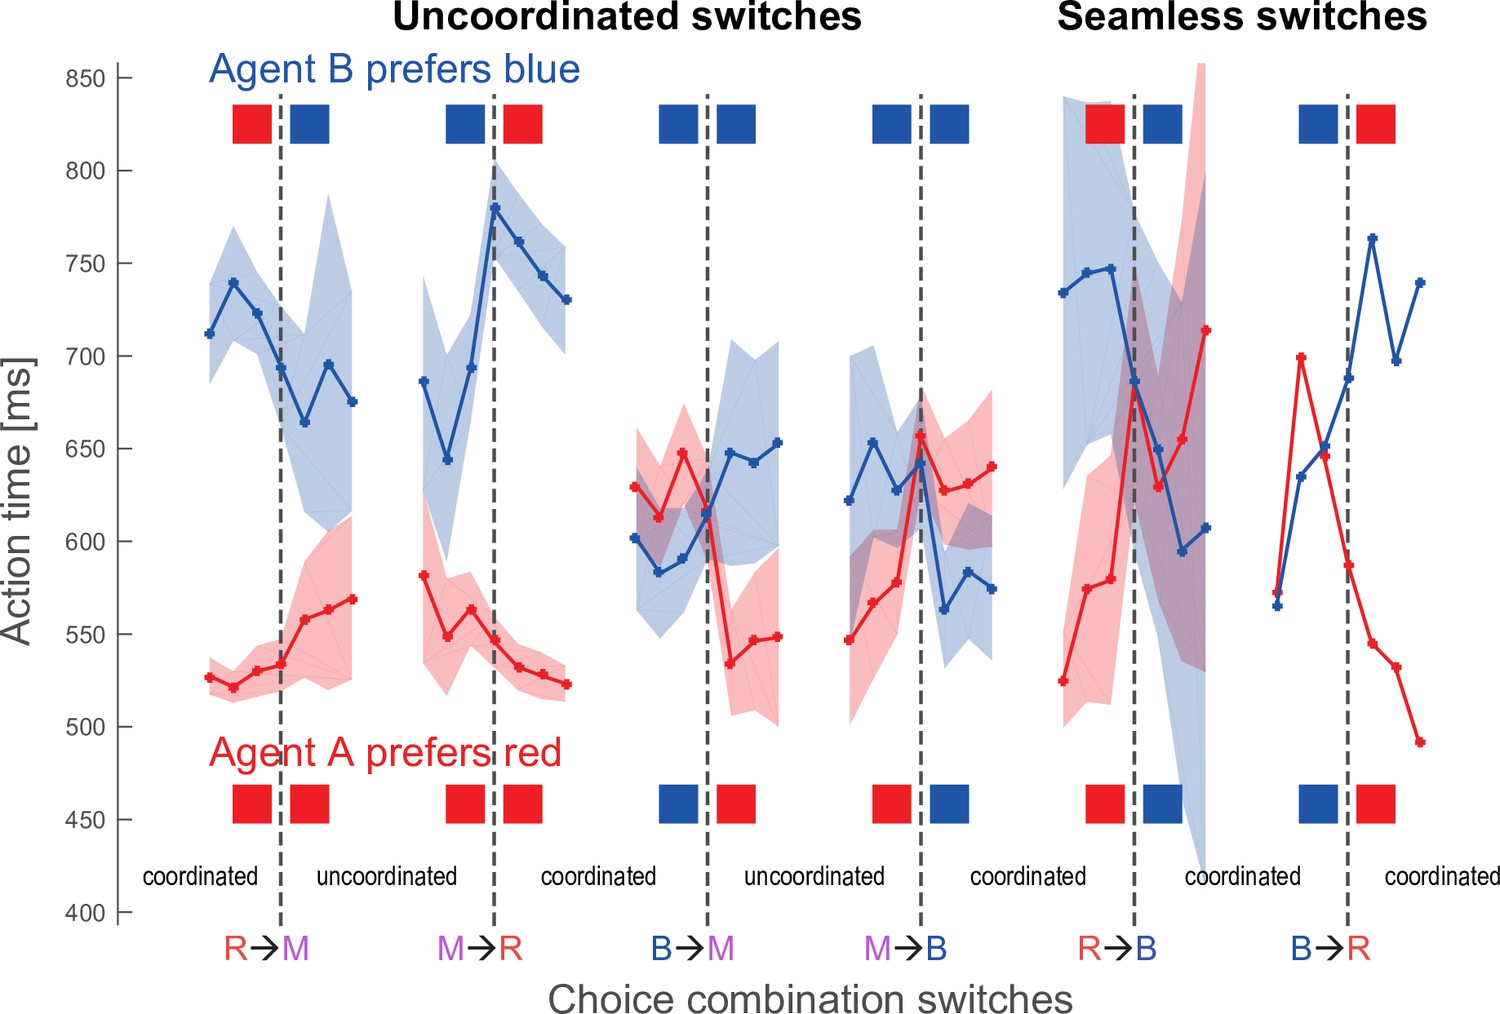
Action time changes around choice combination switches.
The graphs show the action time transitions around six specific choice switches, for agent A (monkey F) in red and for agent B (monkey C) in blue. Each curve shows the mean action time for three trials before, at the actual switch trial and 3 trials after the switch, the shaded areas show 95% CIs around the mean. R – red, B – blue, M – magenta. The choice transitions are R→M: from both agents selecting red to each selecting own color; B→M: from both selecting blue to each selecting own color; R→B and B→R: from both selecting one color to both selecting another color (seamless transition, rare in macaques, see Figure 7A); as well as the respective reverse transitions. The choices of agent B are indicated on the top, the choices of agent A on the bottom. Note that both macaques speed up when transitioning from coordinating on their non-preferred color to challenging (R→M for agent B, and B→M for agent A), and also when transitioning from challenging to coordinating on their preferred color (M→B for agent B, and M→R for agent A). Similarly, both macaques slow down when transitioning from coordination on their preferred color to challenging (B→M for agent B, and R→M for agent A) and when transitioning from challenging to coordination on their non-preferred color (M→R for agent B, and M→B for agent A). In rare seamless switches, monkeys speed up for coordination on the preferred color and slow down for transitions to the non-preferred color. Comparing action times in 3 trials before the transitions from coordinated choices of an agent’s preferred color to uncoordinated selection of individually preferred colors (RRR→M for agent A, BBB→M for agent B) versus the action times in three trials after the respective reverse transitions from uncoordinated own color selection to coordination on an agent’s preferred color (M→RRR for agent A, M→BBB for agent B) showed no significant differences (agent A: RRR→M: mean 526.7 ms, SD 56.9; M→RRR: mean 527.8 ms, SD 55.4, t(533.6) –0.23, p=0.83; Agent B: BBB→M: mean 590.8 ms, SD 128.1; M→BBB: mean 573.7 ms, SD 116.6, t(298.3) 1.23, p=0.22). Note that we excluded the actual transition trial. The absence of action time differences at the beginning and the end of coordination bouts indicates that transitions were not ‘invited’ by a faster agent slowing down prior to the transition.
Author response image 1
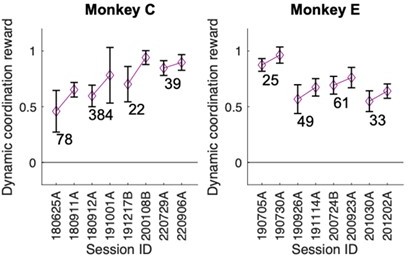
Confederate-following behavior was preserved across training breaks.
In both monkey C and E following behavior – as measured by the dynamic coordination reward (DCR) – directly before and after a training break with the confederate stayed unchanged. The numbers indicate break duration in days. We note that each post-break training started with multiple sessions in the solo condition to re-establish the monkey’s color preference and to get him accustomed to the task, however following behavior was established essentially immediately in the first post-gap confederate session after each of the breaks.
Author response image 2
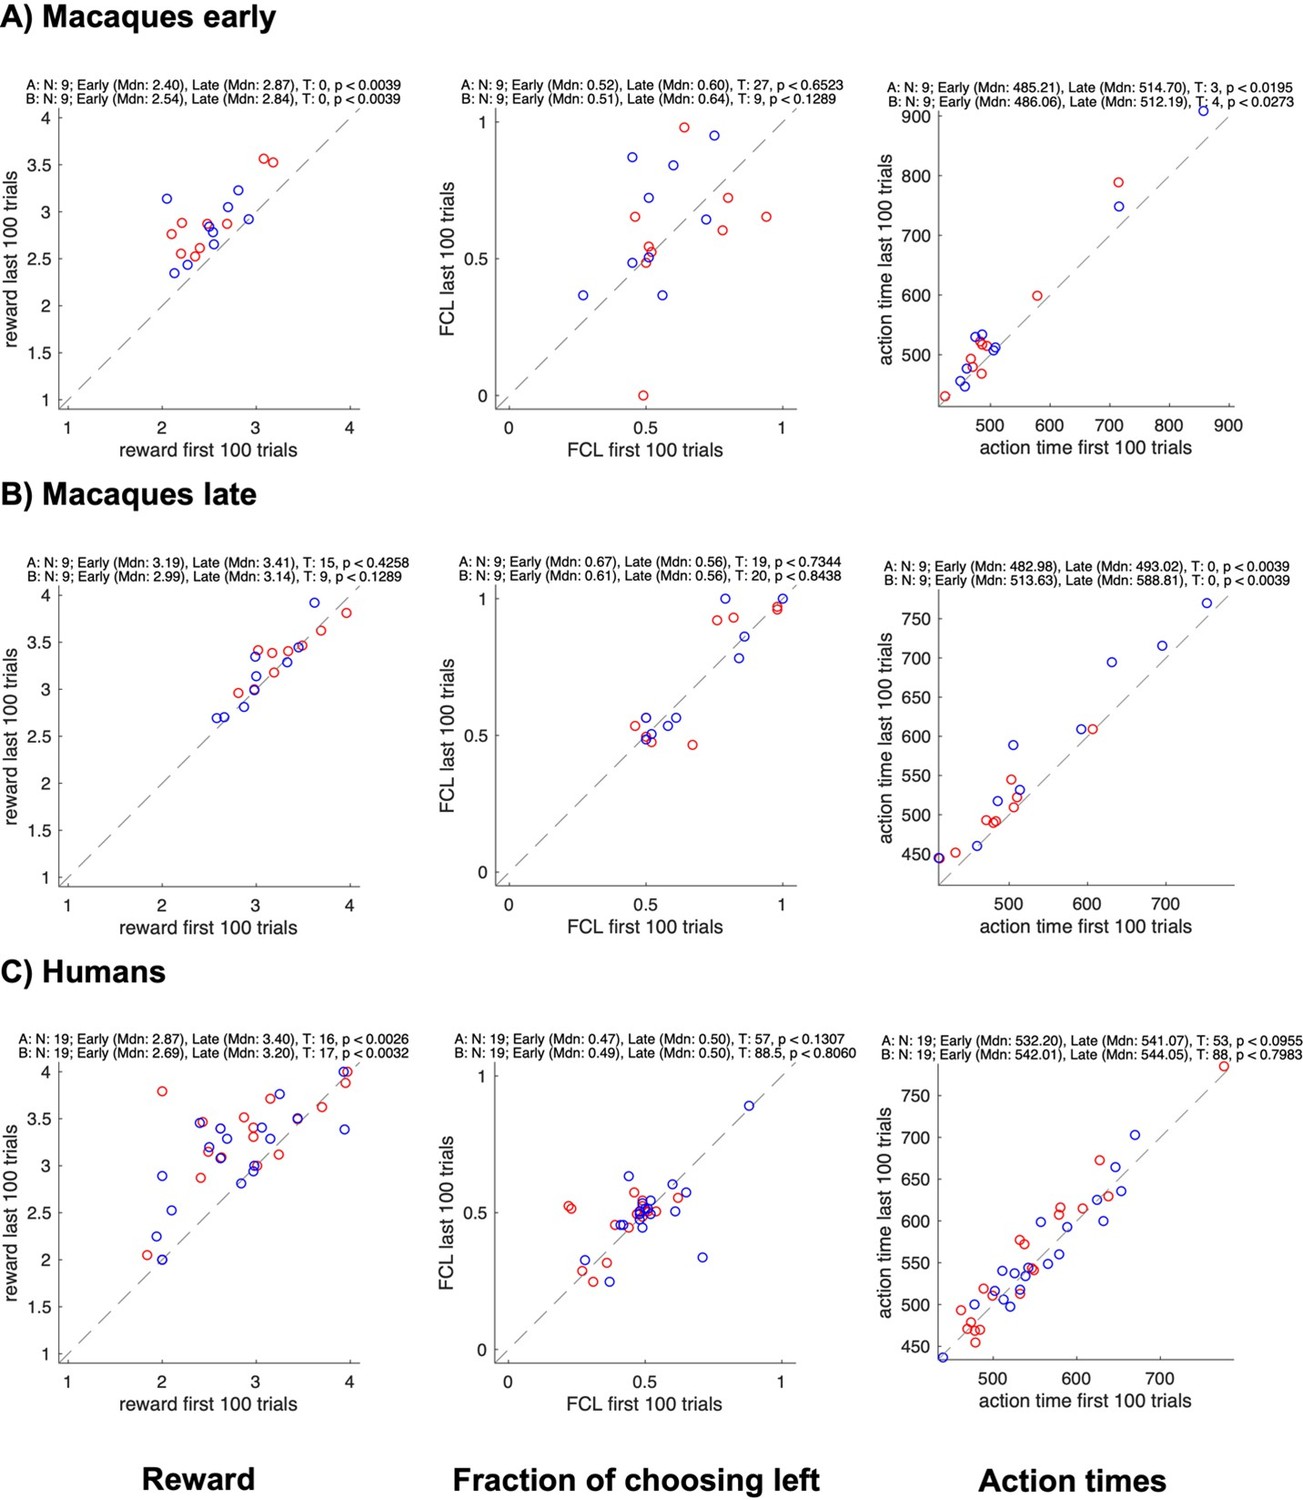
Changes in reward, side bias, and action time between start and end of sessions for different groups.
All panels show data for each individual subject in a pair (agent A in red, agent B in blue); the x-axis shows data from the first 100 trials, the y-axis data from the last 100 trials; rows show different groups; columns show the average reward, the fraction of choosing left, and the average action time. The numbers on top of each plot show the results of Wilcoxon signed rank tests on whether the value changed between the early and the late trials.
Author response image 3
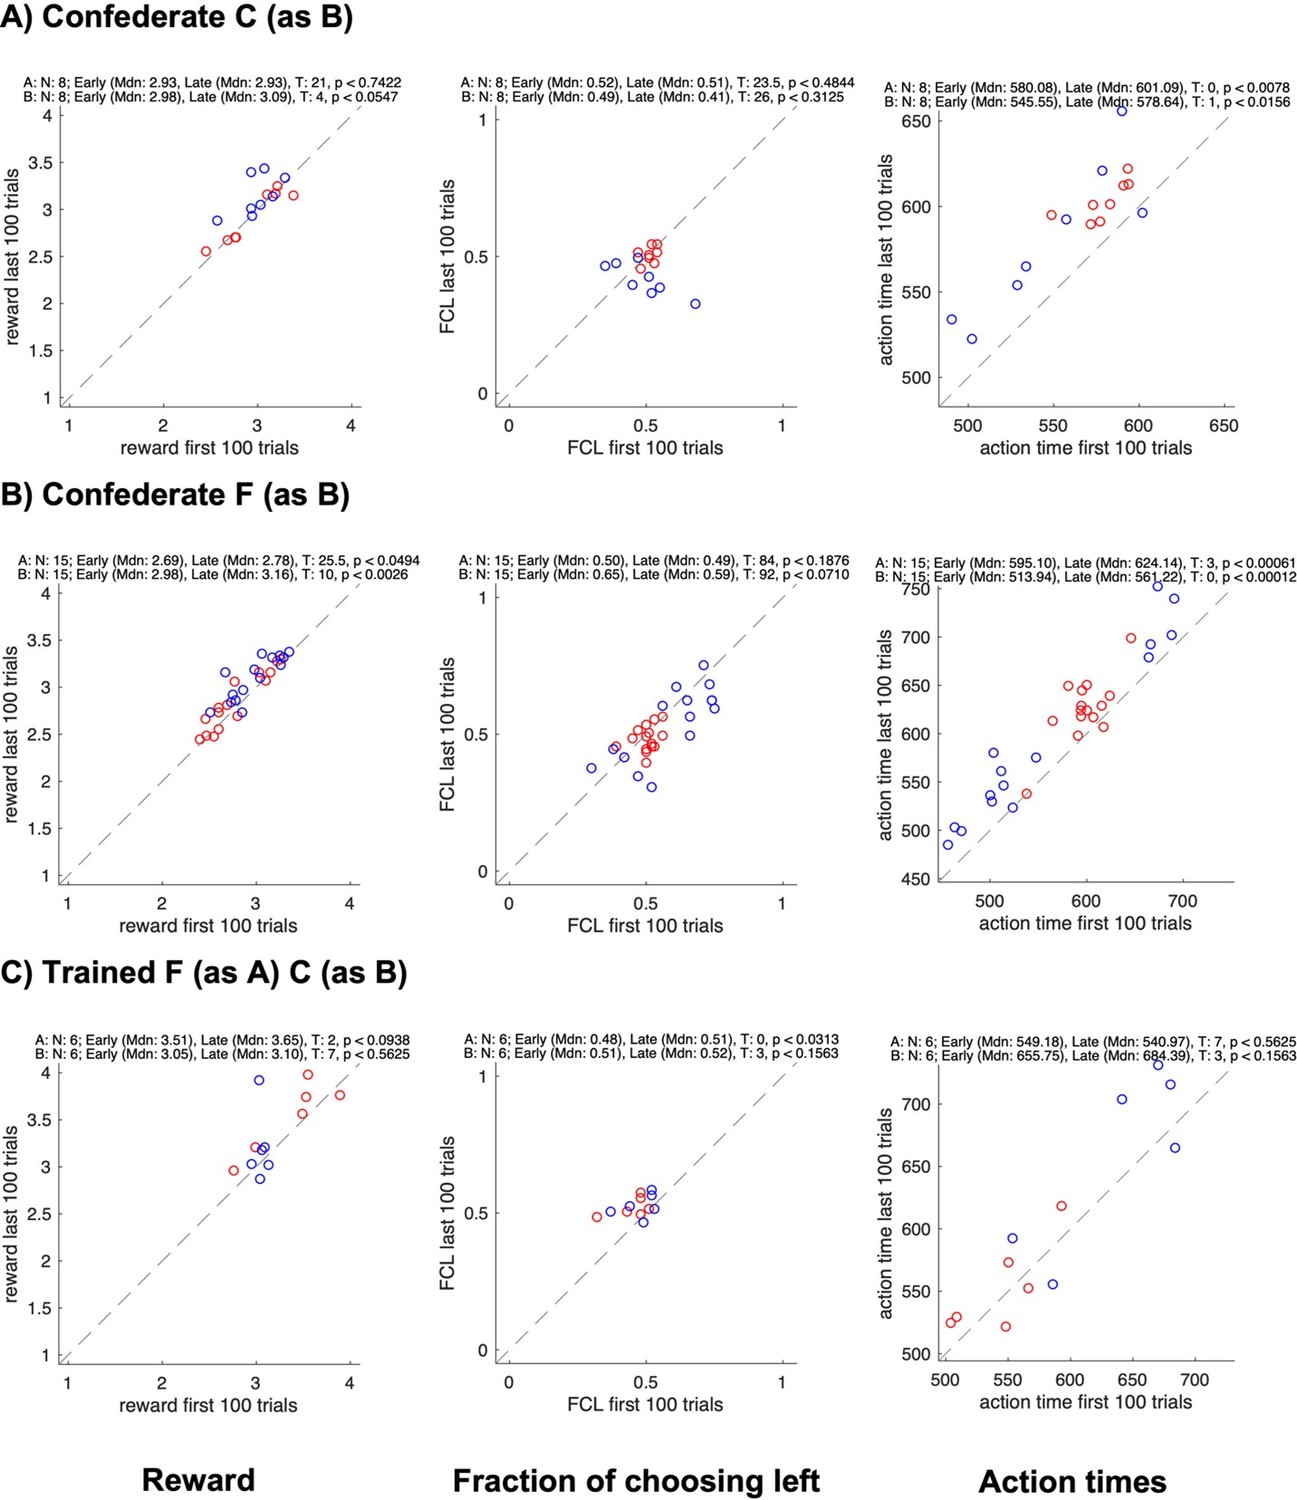
Changes in reward, side bias, and action time between start and end of sessions for different groups.
All panels show data for each individual subject in a pair (agent A in red, agent B in blue); the x-axis shows data from the first 100 trials, the y-axis data from the last 100 trials; rows show different groups; columns show the average reward, the fraction of choosing left, and the average action time. The numbers on top of each plot show the results of Wilcoxon signed rank tests on whether the value changed between the early and the late trials.
Author response image 4
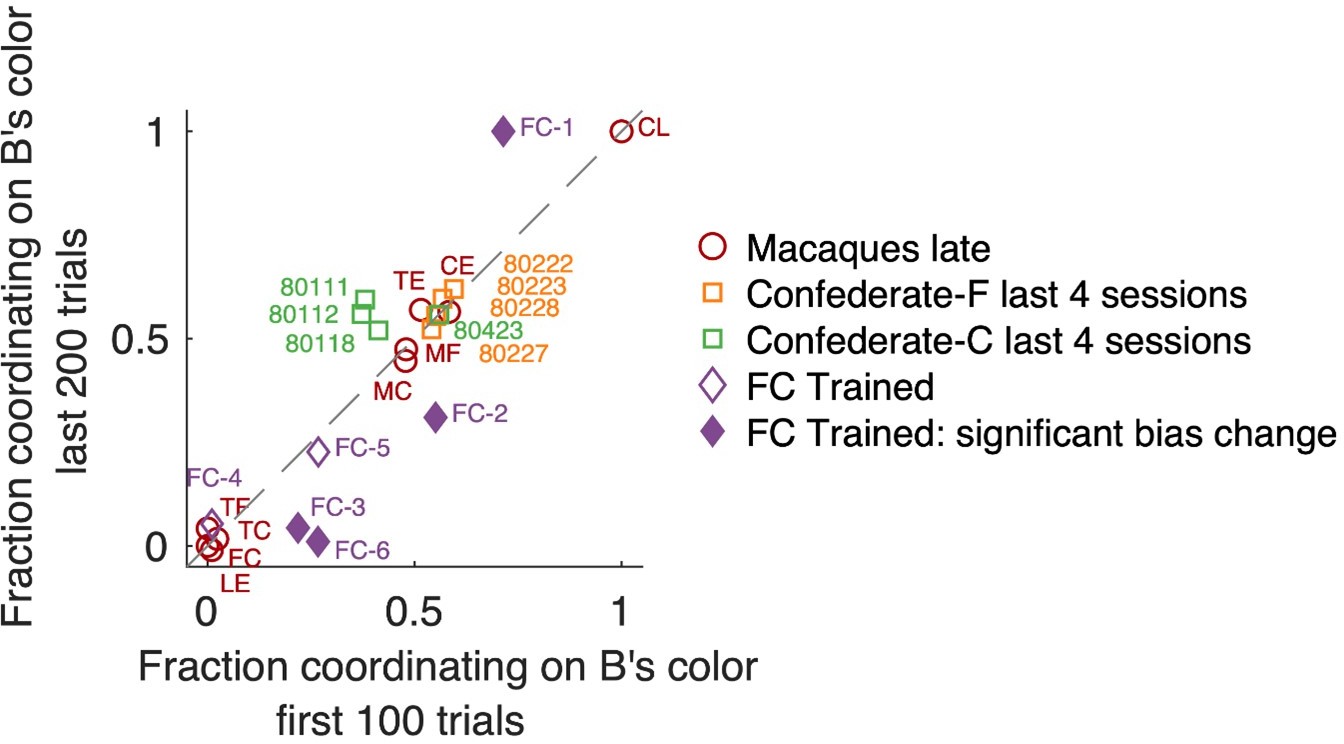
Fraction of coordination on B’s preferred color, in early and late trials.
Note that “fraction coordinating on B’s color” is complementary to “fraction coordinating on A’s color”; here we present data from B’s perspective because macaques were B agents when training with the confederate. Changes between early and late trials are visible as deviation from the unity diagonal. Individual sessions that exhibited a significant change are shown by filled symbols (Fisher’s exact test on counts of coordinating on B’s color vs A’s color with Bonferroni correction for the number of tested sessions). Locations in the upper right quadrant denote a bias for coordinating on B’s color, locations in the lower left quadrant a bias in coordinating on A’s preferred color. Monkeys F (orange) and C (green) in late confederate training sessions showed balanced selfish/benevolent coordination throughout each session, as well as 4 late macaque pairs that coordinated on a fixed side (center area). Macaque pairs coordinating on a fixed color (located around [0,0] or [1,1]) also did not shift their behavior in the course of a session.
Author response image 5
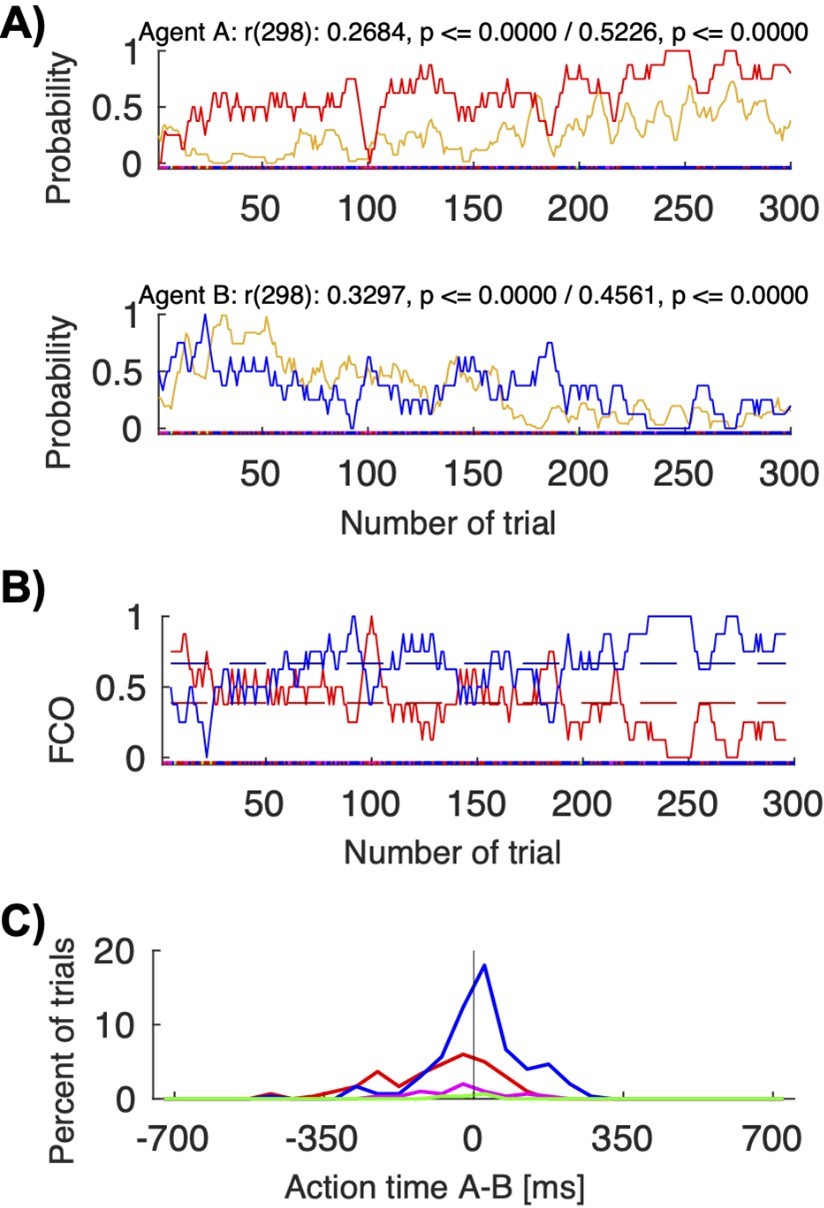
Action visibility and action time differences.
(A) This panel repeats Figure 6B for convenience; it shows the correlation between probability of seeing the other move first (in yellow) and following to the other’s preferred target for human pair 12 (top/red for agent A; bottom/blue for agent B). (B) This panel shows the “fraction of choosing own” graph for the same pair (agent A’s in red, agent B’s in blue). The pair starts with a balanced fluctuations selecting both A’s and B’s colors and ends with mostly convergence on B’s color. (C) This panel shows the histogram of the action times for the different choice combinations (red: both choose A’s preferred color; blue: both choose B’s preferred color). The mean action time difference between agent A and agent B differed significantly when the pair coordinated on A’s color compared to B’s color (t-test: coordination on red (M: -88.15, SD: 128.96, N: 96) vs. blue (M: 12.44, SD: 109.49, N: 180), t(168.8392): -6.4951, p < 0.00001). In other words, when jointly selecting red, A was on average 88 ms faster than B; when jointly selecting blue, A was on average 12 ms slower than B..
Additional files
-
Supplementary file 1
Table S1: human pairs.
- https://cdn.elifesciences.org/articles/81641/elife-81641-supp1-v2.pdf
-
Supplementary file 2
Table S2: sequence of macaque pairings and confederate training sorted by the start date, and action times.
- https://cdn.elifesciences.org/articles/81641/elife-81641-supp2-v2.pdf
-
Supplementary file 3
Table S3: action time correlations in macaque pair FC.
- https://cdn.elifesciences.org/articles/81641/elife-81641-supp3-v2.pdf
-
Supplementary file 4
Table S4: action time correlations in humans.
- https://cdn.elifesciences.org/articles/81641/elife-81641-supp4-v2.pdf
-
Supplementary file 5
Appendix 1: Supplementary materials and methods.
- https://cdn.elifesciences.org/articles/81641/elife-81641-supp5-v2.pdf
-
MDAR checklist
- https://cdn.elifesciences.org/articles/81641/elife-81641-mdarchecklist1-v2.docx
Download links
A two-part list of links to download the article, or parts of the article, in various formats.
Downloads (link to download the article as PDF)
Open citations (links to open the citations from this article in various online reference manager services)
Cite this article (links to download the citations from this article in formats compatible with various reference manager tools)
Human and macaque pairs employ different coordination strategies in a transparent decision game
eLife 12:e81641.
https://doi.org/10.7554/eLife.81641


