Structure of the GOLD-domain seven-transmembrane helix protein family member TMEM87A
- Department of Molecular and Cell Biology, University of California, Berkeley, United States
- Helen Wills Neuroscience Institute, University of California, Berkeley, United States
- California Institute for Quantitative Biology (QB3), University of California, Berkeley, United States
Figures
Figure 1 with 3 supplements
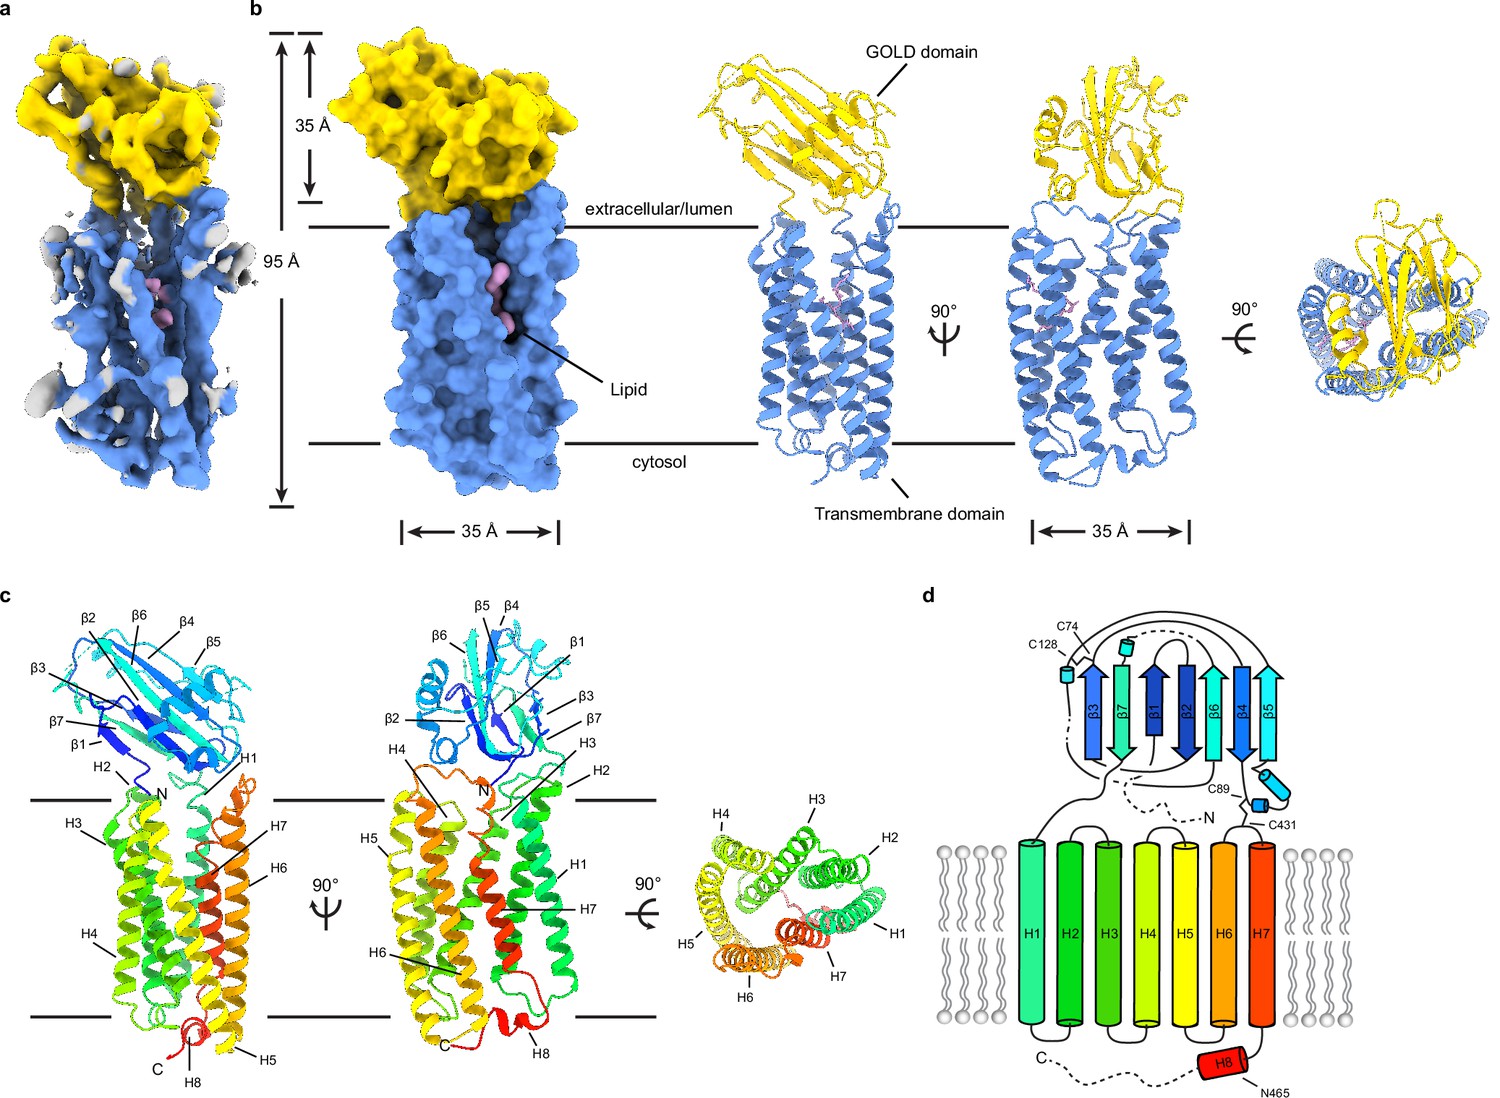
Structure of TMEM87A in lipid nanodiscs.
(a) 4.7 Å cryo-EM map and (b) model for TMEM87A viewed from the plane of the membrane and the extracellular or lumenal side (right). The GOLD domain is colored yellow, seven-transmembrane domain colored blue, and modeled phospholipid colored pink. (c) TMEM87A with rainbow coloring from N-terminus (blue) to C-terminus (red). (d) Corresponding cartoon of domain topology with rainbow coloring from N-terminus (blue) to C-terminus (red). Positions of disulfide bonds and residues noted in the text are indicated. EM, electron microscopy.
Figure 1—figure supplement 1
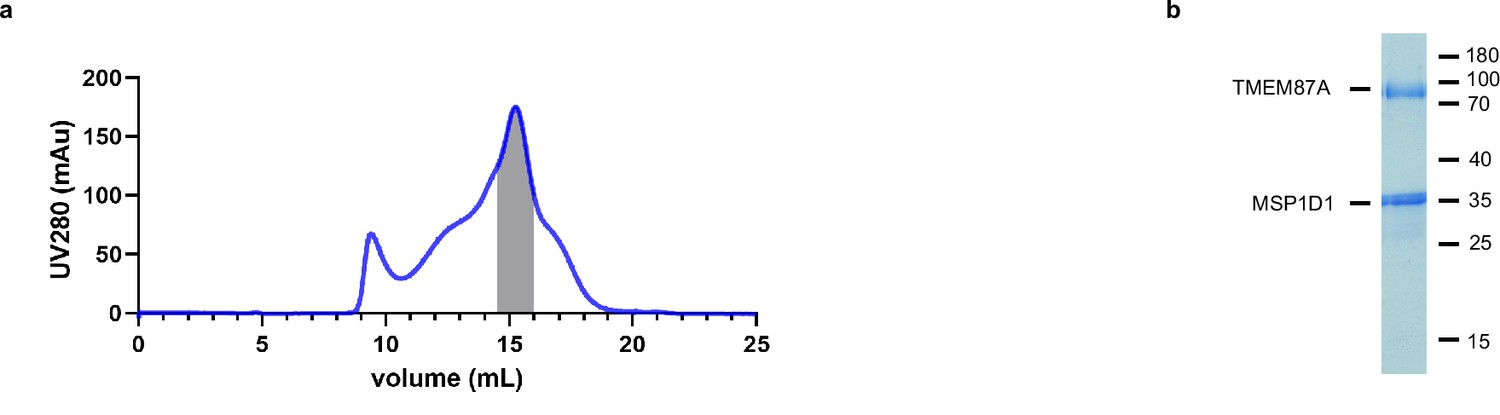
TMEM87A biochemistry.
(a) Size-exclusion chromatogram and (b) Coomassie stained SDS-PAGE gel showing the purification and reconstitution of TMEM87A in lipid nanodiscs. Shaded region corresponds to pooled fractions collected. Samples were run on a Superose 6 column.
Figure 1—figure supplement 2
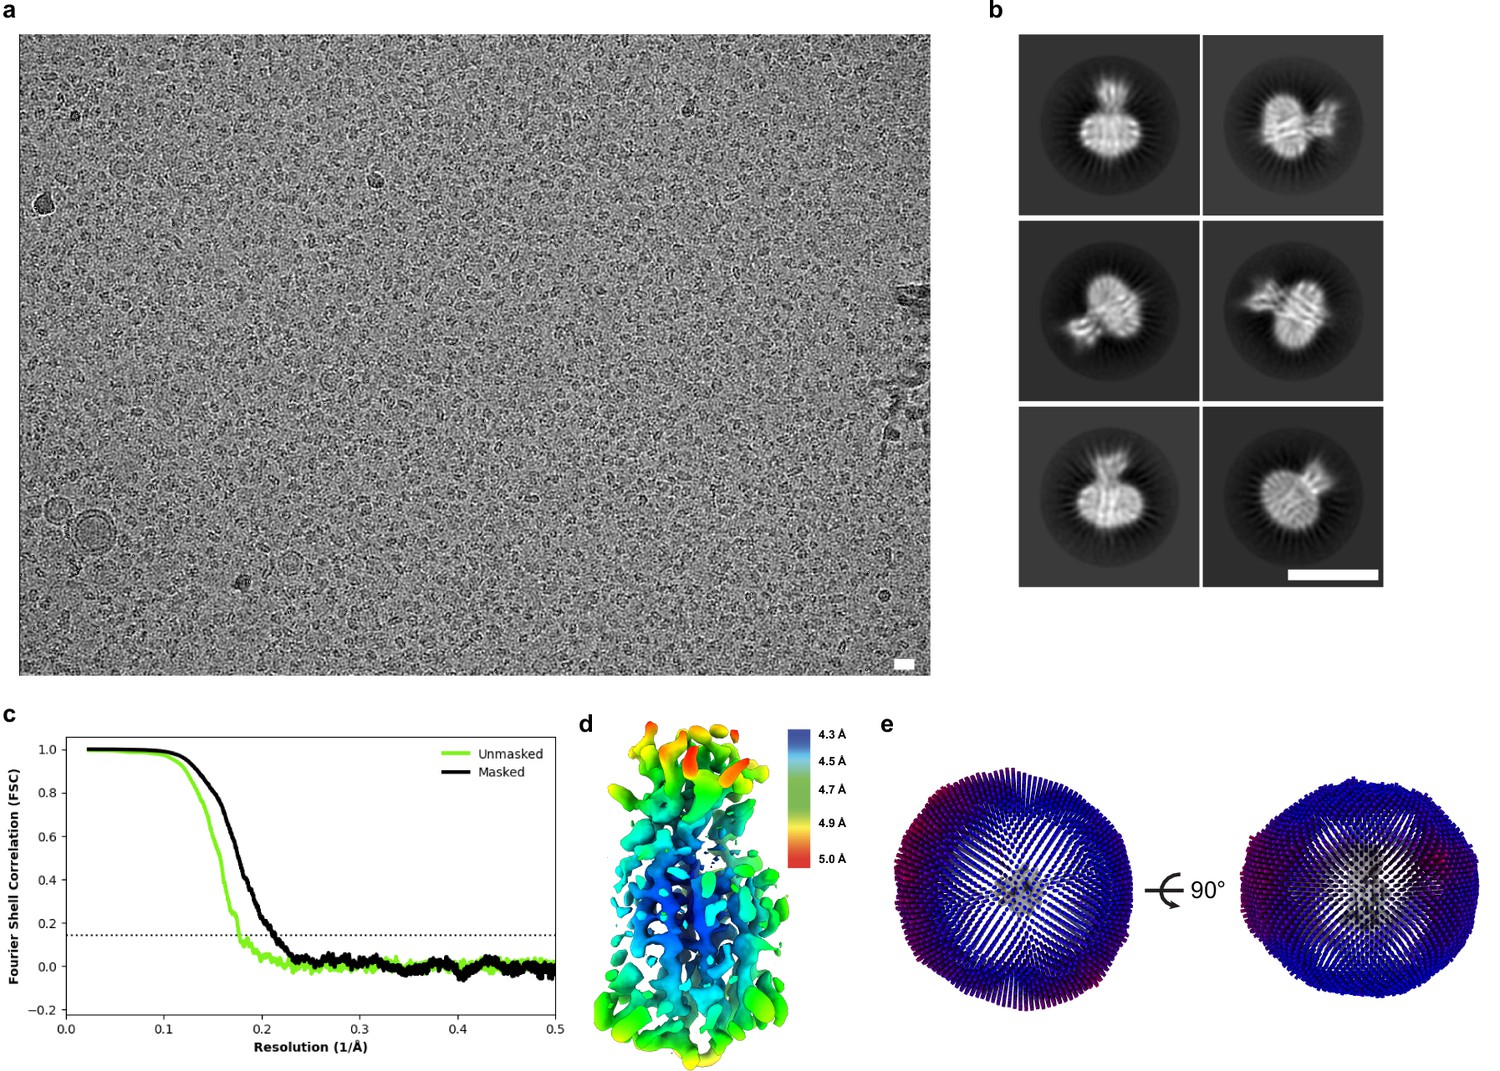
Cryo-EM data, processing, and validation.
(a) Representative micrograph (scale bar = 150 Å). (b) Selected 2D class averages (scale bar = 100 Å). (c) Fourier shell correlations between the two corrected and masked (black) and unmasked (green) half maps. (d) Relion-estimated local resolution colored on the cryo-EM map in rainbow. (e) Angular distributions for particles used in the final refinement.
Figure 1—figure supplement 3
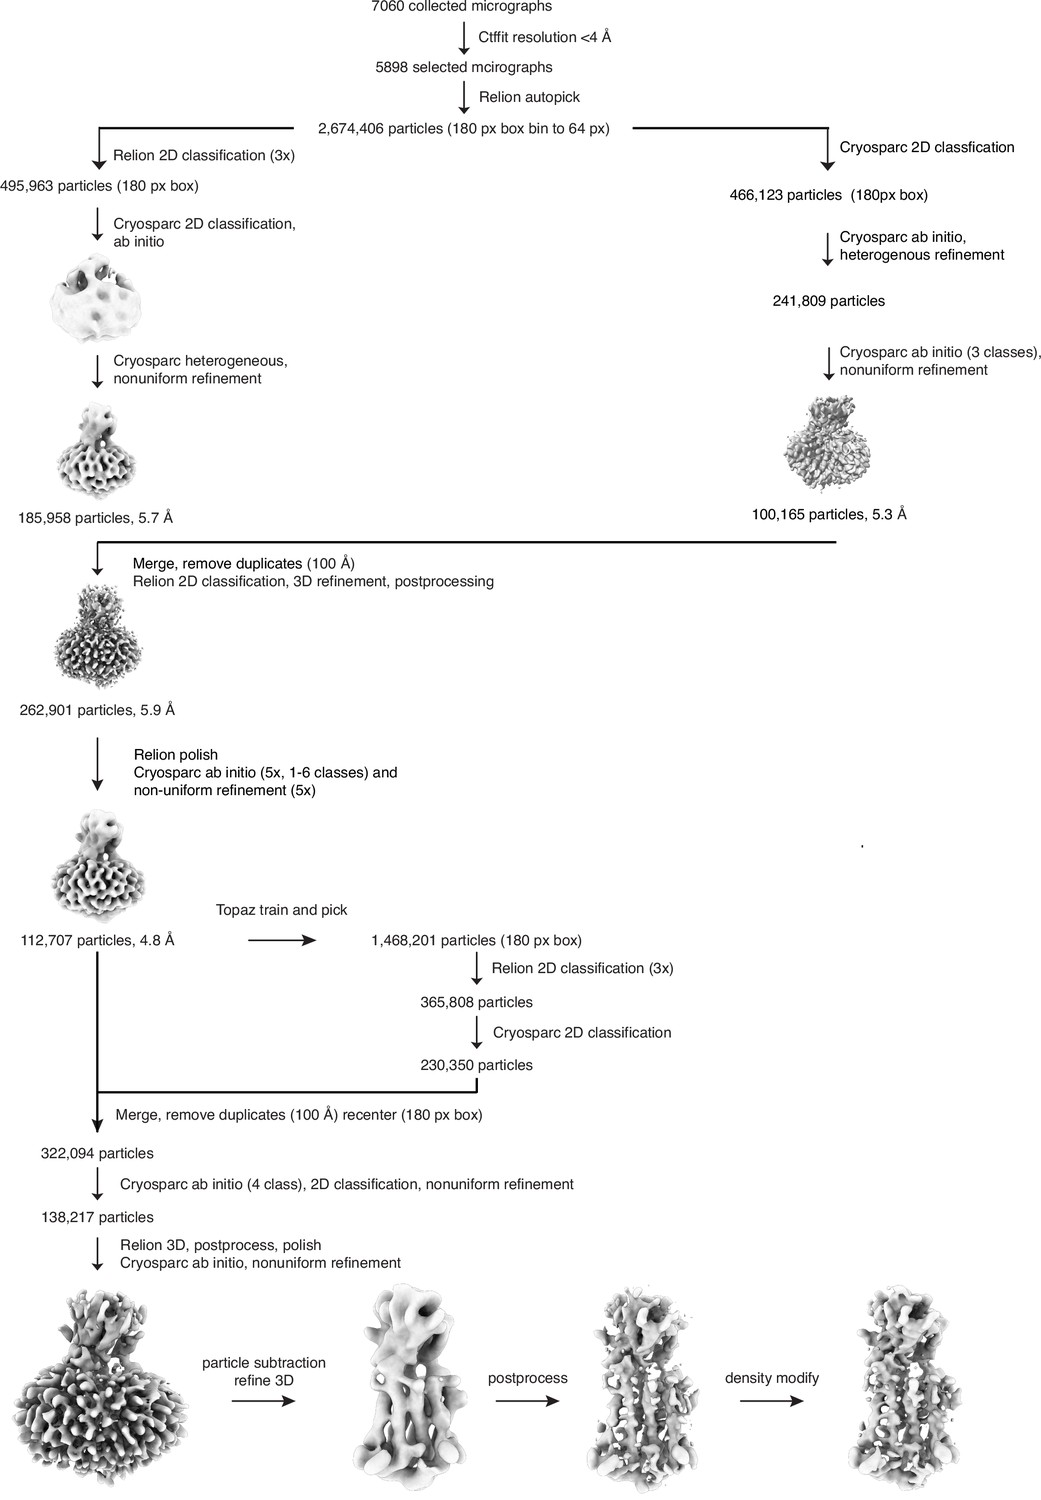
Cryo-EM data processing pipeline.
See Materials and methods for details.
Figure 2 with 3 supplements

The TMEM87A transmembrane domain and comparison to an A class GPCR.
(a) View of the TMEM87A model from the ‘back’ in the plane of the membrane and zoomed view highlighting the position of helix 8 with residue N465 indicated (corresponding to TMEM87B N456D implicated 2q13 deletion syndrome). (b) Overlay of TMEM87A (blue) and β1 adrenergic receptor (mgβ1AR PDB: 2Y00, orange) transmembrane domains. (c) Overlay of mgβ1AR alone (PDB: 2Y00, orange), in complex with arrestin (PDB: 6TKO, red) in complex with heterotrimeric Gi-proteins (PDB: 7S0F, pink). (d, e) Overlay of TMEM87A (blue) and (d) arrestin (red surface) or (e) heterotrimeric Gi (pink surface) from mgβ1AR complex structures(PDB: 6TKO, 7S0F). Helix 8s (H8s) are colored shades of green and denoted with asterisks.
Figure 2—figure supplement 1
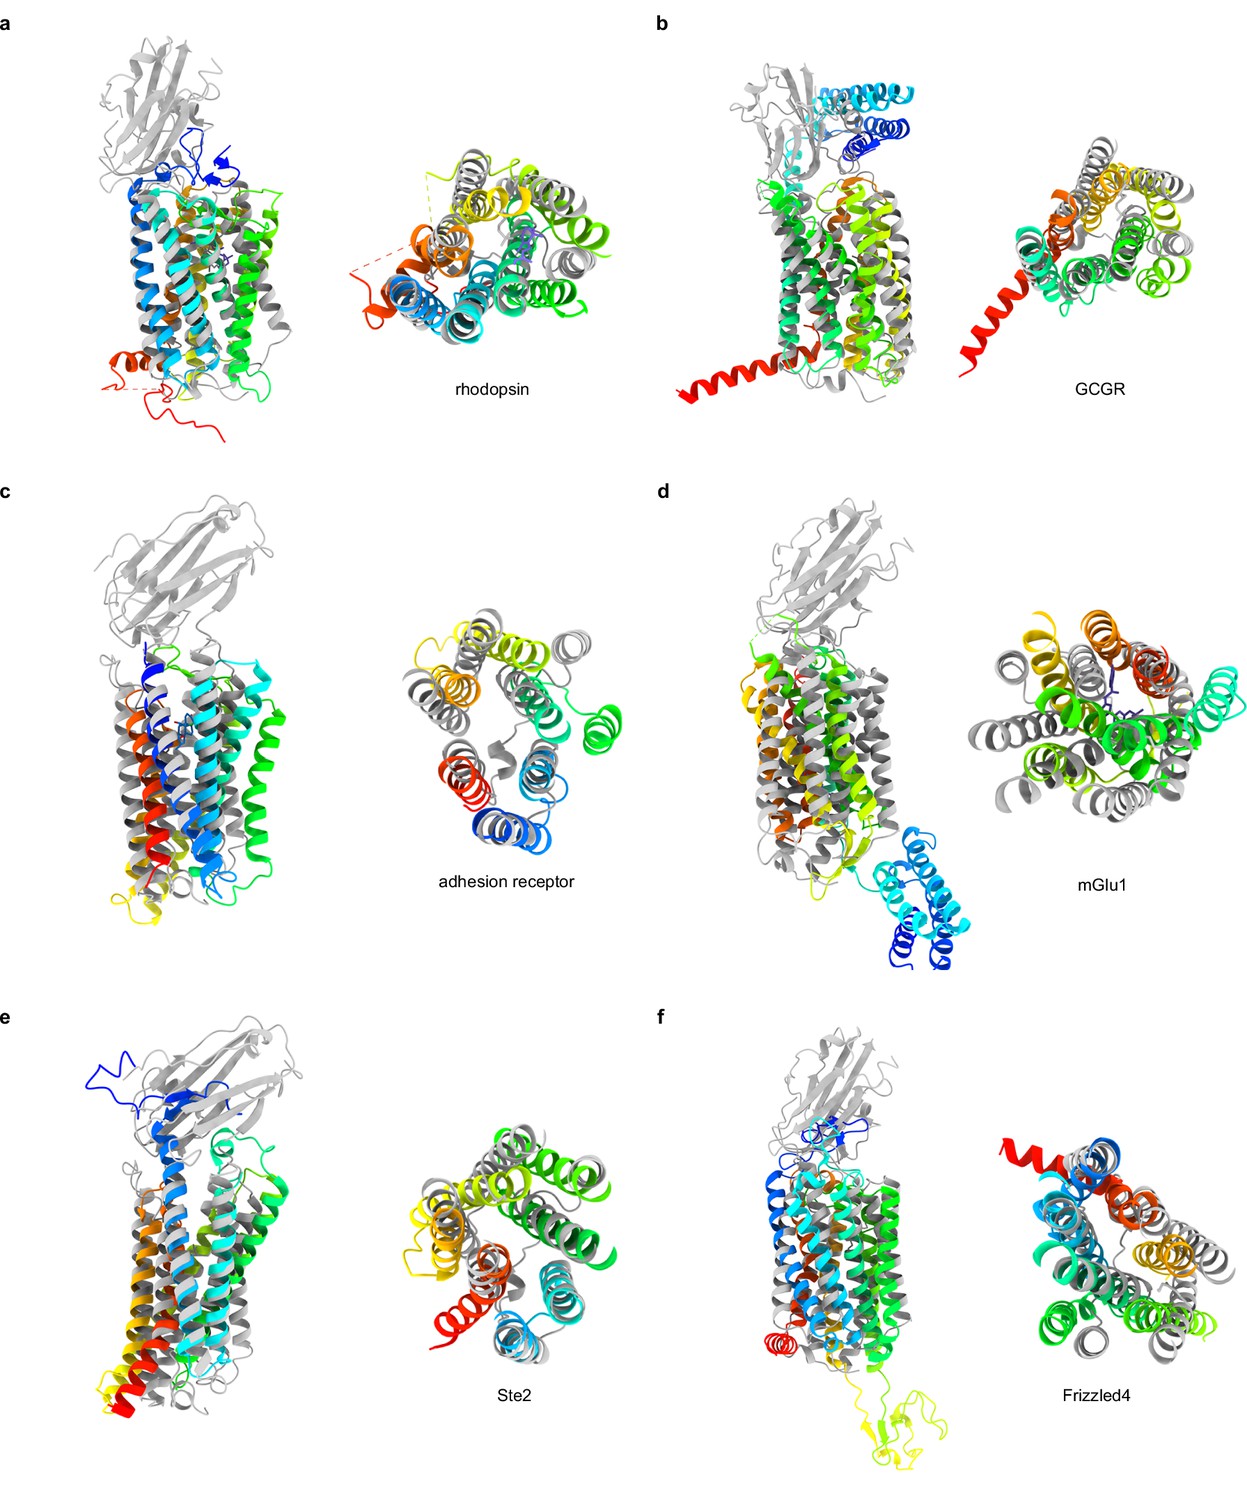
Comparison of TMEM87A and GPCR structures.
(a–f) Overlay of TMEM87A (gray) with GPCR structures (rainbow from N-terminus (blue) to C-terminus (red)) viewed from the membrane plane (left) and above (right) in a 90° rotated view. (a) Class A GPCR bovine Rhodopsin (PDB 1F88). (b) Class B1 GPCR human glucagon receptor (GCGR) (PDB 4L6R). (c) Class B2 GPCR human adhesion receptor GPR97 (PDB 7D76). (d) Class C GPCR human metabotropic glutamate receptor 1 (mGluR1) (PDB 4OR2). (e) Class D GPCR yeast Ste2 (PDB 7AD3). (f) Class F GPCR human Frizzled 4 (PDB 6BD4).
Figure 2—figure supplement 2
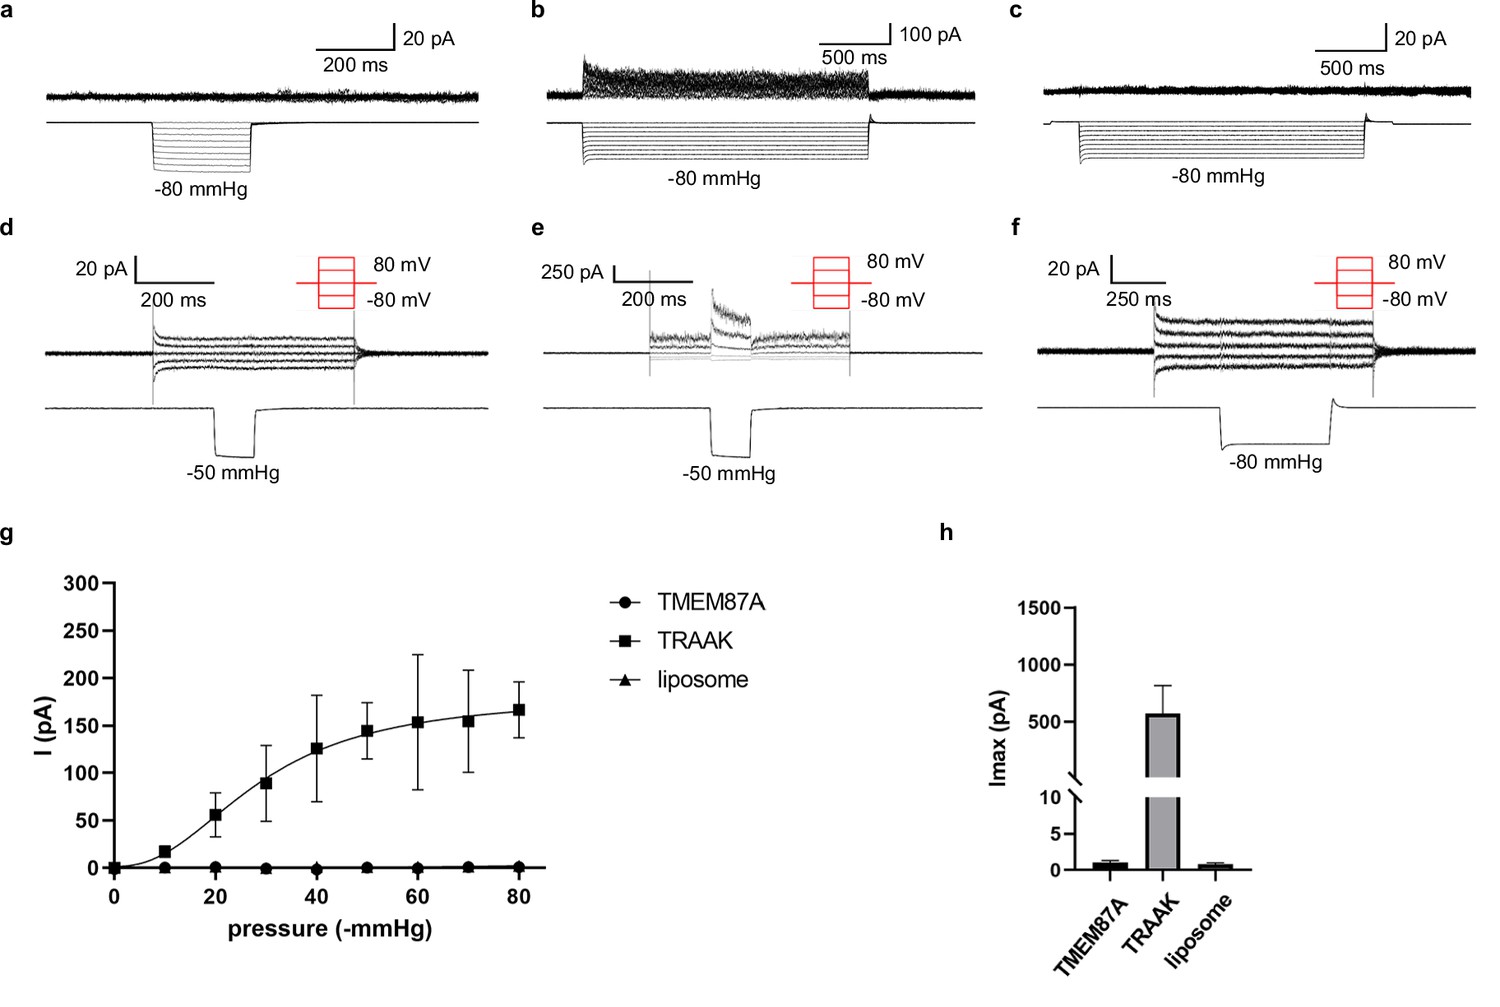
TMEM87A proteoliposome recordings.
(a–c) Current (above) recorded during steps of increasing pressure (below) at a holding potential of 60 mV from a representative (a) TMEM87A-, (b) TRAAK-, and (c) mock-reconstituted proteoliposome patch. (d–f) Current (above) recorded during voltage steps (red schematic) during which a pressure step of –50 or –80 mmHg is applied from a representative (d) TMEM87A-, (e) TRAAK-, and (f) mock-reconstituted proteoliposome patch. (g) Average current versus pressure plot from recordings as in (a–c) for TMEM87A- (circles, n=9), TRAAK- (squares, n=5), and mock-reconstituted proteoliposomes (triangles, n=7). (h) Plot of maximum pressure (–80 mmHg) induced current observed from recordings as in (a–c) for TMEM87A- (Imax: 1.05±0.52 pA, n=4), TRAAK- (Imax: 572±489 pA, n=4), and mock-reconstituted proteoliposome patch (Imax: 0.78±0.60 pA, n=7).
Figure 2—figure supplement 3
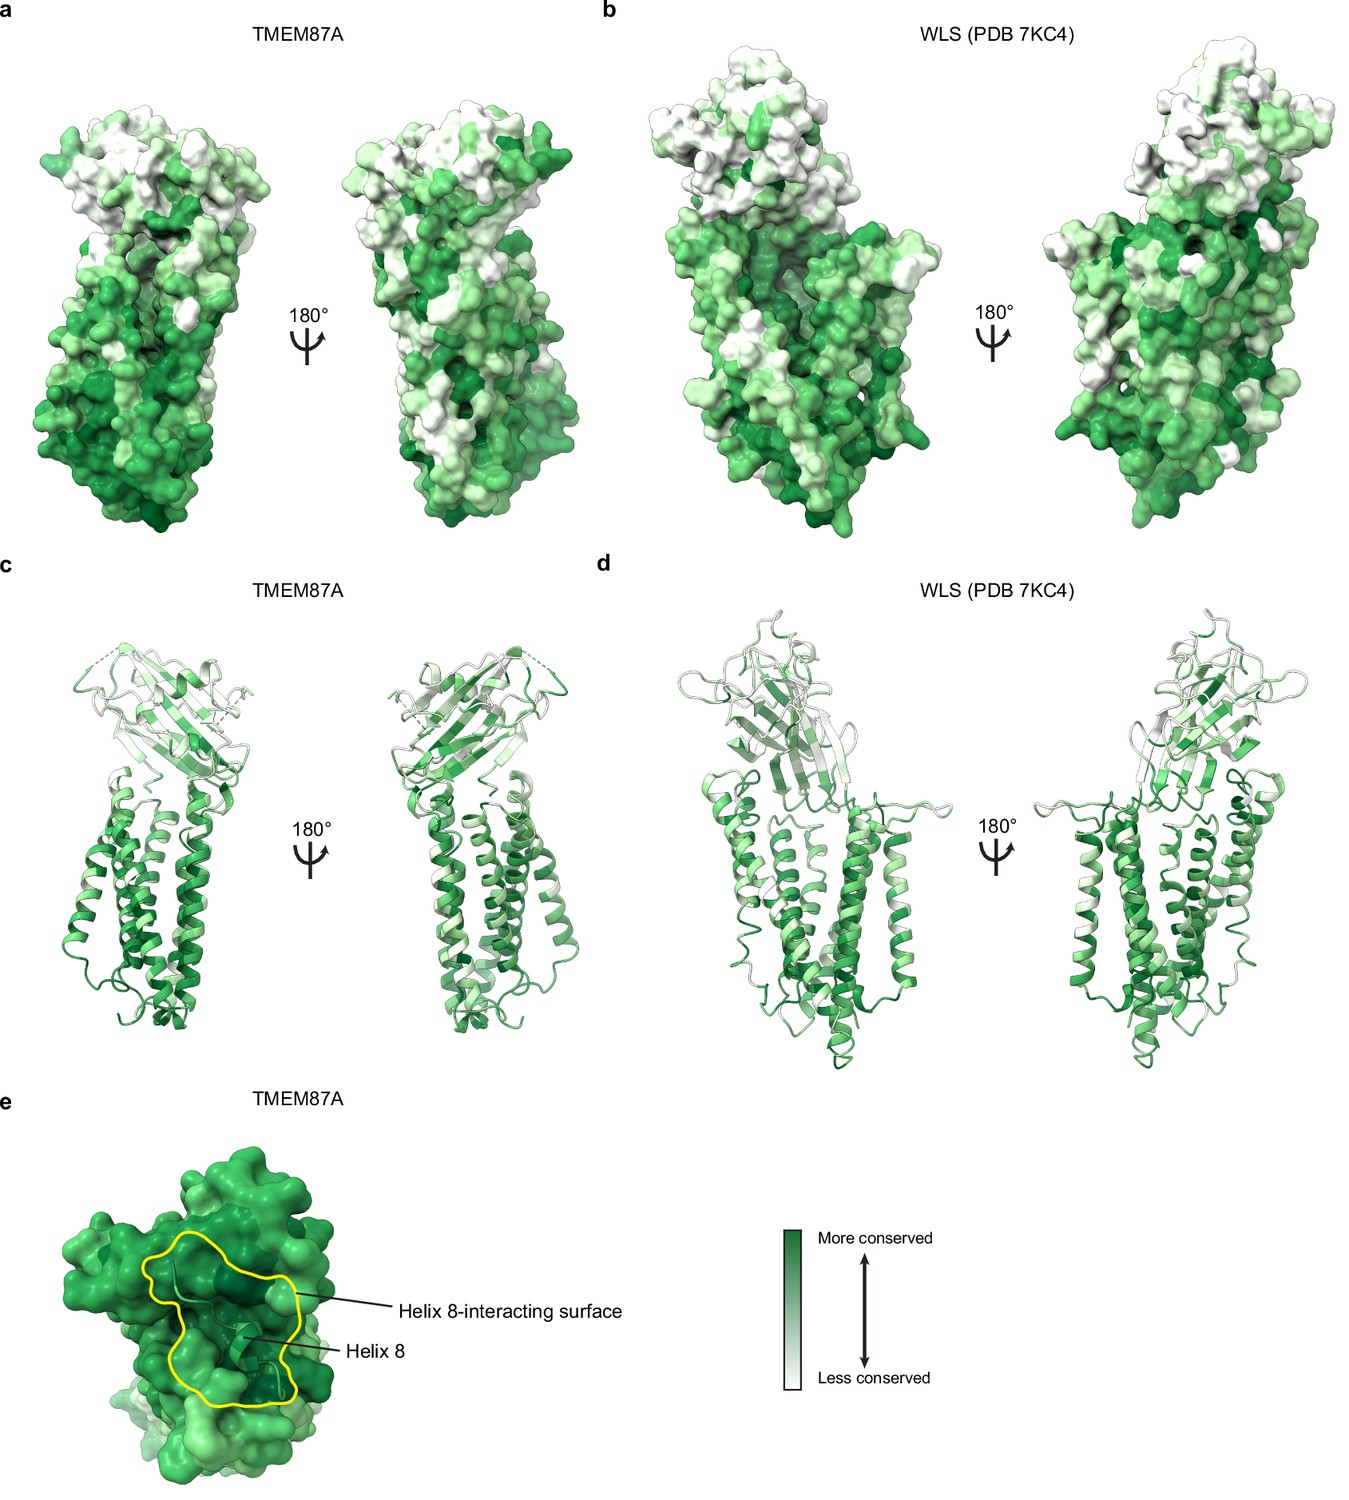
Conservation of TMEM87A and WLS.
(a, c) TMEM87A structure colored according to conservation of each residue, from white (less conserved) to dark green (more conserved), on surface and ribbon representations respectively. (b, d) WLS structure colored according to conservation of each residue, from white (less conserved) to dark green (more conserved), on surface and ribbon representations respectively. (e) Helix 8 and its cytoplasmic interaction surface are highly conserved among TMEM87As. View of TMEM87A from the cytoplasm with helix 8 displayed as a cartoon and its interaction surface outlined in yellow.
Figure 3 with 2 supplements
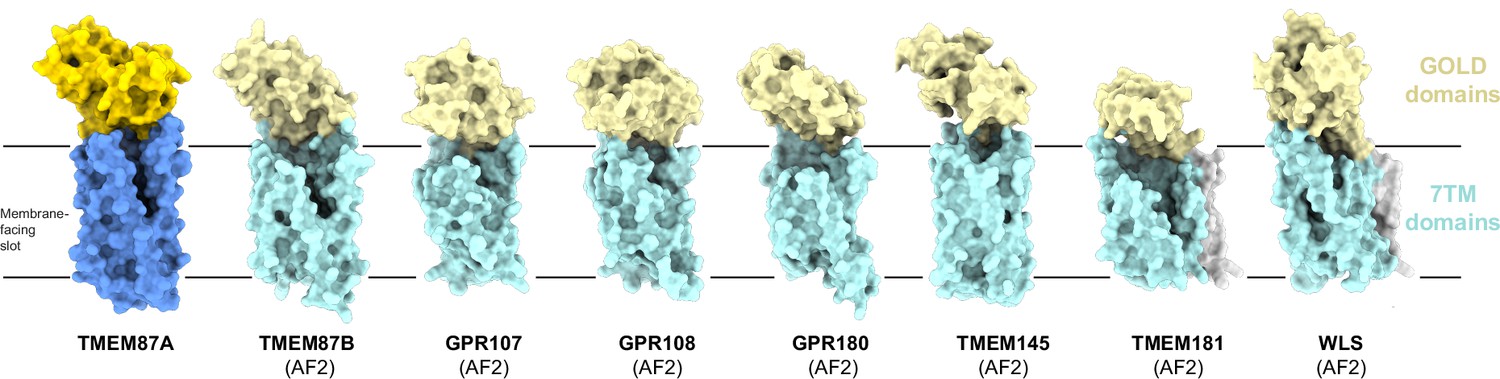
Predicted structural homology of GOST (GOLD domain seven transmembrane helix) family proteins.
Experimentally determined TMEM87A structure and AlphaFold2 predicted structures of all identified human GOST family proteins (TMEM87B, GPR107, GPR108, GPR180, TMEM145, TMEM181, and WLS) shown as surfaces in the same orientation from the membrane plane. GOLD domains are yellow, seven-transmembrane domains are blue, N-terminal helices (if present) are gray, and membrane-facing slots are outlined in pink. Low confidence (<80 pLDDT) regions of predicted structures are removed for clarity (full structures are displayed in Figure 3—figure supplement 2).
Figure 3—figure supplement 1
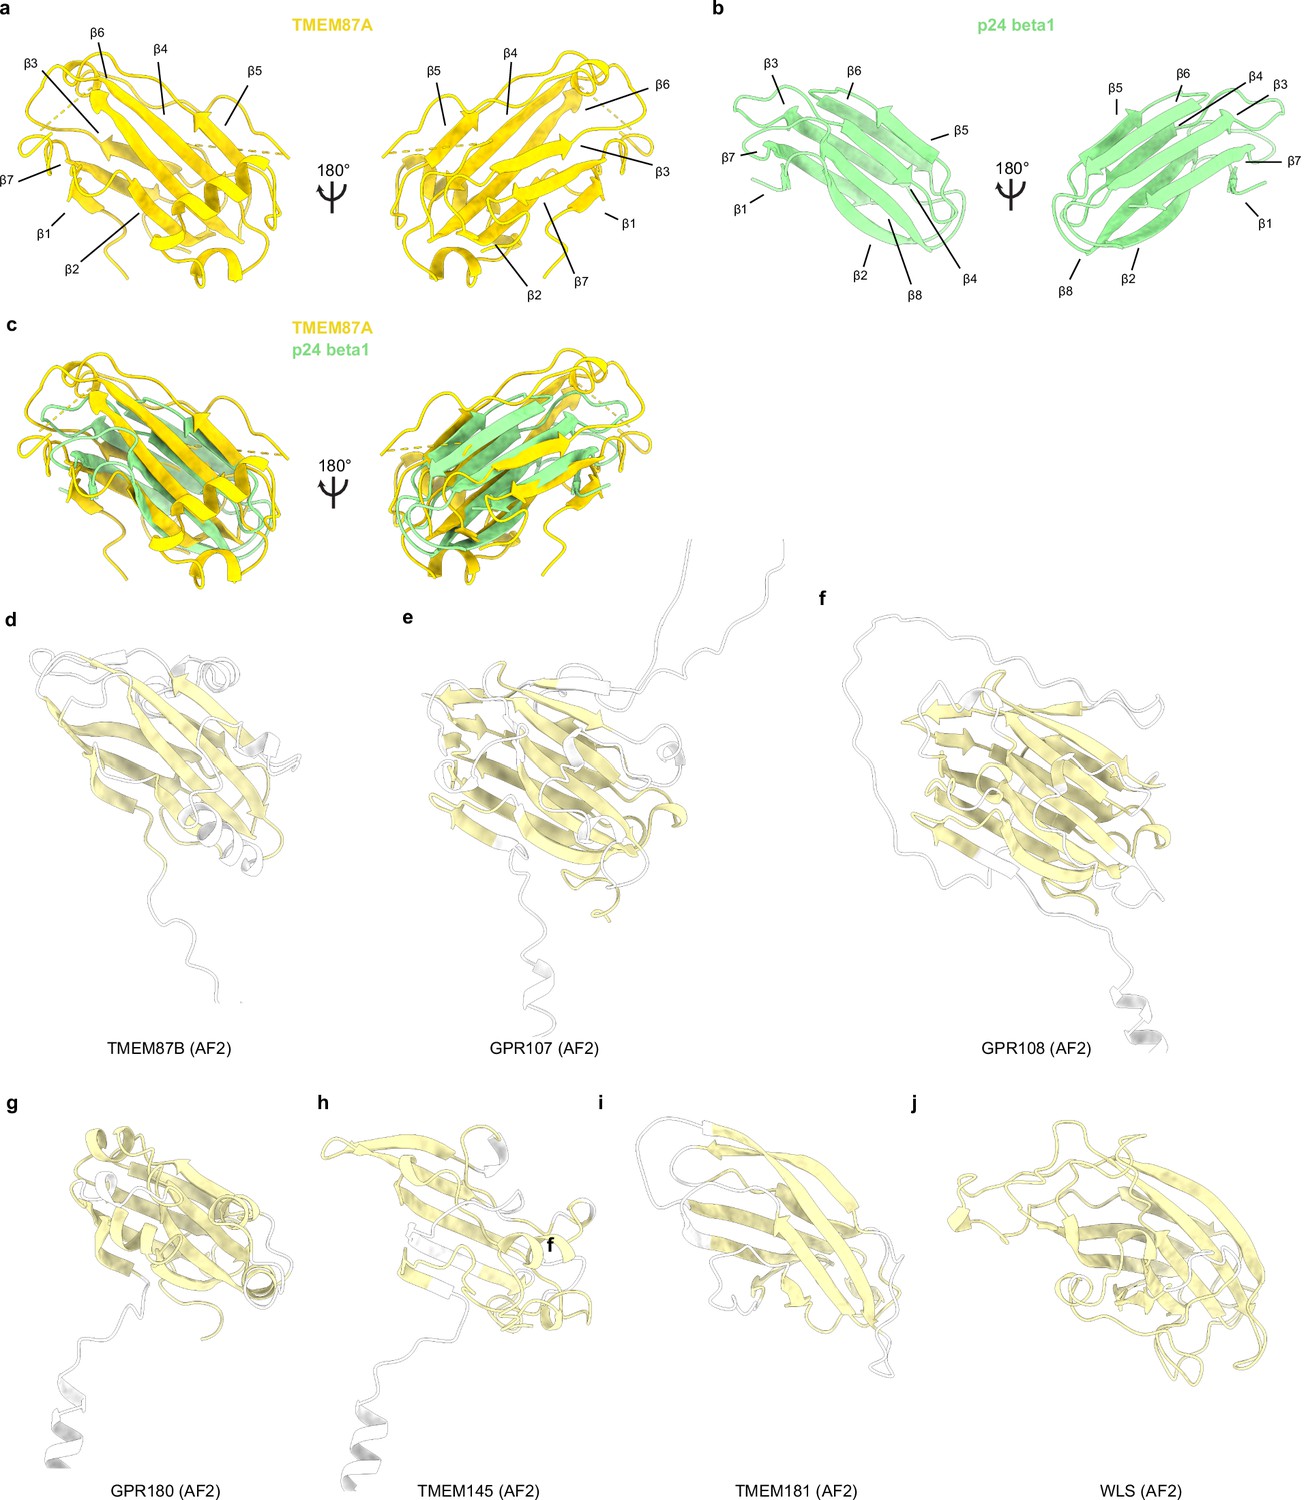
GOLD domain comparisons.
(a) GOLD domain from experimental TMEM87A structure. (b) p24 beta1 GOLD domain (PDB 5AZW) colored light green. (c) Overlay of TMEM87A and p24 GOLD domains. (d–j) GOLD domains from AlphaFold2 predicted structures for TMEM87B, GPR107, GPR108, GPR180, TMEM145, GPR181, and WLS, respectively, with GOLD domain colored light yellow and regions of low confidence (<80 pLDDT) colored white.
Figure 3—figure supplement 2
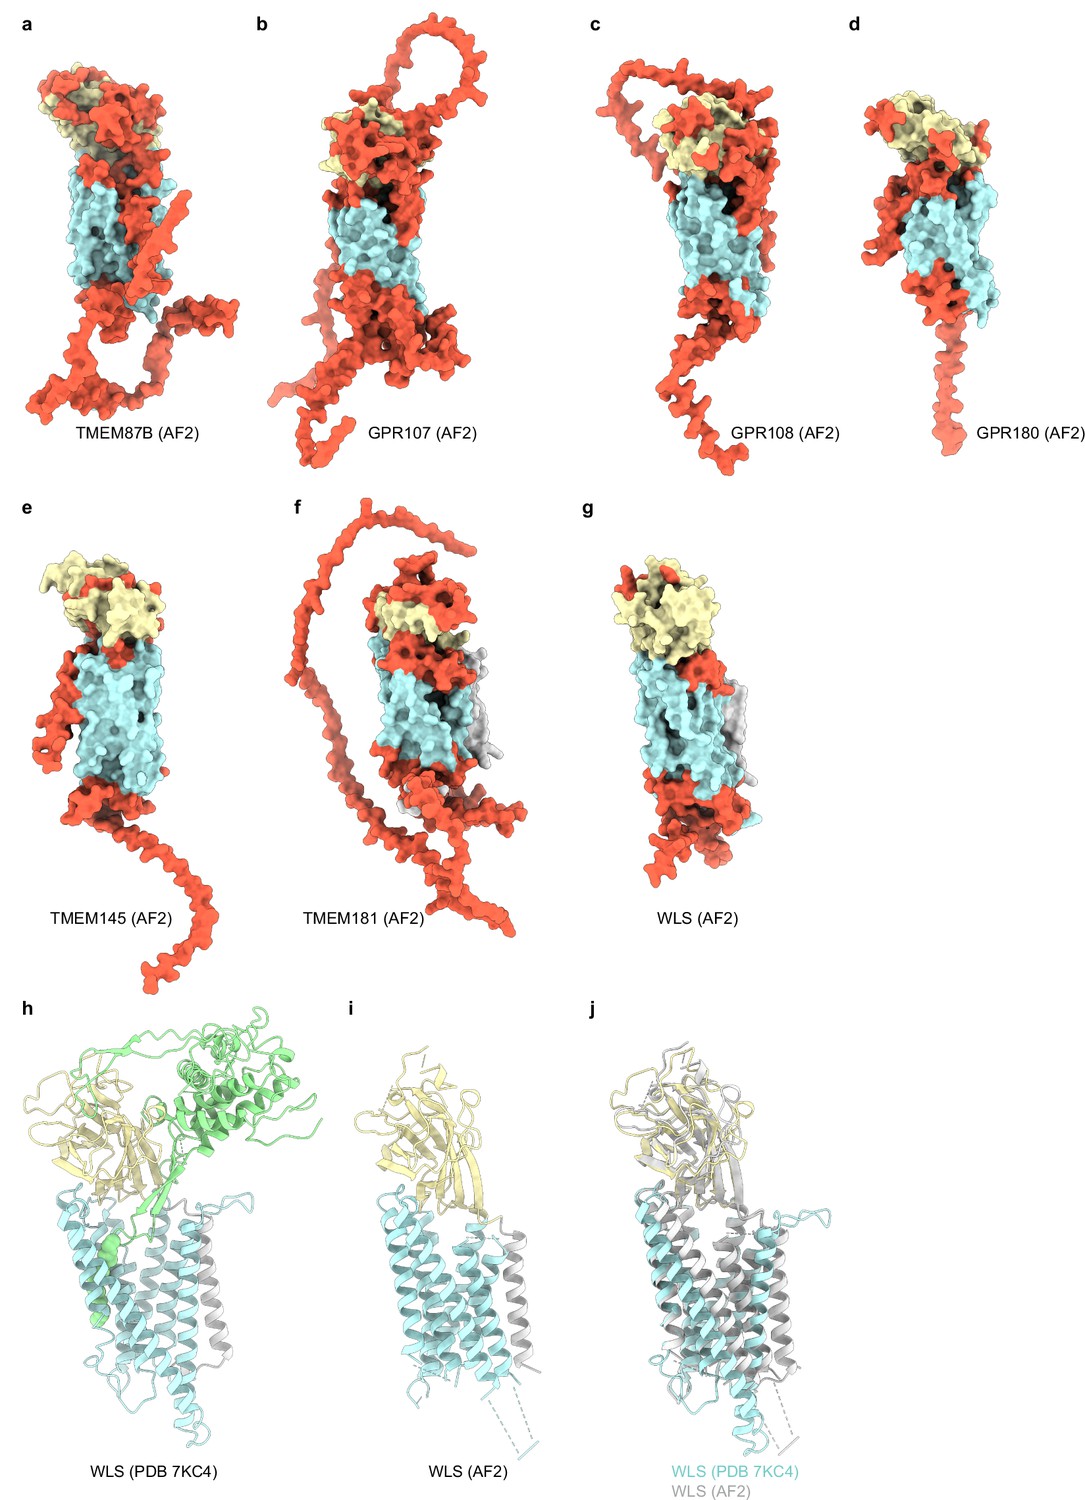
AlphaFold2 predictions of GOST family protein structures.
(a–g) Surface representations of TMEM87B, GPR107, GPR108, GPR180, TMEM145, GPR181, and WLS AlphaFold2 predicted structures. GOLD domains are yellow, seven-transmembrane domains are blue, N terminal helices are gray (if present), and regions of low confidence (<80 pLDDT) are orange. (h) Experimental WLS structure (7KC4) with GOLD domain yellow, transmembrane domain blue, N terminal helix gray, and Wnt8a green. (i) AlphaFold2 predicted WLS structure colored as (h). Low confidence regions with pLDDT<80 are removed for clarity. (j) Overlay of experimental and predicted WLS structures.
Figure 4

Structural comparison of TMEM87A and WLS bound to Wnt.
(a) WLS-Wnt8a complex structure (PDB: 7KC4) with WLS GOLD domain light yellow, the WLS seven-transmembrane domain light blue, the N terminal helix light gray, and Wnt8a light green. (b) Overlay of TMEM87A and WLS (PDB 7KC4) experimental structures, with TMEM87A GOLD domain colored yellow and TMEM87A transmembrane domain colored blue. Zoomed in views highlight the differences in relative domain orientation between TMEM87A and WLS. (c, d) Views of (c) TMEM87A and (d) WLS electrostatic surfaces. Scale is from –10 kbTec−1 to 10 kbTec−1.
Figure 5
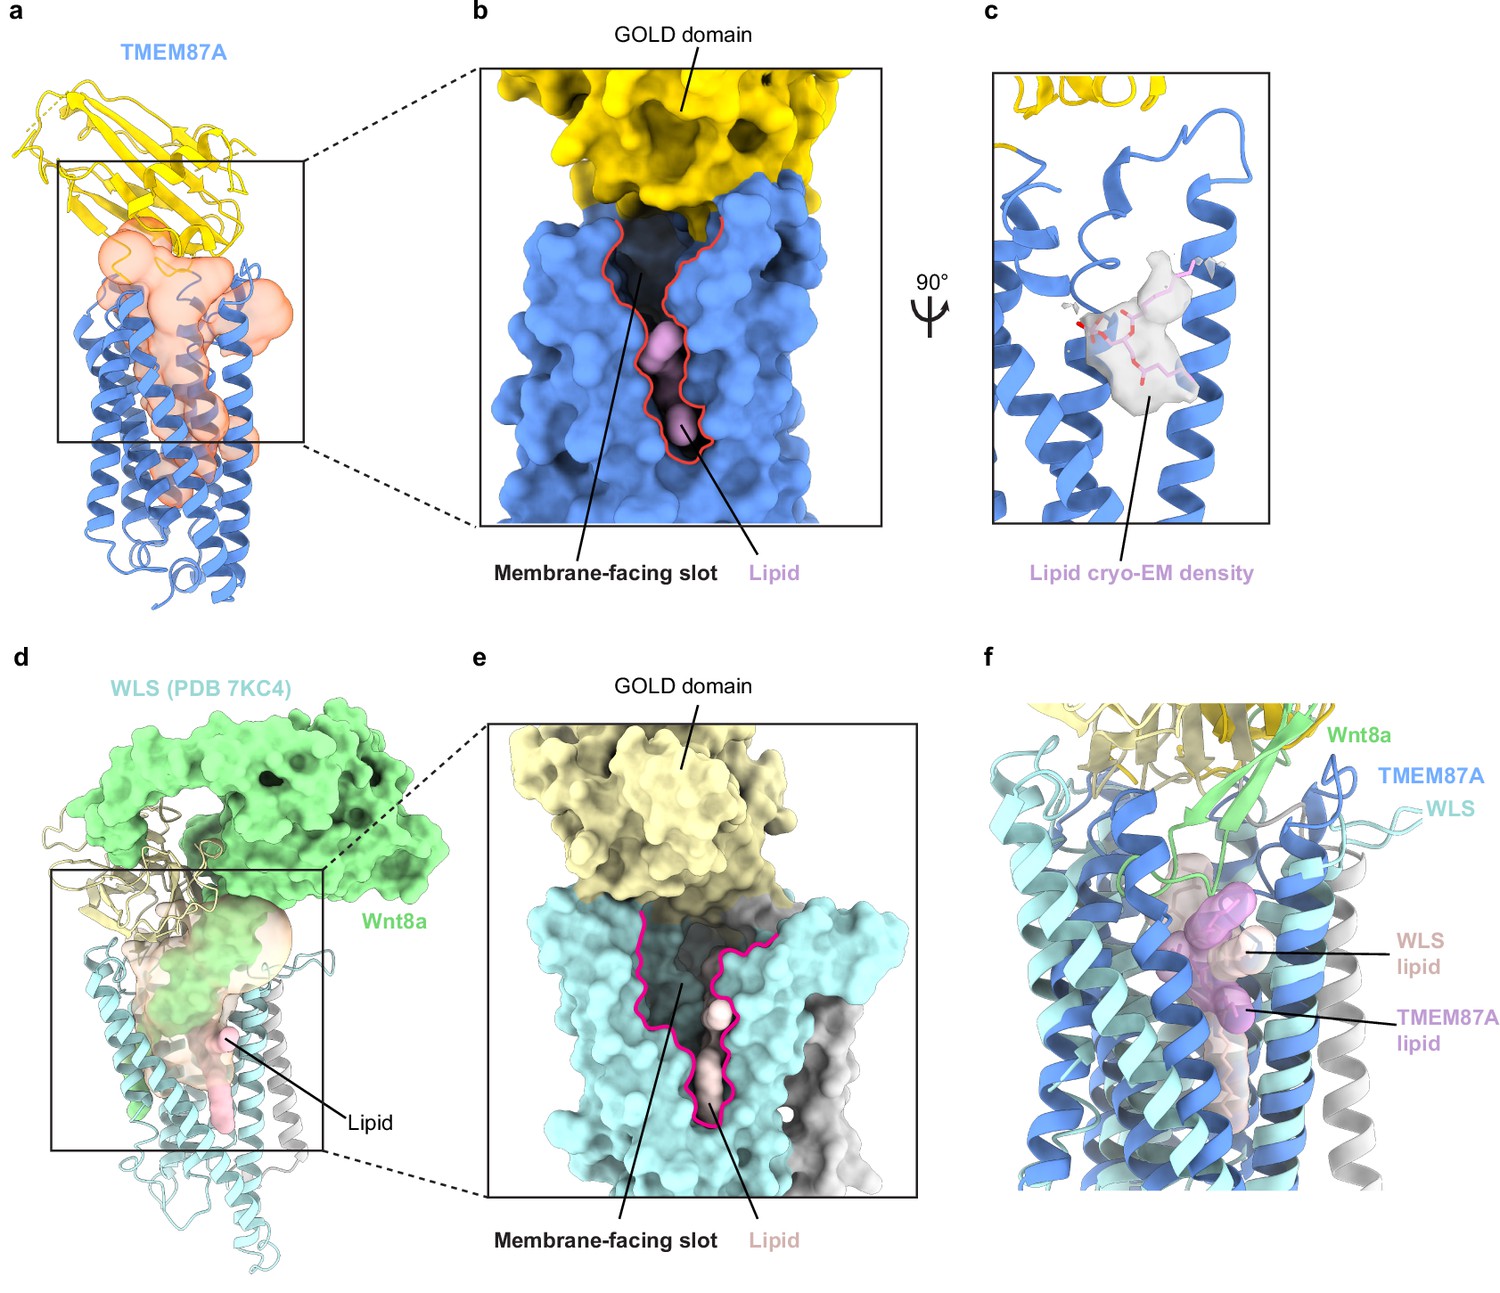
TMEM87A and WLS cavities are exposed to solution and membrane.
(a) TMEM87A structure with CASTp calculated internal cavity shown as a transparent orange surface. (b) Surface of TMEM87A with membrane-facing slot (red outline) connecting the cavity and upper leaflet of the bilayer highlighted. (c) Modeled phospholipid (pink) is shown as a surface (left) or within cryo-EM density (right). (d) WLS (PDB: 7KC4) structure with CASTp calculated internal cavity shown as a transparent yellow surface, with bound Wnt8a (pale green surface) and phospholipid (pink) shown filling the cavity. (e) Zoomed in view shows surface representation of WLS (PDB: 7KC4) with open membrane-facing slot (red outline) and phospholipid (pink). (f) Overlay of the experimental TMEM87A and WLS structures showing relative positions of the H6 membrane-facing slot and modeled phospholipids. EM, electron microscopy.
Additional files
-
Supplementary file 1
Cryo-EM data collection, processing, refinement, and modeling statistics.
- https://cdn.elifesciences.org/articles/81704/elife-81704-supp1-v2.docx
-
MDAR checklist
- https://cdn.elifesciences.org/articles/81704/elife-81704-mdarchecklist1-v2.pdf
Download links
A two-part list of links to download the article, or parts of the article, in various formats.
Downloads (link to download the article as PDF)
Open citations (links to open the citations from this article in various online reference manager services)
Cite this article (links to download the citations from this article in formats compatible with various reference manager tools)
Structure of the GOLD-domain seven-transmembrane helix protein family member TMEM87A
eLife 11:e81704.
https://doi.org/10.7554/eLife.81704


