Computational design of peptides to target NaV1.7 channel with high potency and selectivity for the treatment of pain
- Department of Physiology and Membrane Biology, University of California Davis, United States
- Department of Pharmacology, University of California Davis, United States
- Department of Entomology and Nematology & Comprehensive Cancer Center, University of California Davis, United States
- AnaBios Corporation, United States
- Ambiopharm Inc, United States
- Department of Anesthesiology and Pain Medicine, University of California Davis, United States
- Biophysics Graduate Group, University of California Davis, United States
Figures
Figure 1 with 2 supplements
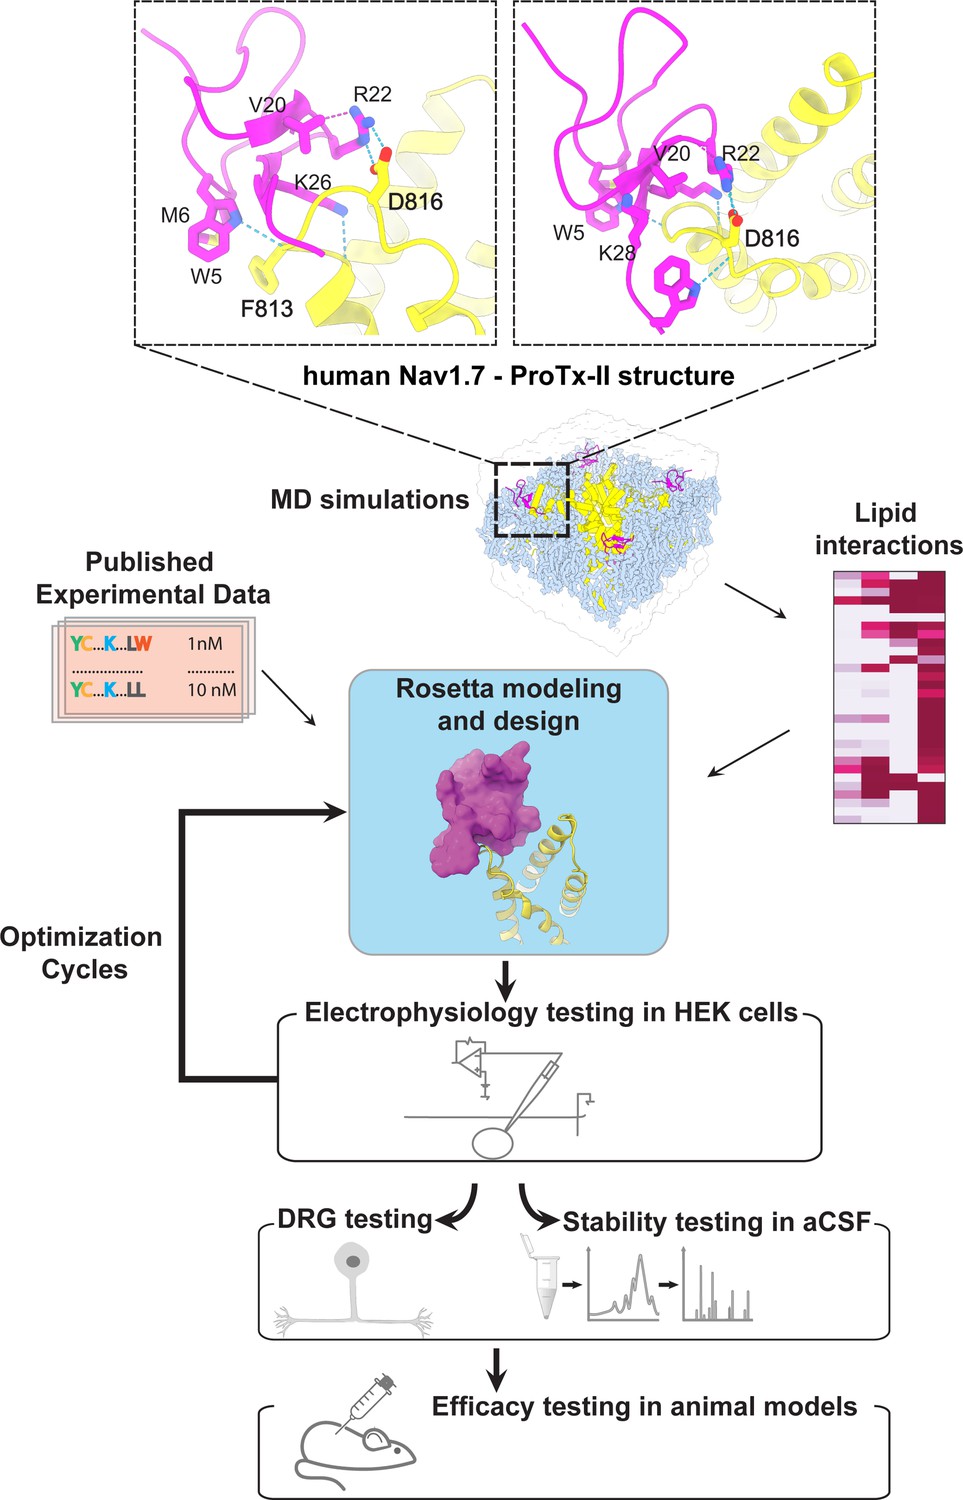
The ProTx-II based peptide optimization approach.
Top, transmembrane (left) and extracellular (right) views of the wild-type ProTx-II – hNav1.7 structure in a deactivated state (Xu et al., 2019) Key residues on the wild-type ProTx-II are shown in stick representation and labeled. Bottom, interdisciplinary peptide optimization approach involving Rosetta design, molecular dynamics (MD) simulations, peptide synthesis and folding, electrophysiological testing, peptide stability testing, efficacy in mouse and human DRG neurons, and efficacy in animal models of pain.
Figure 1—figure supplement 1
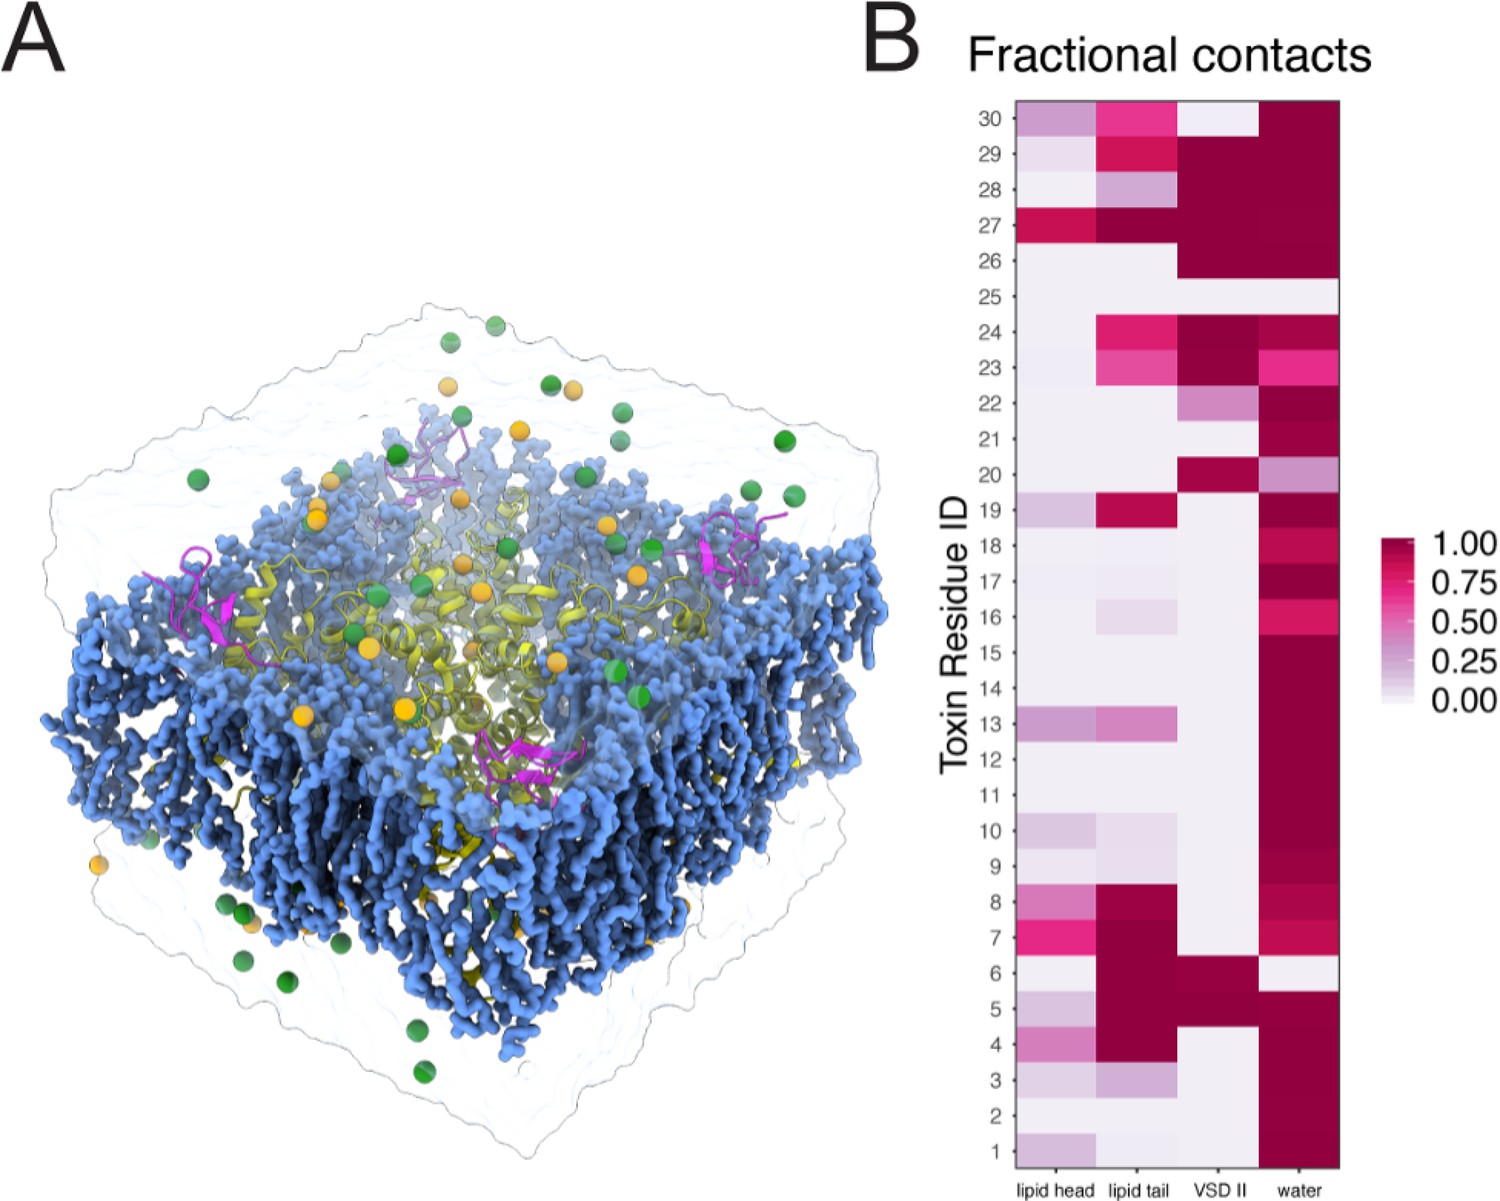
Molecular dynamics simulations setup for ProTx-II - human Nav1.7 complex.
Molecular dynamics simulation of the NavAb/hNav1.7 – ProTx-II complex. (A) A simulation system containing NavAb/hNav1.7 chimeric channel (yellow ribbon), ProTx-II (magenta ribbon), POPC lipid (blue blob), sodium ions (yellow sphere), chloride ion (green sphere), water (transparent surface). (B) Heatmap showing fractional contacts of ProTx-II residues with the surrounding environment categorized as lipid tail, lipid head, VSDII, and water normalized over the time course of the simulation.
Figure 1—figure supplement 2
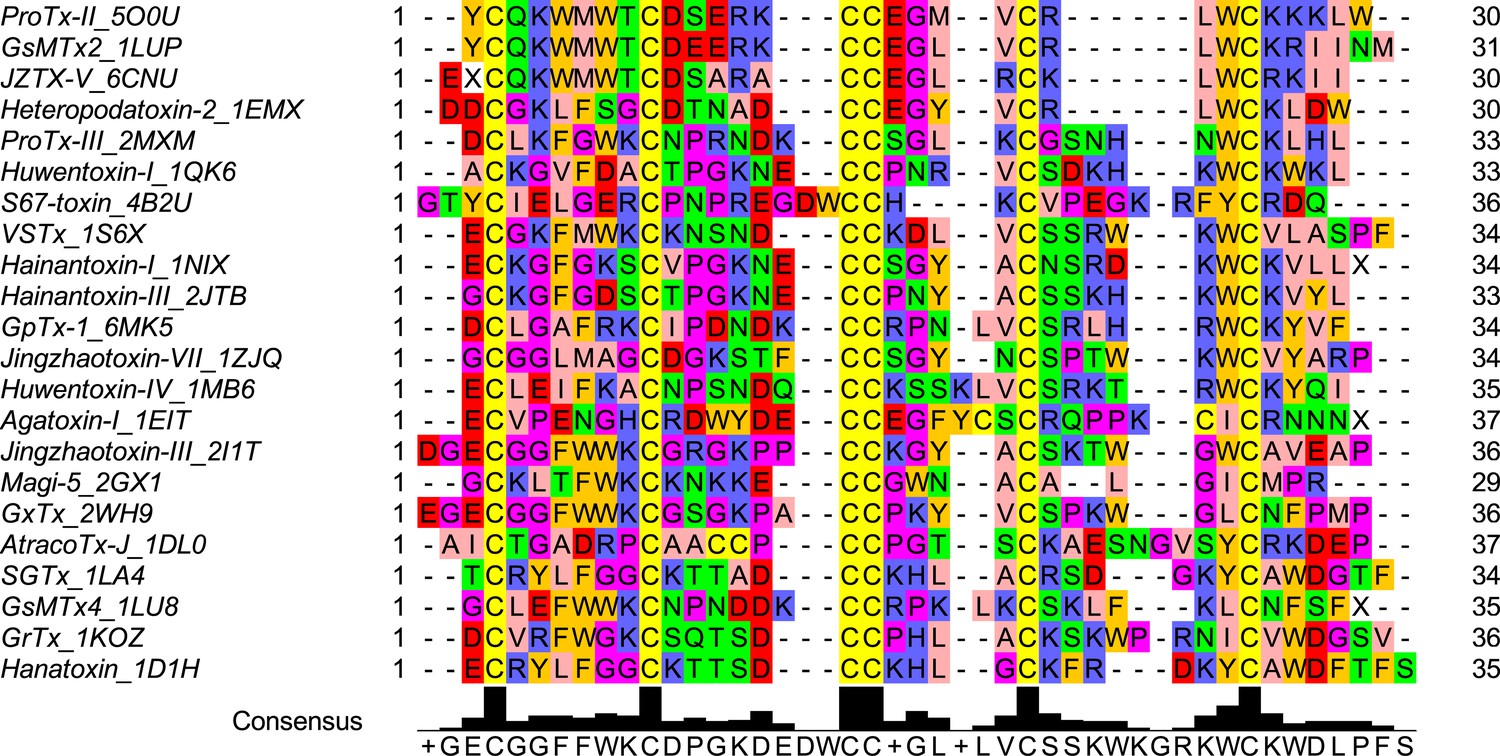
Multiple sequence alignment of the wild-type ProTx-II and homologous peptide toxins.
Each peptide toxin sequence name includes 4 letter PDB ID code for the corresponding structure.
Figure 2 with 1 supplement

The first optimization round.
(A) Sequence alignment of the wild-type ProTx-II with PTx2-2954 and PTx2-2955 peptides. (B) Transmembrane (left panel) and extracellular (right panel) views of the PTx2-2955 – hNaV1.7 model. Key residues on the PTx2-2955 and hNaV1.7 are shown in stick representation and labeled. Nitrogen atoms are colored in blue and oxygen atoms are colored in red. Hydrogen bonds between donor and acceptor atoms are shown by blue dash line. (C) Block of whole-cell hNaV1.7 sodium currents by application of increasing concentrations of PTx2-2955 and followed by 1 mM of wild-type ProTx-II as indicated. (D) Inhibition of hNaV1.7 currents was measured as shown in C and plotted as a function of WT ProTx-2 or PTx2-2955 concentration. Fitting the Hill equation to the data yielded IC50 values (95% confidence interval) of 1.7 [0.5, 2.9] nM (n=3) for WT ProTx-II and 185.0 [152.1, 217.9] nM (n=5) for PTx2-2955, respectively.
Figure 2—figure supplement 1
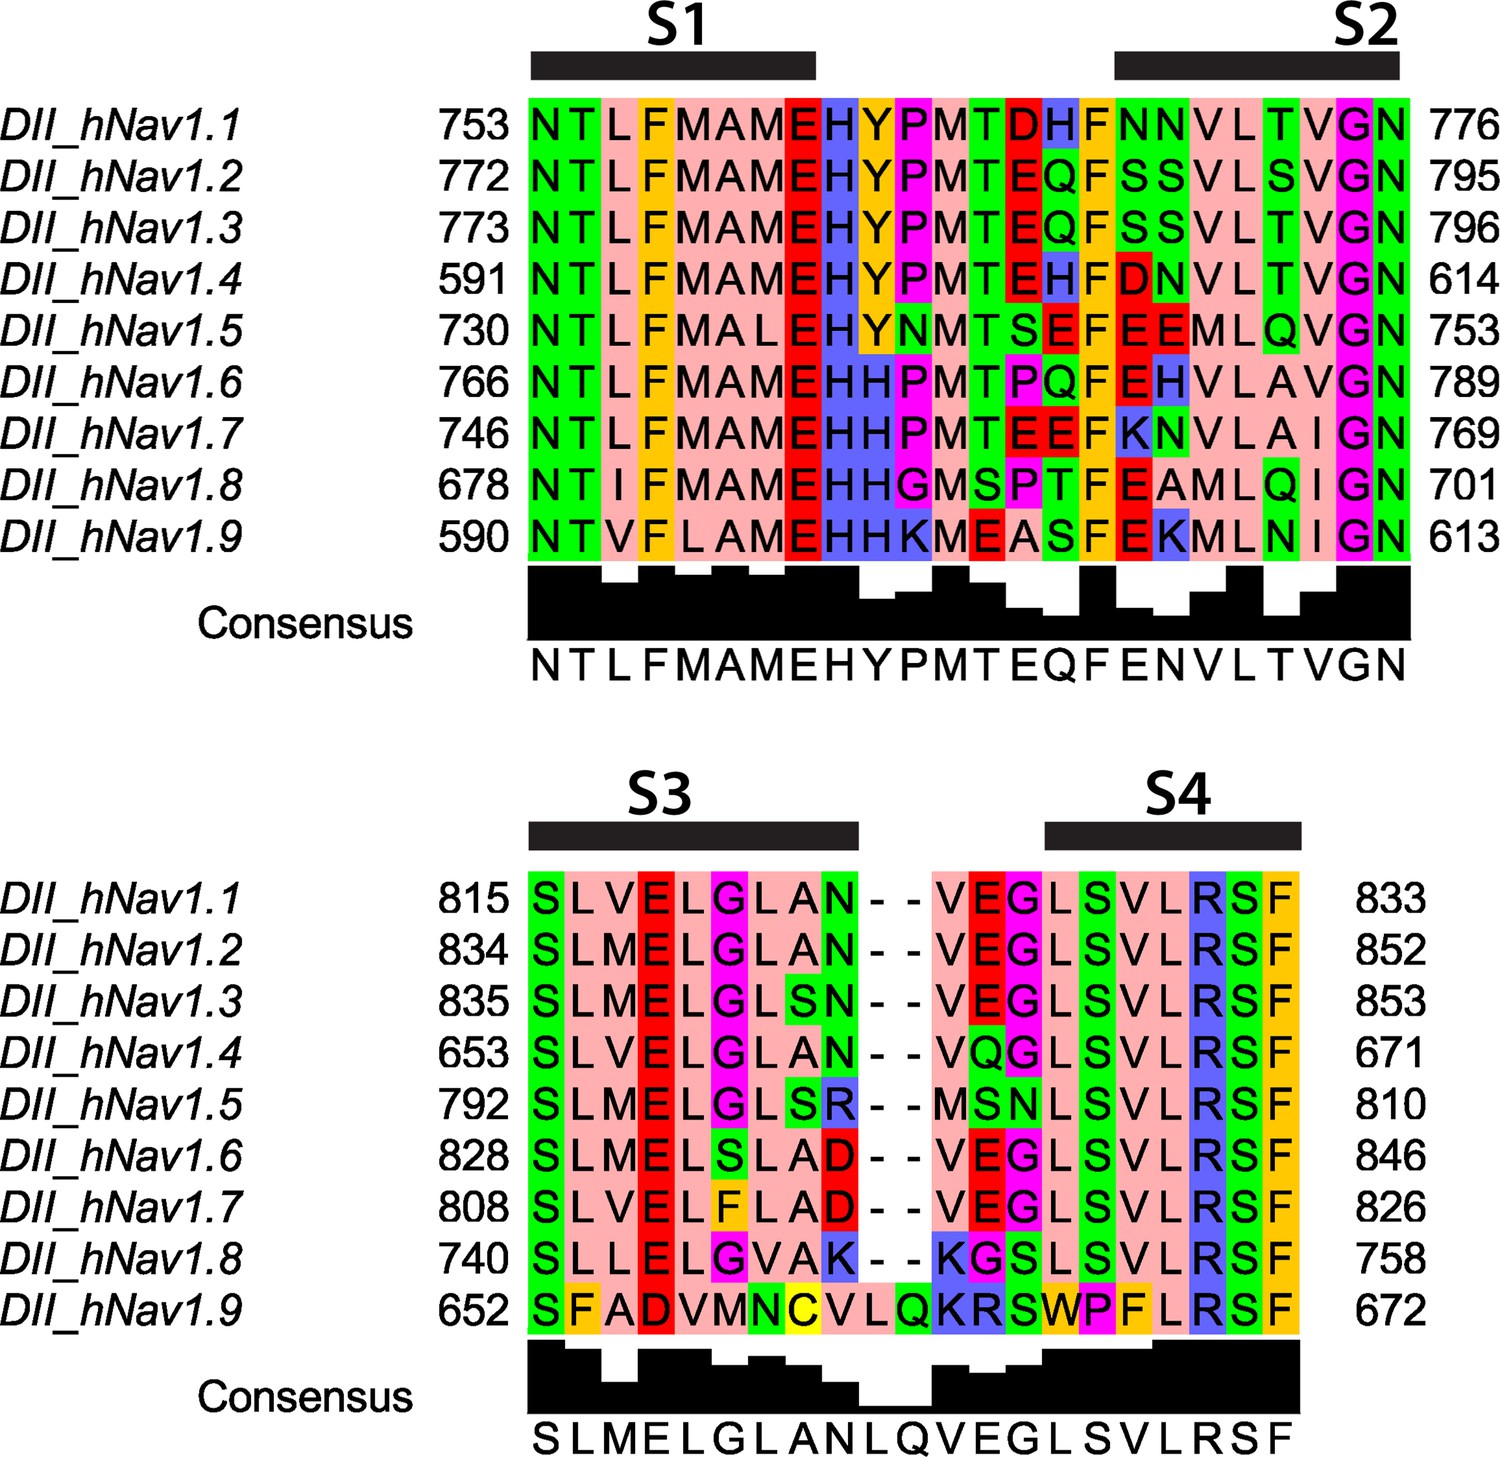
Sequence alignment of human Nav channel voltage-sensing domain II extracellular regions.
Sequence alignment of the extracellular S1-S2 of the VSD-II (top panel) and the extracellular S3-S4 (bottom panel) regions of human Nav channels.
Figure 3 with 2 supplements
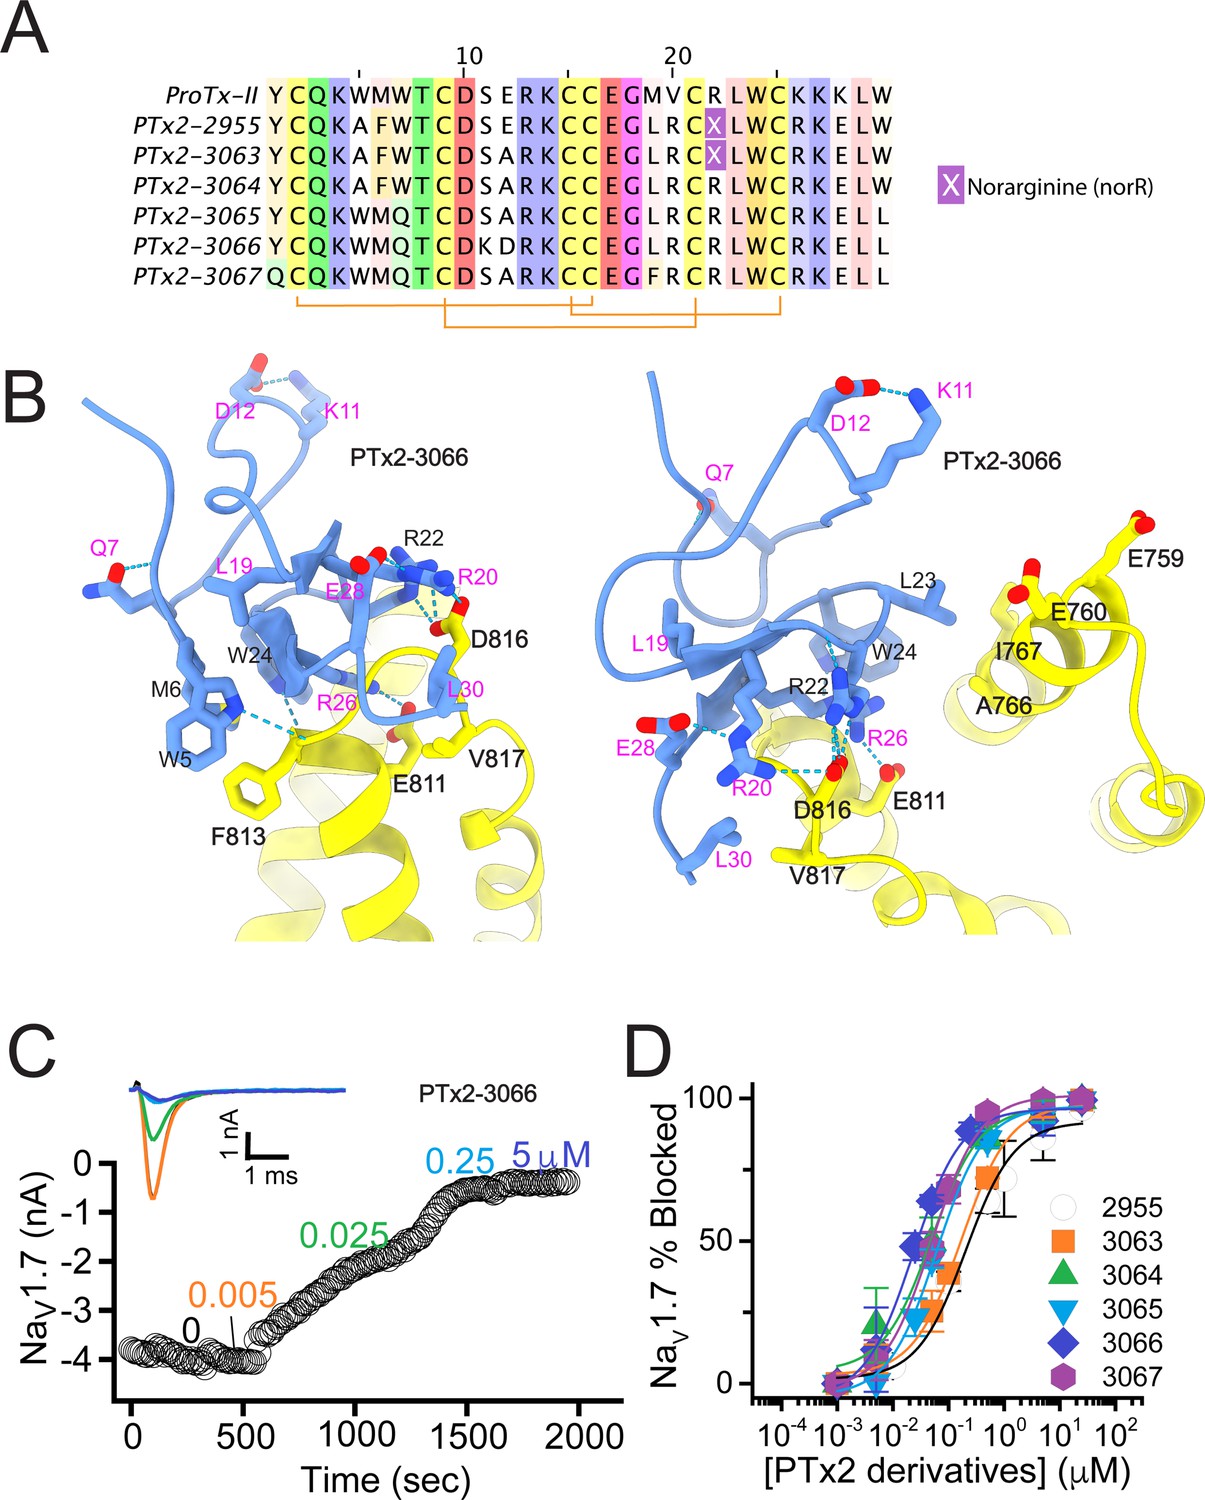
The second optimization round.
(A) Sequence alignment of the wild-type ProTx-II with PTx2-2955 and PTx2-2963 - PTx2-2967 peptides. (B) Transmembrane (left panel) and extracellular (right panel) views of the PTx2-3066 – hNaV1.7 model. Key residues on the PTx2-3066 and hNaV1.7 are shown in stick representation and labeled. Nitrogen atoms are colored in blue and oxygen atoms are colored in red. Hydrogen bonds between donor and acceptor atoms are shown by blue dash line. (C) Block of whole-cell hNaV1.7 sodium currents by application of increasing concentrations of PTx2-3066. (D) Inhibition of hNaV1.7 currents was measured as shown in C and plotted as a function concentration of PTx2-2955 or its derivatives. Fitting the Hill equation to the data yielded IC50 values (95% confidence interval) of 185.0 [152.1, 217.9] nM (n=5), 154.0 [39.9, 268.1] nM (n=3), nM, 52.6 [7.0, 98.2] nM (n=3), 73.9 [55.8, 92.0] nM (n=4), 30.8 [27.9, 33.7] nM (n=6), and 48.3 [29.5, 67.1] nM (n=4) for PTx2-2955, PTx2-3063, PTx2-3064, PTx2-3065, PTx2-3066, and PTx2-3067, respectively.
Figure 3—figure supplement 1
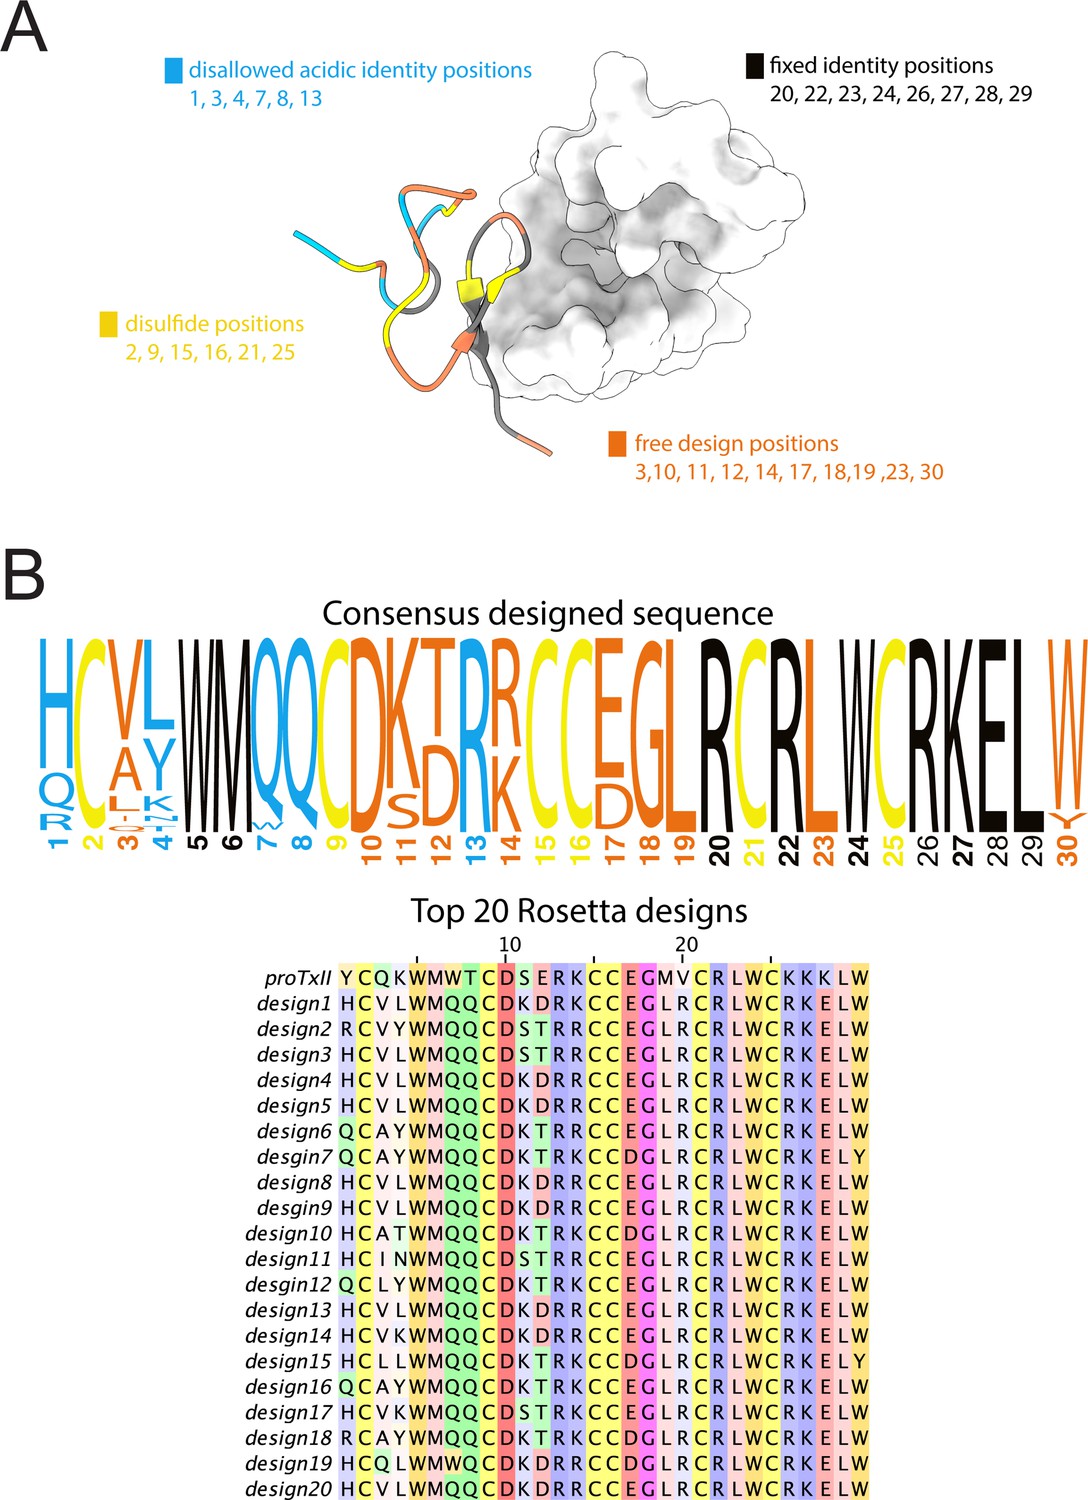
Rosetta design of ProTx-II peptides.
Computational design of ProTx-II variants. (A) Structural mapping of design restrictions categorized as disulfide positions (yellow), fixed identity positions (black), disallowed acidic identity positions (blue), and free design positions (orange). (B) Rosetta top design sequences and the consensus design sequence (represented as sequence logo) are colored under the design restriction scheme.
Figure 3—figure supplement 2
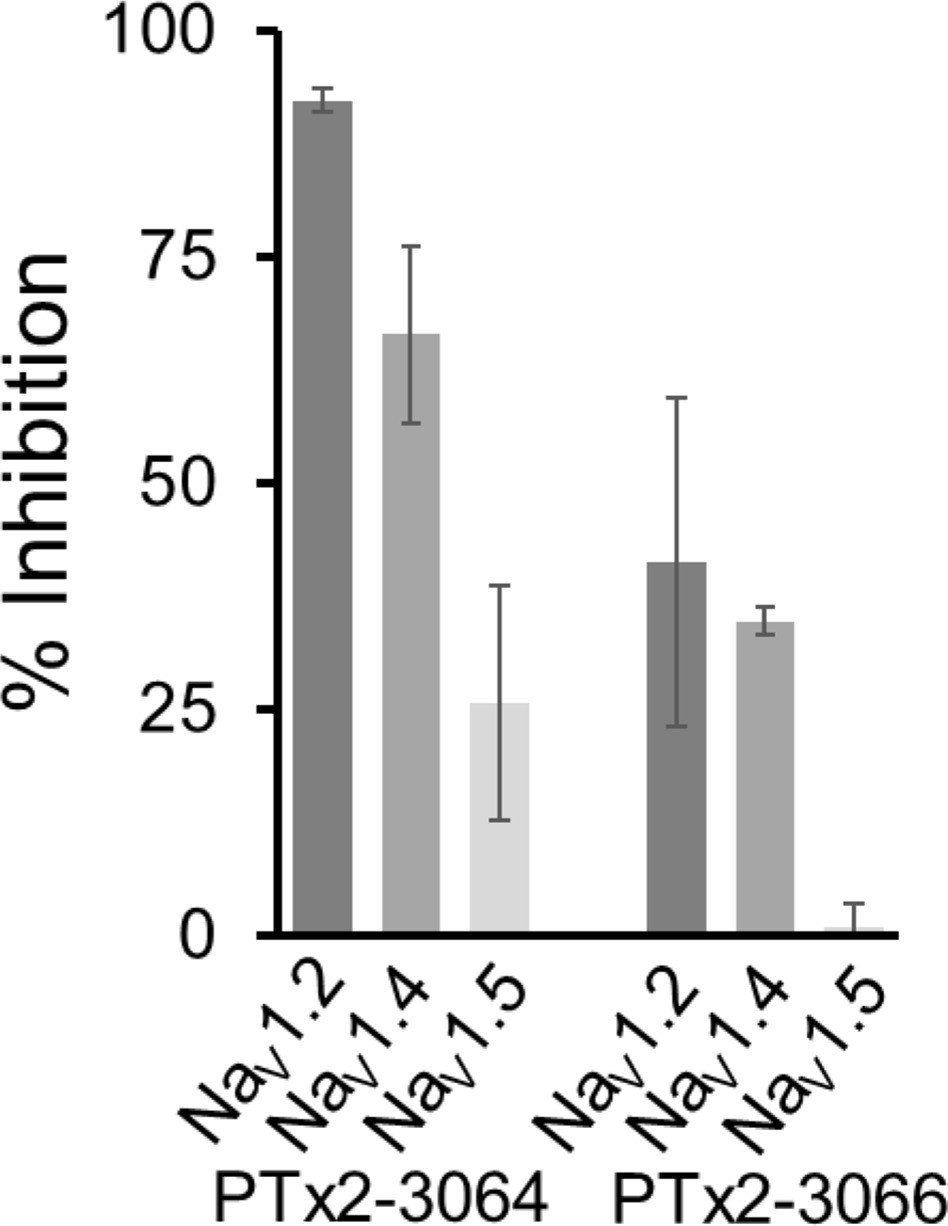
Selectivity of PTx2-3064 and PTx2-3066.
At 10 µM, PTx2-3064 blocked ~92%,~66%, and ~25% of currents conducted by hNaV1.2, hNaV1.4, and hNaV1.5, respectively. At the same concentration, PTx2-3066 blocked ~41%,~34%, and ~1% of currents conducted by hNaV1.2, hNaV1.4, and hNaV1.5, respectively. Data are represented as mean ± standard deviation derived from three individually recorded cells.
Figure 4 with 2 supplements

The third optimization round.
(A) Sequence alignment of the wild-type ProTx-II with PTx2-3066 and PTx2-3127 - PTx2-3128 peptides. (B) Transmembrane (left panel) and extracellular (right panel) views of the PTx2-3127 – hNaV1.7 model. Key residues on the PTx2-3127 and hNaV1.7 are shown in stick representation and labeled. Nitrogen atoms are colored in blue and oxygen atoms are colored in red. Hydrogen bonds between donor and acceptor atoms are shown by blue dash line. (C) Block of whole-cell hNaV1.7 sodium currents by application of increasing concentrations of PTx2-3127. (D) Inhibition of hNaV1.7 currents was measured as shown in C and plotted as a function concentration of PTx2-3066 or its derivatives. Fitting the Hill equation to the data yielded the IC50 values (95% confidence interval) of 30.8 [27.9, 33.7] nM (n=6), 2.3 [1.9, 2.7] µM (n=3), 6.9 [6.7, 7.1] nM (n=3), and 5.0 [4.6, 5.4] nM (n=3) for PTx2-3066, PTx2-3126, PTx2-3127, PTx2-3128, respectively.
Figure 4—figure supplement 1
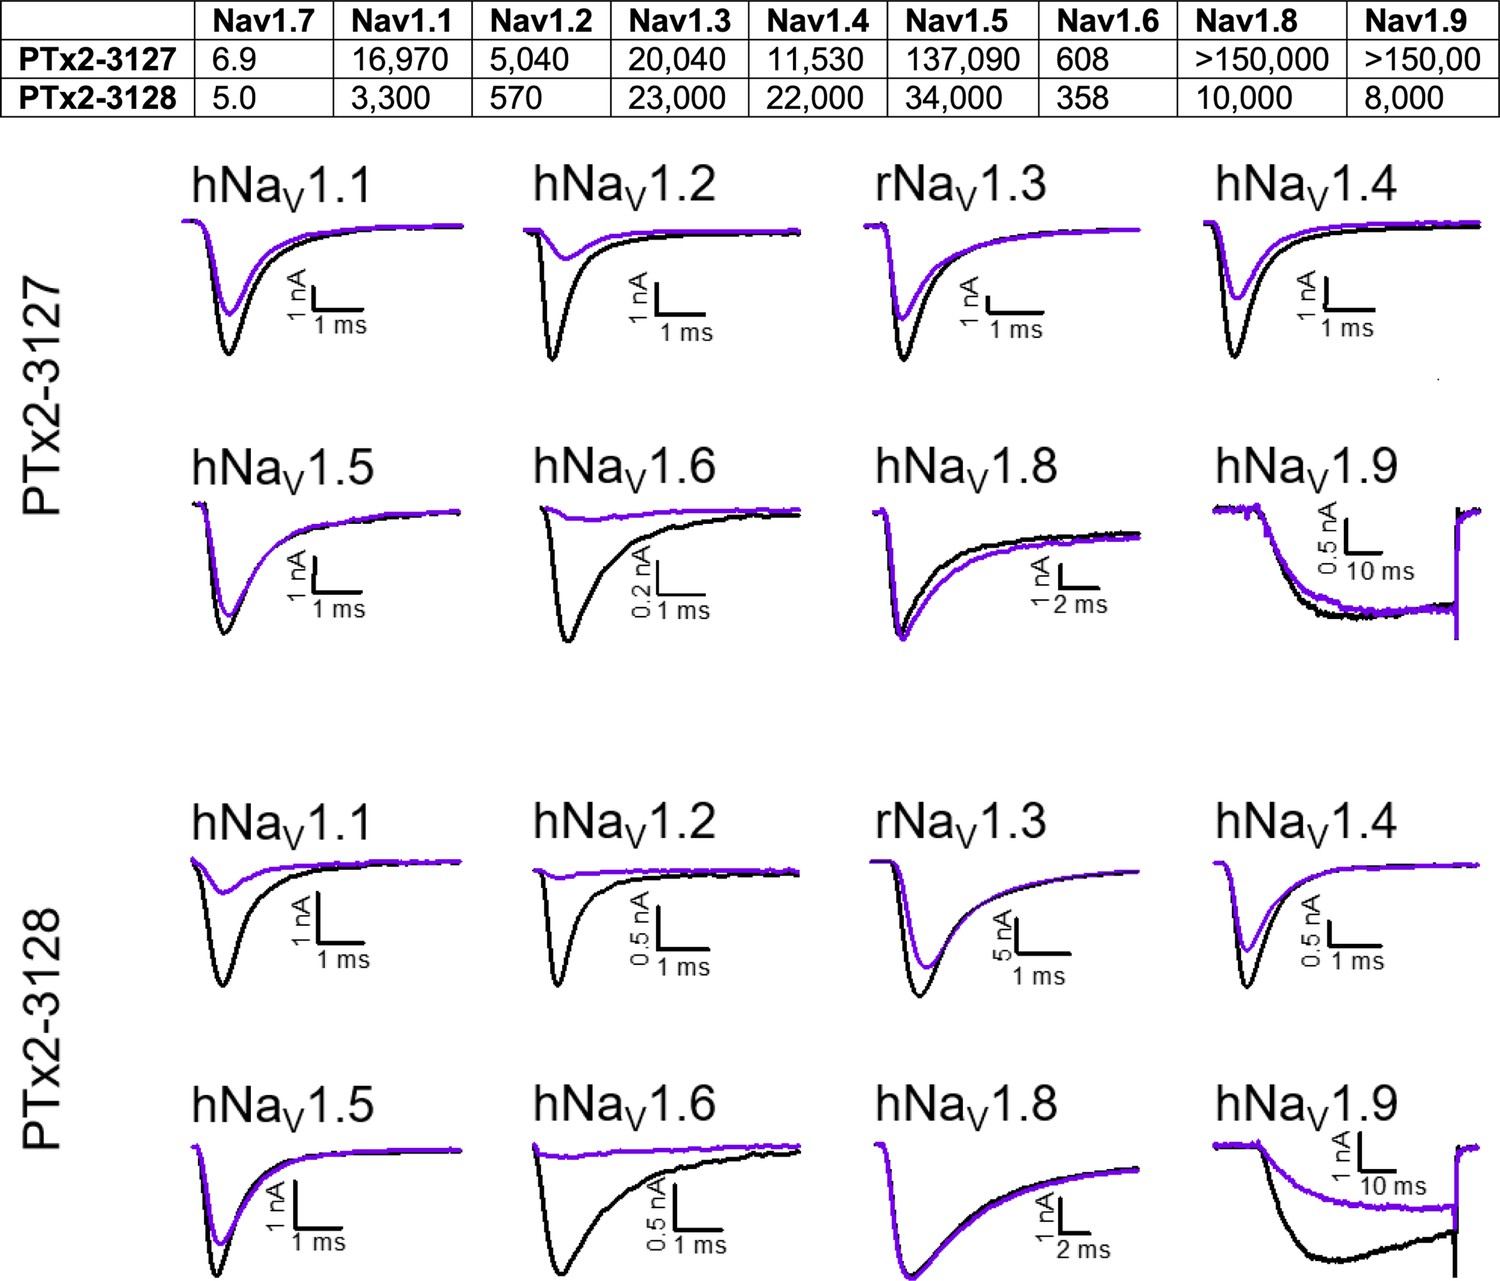
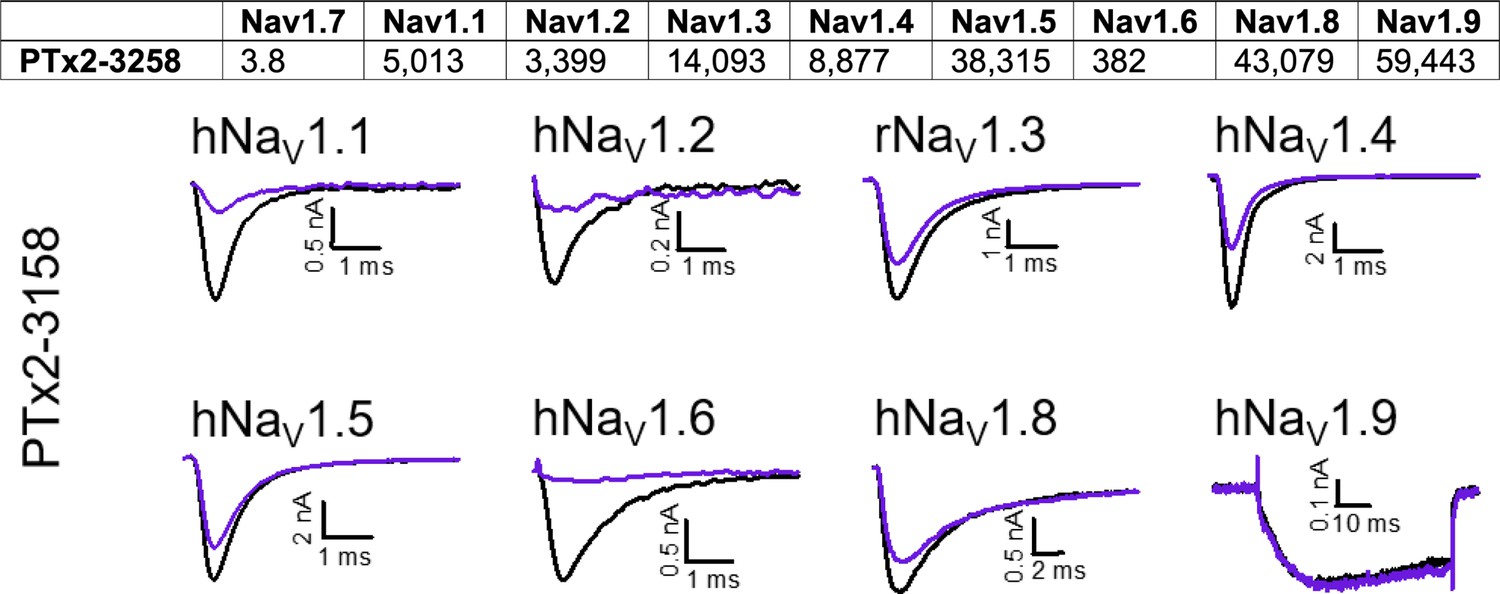
Selectivity of PTx2-3127 and PTx2-3128 for hNav1.7 over other sodium channels.
Top panel, Data denoted as the mean of individual IC50’s (in nM) derived from recordings of 3 or more cells for each peptide. Bottom panels, Exemplifying current traces before (black traces) and after saturated with 10 µM (purple traces) of PTx2-3127 and PTx2-3128 peptides.
-
Figure 4—figure supplement 1—source data 1
Mean of individual IC50’s (in nM) derived from recordings of 3 or more cells for PTx2-3127 and PTx2-3128 peptides.
- https://cdn.elifesciences.org/articles/81727/elife-81727-fig4-figsupp1-data1-v2.docx
Figure 4—figure supplement 2
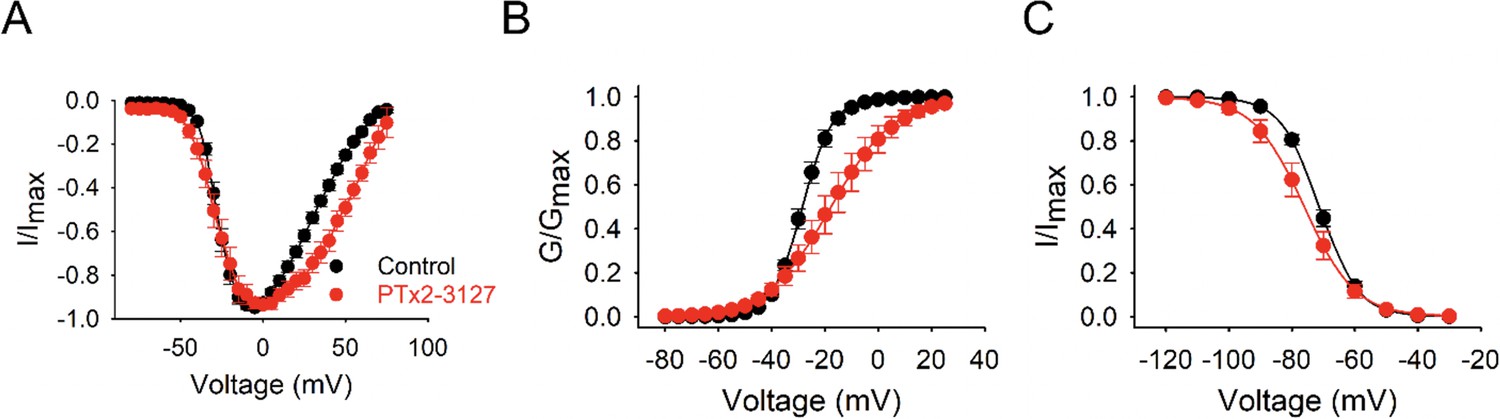
Mechanism of action of PTx2-3127.
(A) Plots of current-voltage relationship of normalized hNav1.7 currents measured in control cells (black, n=10) and cells exposed to 50 nM of PTx2-3127 (red, n=8). Cells were stepped in 5 mV increments from –120 mV to +70 mV from a holding potential of –120 mV for 10ms. (B) Voltage-dependent activation curves are derived from the data shown in (A). PTx2-3127 causes a statistically significant depolarized shift in steady-state activation in the depolarizing direction. For control cells, the V1/2 of activation is –28.1±0.9 mV, and the slope factor k is 5.0±0.5 mV; for PTx2-3127-treated cells, the V1/2 of activation is –17.3±3.9 mV, and the slope factor k is 2.4±0.2 mV. (C) Normalized steady-state inactivation curves measured control cells (black, n=12) and cells exposed to 50 nM PTx2-3127 (red, n=6). PTx2-3127 causes a statically significant shift in steady-state inactivation in the hyperpolarized direction. For control cells, the V1/2 of inactivation is –71.2±0.9 mV, and the slope factor k is 5.8±0.1 mV; for PTx2-3127-treated cells, the V1/2 of inactivation is –76.2±2.5 mV, and the slope factor k is 7.3±0.3 mV. Cells were stepped in 10 mV increments from –120 mV to 30 mV for 500ms followed by a test pulse to –10 mV for 30ms. All recordings were performed in a time-matched manner, and normalized conductances and currents were fit to a Boltzmann function, and are shown as means ± SEM.
Figure 5 with 2 supplements

The fourth optimization round.
(A) Sequence alignment of the wild-type ProTx-II with PTx2-3127, PTx2-3258, PTx2-3259, PTx2-3260, and PTx2-3361 peptides. (B) Transmembrane (left panel) and extracellular (right panel) views of the PTx2-3258 – hNaV1.7 model. Key residues on the PTx2-3258 and hNaV1.7 are shown in stick representation and labeled. Nitrogen atoms are colored in blue and oxygen atoms are colored in red. Hydrogen bonds between donor and acceptor atoms are shown by blue dash line. (C) Block of whole-cell hNaV1.7 sodium currents by application of increasing concentrations of PTx2-3258 and followed by 1 mM of wild-type ProTx-II as indicated. (D) Inhibition of hNaV1.7 currents was measured as shown in C and plotted as a function concentration of PTx2-3127 or its derivatives. Fitting the Hill equation to the data yielded the IC50 values (95% confidence interval) of 6.9 [6.7, 7.1] nM (n=3), 3.8 [0.3, 7.3] nM (n=5), 41.8 [16.5, 67.1] nM (n=3), 20.8 [12.4, 29.2] nM (n=3), 8.6 [5.6, 11.6] nM (n=3), nM for PTx2-3127, PTx2-3258, PTx2-3259, PTx2-3260, and PTx2-3361, respectively.
Figure 5—figure supplement 1
Selectivity of PTx2-3258 for hNav1.7 over other sodium channels.
Top panel, Data denoted as mean of individual IC50’s (in nM) derived from recordings of 3 or more cells for each peptide. Bottom panel, Representative current traces before (black traces) and after saturated with 10 µM (purple traces) of PTx2-3258 peptide.
-
Figure 5—figure supplement 1—source data 1
Mean of individual IC50’s (in nM) derived from recordings of 3 or more cells for PTx2-3258 peptide.
- https://cdn.elifesciences.org/articles/81727/elife-81727-fig5-figsupp1-data1-v2.docx
Figure 5—figure supplement 2
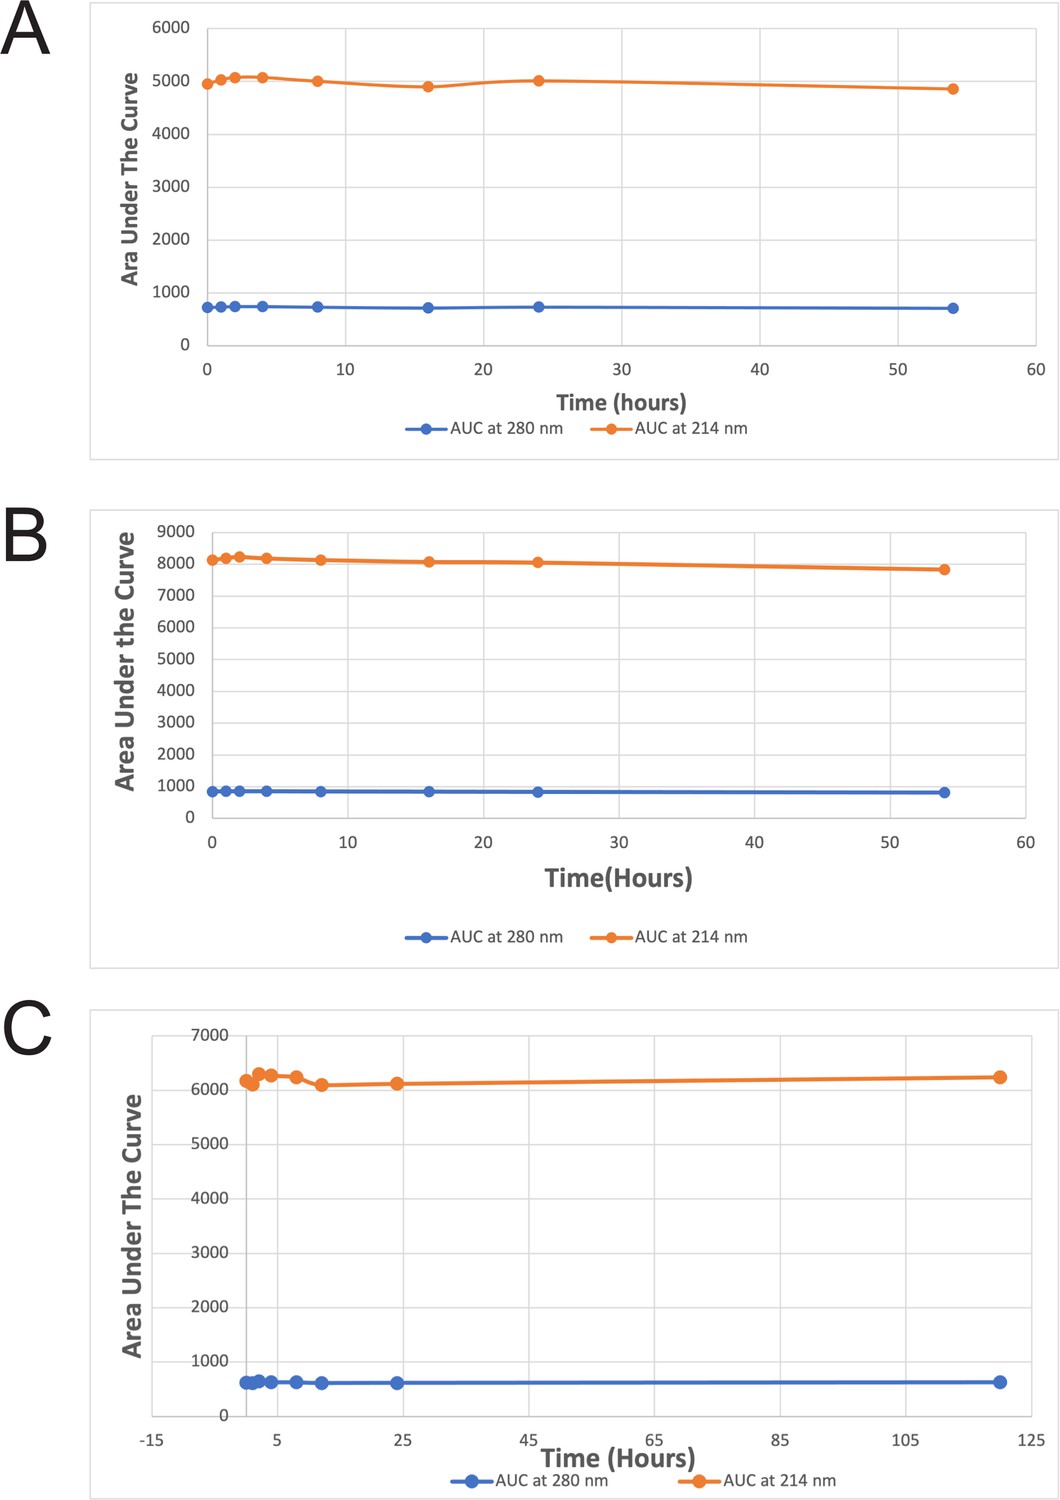
Stability of the wild-type ProTx-II, PTx2-3127, and PTx2-3258 in Artificial Cerebrospinal Fluid.
The plots of the average area under the curve at 214 nm and 280 nm versus time for the stability of the wild-type ProTx-II (A), PTx2-3127 (B), and PTx2-3258 (C).
Figure 6 with 2 supplements
Efficacy of designed NaV1.7-selective inhibitor (PTx2-3127) on NaV channels of mouse nonpeptidergic nociceptor neurons.
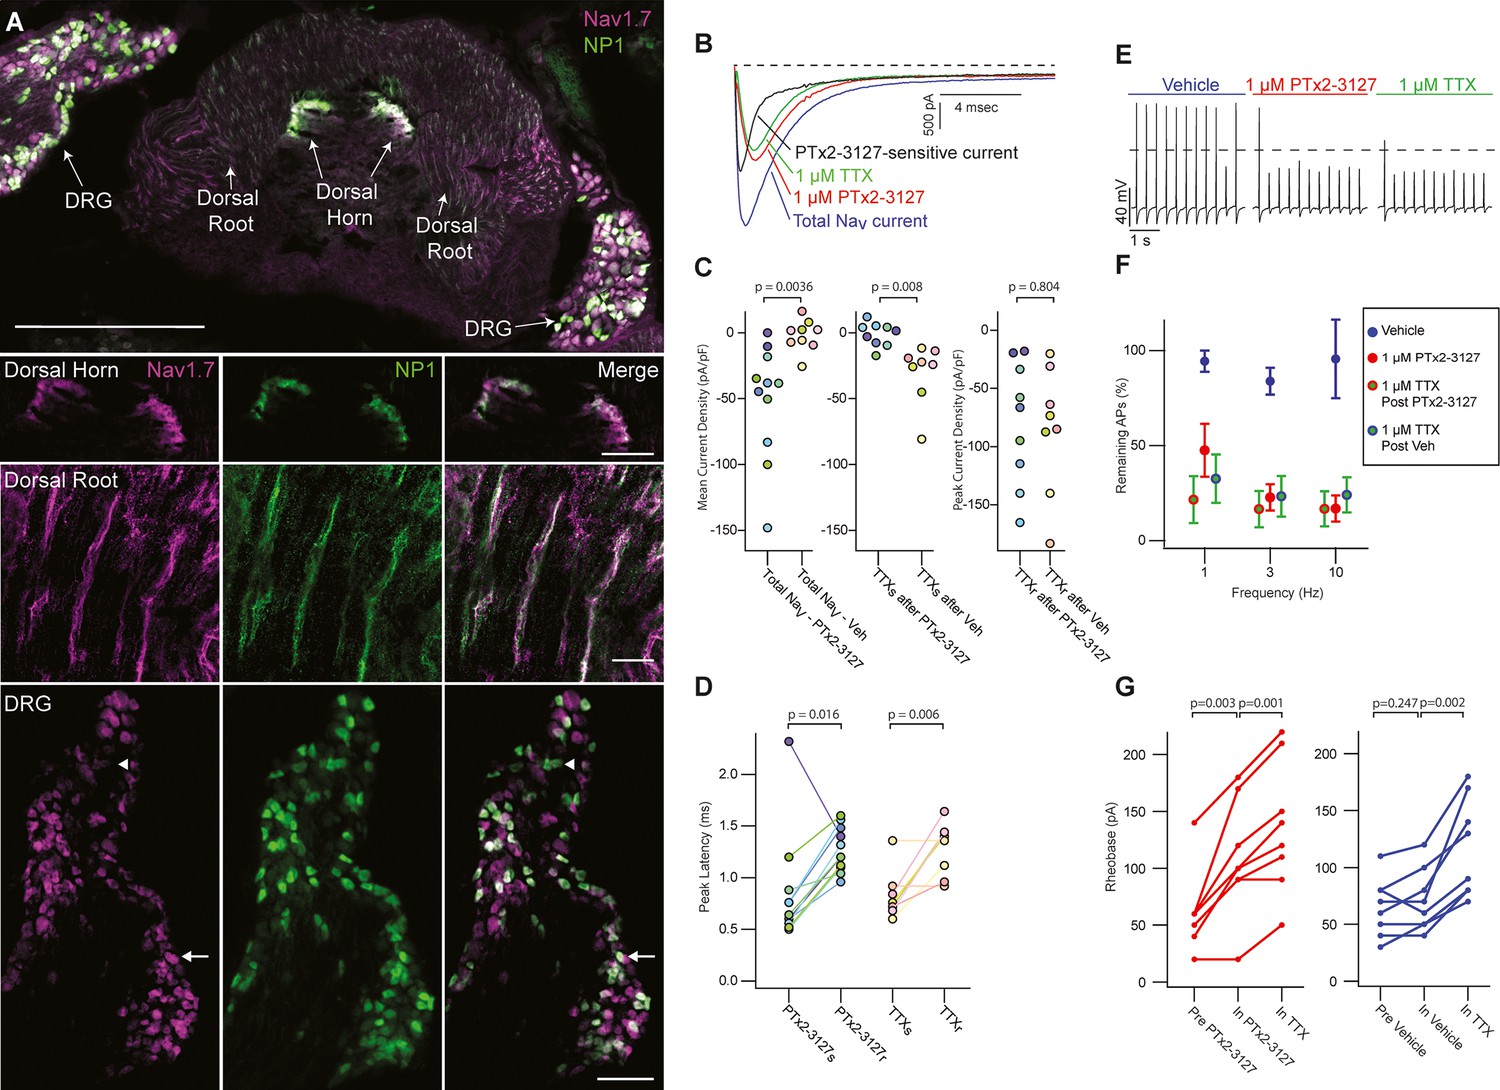
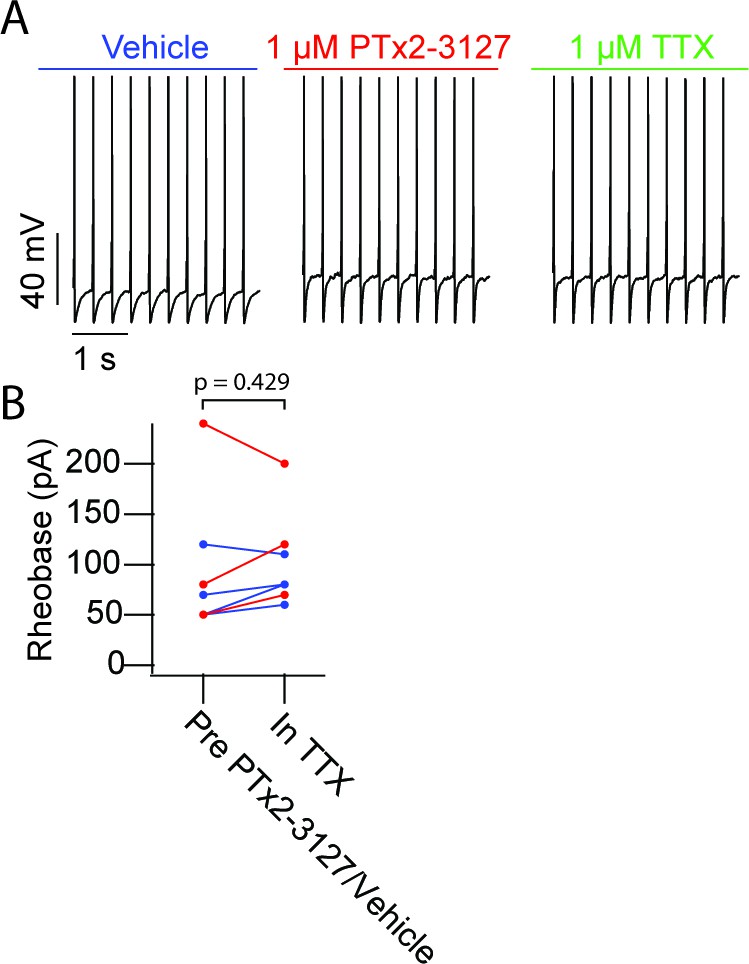
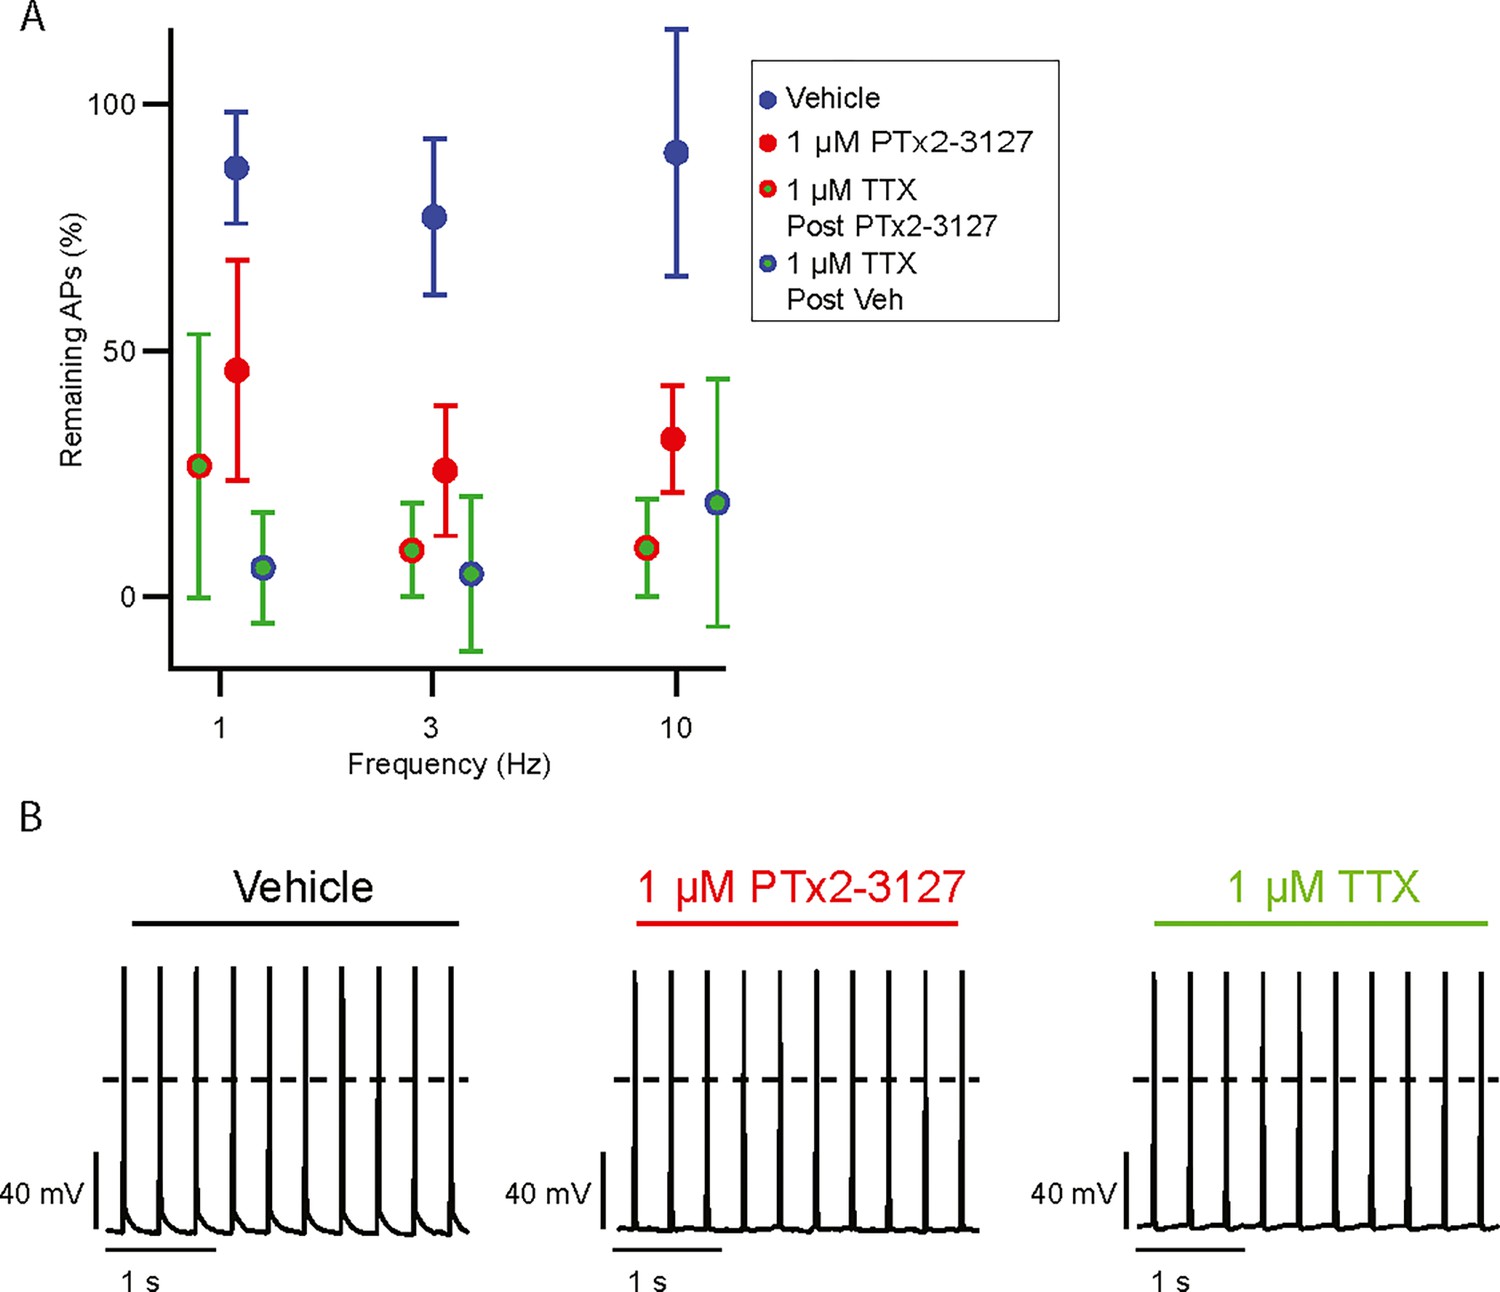
(A) Immunofluorescence from MrgprdGFP labeled NP1 nociceptors (AB_300798, green) and NaV1.7 (AB_2877500, magenta) in a mouse L5 spinal section. Orientation of left DRG was moved during sectioning. Lower panels are zoomed in images to highlight colocalization (white) in dorsal horn nociceptor terminals, dorsal root fibers and DRG cell bodies. NP1 nociceptor DRG cell bodies show both high (arrow) and low (arrowhead) immunofluorescence for NaV1.7. Top image, dorsal horn and DRG zoom images are a z-projection of 3 confocal images spanning 10.06 µm. Zoom in image of dorsal root fibers is a z-projection of 9 airyscan images spanning 3.18 µm. Scale bar in the top image is 500 µm. Scale bars in the dorsal horn, dorsal root and DRG zoom in panels are 100, 20 and 100 µm, respectively. (B) Voltage clamp recordings of NaV currents from dissociated NP1 nociceptors showing impact of PTx2-3127 (red) and subsequent application of TTX (green). Fast-inactivating NaV component revealed by subtraction of 1 µM PTx2-3127 trace from total NaV current. Black dotted line represents 0 pA of current. (C) Left: Mean current density from 0.4 to 1ms of PTx2-3127 sensitive current and vehicle sensitive current. Middle: Mean current density from 0.4 to 1ms of TTX sensitive current after application of PTx2-3127 or vehicle. Right: Peak current density of TTX resistant current after application of PTx2-3127 or vehicle and TTX. Point colors represent the same neuron (N=4 mice). p values calculated by Students T-Test. (D) Peak time of PTx2-3127 sensitive and resistant currents as well as peak time of TTX sensitive and resistant currents. Point colors correspond to the same neurons and is consistent with points shown in C. p values calculated by Students T-Test. (E) Current clamp recording of NP1 action potentials and failures with 3 Hz stimuli in vehicle, 1 µM PTx2-3127 and 1 µM TTX. Dashed line represents 0 mV. (F) Average remaining NP1 action potentials (APs) versus frequency in PTx2-3127 (red points, n=8 neurons, N=4 mice) or in vehicle control (blue points, n=8 neurons, N=4 mice). Average remaining APs after PTx2-3127 or vehicle control in 1 µM TTX (red circle green fill and blue circle green fill, respectively). Neurons with no sensitivity to TTX were excluded from this analysis. (G) Rheobase of NP1 neurons before PTx2-3127, in PTx2-3127 and in TTX (left). Rheobase of NP1 neurons before vehicle, in vehicle and in TTX (right). p values calculated by Students T-test.
Figure 6—figure supplement 1
Lack of efficacy of PTx2-3127 or TTX on a subset of MrgprdGFP mouse neurons.
(A) Current clamp recording of TTX-insensitive NP1 action potentials with 3 Hz stimuli in vehicle, 1 µM PTx2-3127 and 1 µM TTX. Dashed line represents 0 mV. (B) Rheobase of TTX insensitive NP1 neurons before PTx2-3127 or vehicle and in TTX. Red points and lines indicate that neurons were in PTx2-3127 before TTX while blue points and lines indicate that neurons were in vehicle before TTX (n=7 neurons, N=3 mice). p values calculated by Students T-test.
Figure 6—figure supplement 2
Effects of PTx2-3127 and TTX on MrgprdGFP mouse neurons held below –80 mV.
(A) Average remaining NP1 action potentials (APs) versus frequency in PTx2-3127 (red points, n=5 neurons, N=2 mice) or in vehicle control (blue points, n=7 neurons, N=2 mice). Average remaining APs after PTx2-3127 or vehicle control in 1 µM TTX (red circle green fill and blue circle green fill, respectively). Neurons with no sensitivity to TTX were excluded from this analysis. (B) Example of current clamp recording of TTX-insensitive NP1 action potentials with 3 Hz stimuli in vehicle, 1 µM PTx2-3127 and 1 µM TTX. Dashed line represents 0 mV. Insensitivity to TTX was seen in 4 of 16 neurons.
Figure 7

Efficacy of PTx2-3127 on rheobase and action potentials in human DRG neurons.
(A) Rheobase of NP1 neurons before PTx2-3127, in PTx2-3127 and in TTX (left). Rheobase of NP1 neurons before vehicle, in vehicle and in TTX (right). p values calculated by Students T-test. (B) Efficacy of PTx2-3127 on rheobase in human DRG neurons following 24 h incubation with Oxaliplatin (50 μM). Rheobase after perfusion of the compound is normalized to baseline. (I) Efficacy of PTx2-3127 on action potentials (APs) in human DRG neurons following 24 h incubation with Oxaliplatin (50 μM). Action potential inhibition after perfusion of the compound is normalized to baseline. APs were elicited at 150% of baseline rheobase. Results are presented as mean ± SEM.
Figure 8
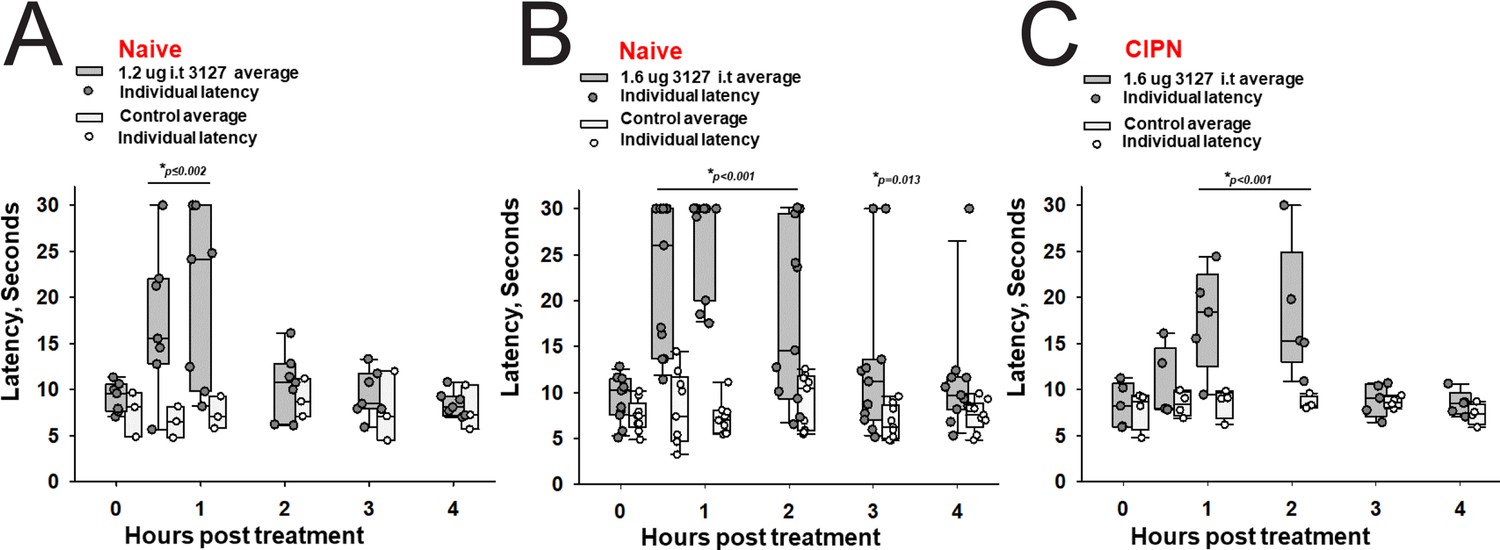
Efficacy of PTx2-3127 on thermal pain and CIPN neuropathy.
PTx2-3127 exhibited dose dependent analgesia on a 52.1°C hotplate increasing the duration of effect as well as number reaching the latency cutoff with doses of 1.2 ug i.t. (A) to 1.6 ug i.t. (B) in naïve female and male rats. The analgesia mediated by PTx2-3127 was significant compared with vehicle controls for both doses (1.2 ug, p≤0.002) and the 1.6 ug dose several rats reached the hotplate latency cutoff (30 s to prevent injury) for several hours’ duration (1.6 ug, p<0.001 and p=0.013 at indicated time points). (C) PTx2-3127 was also effective against oxaliplatin chemotherapy induced neuropathic pain (CIPN) with responses also significant compared with vehicle controls (p<0.001) and reaching the latency cutoff. (A–C, Two Way Repeated Measures ANOVA, Holm-Sidak method post hoc, treated versus control).
Tables
Table 1
Potency of redesigned ProTx-II peptides.
| Rank | Peptide | IC50 (nM) |
|---|---|---|
| 1 | WT ProTx-II | 0.3–1.7 |
| 2 | PTx2-3258 | 3.8 |
| 3 | PTx2-3128 | 5.0 |
| 4 | PTx2-3127 | 6.9 |
| 5 | PTx2-3361 | 8.6 |
| 6 | Janssen’s (JNJ63955918) | 10.0 |
| 7 | PTx2-3260 | 20.8 |
| 8 | PTx2-3066 | 30.8 |
| 9 | PTx2-3259 | 41.8 |
| 10 | PTx2-3067 | 48.3 |
| 11 | PTx2-3064 | 52.6 |
| 12 | PTx2-3065 | 73.9 |
| 13 | PTx2-3063 | 154.0 |
| 14 | PTx2-2955 | 185.0 |
| 15 | PTx2-3126 | 2300.0 |
Table 2
Selectivity profile of PTx2-3127 and PTx2-3258 peptides for hNav1.7 versus all other human Nav channels.
| Nav subtype | PTx2-3258 | PTx2-3127 | ||
|---|---|---|---|---|
| IC50 (nM) | Selectivity for hNav1.7 vs hNav1.x (fold) | IC50 (nM) | Selectivity for hNav1.7 vs hNav1.x (fold) | |
| hNav1.1 | 5013 | 1319 | 16,970 | 2459 |
| hNav1.2 | 3399 | 894 | 5040 | 730 |
| rNav1.3 | 14,093 | 3708 | 20,040 | 2904 |
| hNav1.4 | 8877 | 2336 | 11,530 | 1671 |
| hNav1.5 | 38,315 | 10,082 | 137,090 | 19,868 |
| hNav1.6 | 382 | 100 | 608 | 88 |
| hNav1.7 | 3.8 | 1 | 6.9 | 1 |
| hNav1.8 | 43,079 | 11,336 | >150,000 | >20,000 |
| hNav1.9 | 59,443 | 15,642 | >150,000 | >20,000 |
| hERG | 1861 | 496 | 1889 | 272 |
Table 3
Comparison of selectivity profiles of PTx2-3127 and PTx2-3258 peptides for hNav1.7 versus hNav1.2, hNav1.4, hNav1.5, and hNav1.6 channels.
| Rank | Peptide | Affinity (IC50) for hNav1.7(nM) | Selectivity for hNav1.7 vs hNav1.2(fold) | Selectivity for hNav1.7 vs hNav1.4(fold) | Selectivity for hNav1.7 vs hNav1.5(fold) | Selectivity for hNav1.7 vs hNav1.6(fold) |
|---|---|---|---|---|---|---|
| 1 | PTx2-3258 | 3.8 | 894 | 2336 | 10,082 | 100 |
| 2 | PTx2-3127 | 6.9 | 730 | 1671 | 19,868 | 88 |
| 3 | PTx2-3128 | 5.0 | 114 | 4,500 | 6,800 | 70 |
| 4 | Janssen’s (JNJ63955918) | 10 | 160 | 500 | >1000 | 100 |
| 5 | Wild-type ProTx-II | 0.3–1 | 100–140 | 260–380 | 300–1000 | 86 |
Table 4
Rheobase and number of action potentials following perfusion of PTx2-3127 following 24 h incubation with Oxaliplatin.
| [Drug] µM | Rheobase(pA) | Number of APs | % change | Remaining AP (%) | |||||||
|---|---|---|---|---|---|---|---|---|---|---|---|
| 0.1 Hz | 1 Hz | 3 Hz | 10 Hz | Rheobase | 0.1 Hz | 1 Hz | 3 Hz | 10 Hz | |||
| Cell 1 | Baseline | 500 | 10 | 120 | 120 | 62 | 0.0 | 100.0 | 100.0 | 100.0 | 100.0 |
| 0.01 | 480 | 10 | 120 | 120 | 61 | –4.0 | 100.0 | 100.0 | 100.0 | 98.4 | |
| 0.1 | 460 | 10 | 120 | 120 | 60 | –8.0 | 100.0 | 100.0 | 100.0 | 96.8 | |
| 1 | 640 | 10 | 120 | 120 | 59 | 28.0 | 100.0 | 100.0 | 100.0 | 95.2 | |
| Cell 2 | Baseline | 300 | 10 | 120 | 120 | 120 | 0.0 | 100.0 | 100.0 | 100.0 | 100.0 |
| 0.01 | 280 | 10 | 120 | 120 | 47 | –6.7 | 100.0 | 100.0 | 100.0 | 39.2 | |
| 0.1 | 320 | 10 | 120 | 120 | 24 | 6.7 | 100.0 | 100.0 | 100.0 | 20.0 | |
| 1 | 600 | 0 | 0 | 0 | 0 | 100.0 | 0.0 | 0.0 | 0.0 | 0.0 | |
| Cell 3 | Baseline | 360 | 10 | 120 | 120 | 37 | 0.0 | 100.0 | 100.0 | 100.0 | 100.0 |
| 0.01 | 460 | 10 | 120 | 96 | 28 | 27.8 | 100.0 | 100.0 | 80.0 | 75.7 | |
| 0.1 | 520 | 10 | 53 | 36 | 16 | 44.4 | 100.0 | 44.2 | 30.0 | 43.2 | |
| 1 | 700 | 0 | 0 | 0 | 0 | 94.4 | 0.0 | 0.0 | 0.0 | 0.0 | |
| Cell 4 | Baseline | 1450 | 10 | 120 | 120 | 32 | 0.0 | 100.0 | 100.0 | 100.0 | 100.0 |
| 0.01 | 1550 | 10 | 119 | 8 | 1 | 6.9 | 100.0 | 99.2 | 6.7 | 3.1 | |
| 0.1 | 1650 | 10 | 105 | 1 | 1 | 13.8 | 100.0 | 87.5 | 0.8 | 3.1 | |
| 1 | 1800 | 10 | 0 | 0 | 0 | 24.1 | 100.0 | 0.0 | 0.0 | 0.0 | |
| Cell 5 | Baseline | 1800 | 10 | 120 | 120 | 48 | 0.0 | 100.0 | 100.0 | 100.0 | 100.0 |
| 0.01 | 2000 | 10 | 120 | 105 | 28 | 11.1 | 100.0 | 100.0 | 87.5 | 58.3 | |
| 0.1 | 2000 | 10 | 120 | 90 | 27 | 11.1 | 100.0 | 100.0 | 75.0 | 56.3 | |
| 1 | 2100 | 10 | 120 | 30 | 3 | 16.7 | 100.0 | 100.0 | 25.0 | 6.3 | |
| Cell 6 | Baseline | 400 | 10 | 120 | 120 | 52 | 0.0 | 100.0 | 100.0 | 100.0 | 100.0 |
| 0.01 | 420 | 10 | 120 | 75 | 7 | 5.0 | 100.0 | 100.0 | 62.5 | 13.5 | |
| 0.1 | 520 | 10 | 20 | 0 | 0 | 30.0 | 100.0 | 16.7 | 0.0 | 0.0 | |
| 1 | 660 | 0 | 0 | 0 | 0 | 65.0 | 0.0 | 0.0 | 0.0 | 0.0 | |
| Cell 7 | Baseline | 420 | 10 | 120 | 120 | 53 | 0.0 | 100.0 | 100.0 | 100.0 | 100.0 |
| 0.01 | 460 | 10 | 120 | 120 | 37 | 9.5 | 100.0 | 100.0 | 100.0 | 69.8 | |
| 0.1 | 540 | 10 | 120 | 77 | 24 | 28.6 | 100.0 | 100.0 | 64.2 | 45.3 | |
| 1 | 680 | 0 | 0 | 17 | 4 | 61.9 | 0.0 | 0.0 | 14.2 | 7.5 | |
| Cell 8 | Baseline | 1950 | 10 | 120 | 120 | 120 | 0.0 | 100.0 | 100.0 | 100.0 | 100.0 |
| 0.01 | 1900 | 10 | 120 | 120 | 120 | –2.6 | 100.0 | 100.0 | 100.0 | 100.0 | |
| 0.1 | 2000 | 10 | 120 | 120 | 120 | 2.6 | 100.0 | 100.0 | 100.0 | 100.0 | |
| 1 | 3000 | 0 | 0 | 0 | 0 | 53.8 | 0.0 | 0.0 | 0.0 | 0.0 | |
| Cell 9 | Baseline | 1250 | 10 | 120 | 120 | 57 | 0.0 | 100.0 | 100.0 | 100.0 | 100.0 |
| 0.01 | 1250 | 10 | 120 | 120 | 23 | 0.0 | 100.0 | 100.0 | 100.0 | 40.4 | |
| 0.1 | 1300 | 10 | 120 | 93 | 18 | 4.0 | 100.0 | 100.0 | 77.5 | 31.6 | |
| 1 | 1250 | 10 | 120 | 81 | 7 | 0.0 | 100.0 | 100.0 | 67.5 | 12.3 | |
| Cell 10 | Baseline | 3200 | 10 | 120 | 120 | 60 | 0.0 | 100.0 | 100.0 | 100.0 | 100.0 |
| 0.01 | 3250 | 10 | 120 | 111 | 51 | 1.6 | 100.0 | 100.0 | 92.5 | 85.0 | |
| 0.1 | 3250 | 10 | 120 | 107 | 40 | 1.6 | 100.0 | 100.0 | 89.2 | 66.7 | |
| 1 | 4700 | 10 | 59 | 43 | 34 | 46.9 | 100.0 | 49.2 | 35.8 | 56.7 | |
| Average | Baseline | 0.0 | 100.0 | 100.0 | 100.0 | 100.0 | |||||
| 0.01 | 4.9 | 100.0 | 99.9 | 82.9 | 58.3 | ||||||
| 0.1 | 13.5 | 100.0 | 84.8 | 63.7 | 46.3 | ||||||
| 1 | 49.1 | 50.0 | 34.9 | 24.3 | 17.8 | ||||||
| SEM | Baseline | 0.0 | 0.0 | 0.0 | 0.0 | 0.0 | |||||
| 0.01 | 3.1 | 0.0 | 0.1 | 9.3 | 10.7 | ||||||
| 0.1 | 5.1 | 0.0 | 9.4 | 12.5 | 11.0 | ||||||
| 1 | 10.3 | 16.7 | 15.0 | 10.9 | 10.2 | ||||||
Table 5
Summary of four rounds of ProTx-II peptide optimization.
ProTx-II mutations that resulted in the most potent and selective peptide are highlighted in green. ProTx-II mutations that did not result in the most potent and selective peptide are highlighted in yellow. X at residue #22 in PTx2-2955 represents norArg.
| Residue # | 1 | 2 | 3 | 4 | 5 | 6 | 7 | 8 | 9 | 10 | 11 | 12 | 13 | 14 | 15 | 16 | 17 | 18 | 19 | 20 | 21 | 22 | 23 | 24 | 25 | 26 | 27 | 28 | 29 | 30 |
|---|---|---|---|---|---|---|---|---|---|---|---|---|---|---|---|---|---|---|---|---|---|---|---|---|---|---|---|---|---|---|
| WT PTx2 | Y | C | Q | K | W | M | W | T | C | D | S | E | R | K | C | C | E | G | M | V | C | R | L | W | C | K | K | K | L | W |
| PTx2-2955 | Y | C | Q | K | A | F | W | T | C | D | S | E | R | K | C | C | E | G | L | R | C | X | L | W | C | R | K | E | L | W |
| PTx2-3066 | Y | C | Q | K | W | M | Q | T | C | D | K | D | R | K | C | C | E | G | L | R | C | R | L | W | C | R | K | E | L | L |
| PTx2-3127 | Q | C | Q | K | W | M | Q | T | C | D | K | D | R | K | C | C | E | G | F | R | C | R | L | W | C | R | K | E | L | L |
| PTx2-3258 | H | C | Q | K | W | M | Q | T | C | D | K | D | R | K | C | C | E | G | F | R | C | R | L | W | C | R | K | E | L | L |
Key resources table
| Reagent type (species) or resource | Designation | Source or reference | Identifiers | Additional information |
|---|---|---|---|---|
| Cell line (Homo sapiens) | HEK 293 | ATCC | Cat #: CRL-1573 | |
| Software, algorithm | Rosetta | Rosetta https://doi.org/10.1038/s41592-020-0848-2 https://www.rosettacommons.org/ | Version 3.12 | |
| Software, algorithm | IgorPro | IgorPro https://www.wavemetrics.com/ | Version 8 | |
| Software, algorithm | UCSF Chimera | UCSF Chimera https://www.cgl.ucsf.edu/chimera/ | Version 1.16 | |
| Software, algorithm | CHARMM-GUI | CHARMM-GUI https://doi.org/10.1002/jcc.20945 http://www.charmm-gui.org | Version 3.0 | |
| Software, algorithm | CHARMM36 | CHARMM36 https://doi.org/10.1002/jcc.23354 http://mackerell.umaryland.edu/charmm_ff.shtml | Version July 2019 | |
| Software, algorithm | Pulse-PulseFit | Pulse-PulseFit (HEKA Electronik GmbH, Germany) http://www.heka.com/index.html | Version 8.8 | |
| Software, algorithm | Origin | https://www.originlab.com/ | Version 9.0 |
Additional files
Download links
A two-part list of links to download the article, or parts of the article, in various formats.
Downloads (link to download the article as PDF)
Open citations (links to open the citations from this article in various online reference manager services)
Cite this article (links to download the citations from this article in formats compatible with various reference manager tools)
Computational design of peptides to target NaV1.7 channel with high potency and selectivity for the treatment of pain
eLife 11:e81727.
https://doi.org/10.7554/eLife.81727


