DNA-Stimulated Liquid-Liquid phase separation by eukaryotic topoisomerase ii modulates catalytic function
- Department of Biophysics and Biophysical Chemistry, Johns Hopkins University School of Medicine, United States
- Department of Biophysics, University of Texas Southwestern Medical Center, United States
Figures
Figure 1
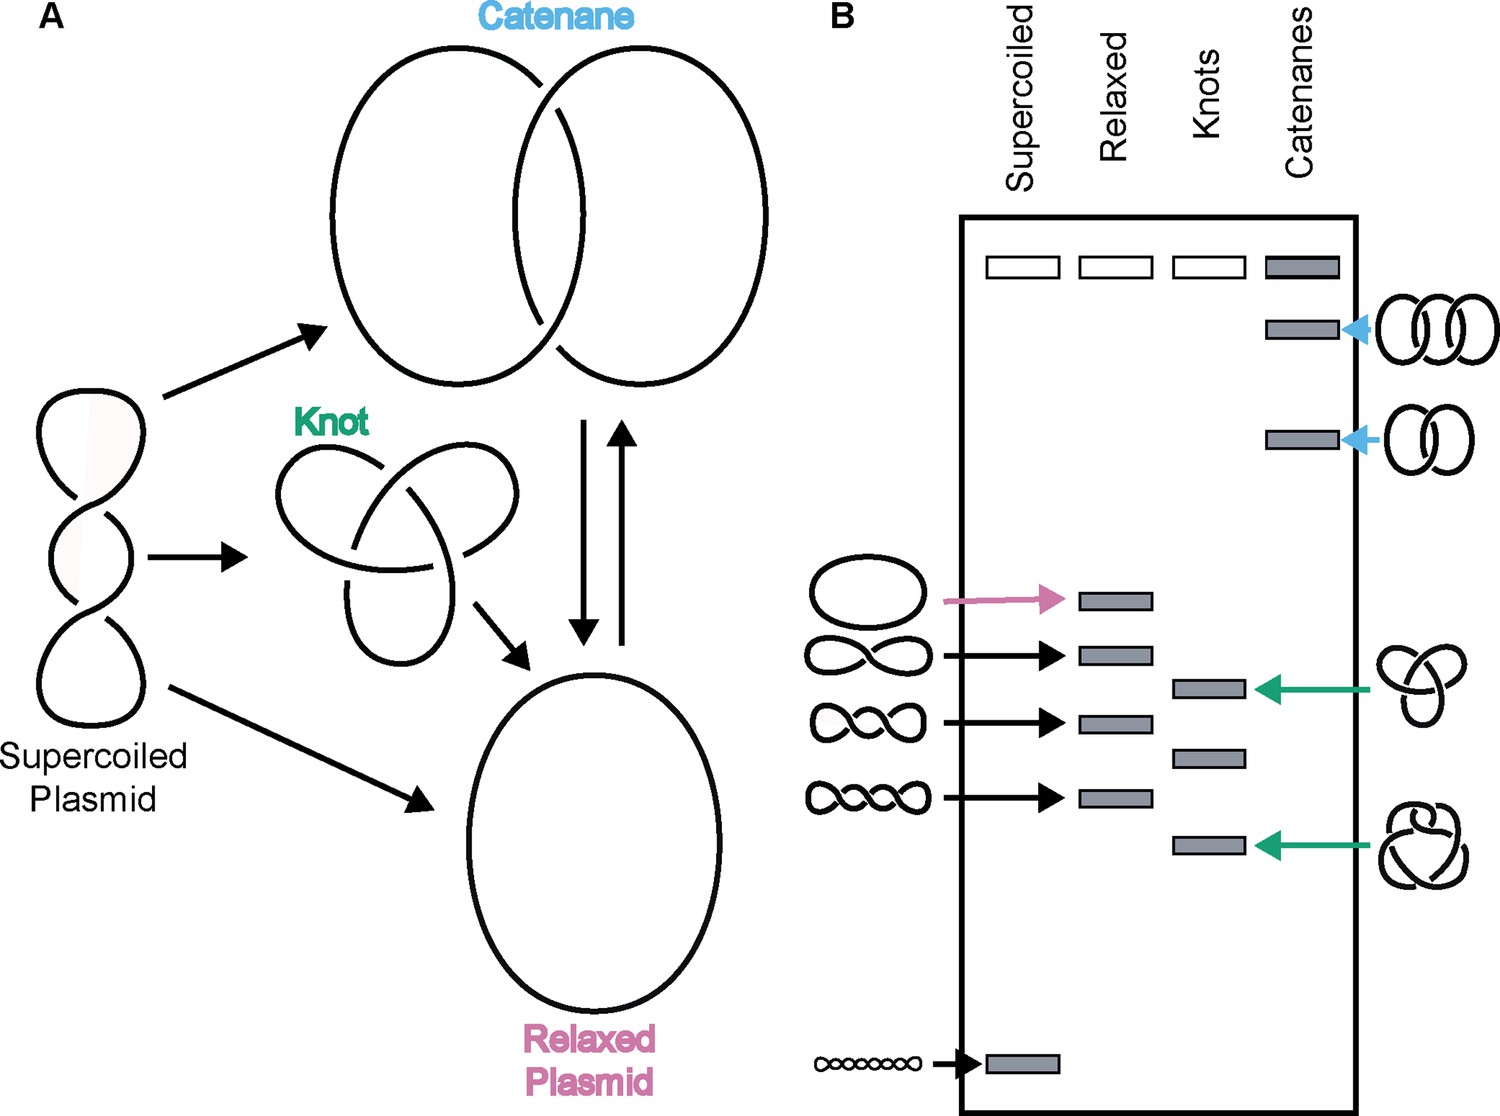
Topo IIs alter DNA topology.
(Left) Schematic of how topo IIs transform DNA from one topological state to another. (Right) Depiction of how different DNA topological states migrate on a native-agarose gel after electrophoresis. Colored arrows correlate with colored labels for different topological species.
Figure 2 with 4 supplements
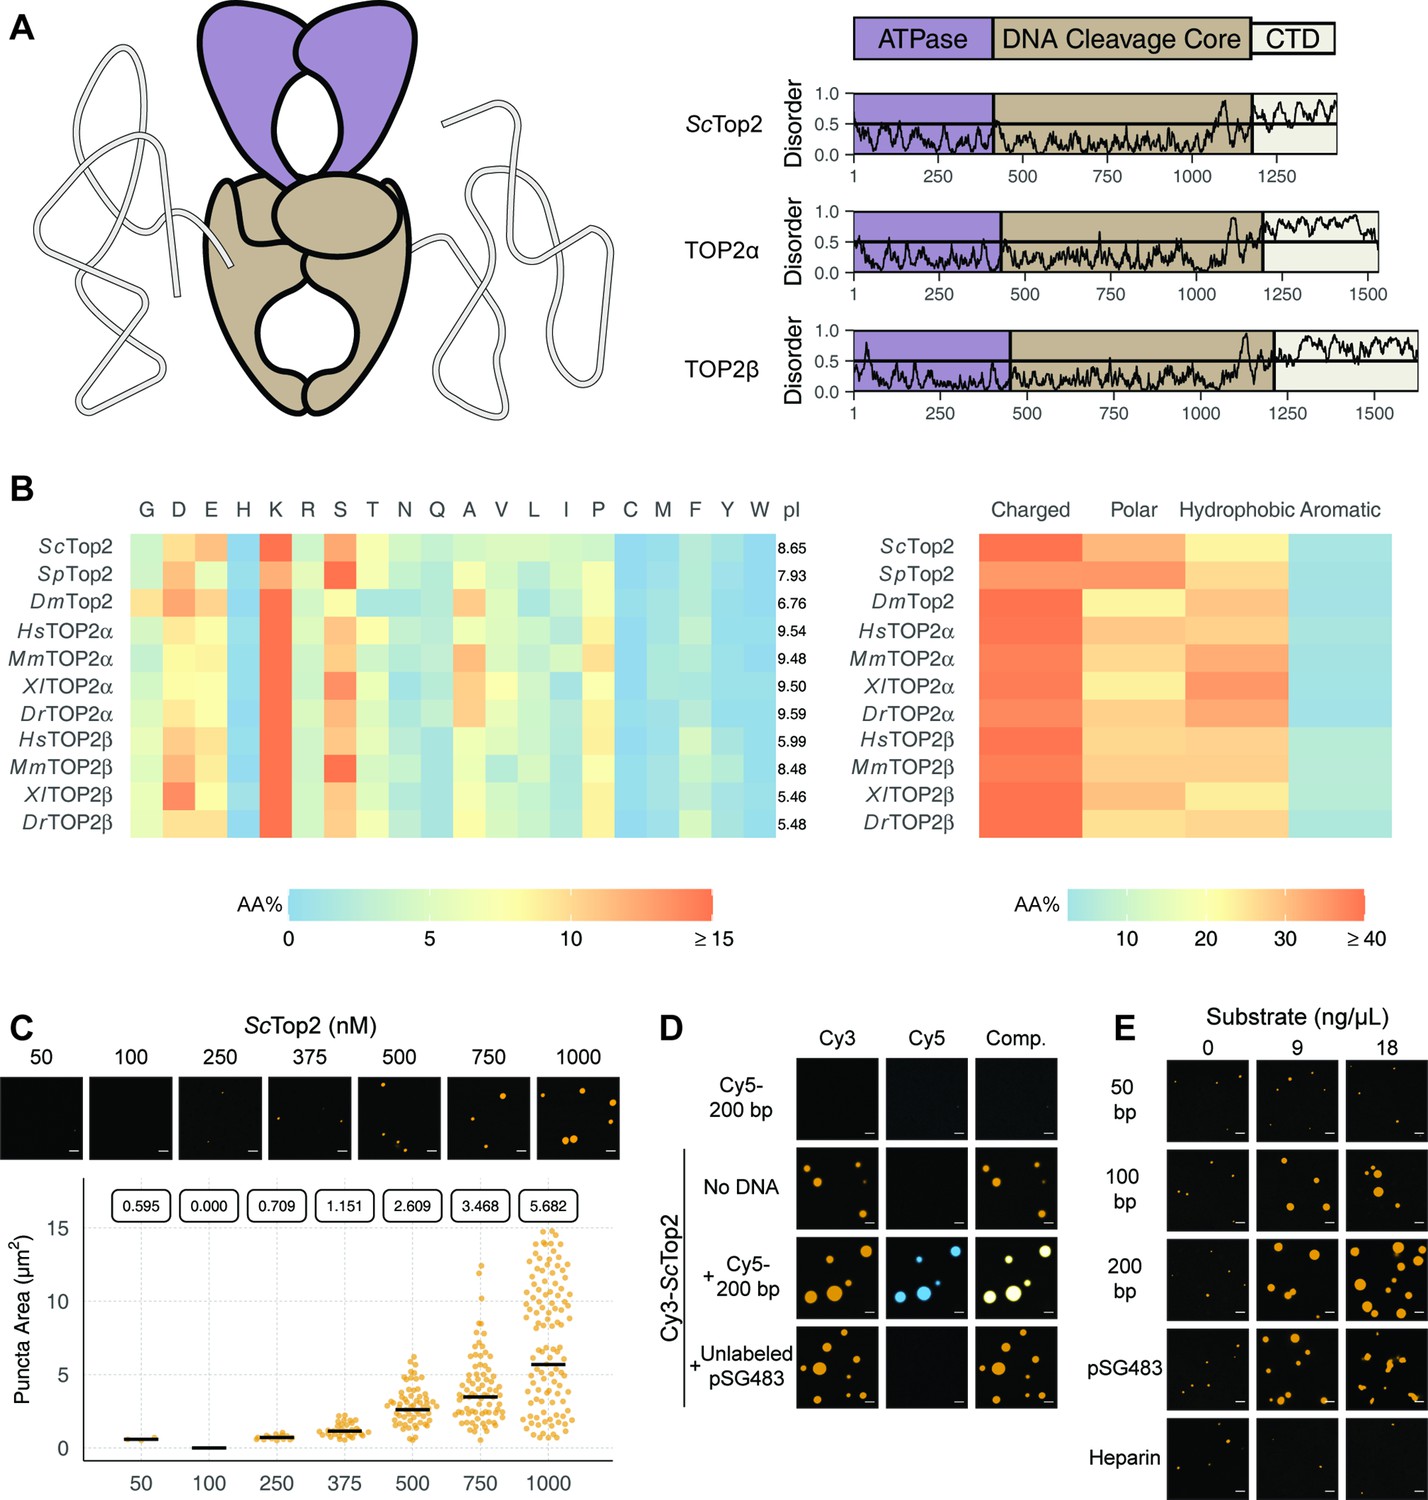
Eukaryotic topo IIs possess long IDRs and form higher order assemblies.
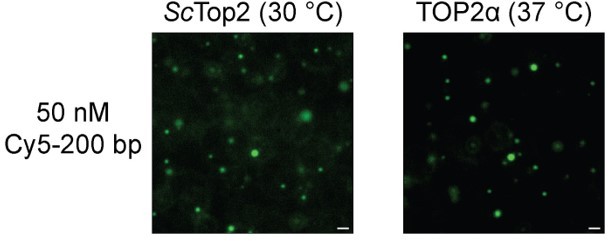
(A) General schematic of eukaryotic topo II with color coded domains on right. Graphs show disorder tendency of primary sequence calculated by IUPred2A for budding yeast and human topo IIs. Values above 0.5 signify disorder. (B) Relative amino acid composition of various eukaryotic topo II CTDs with respective isoelectric points and relative breakdowns of amino acid composition and groups. (C) Representative images of ScTop2 at different concentrations under phase-separating conditions. The quasirandom plot quantifies puncta number across three different micrographs for each condition. The solid bar bisecting the plots corresponds to the geometric mean area for each set of data (quantified by the boxed number). (D, E) Representative images of (D) 1µM Cy3-ScTop2 and (E) 500nM Cy3-ScTop2 with and without DNA substrates or, in (E), with heparin. The concentration of Cy5-200 bp DNA and pSG483 in (D) is 50nM and 5nM, respectively. 50nM Cy5-200 bp in the absence of protein is shown as a negative control. Scale bar in (C), (D), and (E) is 5µm.
Figure 2—figure supplement 1
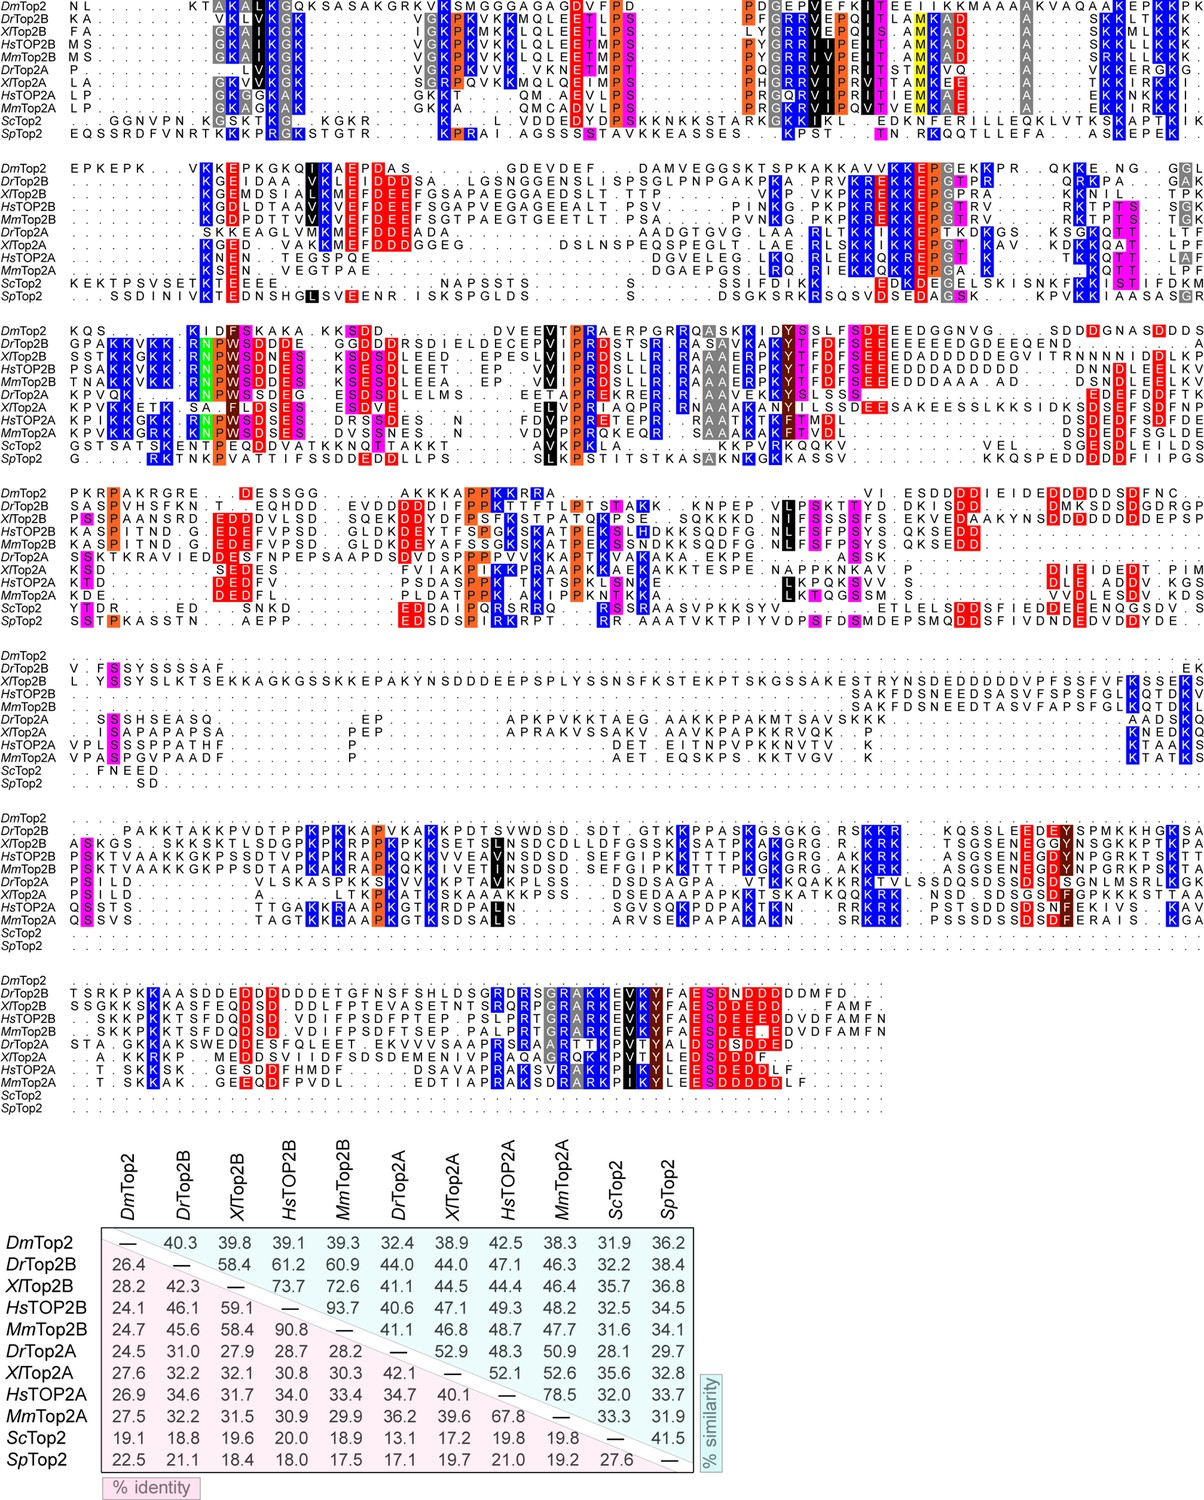
Topo II C-terminal domains have sparse sequence homology.
Sequence alignment of eukaryotic topo II CTDs from several representative organisms. Sequences used for each protein are as follows: DmTop2 (1191–1447), DrTop2β (1210–1618), XlTop2β (1207–1696), HsTOP2β (1209–1624), MmTop2β (1199–1612), DrTop2α (1185–1570), XlTop2α (1183–1579), HsTOP2α (1193–1531), MmTop2α (1190–1528), ScTop2 (1178–1428), SpTop2 (1217–1485). Sequence alignment and table was generated using the MSA package in R studio (Bodenhofer et al., 2015).
Figure 2—figure supplement 2
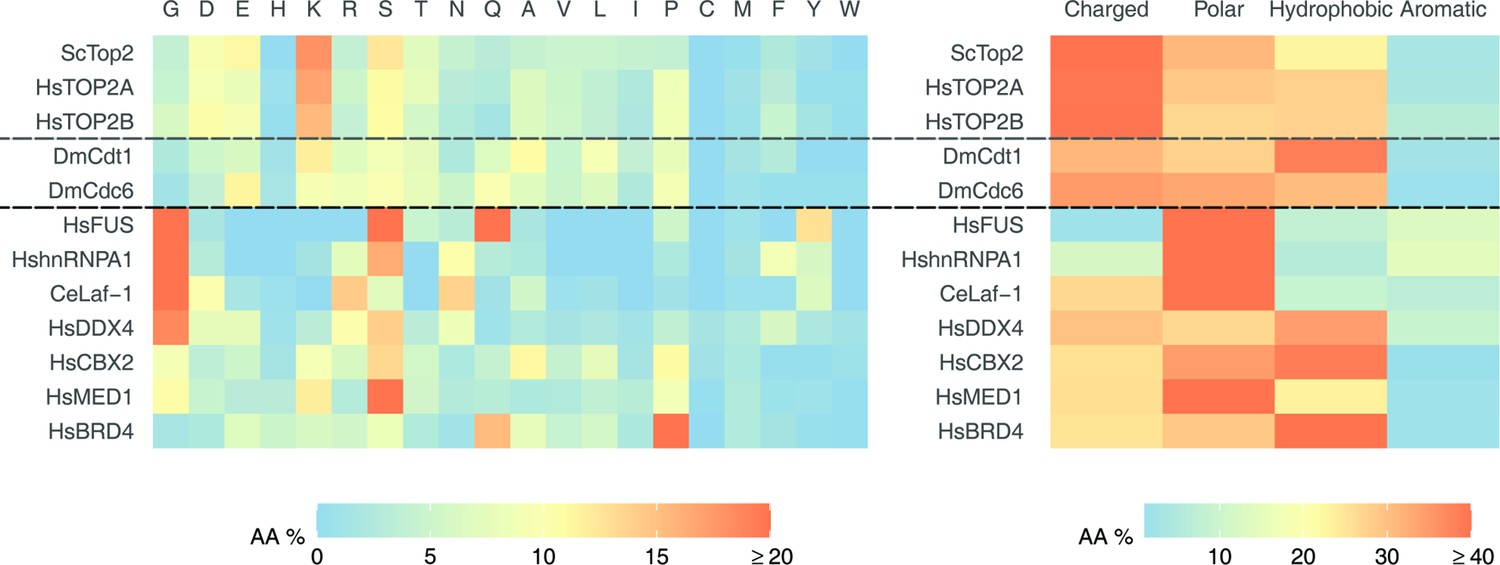
Quantification of relative amino acid percentages of IDRs that undergo LLPS in vitro.
Heatmap displaying relative amino acid percentages of eukaryotic Topo II CTDs and different IDRs of proteins that drive LLPS in vitro. Sequences used for topo IIs are the same as Figure 2—figure supplement 1, others are DmCdt1 (1-294) (Parker et al., 2019), DmCdc6 (1-246) (Parker et al., 2019), HsFUS (1-211) (Wang et al., 2018a), HshnRNPA1 (186-320) (Molliex et al., 2015), CeLaf-1 (1-168) (Elbaum-Garfinkle et al., 2015), HsDDX4 (1-236) (Nott et al., 2015), HsCBX2 (40-496) (Tatavosian et al., 2019), HsMED1 (948–1574) (Sabari et al., 2018), HsBRD4 (674–1351) (Sabari et al., 2018).
Figure 2—figure supplement 3
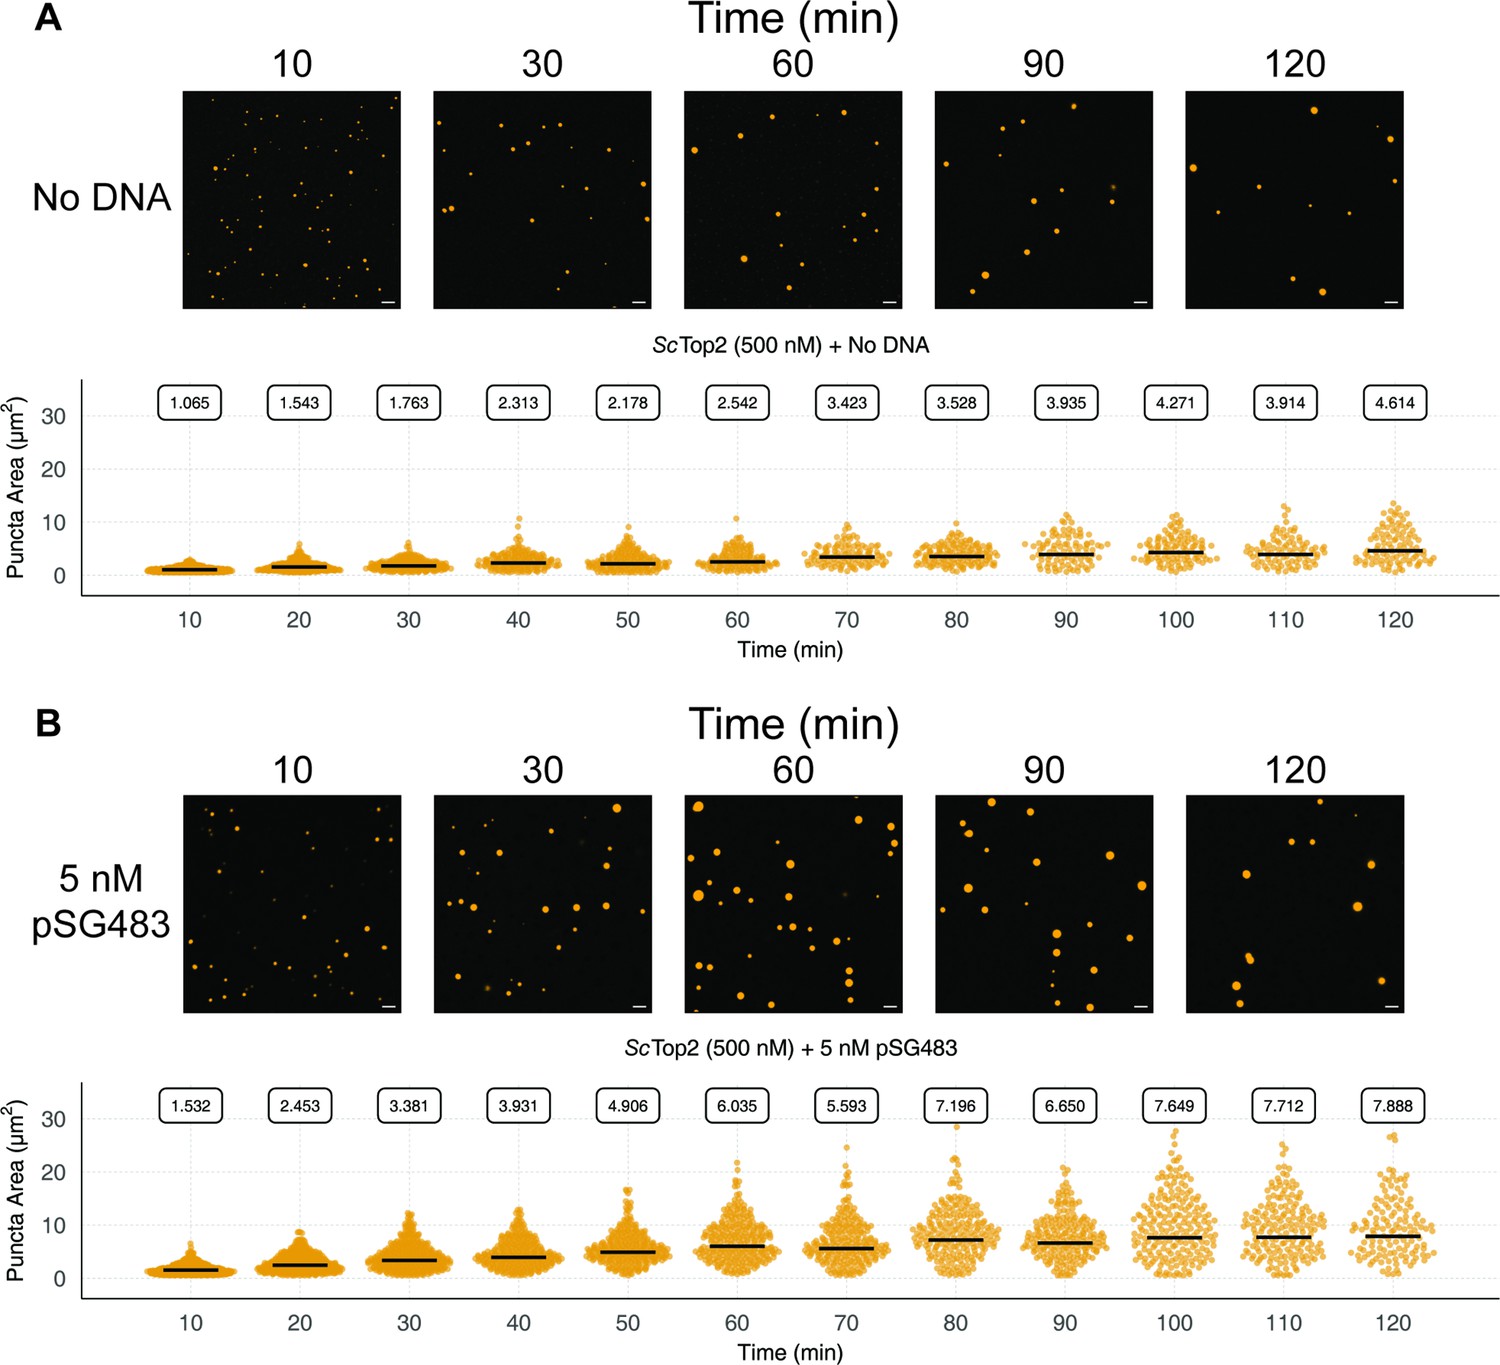
Quantification and distribution of puncta formation across 120min for ScTop2 in the (A) absence and (B) presence of DNA.
Representative images of certain timepoints are shown above quantification. Scale bar is 5µm. Quasirandom plots show the distribution of puncta area at different timepoints. Quantification was performed as per Figure 2C.
Figure 2—figure supplement 4
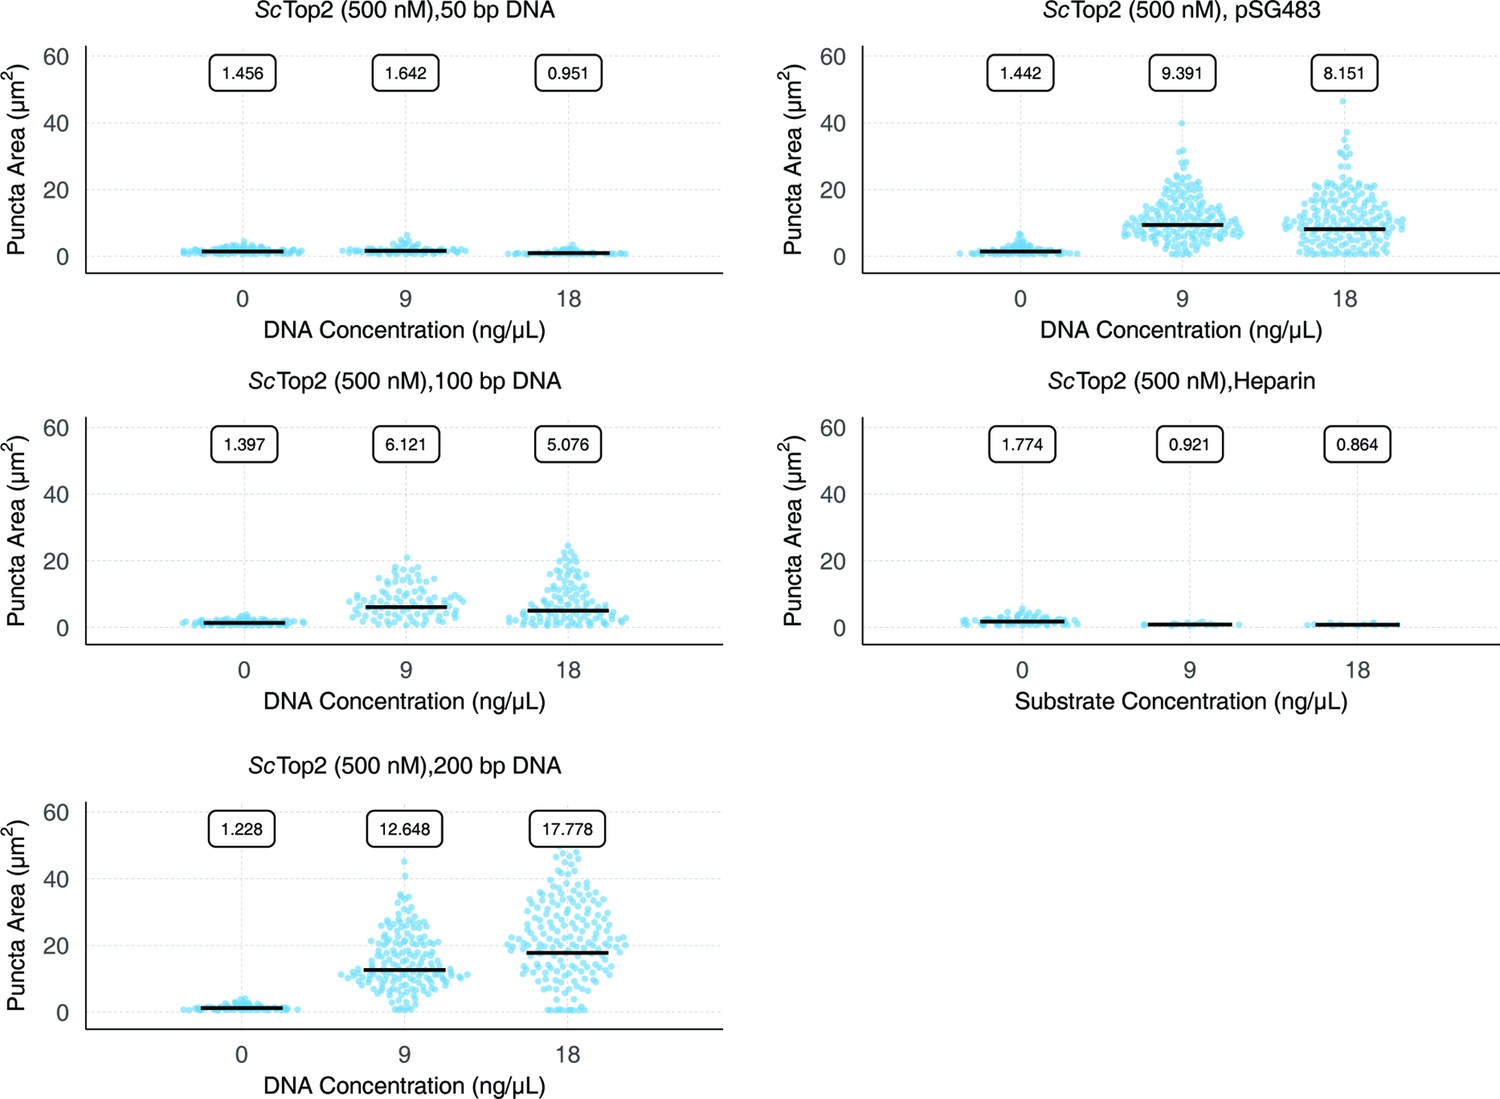
Quantification and distribution of puncta present as a consequence of DNA or heparin addition.
Quasirandom plots show the distribution of puncta area. Experiments all contain 500nM ScTop2. Quantification was performed as per Figure 2C.
Figure 3 with 1 supplement
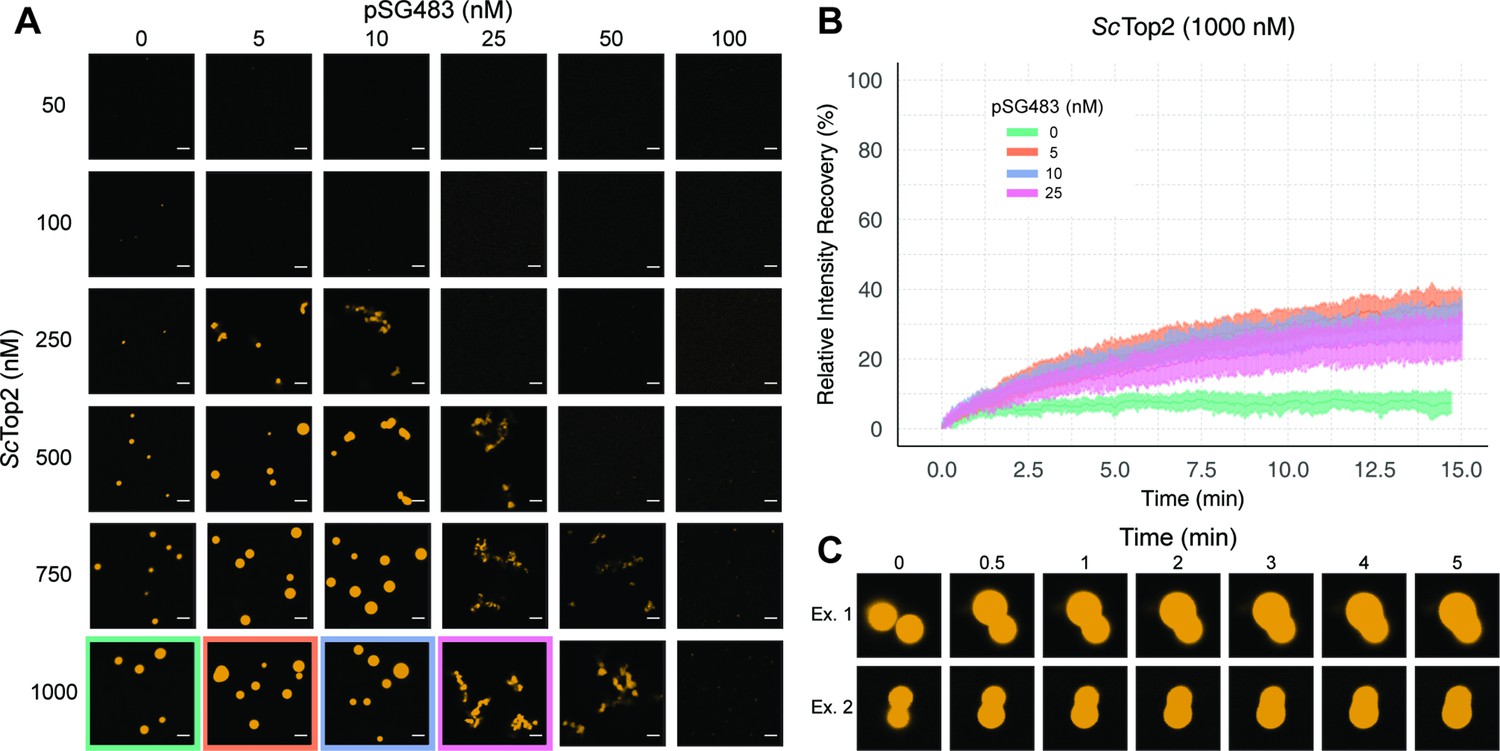
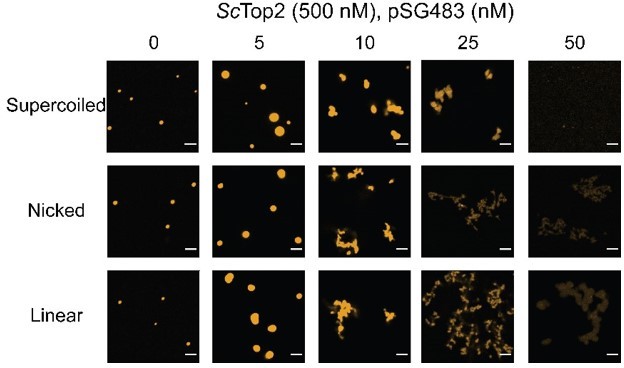
ScTop2 higher order assemblies possess liquid-like qualities in the presence of DNA.
(A) Representative images of assemblies formed during pairwise Cy3-ScTop2 and pSG483 concentration titrations. (B) Quantification of relative intensity recovered from puncta over 15min following photobleaching. For each condition, 10 different puncta were bleached across three different technical replicates. Data are fit to a mean-of-relative-intensity curve and shaded regions are the standard deviation of each sample. (C) Representative images of 1µM Cy3-ScTop2 and 5nM pSG843 time-lapses at specific time points to show fusion events between puncta. Scale bar in (A) is 5µm.
Figure 3—figure supplement 1
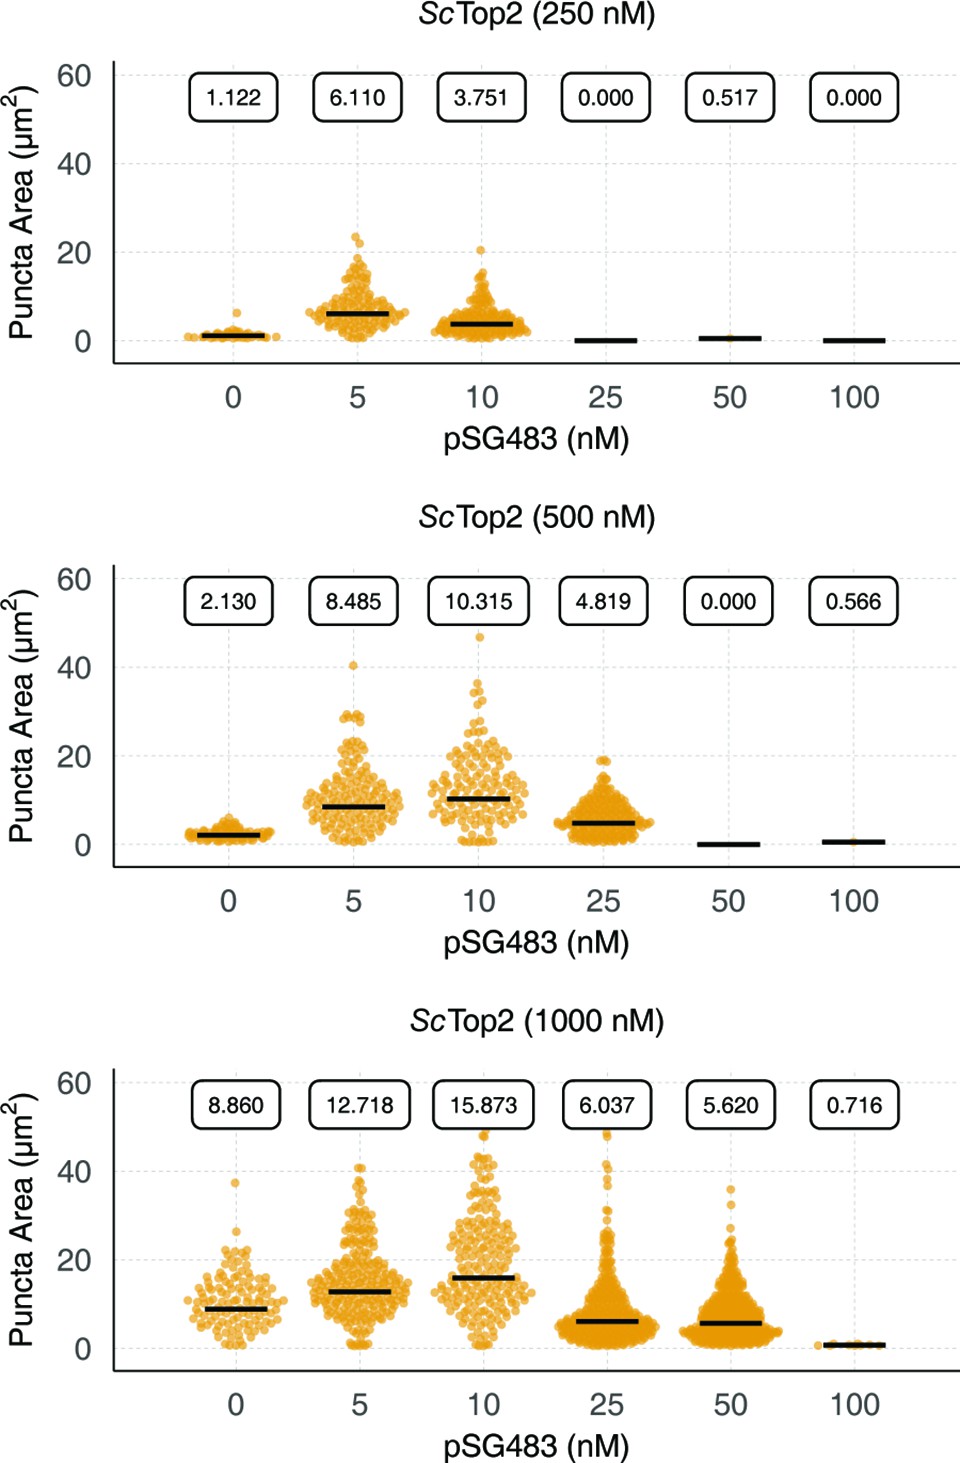
Quantification and distribution of puncta formation in response to increasing amounts of pSG483.
Quasirandom plots show the distribution of puncta area across different pairwise ScTop2 and pSG483 concentrations. Quantification was performed as per Figure 2C.
Figure 4 with 3 supplements

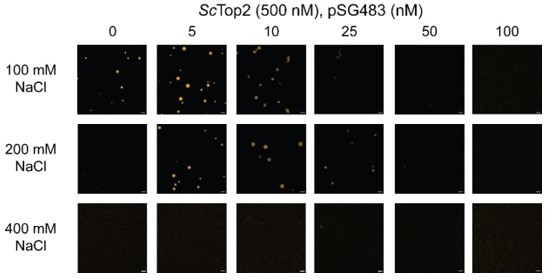
Ionic, protein-DNA interactions drive LLPS by ScTop2.
(A) Representative images of 1µM Cy3-ScTop2ΔCTD in 150mM KOAc and 1μM ScTop2CTD in 50mM KOAc mixed with and without 50nM Cy5-200 bp DNA. (B) Representative images of 500nM Cy3-ScTop2 mixed with varying concentrations of pSG483 in the presence of different buffer conditions. Control reaction has 150mM KAcetate. Salt concentrations represent the final values in solution. 1,6-hexanediol (1,6-HD) weight by volume percent was added to 150mM KAcetate solution. (C) Representative images of puncta/fibrils comparing phosphatase-treated and untreated ScTop2. (D) List of phosphorylated amino acids as identified by mass spectrometry analysis. (E) FRAP analysis of phosphatase-treated protein. (F) Quantification of mobile phase for Figures 2B and 3E Error bar is standard deviation for each condition. Two-Way ANOVA with bonferroni post hoc analysis was done on ten puncta per condition. ns is non-significant, **** means p<0.0001. Scale bars in (A), (B), and (C) are 5µm.
Figure 4—figure supplement 1
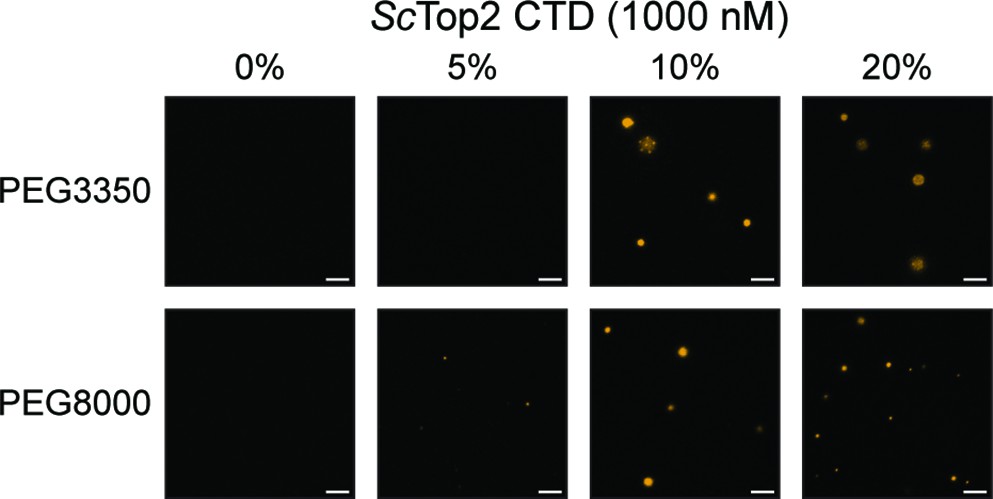
ScTop2 CTD forms puncta in the presence of PEG.
Representative images contain 1µM ScTop2 CTD mixed with varying concentrations of PEG3350 or PEG8000. Scale bars are 5µm.
Figure 4—figure supplement 2
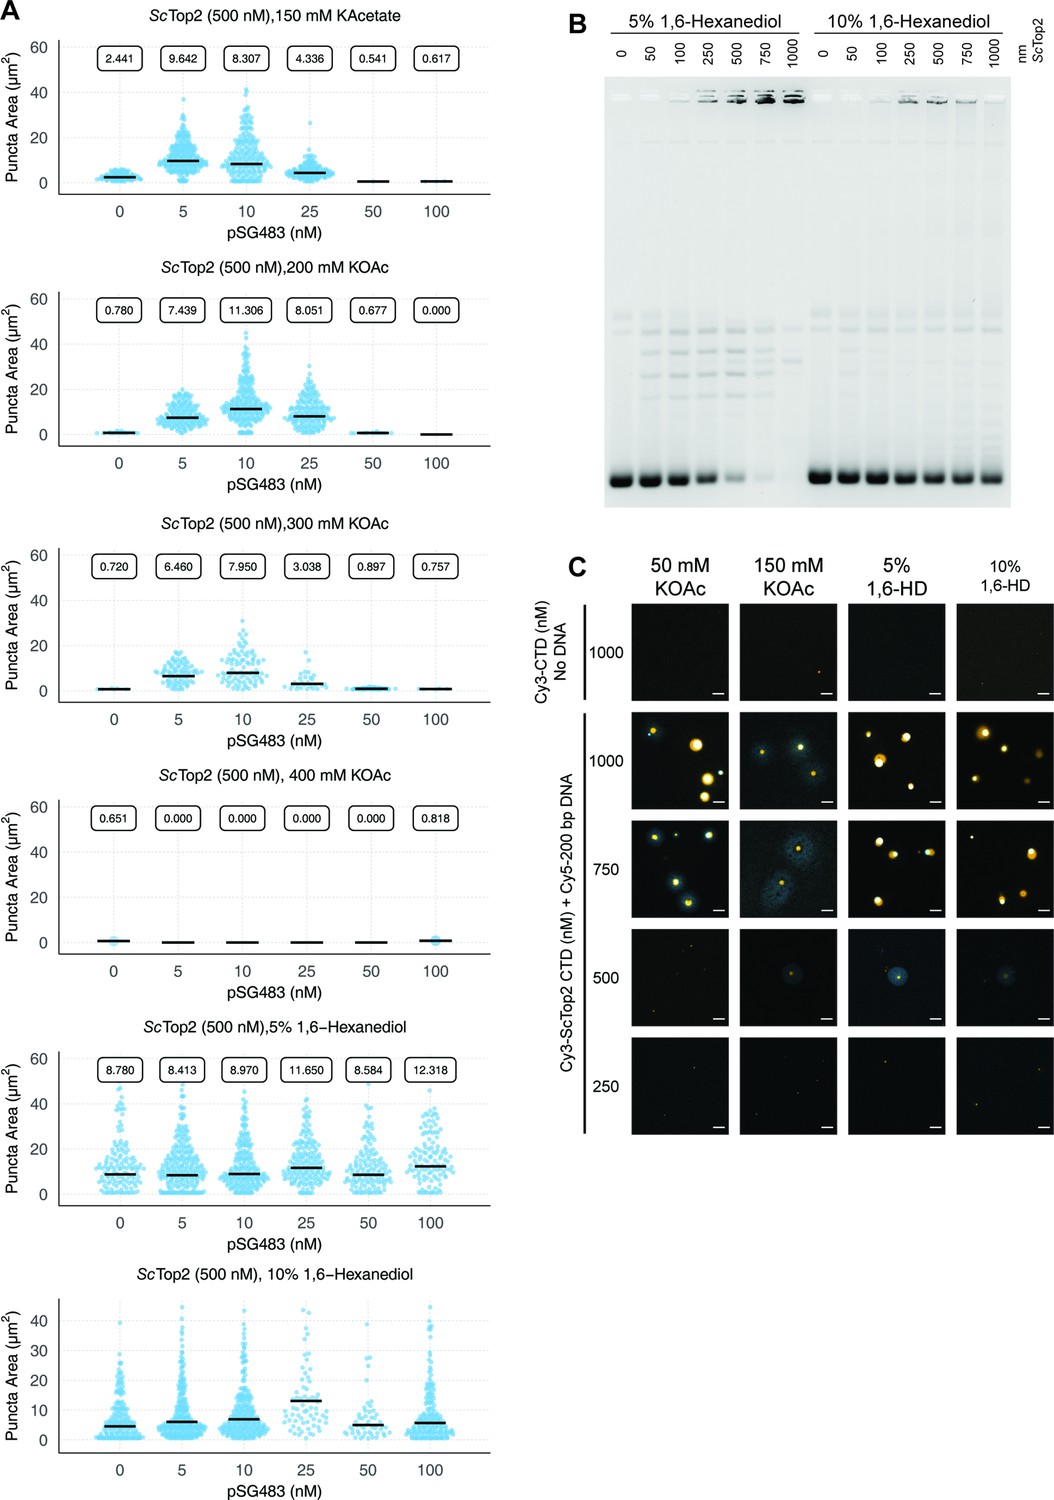
Quantification and analysis of different additives on ScTop2.
(A) Quasirandom plots showing the quantification of puncta formed by ScTop2 with varying concentrations of salt and 1,6-hexanediol added. (B) Activity assay with 5% and 10% 1,6-hexanediol added. (C) Representative images of various ScTop2CTD concentrations mixed with 50nM Cy5-200 bp DNA under different salt or 1,6-hexanediol concentrations. All 1,6-HD samples had 50mM KAcetate. Quantification was performed as per Figure 2C. Scale bars are 5µm.
Figure 4—figure supplement 3
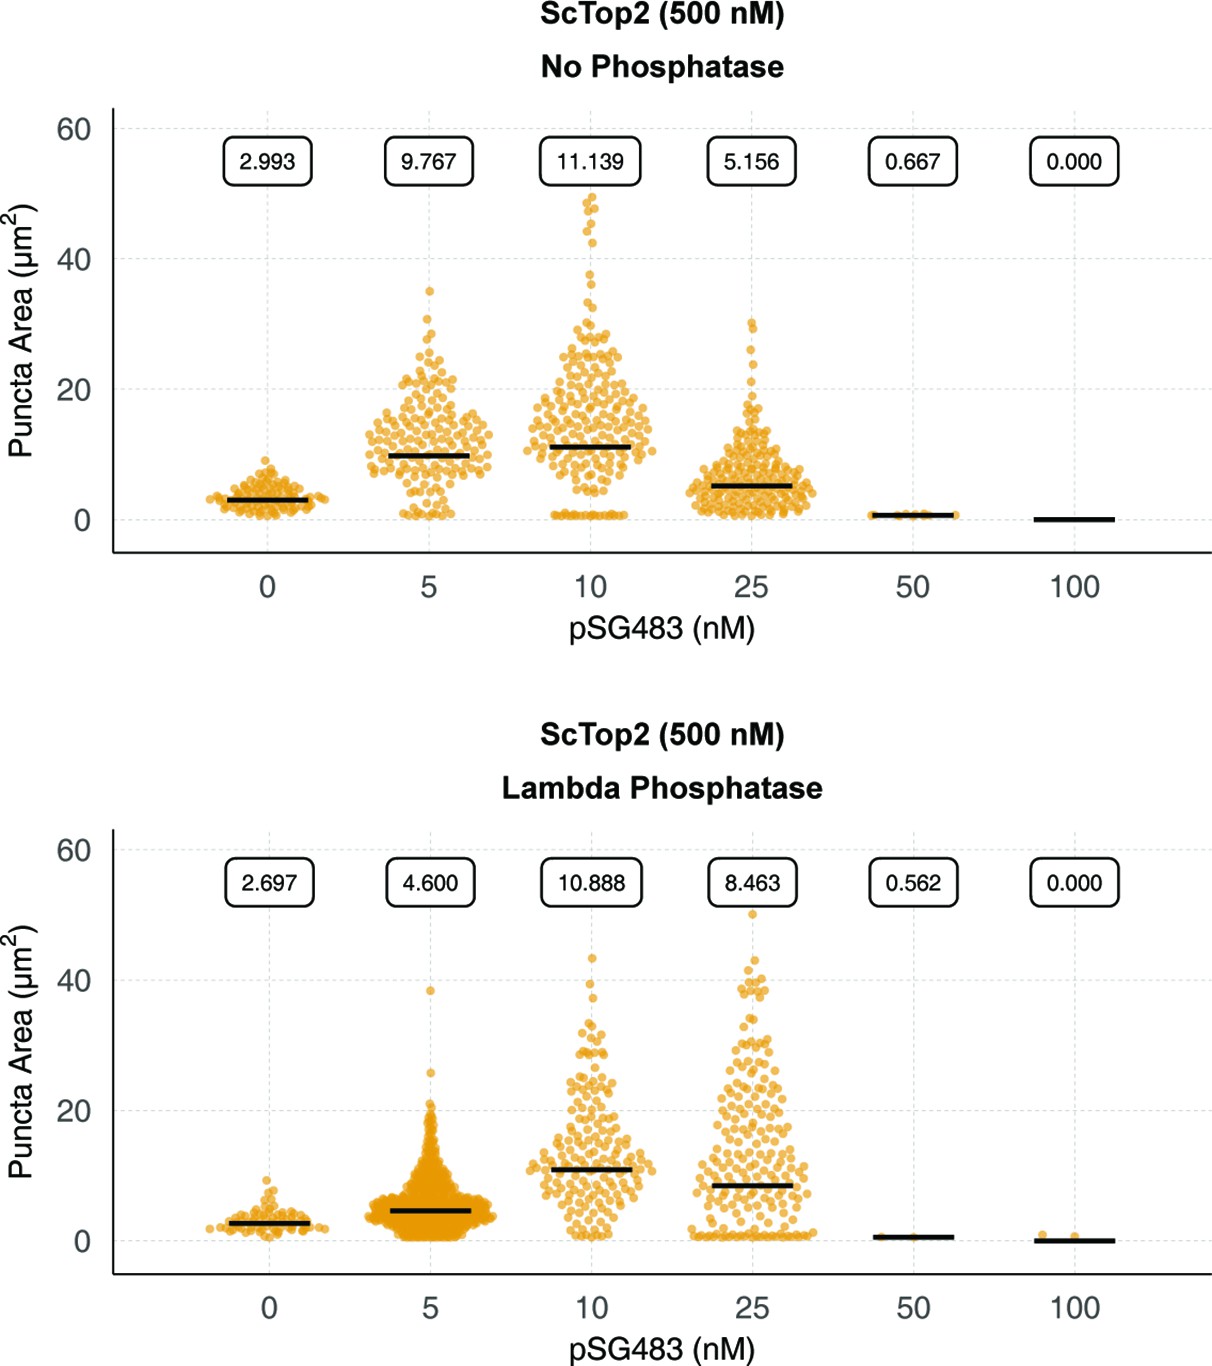
Phosphorylation status of ScTop2 alters condensate properties.
Quantification of puncta from control and lambda phosphatase-treated protein. Quantification was performed as per Figure 2C.
Figure 5 with 1 supplement
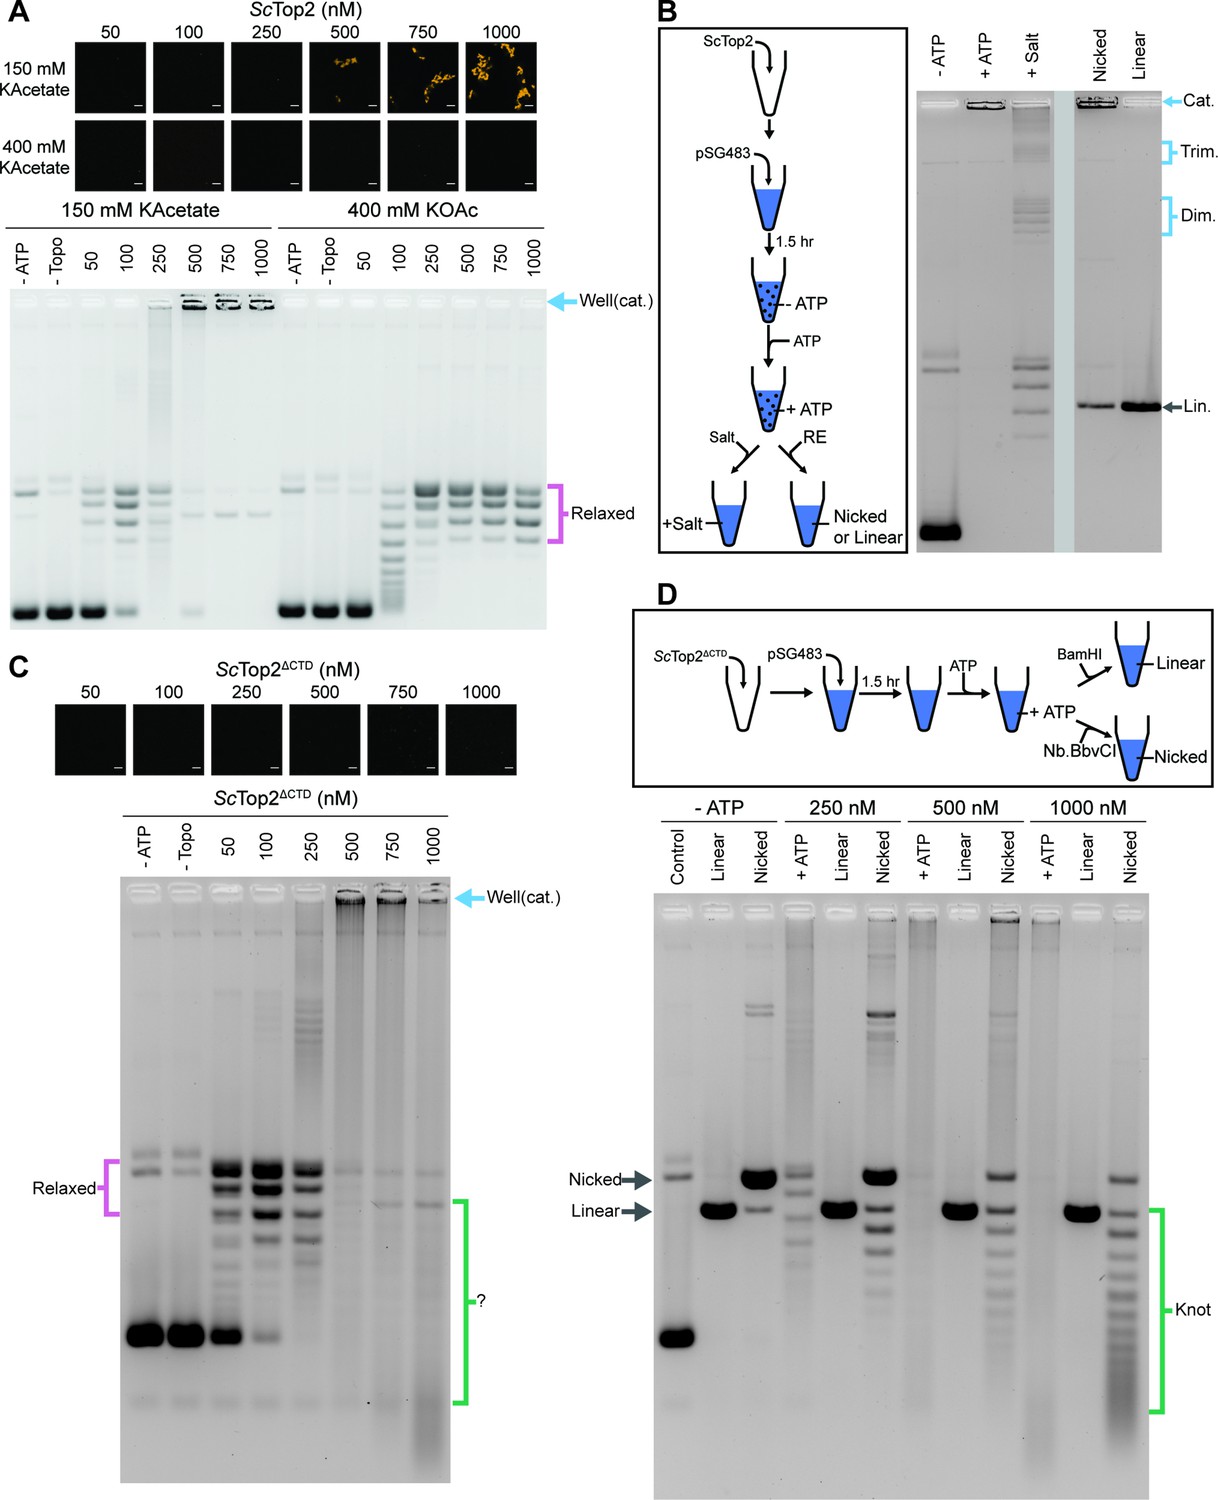
The ScTop2 CTD modulates protein catenation versus knotting.
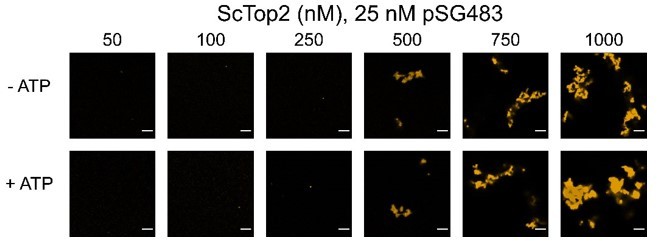
(A) Activity assay at different ScTop2 concentrations with 25nM pSG483 and either 150mM or 400mM KAcetate. LLPS does not occur at the higher salt concentration. Confocal images were taken before the addition of ATP and with Cy3-labeled protein. ScTop2 concentration in the ‘no ATP’ reaction is 1μM. No ATP and no topoisomerase reactions are shown as negative controls. (B) Modified activity assay with 1μM ScTop2 and 25nM pSG483. Workflow is shown at right. (C) Activity assay performed with ScTop2ΔCTD and 25nM pSG483. Confocal images were taken before the addition of ATP. Controls are similar to (A). (D) Modified activity assay of different ScTop2ΔCTD concentrations with 25nM pSG483 where reactions were treated with restriction enzymes to linearize or nick reaction products. ‘–ATP’ samples show where supercoiled, linear, and nicked samples run on the gel. Workflow is shown at top. Scale bars in (A) and (C) are 5µm.
Figure 5—figure supplement 1
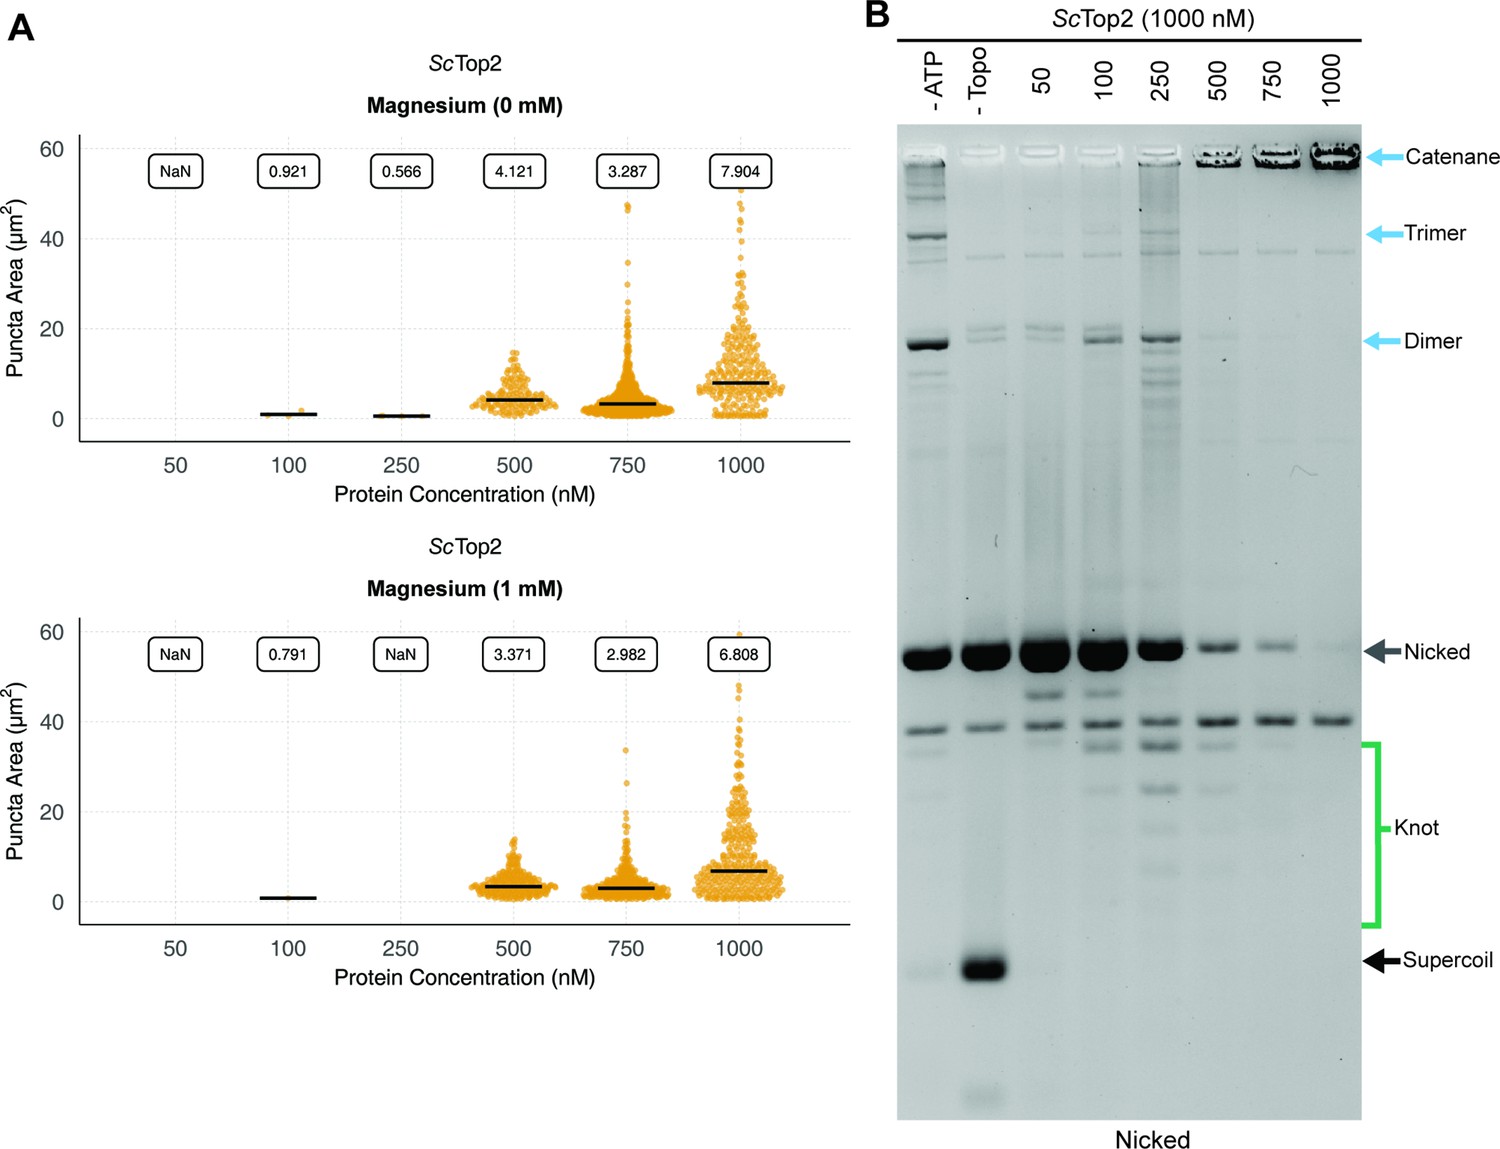
Magnesium effects and knotting propensity during LLPS by ScTop2.
(A) Magnesium does not affect LLPS by ScTop2. Quantification of puncta with varying concentrations of ScTop2 mixed with 25nM pSG483 in the presence and absence of 1mM magnesium. Quantification was performed as per Figure 2C. (B) Full length ScTop2 forms a small population of knots prior to promoting catenation. An activity assay of full length ScTop2 is shown in which DNA substrates were nicked to reveal knots formed by the enzyme. All lanes contain nicked DNA.
Figure 6 with 1 supplement
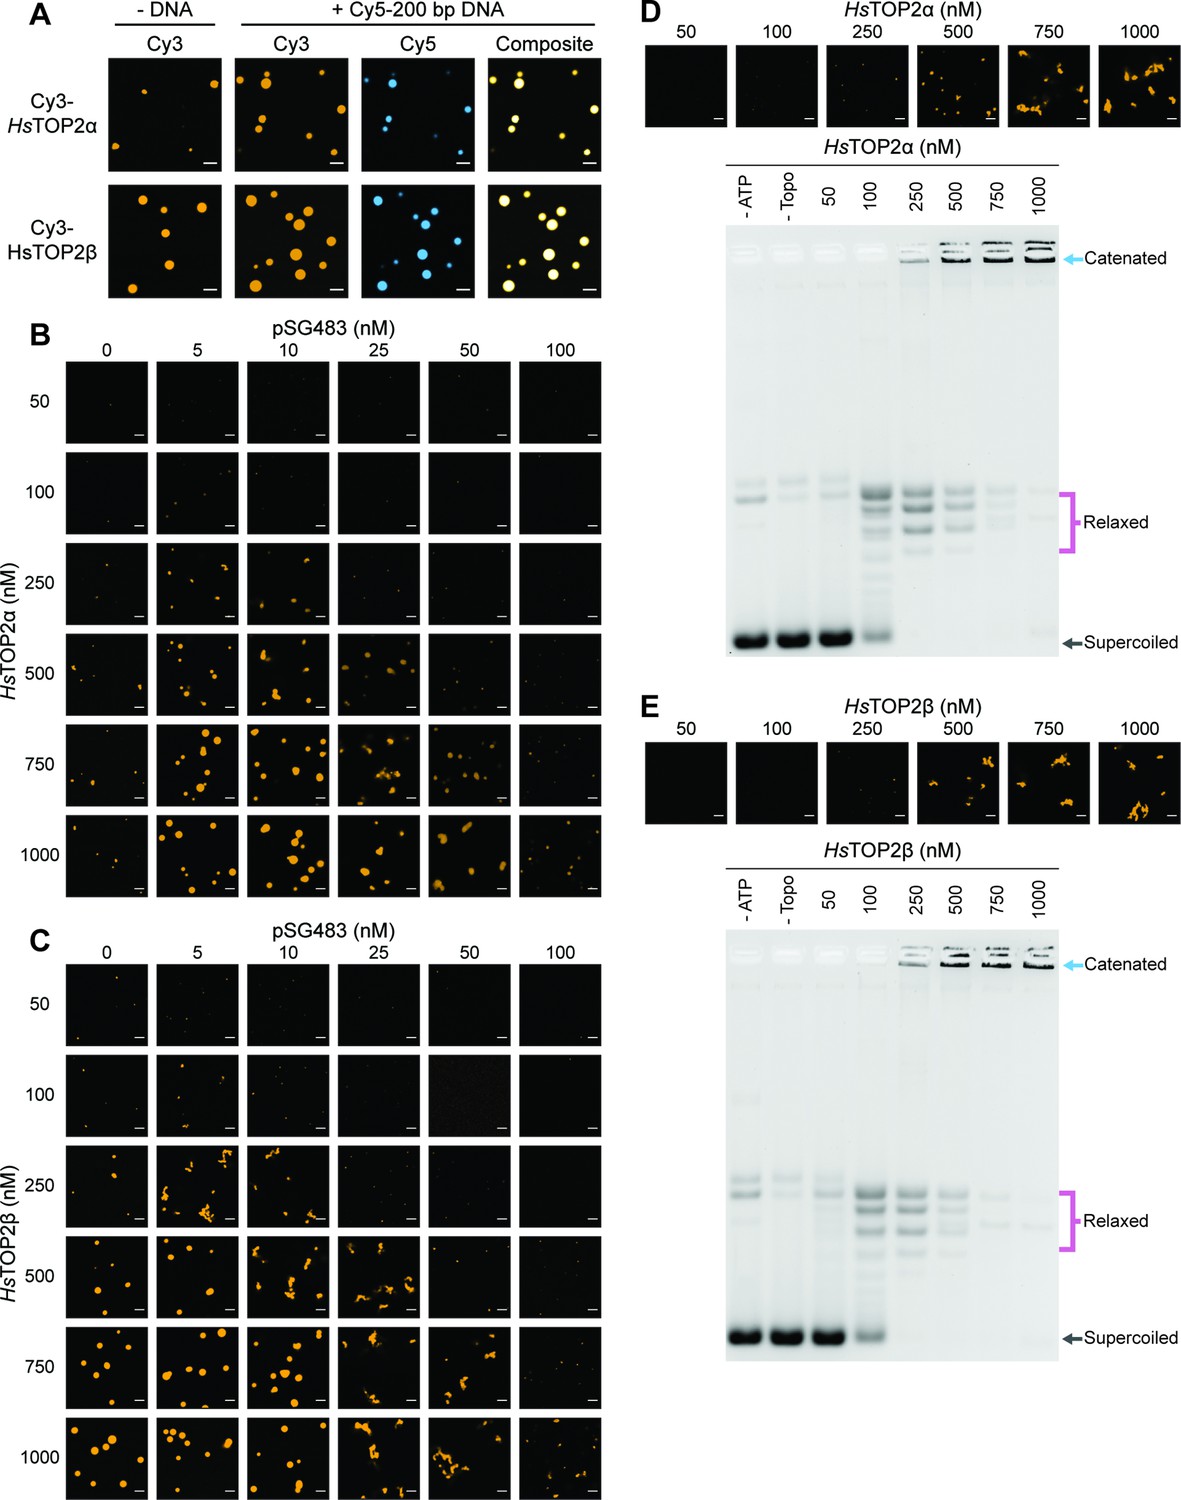
Human topo IIs form condensates and LLPS drives catenation.
(A) Representative images of 1µM Cy3-HsTOP2α and Cy3-HsTOP2β each with and without 50nM Cy5-200 bp DNA. (B, C) Confocal images of a pairwise titration of different Cy3-HsTOP2α and Cy3-HsTOP2β concentrations, respectively, with different concentrations of pSG483. (D, E) Activity assays at different HsTOP2α and HsTOP2β concentrations, respectively, with 25nM pSG483. Concentration of topo II in the ‘no ATP’ lane is 1µM. Confocal micrographs of puncta were taken with Cy3-labeled protein and before adding ATP. Scale bars in (A) and (B) are 5µm.
Figure 6—figure supplement 1
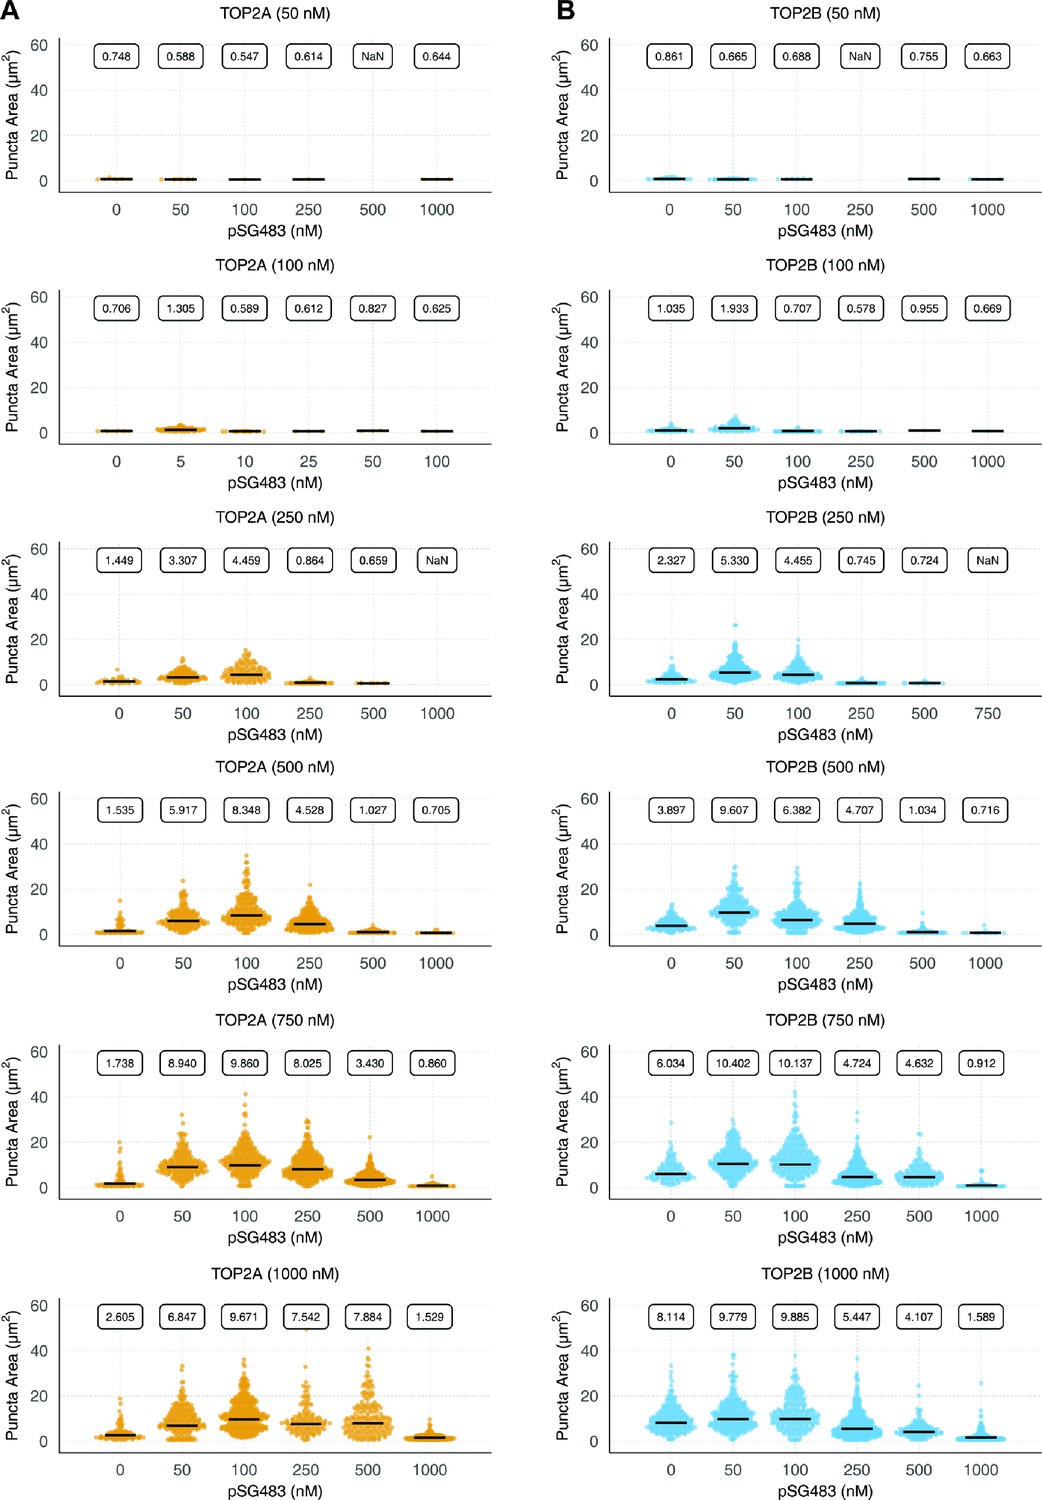
Puncta formation by human topo IIs is stimulated by DNA.
Quasirandomplots showing quantification of pairwise human (A) TOP2α and (B) TOP2β concentrations with varyingpSG483 concentrations. Quantification was performed as per Figure 2C.
Figure 7 with 1 supplement
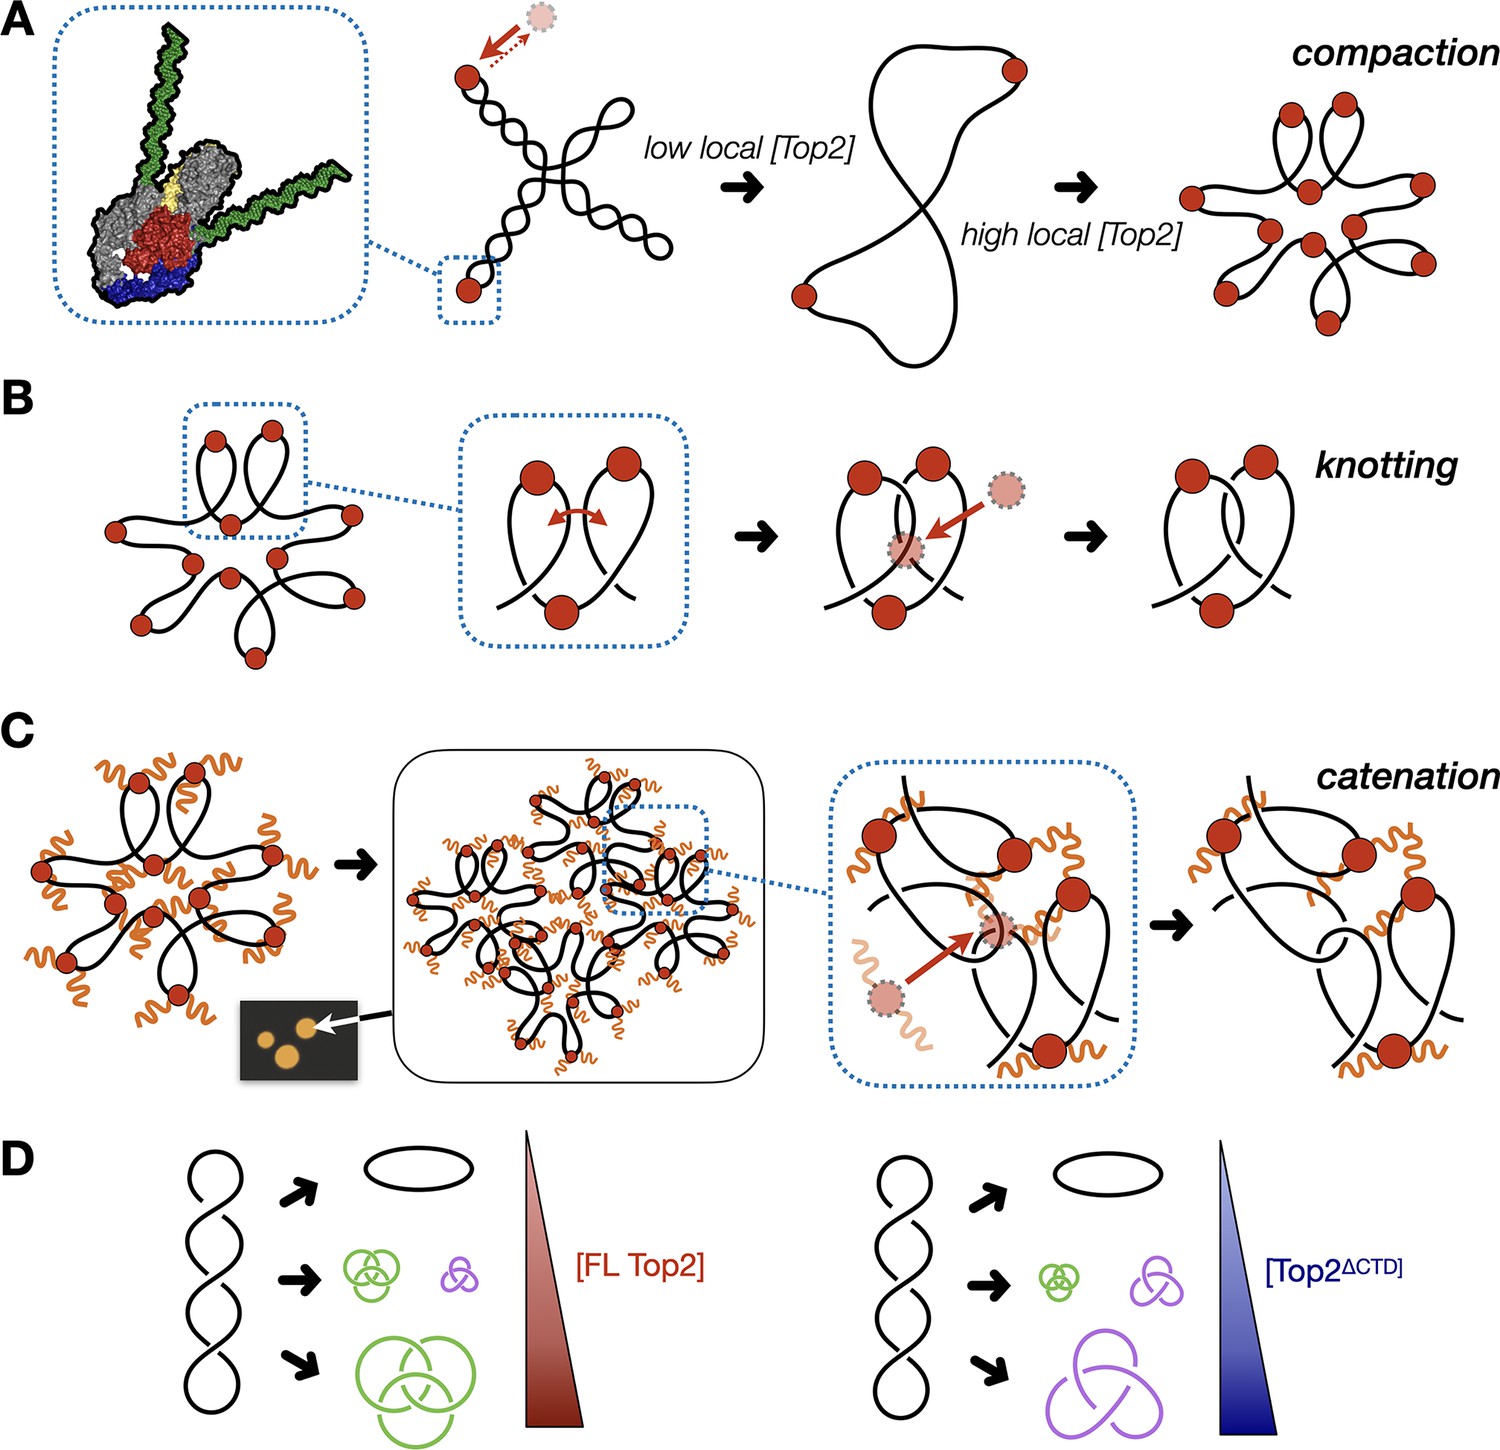
Model for multivalent interactions that drive topo II LLPS and how phase separation affects the steady state of topological states in vitro.
(A) Low concentrations of topo II favor supercoil relaxation. Higher concentrations of topo II begin to compact DNA due to DNA bending by the cleavage core. (B) DNA compaction by topo II promotes knotting as crossovers transiently formed between loops within the same segment of DNA are acted upon on by the enzyme. (C) The topo II C-terminal domain aids in bridging together distal segments of DNA to favor the formation of inter-linked plasmids. (D) Schematic depicting how the relative distribution of topological species produced by topo II shifts as a function of protein concentration and depending on the presence or absence of the topo II CTD.
Figure 7—figure supplement 1
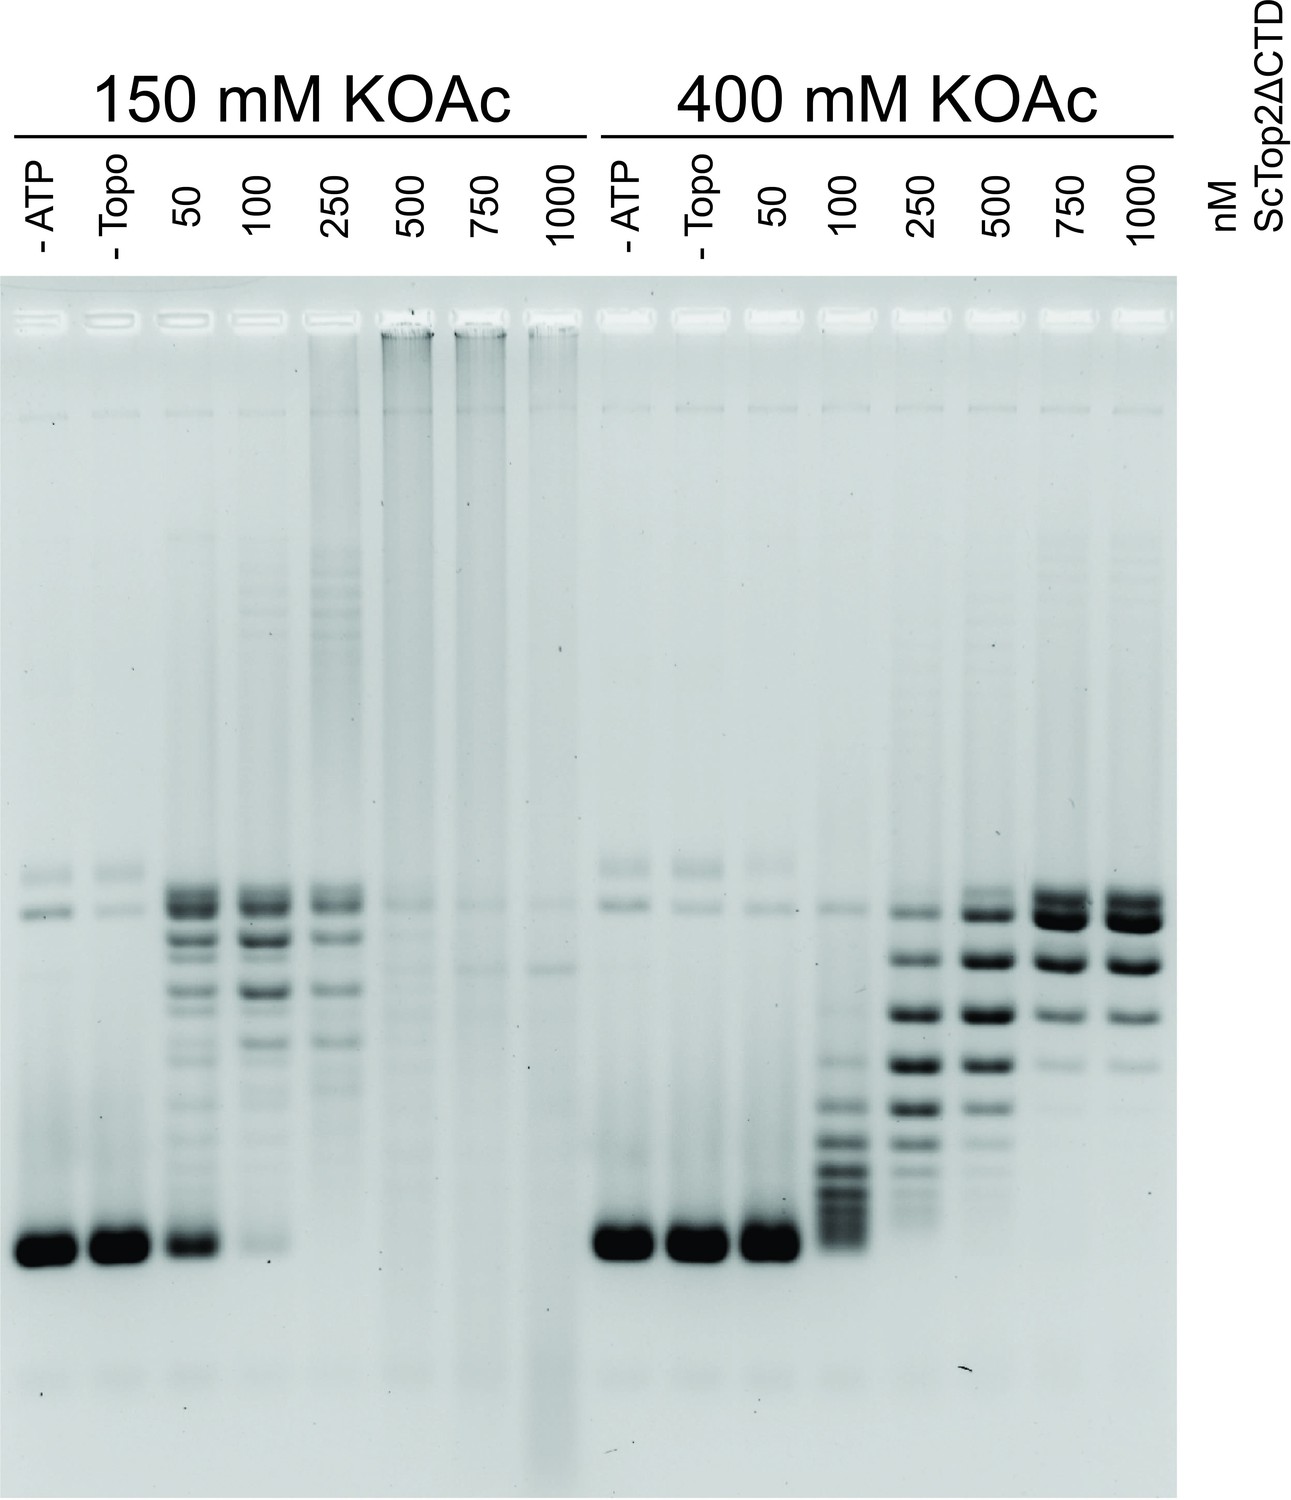
DNA binding with ScTop2ΔCTD contributes to knot formation.
Activity assay of with various ScTop2ΔCTD concentrations at low and high salt concentrations in the presence of 25nM pSG483. As the plasmid is not nicked in this assay, the knotted species are evident by the smearing in the low salt (150mM KOAc) reactions as protein concentration is increased.
Author response image 1

Author response image 2
Author response image 3
Author response image 4
Author response image 5
Tables
Key resources table
| Reagent type (species) or resource | Designation | Source or reference | Identifiers | Additional information |
|---|---|---|---|---|
| Peptide, recombinant protein | ScTop2 | This paper | Purified from S. cerevisiae | |
| Peptide, recombinant protein | ScTop2ΔCTD | This paper | Purified from E. coli, 1–1177 | |
| Peptide, Recombinant protein | ScTop2CTD | This paper | Purified from S. cerevisiae, 1178–1428 | |
| Peptide, Recombinant protein | HsTOP2α | This paper | Purified from S. cerevisiae | |
| Peptide, Recombinant protein | HsTOP2β | This paper | Purified from S. cerevisiae | |
| Peptide, recombinant protein | BamHI-HF | NEB | Cat#R3136T | |
| Peptide, recombinant protein | Nb.BbvCI | NEB | Cat#R0631S | |
| Recombinant DNA reagent | 12URA-B (plasmid) | Addgene | Cat#48304 | Yeast Expression Vector |
| Recombinant DNA reagent | 12URA-C (plasmid) | Addgene | Cat#48305 | Yeast Expression Vector |
| Recombinant DNA reagent | 1B (plasmid) | This paper | Modified version with Hisx14-SUMO tag. | |
| Recombinant DNA reagent | pUC57 | Thermofisher Scientific | Cat##SD0171 | |
| Sequence-based reagent | 50 bp-F | IDT | Oligo for annealing with R | CATGCATACACGAGCTGCACAAACGA GAGTGCTTGAACTGGACCTCTAGT |
| Sequence-based reagent | 50 bp-R | IDT | Oligo for annealing with R | ACTAGAGGTCCAGTTCAAGCACTCTCG TTTGTGCAGCTCGTGTATGCATG |
| Sequence-based reagent | 100 bp-F | IDT | PCR Primer | AGTGTGATGGATATCTGCAGA |
| Sequence-based reagent | 100 bp-R | IDT | PCR Primer | TTTAAGCGGTGCTAGAGCTT |
| Sequence-based reagent | 200 bp-F | IDT | PCR Primer | GGGAAACCTGTCGTGCC |
| Sequence-based reagent | 200 bp-R | IDT | PCR Primer | ACATGTTCTTTCCTGCGTTATCCCC |
| Chemical compound, drug | Cyanine3 NHS-Ester | Lumiprobe | Cat#21020 | |
| Chemical compound, drug | Cyanine5 NHS-Ester | Lumiprobe | Cat#23020 | |
| Chemical compound, drug | Heparin Sodium | Fisher Scientific | Cat#BP2425 |
Additional files
Download links
A two-part list of links to download the article, or parts of the article, in various formats.
Downloads (link to download the article as PDF)
Open citations (links to open the citations from this article in various online reference manager services)
Cite this article (links to download the citations from this article in formats compatible with various reference manager tools)
DNA-Stimulated Liquid-Liquid phase separation by eukaryotic topoisomerase ii modulates catalytic function
eLife 11:e81786.
https://doi.org/10.7554/eLife.81786


