Improved T cell receptor antigen pairing through data-driven filtering of sequencing information from single cells
- Department of Health Technology at Technical University of Denmark, Denmark
Figures
Figure 1 with 1 supplement

Schematic of experimental design.
(A) Schematic of the experimental strategy. All samples are incubated with the same library of barcode-labeled pMHC multimers and subsequently with a sample-specific barcode-labeled hashing antibody to individually label cells derived from a given sample. Multimer-binding cells from all samples are sorted in bulk and processed through the 10x Chromium workflow. The sequencing output simultaneously captures the sample barcode, the pMHC barcode, and the TCR sequences, which are all matched to a single cell based on the 10x barcode. This also provides the means of retrospectively assigning each cell to their sample of origin via the sample-specific hashing barcode. (B) Example showing how the allophycocyanin (APC)-labeled pMHC multimers are sorted collectively from all samples into one tube that is further carried into the 10x workflow. The phycoerythrin (PE)-labeled pMHC multimers are not sorted and hence deselected. A total of 1800 APC-labeled cells are sorted from each donor. Here showing BC126 (large dotplot) and BC341 (small dotplot).
Figure 1—figure supplement 1
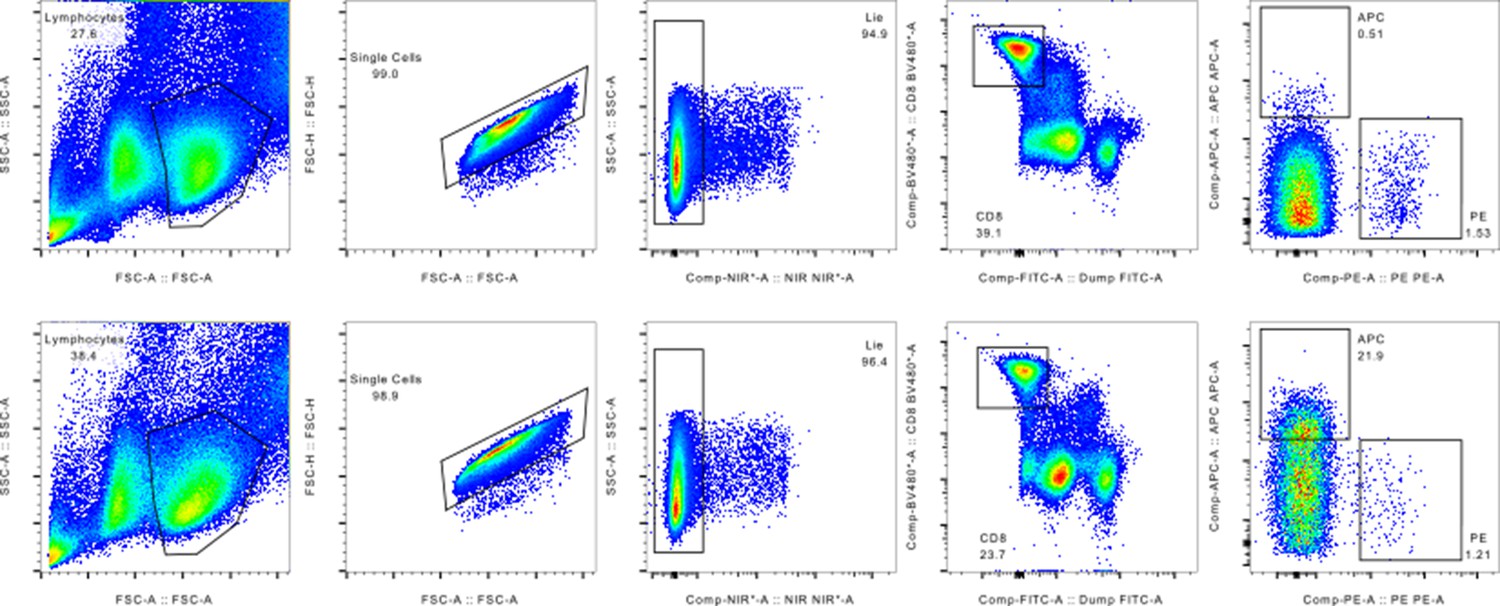
Gating strategy employed for sorting out pMHC binding MHC multimers isolated for single-cell processing.
Figure 2
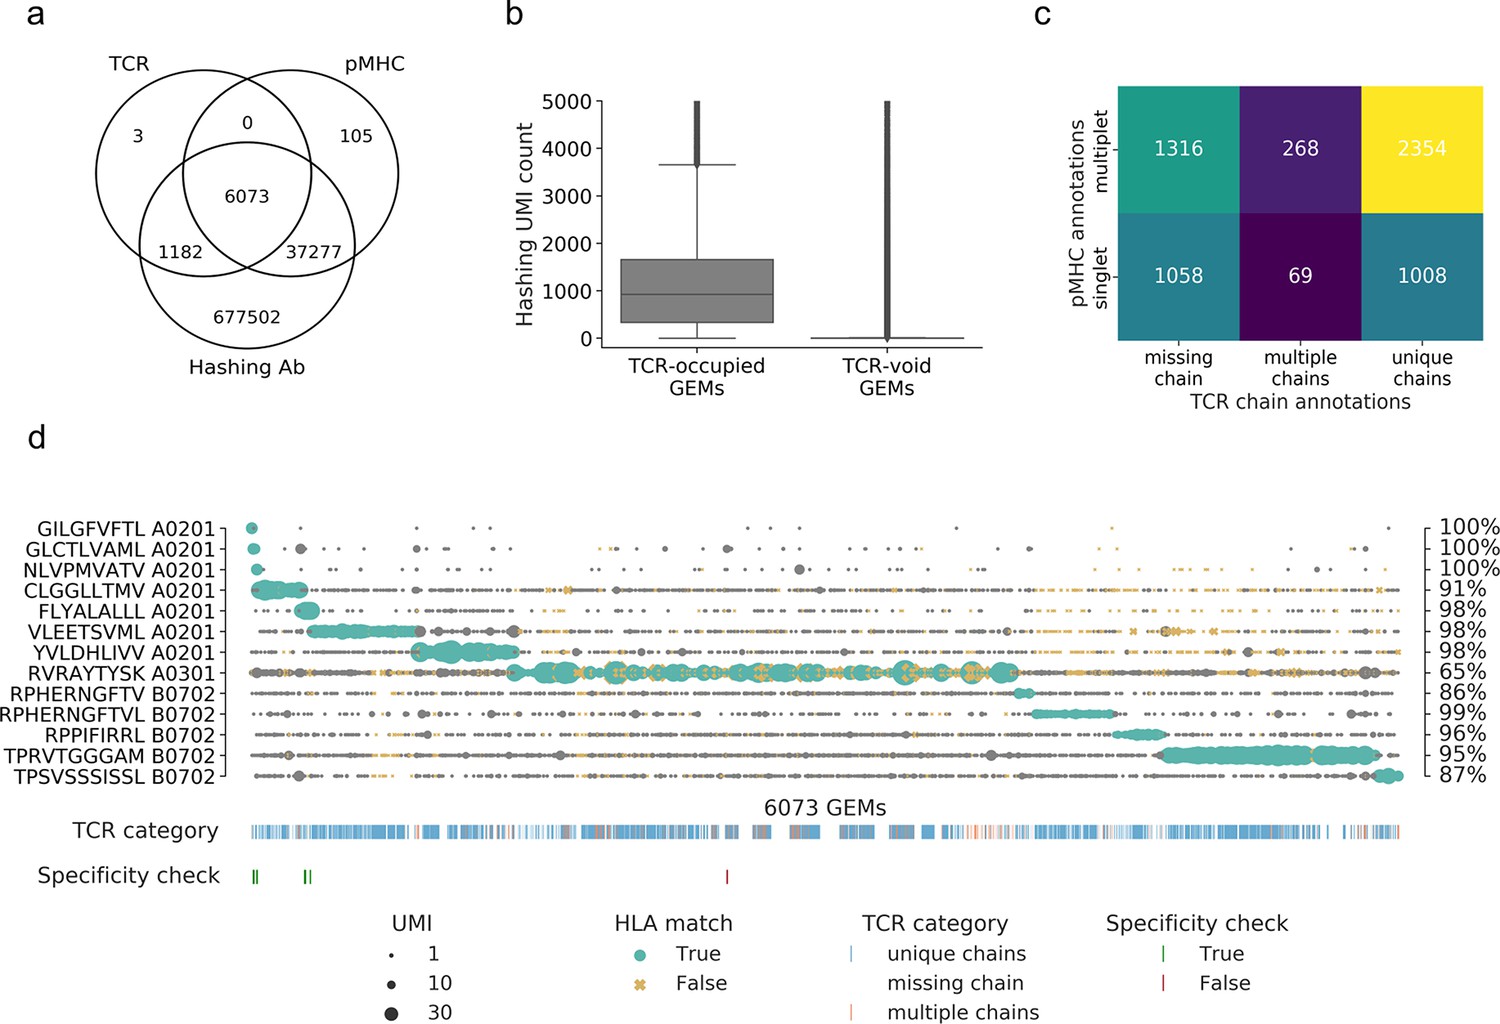
Summary of raw data.
(a) Venn diagram of the content of all gel-beads in emulsion (GEMs) from 10x Chromium drop-seq. Each GEM is expected to contain three components: transcripts of TCR and DNA barcodes from the target pMHC multimer as well as the sample hashing antibody. The Venn diagram illustrates the extent of GEMs with complete capture (capture of all three components) in contrast to the GEMs with incomplete capture (capture of a subset of components). (b) Comparison of distributions of unique molecular identifier (UMI) counts of sample hashing barcode between GEMs that contain TCR transcripts (TCR-occupied GEMs) and GEMs that do not contain TCR transcripts (TCR-void GEMs) (p<0.0005, Mann–Whitney U). (c) Matrix of the distribution of pMHC singlets and multiplets across GEMs with TCRs either missing a chain, detected with multiple chains, or with a single, unique αβ-pair. The counts are given for each field and illustrated by a color. The lighter color represents higher counts. (d) Scatterplot of all detected pMHC barcodes (y-axis) within each of the 6073 GEMs (x-axis) that contain all three components: TCR, pMHC, and sample hashing. In each GEM, the most abundant pMHC is marked with green, while the remaining pMHCs in the GEM are gray. The marker size reports the UMI count of the given pMHC. The marker shape and color recount whether the HLA allele of the pMHC matches the HLA haplotype of the donor, which is deduced from sample hashing (yellow x: non-matching HLA). The fraction of HLA matches within the GEMs displaying a given specificity is annotated to the right of the plot. The first colorbar indicates the type of TCR chain annotation; whether the TCR has a unique αβ-pair, is missing a chain or consists of multiple chains. The second colorbar is a specificity check against the specificity databases IEDB and VDjdb. Colors highlight the GEMs where the CDR3αβ sequences are contained in the databases. The green color represents a match between the database pMHC and the detected pMHC, while red indicates a mismatch.
Figure 3 with 3 supplements

An example of pMHC concordance in clonotype 1 (example from pilot study).
(a) All detected pMHC (y-axis) in each gel-bead in emulsion (GEM) (x-axis, n = 467) of clonotype 1. The marker size shows the unique molecular identifier (UMI) count for the particular pMHC in a given GEM, and the color indicates the pMHC with the highest UMI count, similar to what is shown in Figure 1d. If two pMHCs are equally abundant in a GEM, they are both colored. No marker means no detection of that pMHC in that given GEM. (b) The compiled distribution of UMI counts for each peptide (assigning 0 UMI when the pMHC is not detected in a GEM). The asterisk marks that a Wilcoxon test showed that the UMI counts of TPR B0702 were on average higher than for VTE A0101 UMI counts. (c) The specificity concordance across the GEMs of clonotype 1. Concordance is shown by a color gradient, that is, the larger the fraction of GEMs supporting a given specificity the darker the color.
Figure 3—figure supplement 1
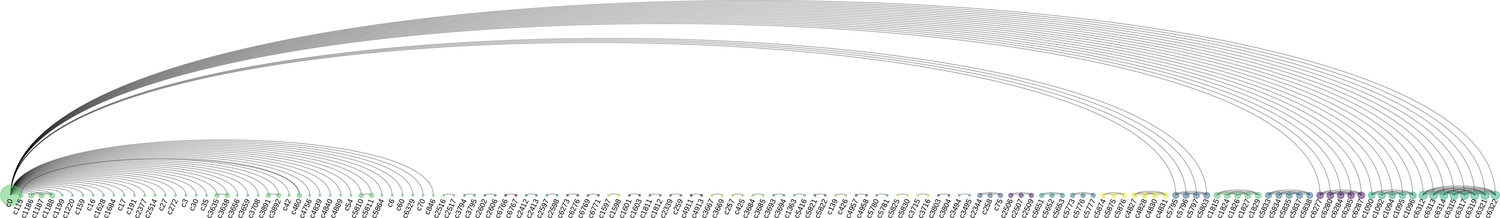
Clonotype replicas sharing VJ-CDR3ab.
Arc diagram revealing shared VJab-genes and CDR3ab sequences across clonotypes defined by 10x Cellranger. Each node is a clonotype and the size reflects the magnitude gel-beads in emulsion (GEMs) in that clonotype sharing VJab-genes with GEMs of other clonotypes. The first node (c0, green) consists of the GEMs with no 10x clonotype annotation, while the remaining (c > 0) are annotations by 10x Cellranger. The diagram reveals clonotype duplets (single arc connections), triplets (two arcs), quadruplets, quintuplets, and even a single sextuplet. Since node c0 is a mixture of GEMs that were not annotated, the GEMs in this group will match many different clonotypes. Once a c0 VJ-CDR3 matches a clonotype that already is a replicate, the GEM will of course match all of them.
Figure 3—figure supplement 2
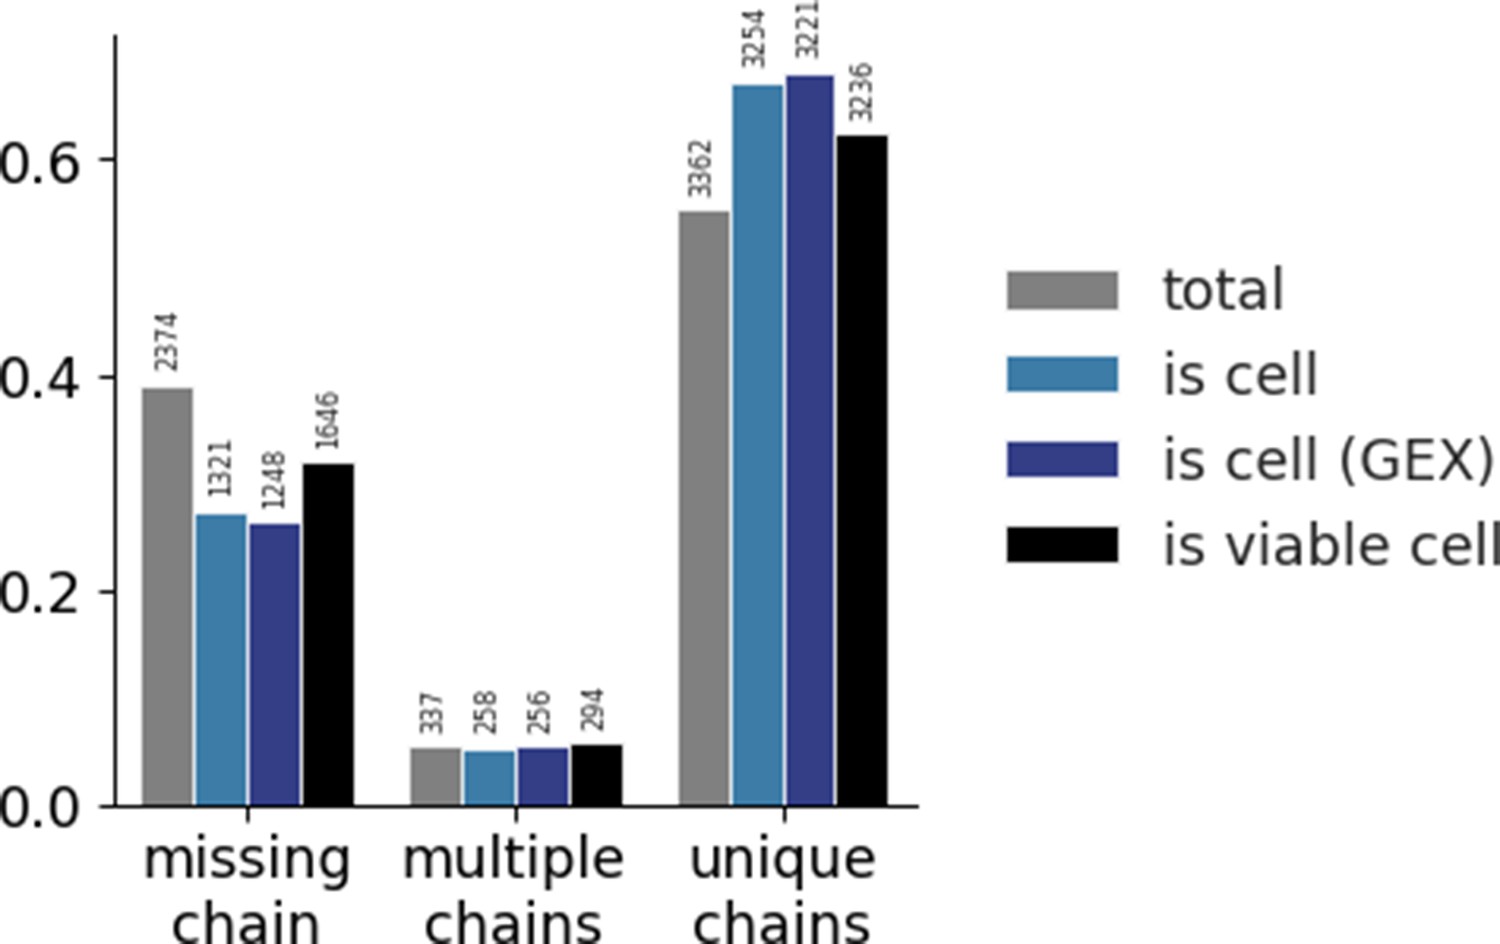
Distribution of the three categories of TCR chains across different methods of filtering.
Gel-beads in emulsion (GEMs) are categorized in one of three categories based on the detection of α- and β-chains: TCRs missing any chain, TCRs with multiple α- and/or β-chains, and TCRs with a unique set of one α- and one β-chain. The colors each represent a filtering step. The gray bars present the raw, total data with no filtering. The light blue bars present filtering on 10x Genomic’s Cellranger ‘is cell’ call based on transcript level of TCR sequences only. The dark blue bars present filtering on 10x Genomic’s Cellranger ‘is cell’ call based on transcript level of gene expression (GEX) sequencing. The black bars present filtering of GEX data on mitochondrial load and gene counts. For each step of filtering, the counts within each category are normalized and the total value is listed above the bar. The raw data has a larger proportion of missing chain TCRs than the filtered sets. Filtering on ‘is cell’ based on GEX data yields the largest proportion of unique chains. None of the filters completely nor substantially reduces the proportion of TCRs missing a chain or with multiple chains. See also supplementary note.
Figure 3—figure supplement 3
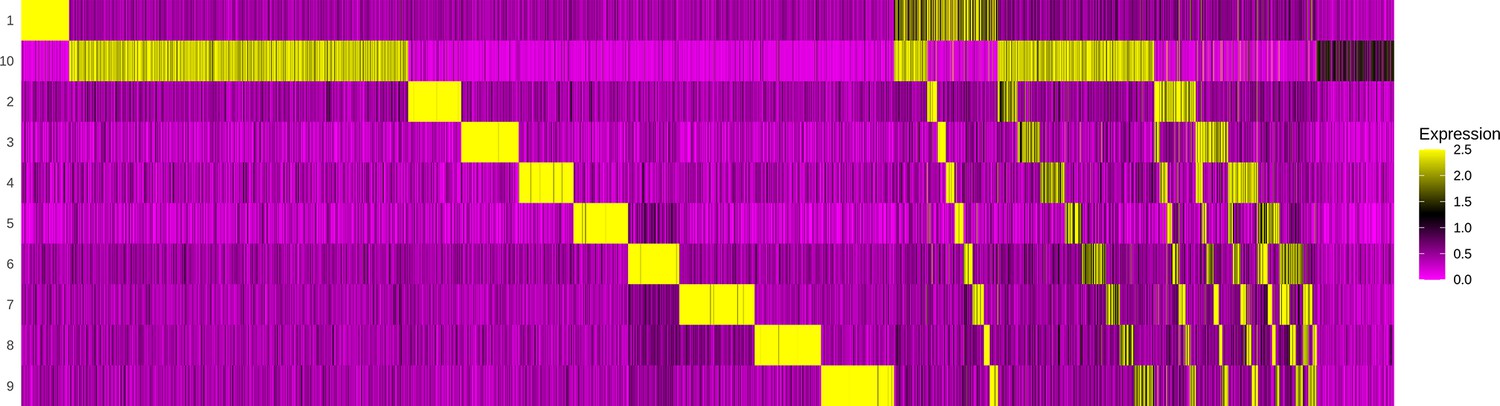
Demultiplexing cell hashing using Seurat.
The gel-beads in emulsion (GEMs) (x-axis) are evaluated by the abundance of each sample barcode of 10 possible hashings (y-axis). The first section of the heatmap contains GEMs with unambiguous annotation to one sample. The second section illustrates how some GEMs contain barcodes for two samples, which might indicate a doublet, that is, a capture of two T cells in one GEM. The last section reveals GEMs where no barcodes above a certain threshold were detected, and hence must be a result of leakage and can be discarded as noise.
Figure 4

Intra- and inter TCR similarity scores per peptide of the (a) total (unfiltered) data set and (b) the data filtered by the optimized threshold.
The similarity per peptide plots (a and b) illustrates the distribution of paired similarity scores for each clonotype (containing both α- and β-chain). For each pMHC, each clonotype is compared to the remaining clonotypes of the same specificity (intra) and across specificities (inter). The count of compared clonotypes is listed just to the right of the y-axis in both (a) and (b). (c) displays the pooled intra- and inter-scores across all peptides for each of the filtering methods: total (no filtering), optimal threshold, matching HLA, hashing singlets, complete TCRs, specificity multiplets, ‘is cell’ by cell-flagging, ‘is cell’ by cell-flagging when including GEX data, and viable cell from analyzing GEX data. An asterisk marks filters where intra-similarity is significantly larger than inter-similarity (Wilcoxon, α = 0.05). (d) displays the pooled intra- and inter-scores across all peptides for each of the filtering methods where each filtering is added cumulatively to the previously listed above it. An asterisk marks filters where intra-similarity is significantly larger than inter-similarity (Wilcoxon, α = 0.05). The count of compared clonotypes is listed just to the right of the y-axis in both (c) and (d).
Figure 5 with 1 supplement

Performance metrics for evaluating the filtering steps.
Performance is measured by number and ratio of retained gel-beads in emulsion (GEMs), accuracy defined by proportion of GEMs where most abundant pMHC matches the expected binder (accuracy), average binding concordance (avg. conc.), and AUC of similarity scores (AUC). The filtering steps consist of total (raw, unfiltered data), optimal threshold obtained from grid search, matching HLA, hashing singlets identified from Seurat HTO demultiplexing, complete TCRs with a unique set of α- and β-chain, specificity multiplets such that each TCR-pMHC pair must be observed in two or more GEMs, is cell defined by 10x Genomics Cellranger, is cell (GEX) defined by Cellranger where GEX data is included, and is viable cell defined by mitochondrial load and gene counts. (a) Presentation of the individual effect of each filter. (b) Presentation of the accumulated effects of the listed filters.
Figure 5—figure supplement 1
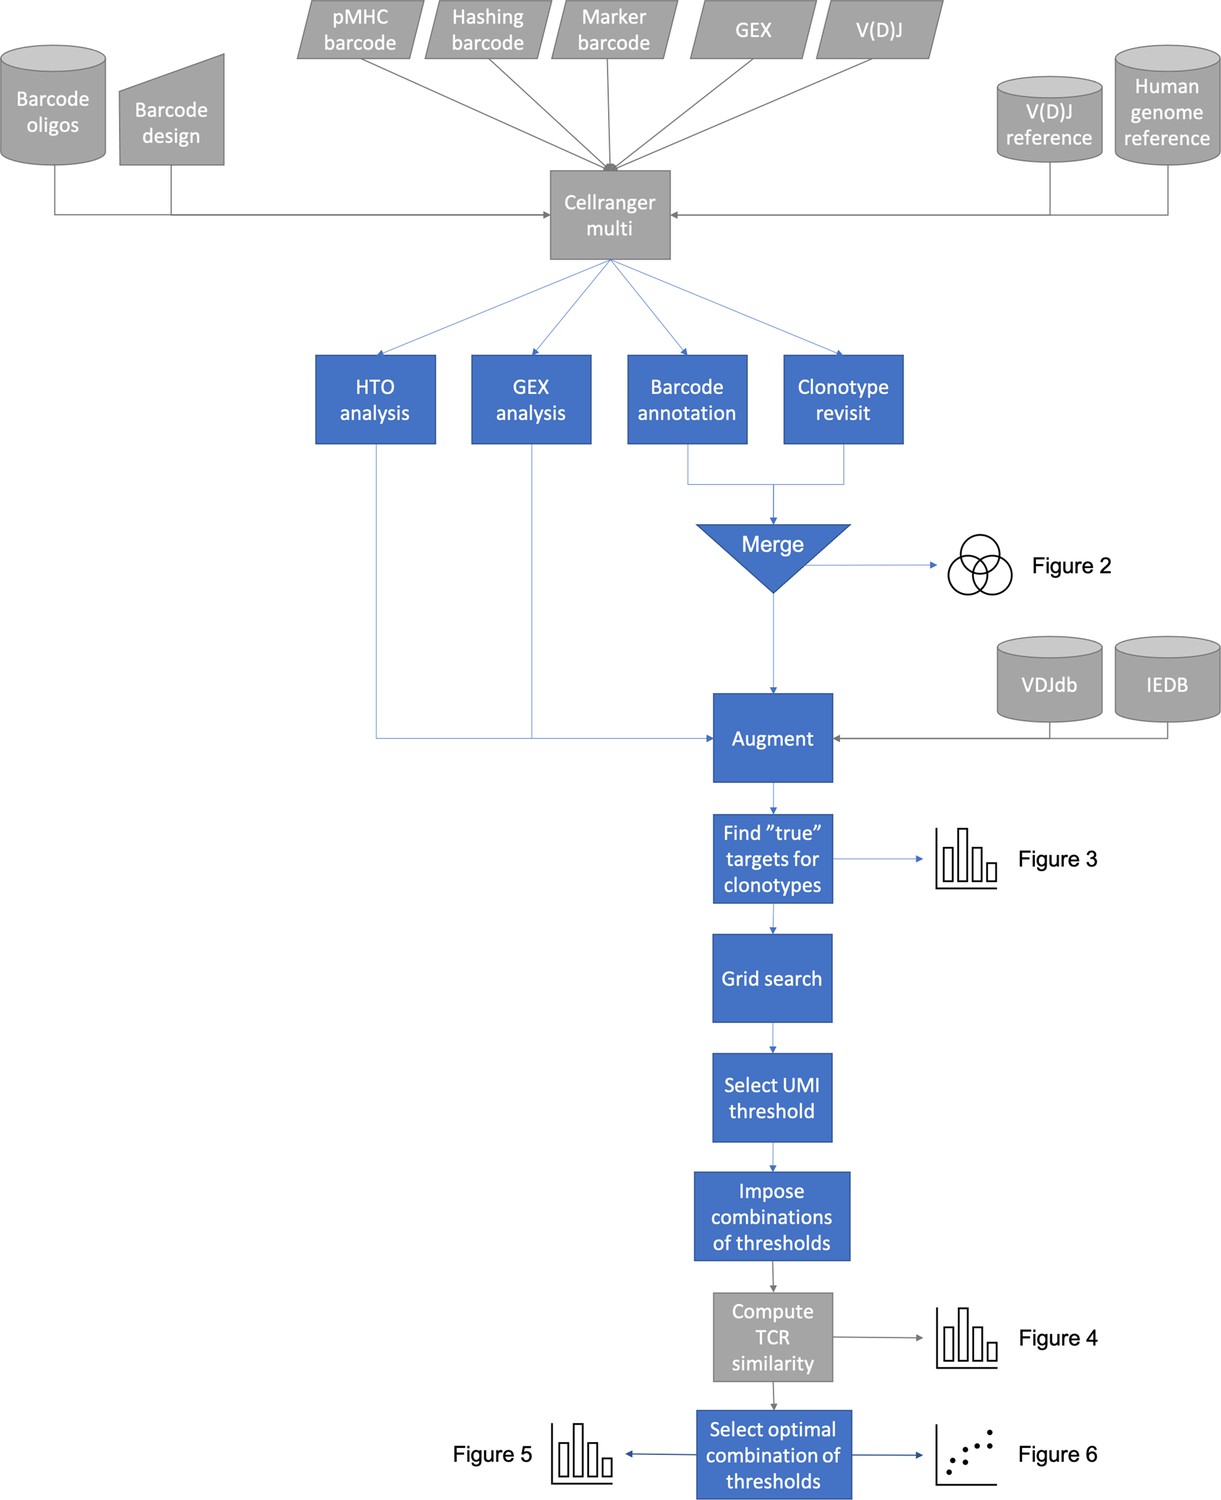
Overview of ITRAP pipeline steps: ITRAP core actions are colored blue, while supporting steps are colored gray.
The method expects Cellranger Multi outputs from TCR and pMHC barcode sequencing. The gel-beads in emulsion (GEMs) containing both TCR and pMHC barcodes are merged and annotated with cell hashing if available. The detected specificities are mapped against known specificities from databases such as IEDB and VDJdb. Expected pMHC targets are derived for selected clonotypes, which are used for a grid search to determine unique molecular identifier (UMI) thresholds to filter data on. Filters are evaluated by computing TCR similarity as well as other performance scores and plotted.
Figure 6 with 1 supplement
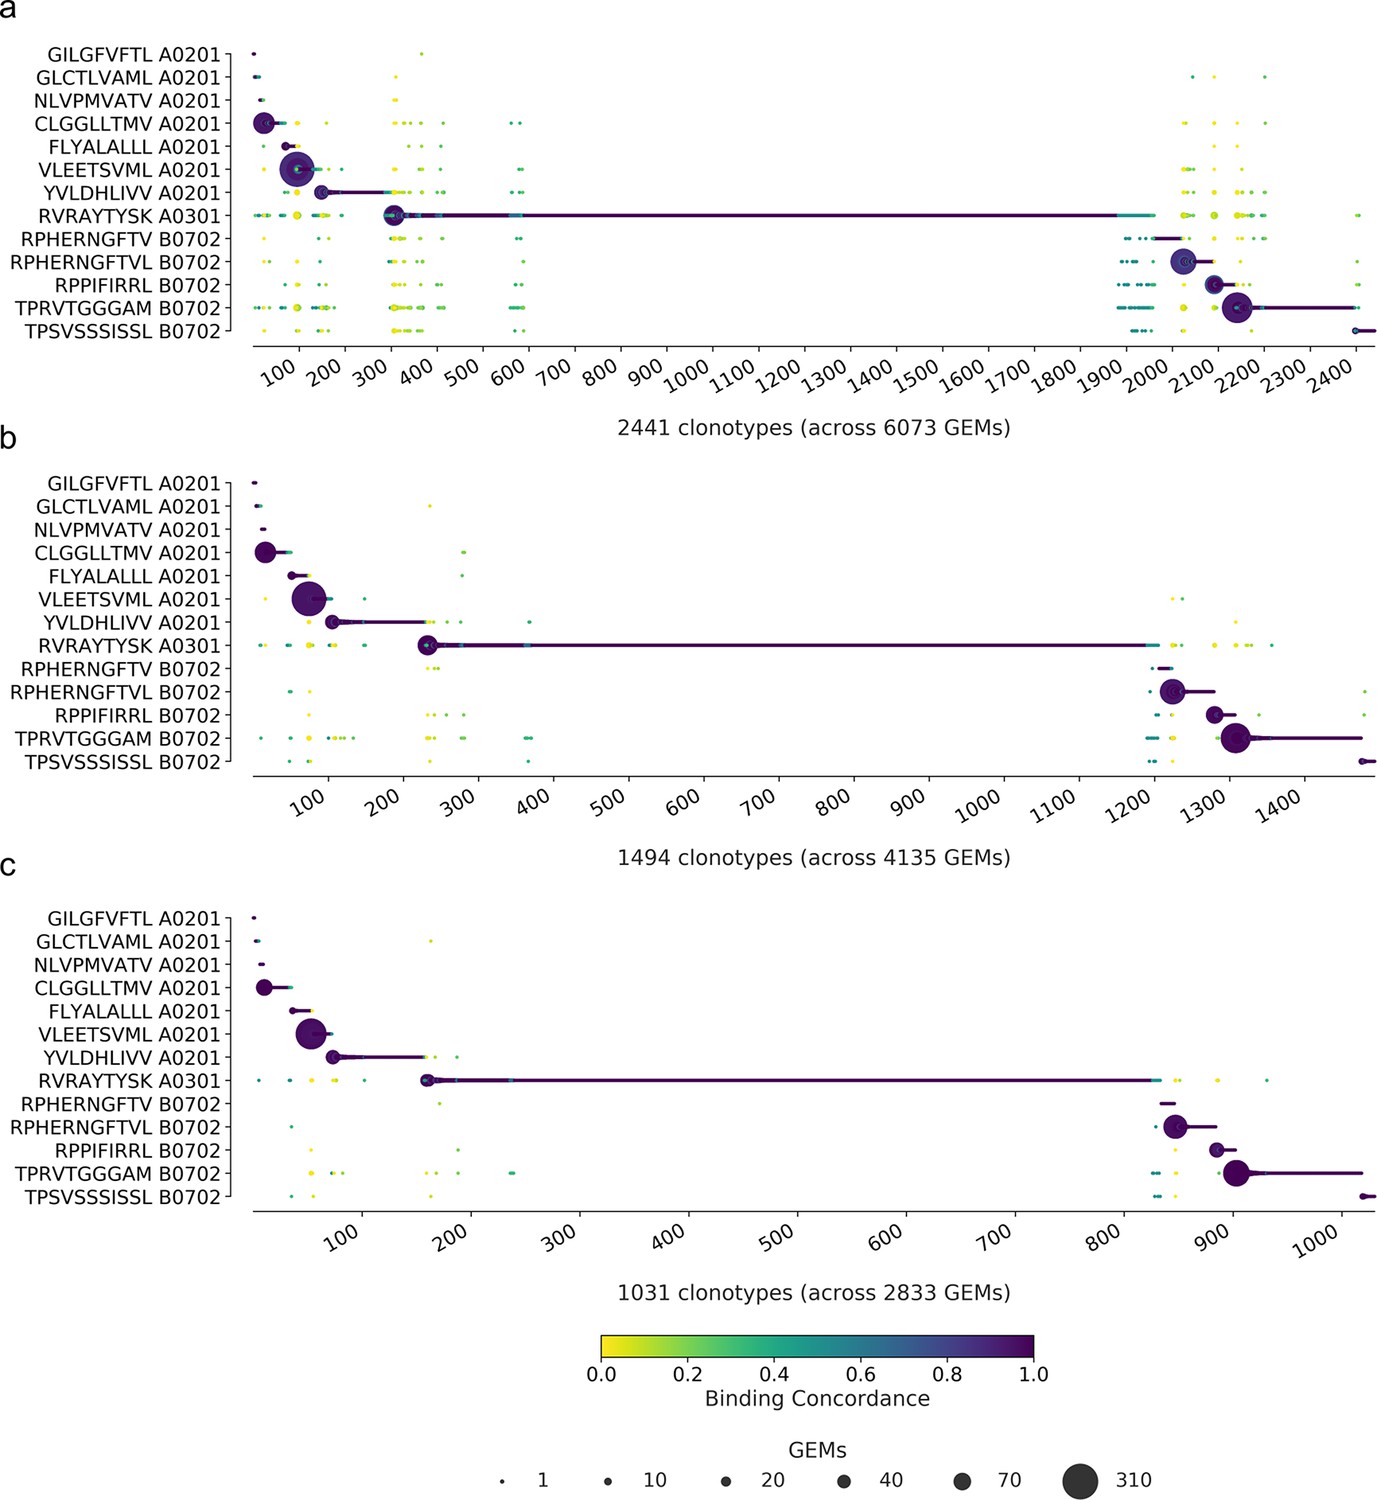
Specificity per clonotype.
The library peptides are listed on the y-axis and each clonotype is represented on the x-axis. Below the x-axis is annotated the total number of clonotypes and gel-beads in emulsion (GEMs) in the presented data. The marker size shows the number of GEMs supporting a given specificity. The color indicates the binding concordance that is calculated as the fraction of GEMs within a clonotype that support a given pMHC. The higher the concordance, the larger the fraction of supporting GEMs. The three plots illustrate the impact of three filtering criteria. (a) presents raw data with no filtering applied. (b) presents data filtered on optimal threshold and HLA matches. (c) presents data filtered as in (b) with the additional requirement of only complete TCRs (note that cell hasting filtering was not included here). A summary of the specificity singlet distribution for each subfigure is presented in Supplementary file 5.
Figure 6—figure supplement 1
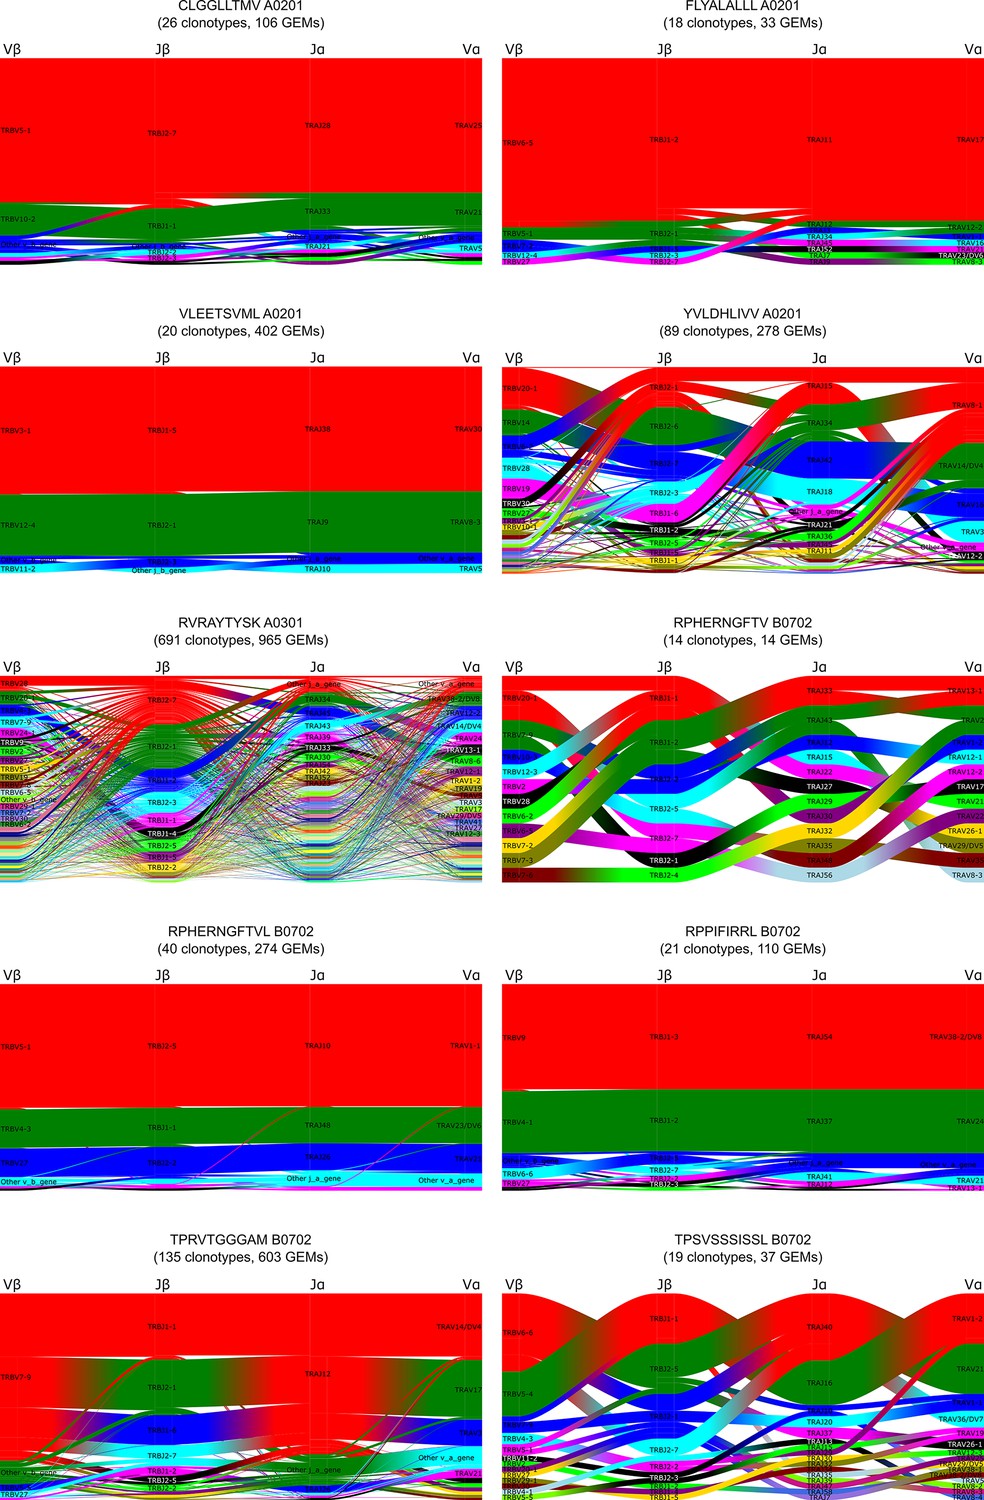
Gene-gene pairing of V and J gene segment usage for each TCR chain.
Each subplot is a representation of gene pairings within clonotypes specific for the given peptide-MHC. Repertoires for the 10 selected peptides are displayed, leaving out the three control peptides (NLV, GIL, and GLC). The four genes are connected as nodes in a Sankey diagram where the thickness of each link is proportional to the number of clonotypes with the respective gene pairing. The nodes are labeled by gene name, and atop each stack is given a generic gene label. Genes are colored by frequency within the peptide specificity with a fixed color sequence (from most frequent to least frequent): red, green, blue, cyan, magenta, black, etc.
Figure 7
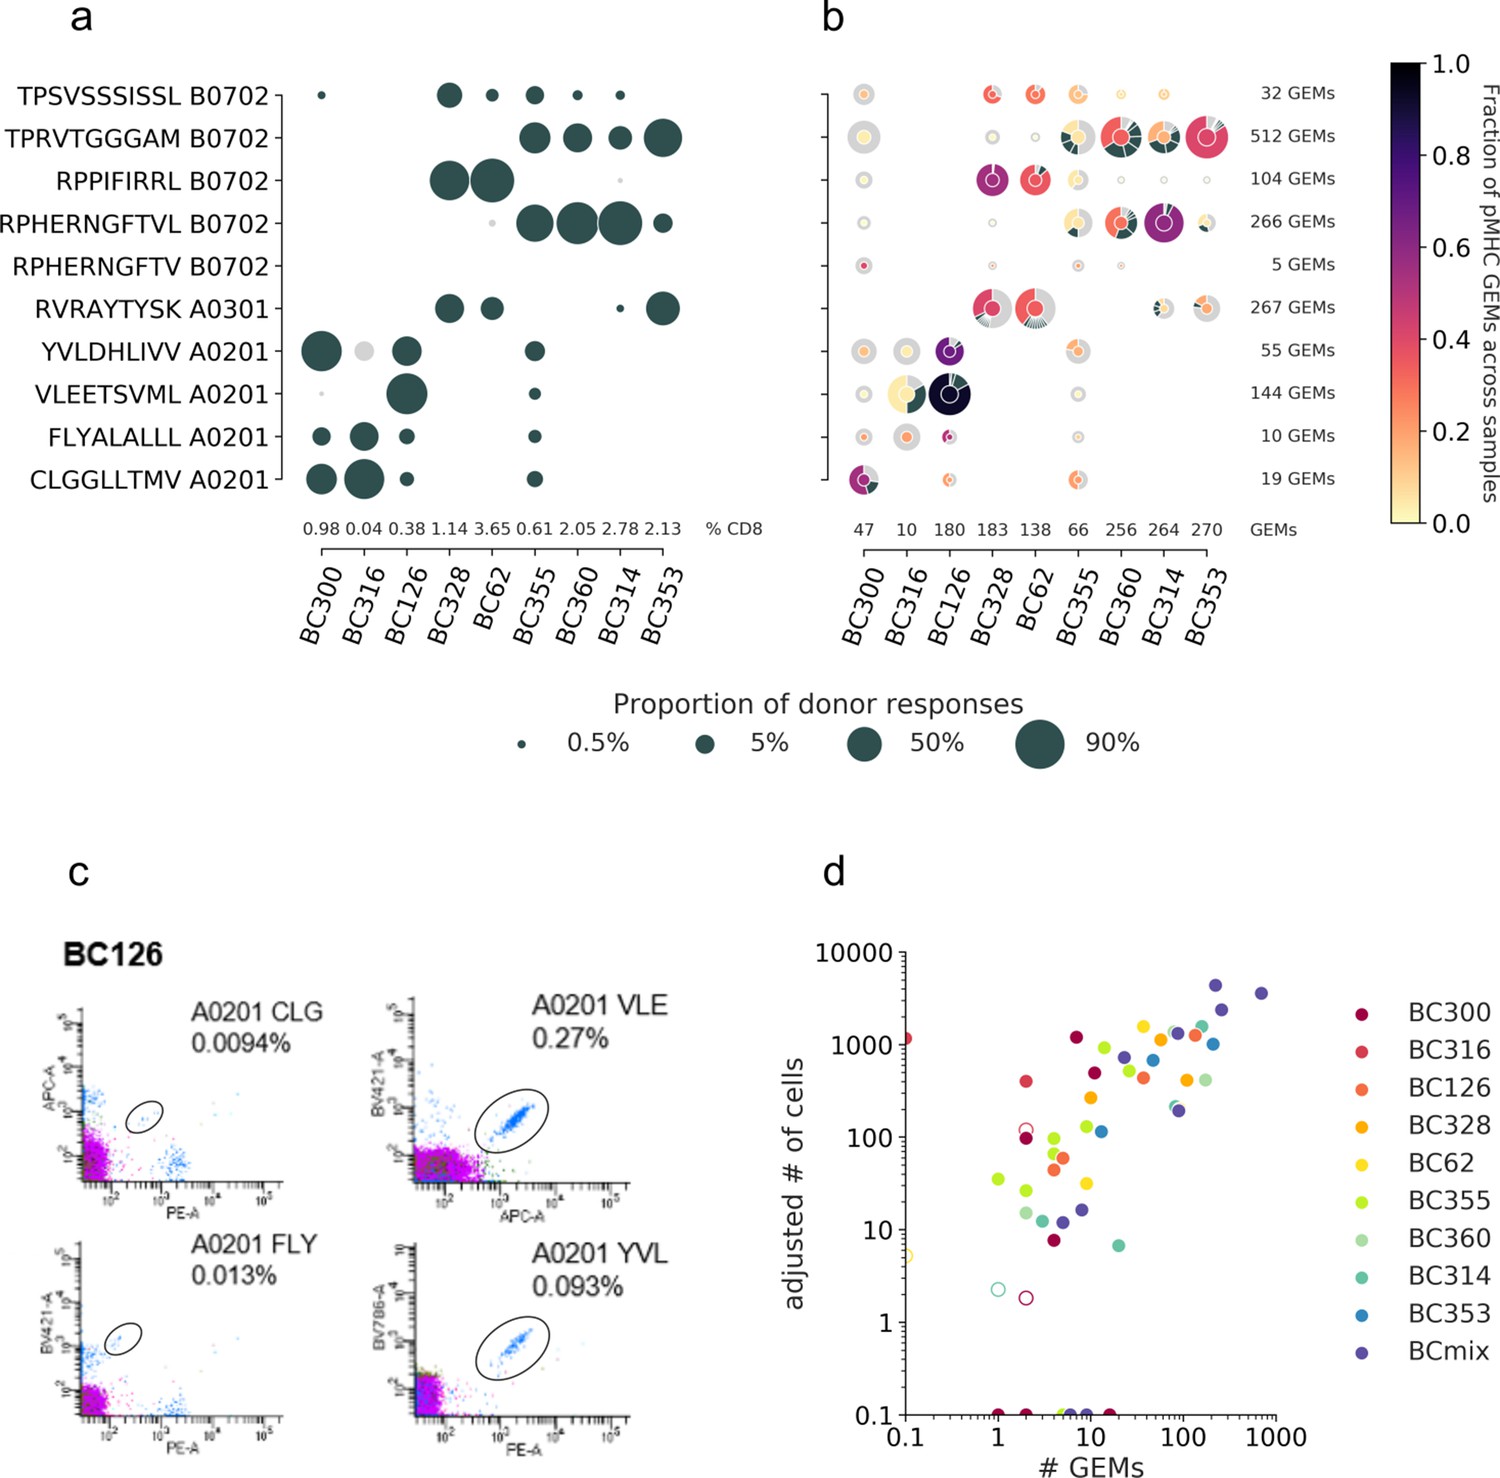
T cell diversity per peptide across the individual samples.
The nine samples, PBMCs from nine individual donors are represented on the x-axis. The marker size defines the distribution of T cells recognizing a given peptide, normalized per sample. (a) The T cell frequencies are visualized as the proportion of a given multimer-positive response within a donor. The black markers represent responses detected above the threshold, that is, ≥10 cells and ≥0.002% of total CD8 T cells, or ≤10 cells but ≥0.01% of total CD8 T cells. The gray dots represent detected specificities below threshold but represented by ≥2 cells. Summed frequencies of detected responses within a donor are given as % of total CD8 T cells and listed just above the x-axis. (b) The T cell frequencies are based on gel-bead in emulsion (GEM) counts normalized per sample from the single-cell data. Absolute GEM counts per sample are listed above the x-axis. The marker is colored by the fraction of GEMs within a specificity that originate from a given sample. Absolute GEM counts per peptide are listed to the right of the plot. The marker contains a donut diagram illustrating the distribution of clonotypes specific for the given peptide in the given sample. The wedge that represents the dominant clone is colored according to the center of the donut. Remaining clones (>1 GEM) are anthracite gray, and all clonotypes only supported by one GEM only are pooled and represented by a single light gray wedge. Comparing the sizes of the T cell populations for each specificity per donor between the two screening methods in (a) and (b) yielded the following Spearman correlations: BC126 (1.00, p<0.0005), BC328 (0.90, p=0.006), BC355 (0.74, p=0.02), BC360 (0.89, p=0.04), BC314 (0.90, p=0.04), and BC353 (1.00, p<0.0005). (c) Representative example showing the four different responses detected with fluorescent-labeled pMHC multimers in donor BC126. (d) Correlation between T cell responses detected by fluorescent-labeled MHC multimers (y-axis) and single-cell capturing (x-axis). Correlation is given by Pearson correlation coefficient 0.73 (p<0.0005). The responses from fluorescent-based screening are given as an adjusted number of cells based on the detected response frequency out of 1800 cells (see calculations in Supplementary file 4). The hollow markers represent responses below detection threshold as described in (a). The responses are colored by the donor-of-origin. BC mix corresponds to BC311, BC11, BC83, BC88, BC341, BC342, and BC76.
Tables
Author response table 1
Overview of UMI thresholds given by ITRAP.
The table provides the UMI thresholds for each component (pMHC, TRA, and TRB) identified using the accuracy optimizing approach of ITRAP. Beyond direct UMI thresholds, data may also be filtered based on the UMI ratio between the two largest UMI measurements within a GEM (per component). Two sets of thresholds are given, as the thresholds are dependent on the dataset: first set is based on the data of this publication, the second set is based on the publicly available data by 10x Genomics presented in Povlsen & Montemurro, 2023 (DOI 10.1101/2023.02.01.526310).
| Variable | Current manuscript | 10x benchmark |
|---|---|---|
| UMI pMHC | 2.0 | 5.0000 |
| UMI ratio pMHC | 1.0 | 1.1684 |
| UMI TRA | 0.0 | 1.0000 |
| UMI ratio TRA | 0.0 | 0.7579 |
| UMI TRB | 0.0 | 0.0 |
| UMI ratio TRB | 0.0 | 0.7579 |
Additional files
-
Supplementary file 1
Samples.
Overview of which samples contain cells from which donors and the relevant donor haplotypes.
- https://cdn.elifesciences.org/articles/81810/elife-81810-supp1-v1.xlsx
-
Supplementary file 2
Peptide-MHC multimers.
Information on the applied pMHC multimers. The full oligonucleotide tag are designed as follows: Biotin-C6-CGGAGATGTGTATAAGAGACAGNNNNNNNNNNXXXXXXXXXXXXXXXNNNNNNNNNCCCATATAAGAAA, with the barcode sequence indicated by 15 purple X’s. C6 indicates a six carbon spacer with a hydroxyl to the 5′ end of an oligonucleotide. Read2N is indicated by the black sequence, UMIs are indicated in gray, and the capture oligo is indicated in turquoise.
- https://cdn.elifesciences.org/articles/81810/elife-81810-supp2-v1.xlsx
-
Supplementary file 3
Database cross-referencing specificities.
Information on the CDR3 sequences that matched the CDR3 sequences of the IEDB and VDJ databases presented in Figure 2d. Six different clonotypes (ct) had CDR3 sequence matches. Five of the clonotypes also matched (T:True) the database on the annotated pMHC (DB Match), while one clonotype (ct 573) had conflicting annotations.
- https://cdn.elifesciences.org/articles/81810/elife-81810-supp3-v1.xlsx
-
Supplementary file 4
Multimer staining responses.
The frequency or summed number of gel-beads in emulsion (GEMs) for all pMHCs reported in Figure 7. The frequency found by fluorescent-based methods is utilized to calculate a proportion of each response per donor ((sum of responses in donor/100) × % of pMHC-specific T cells) and then the estimated number of cells of each specificity sorted for the single-cell analyses ((total number of cells sorted × proportion)/100). In all cases, a total of 1800 cells were sorted. Approximately 45% of sorted cells are lost already before loading on 10x, and 50% more are expected to be lost during 10x processing. Responses reported in italic are below the detection limit for the fluorescent-based method but represent cases where >1 event are detected for that specificity. NA, not applicable.
- https://cdn.elifesciences.org/articles/81810/elife-81810-supp4-v1.xlsx
-
Supplementary file 5
Singlet summary of Figure 6c.
Summary of specificity singlets, that is, specificities only supported by one gel-bead in emulsion (GEM). The three columns of singlet frequencies correspond to the data plotted in Figure 6a–c which represent: (a) raw data, (b) data filtered on unique molecular identifier (UMI) thresholds and HLA match, and (c) data filtered on UMI thresholds, HLA match, and only contains complete TCRs (TCRαβ). A singlet frequency of 1.0 corresponds to 100% specificity singlets.
- https://cdn.elifesciences.org/articles/81810/elife-81810-supp5-v1.xlsx
-
MDAR checklist
- https://cdn.elifesciences.org/articles/81810/elife-81810-mdarchecklist1-v1.pdf
Download links
A two-part list of links to download the article, or parts of the article, in various formats.
Downloads (link to download the article as PDF)
Open citations (links to open the citations from this article in various online reference manager services)
Cite this article (links to download the citations from this article in formats compatible with various reference manager tools)
Improved T cell receptor antigen pairing through data-driven filtering of sequencing information from single cells
eLife 12:e81810.
https://doi.org/10.7554/eLife.81810


