Synthetic analysis of chromatin tracing and live-cell imaging indicates pervasive spatial coupling between genes
- Laboratory of Receptor Biology and Gene Expression, Center for Cancer Research, National Cancer Institute, National Institutes of Health, United States
Figures
Figure 1
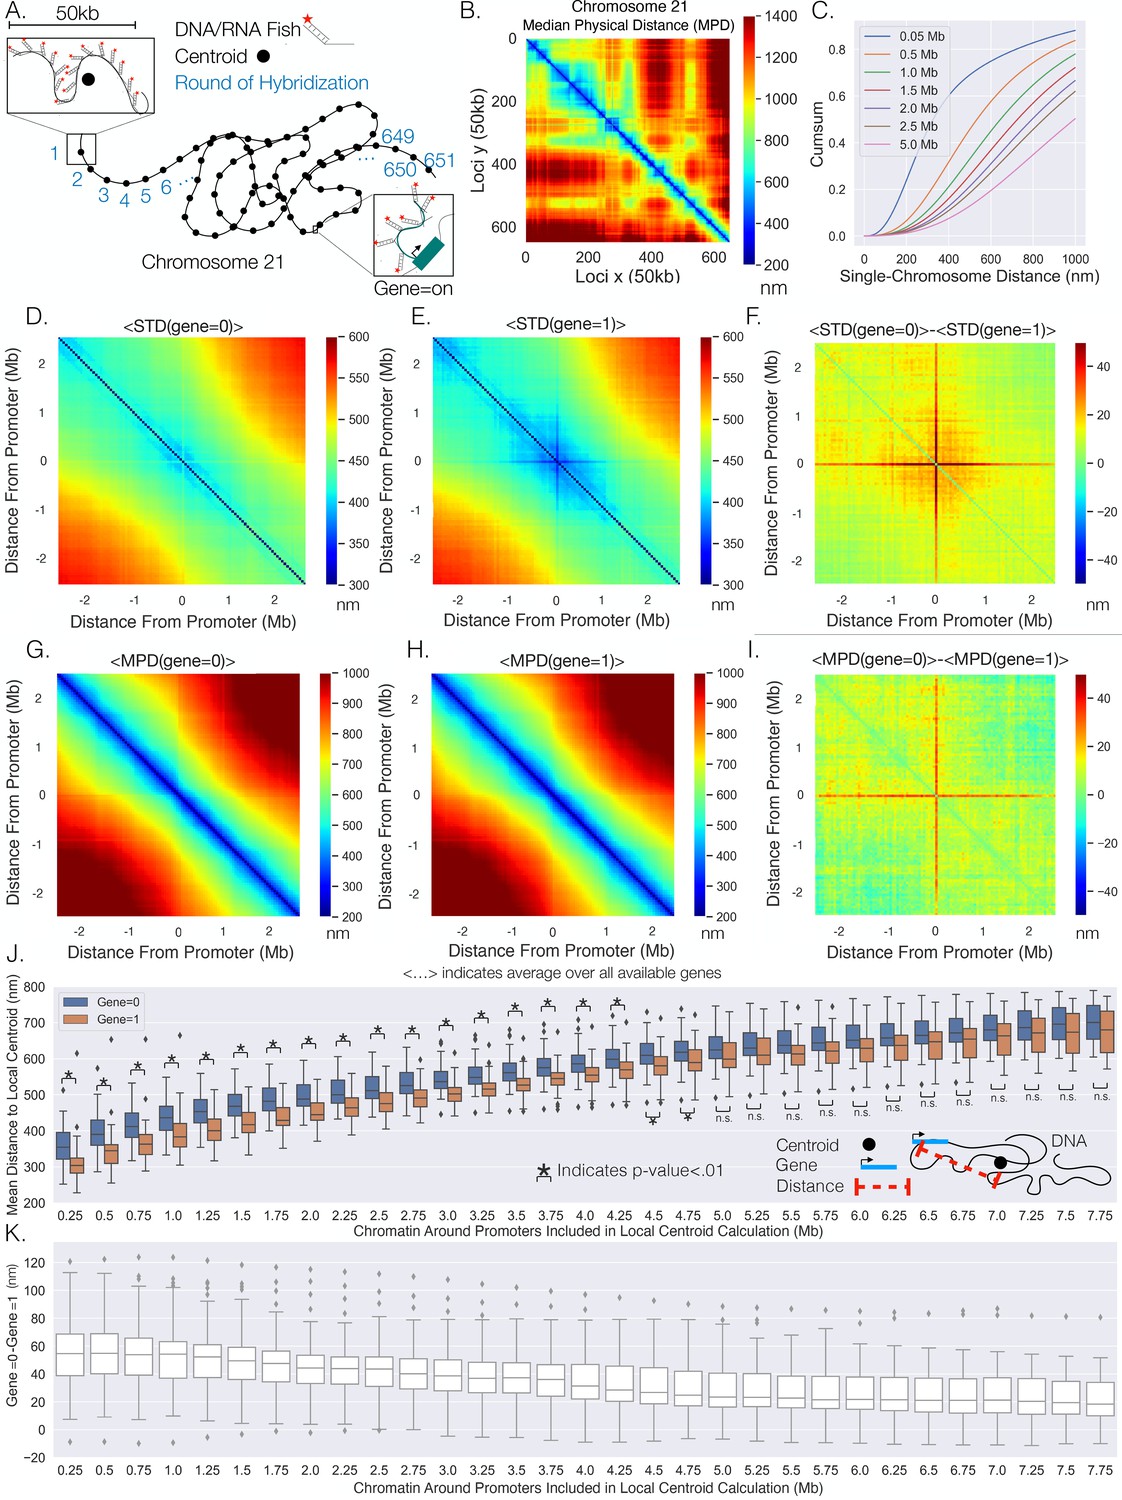
Transcription confines chromatin and active promoters are located toward the centroid of their surrounding chromatin.
(A) An illustration of the chromatin-tracing data where each chromosomal locus is imaged through different rounds of hybridizagtion and the centroid of each 50 kb region is determined. Nascent RNA FISH was used to classify genes into ‘on’ (1) or ‘off’ (0) according to their transcriptional state. (B) The median physical distances (MPD) between all loci determined on chromosome 21. (C) The cumulative distribution function of the distance between chromosomal loci separated by various genomic distances – all loci with a given genomic distance were used to generate these distributions. (D) An aggregate analysis, calculating the standard deviation (STD) of the distances between chromosomal loci for chromosomes where a gene = 0, centered around the loci containing the promoter, and then averaging over all genes. (E) The same as (D) but with gene = 1. (F) The difference in the average centered STD in (D) and (E). (G) Similar to (D) but quantifying the MPD instead of the STD. (H) The same as (G) but for chromosomes where gene = 1. (I) The difference between the average centered MPD in (G) and (H). (J) The mean distances between chromosomal loci containing genes to the centroid of the surrounding chromatin when the genes were either on (1) or off (0) vs. the amount of chromatin around the promoter included in the centroid calculation. There is also an illustration of this calculation in the far-right corner to aid interpretation. (K) The difference between the mean distances to the local centroid when gene = 0 and gene = 1, showing the results in (J) on a gene-by-gene basis. Boxplots show quartiles and whiskers expand to 1.5× interquartile range, black diamonds are outliers. Significance was defined as a p-value <0.01 with a t-test (Appendix 1). The analysis was done on ≈7600 individual chromosomes and 80 different genes.
Figure 2
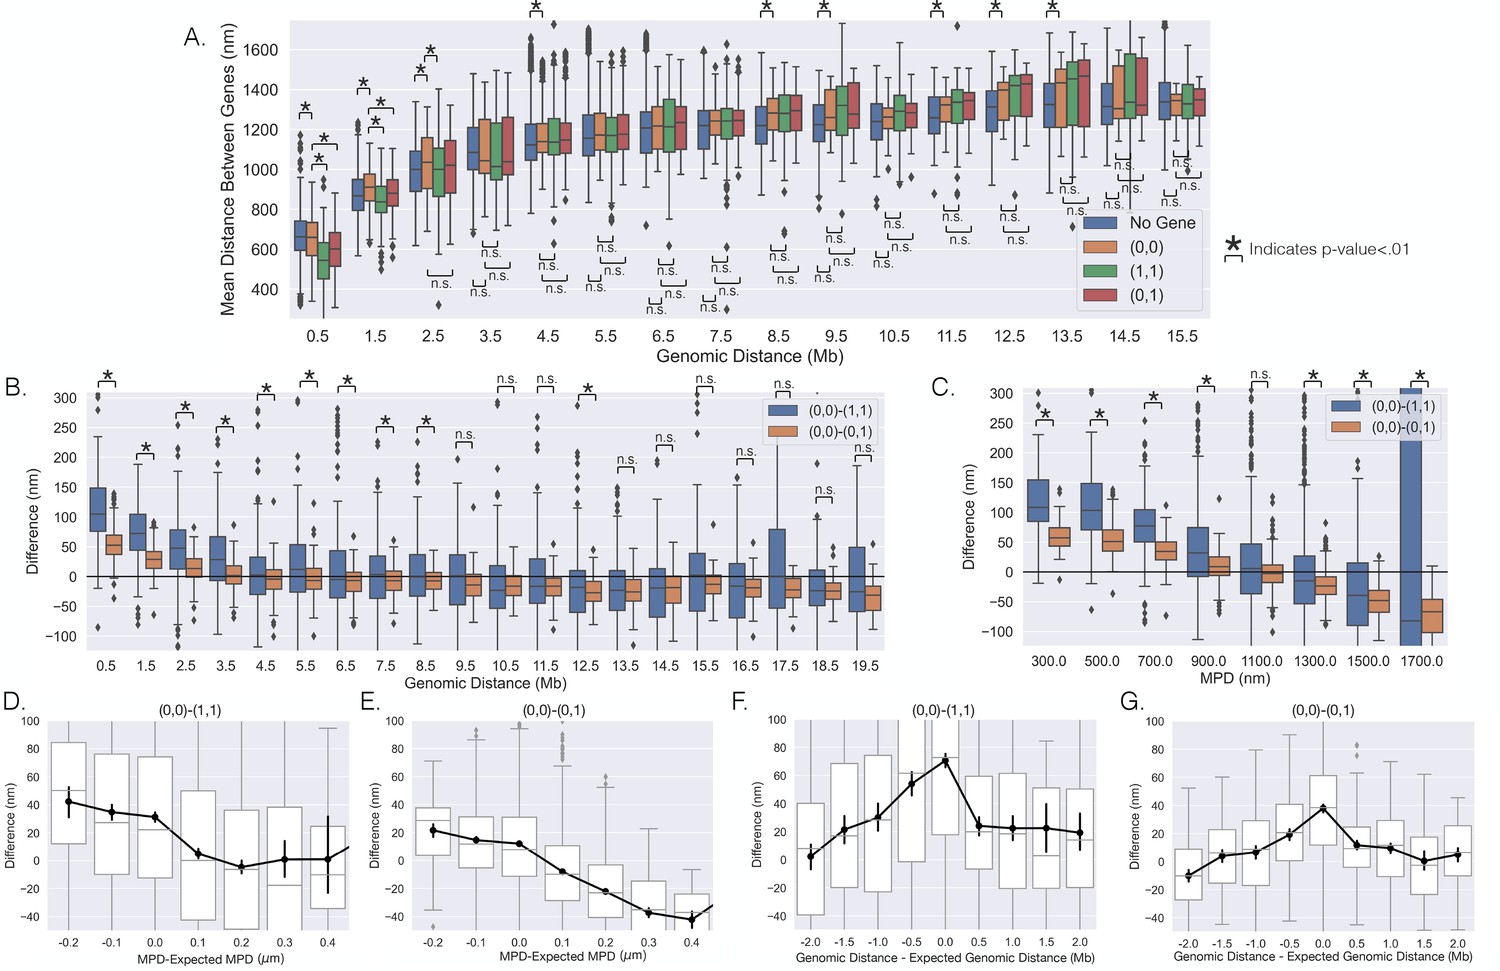
The distances between genes vary with transcription on individual chromosomes.
(A) The mean distances between genes vs. the genomic distance for when both genes were (0,0),(1,1), (0,1), and the mean distances between loci not containing the investigated genes. Boxplots show quartiles and whiskers expand to 1.5× interquartile range, black diamonds are outliers. (B) The difference between the scenarios shown in (A), showing the difference in mean distance on a gene pair by gene pair basis, and a black line is shown to aid in visualization of zero. (C) The same analysis as in (B) but vs. the median physical distance (MPD) between the genes. (D–G) The difference shown in (B) and (C) but vs. either the MPD minus the expected MPD or the genomic distance minus the expected genomic distance (see text). Boxplots show quartiles and whiskers expand to 1.5× interquartile range, black diamonds are outliers. Black lines and dots are means and error bars are SEM from bootstrapping (Appendix 1). Significance was defined as a p-value < 0.01 with a t-test (Appendix 1).
Figure 3
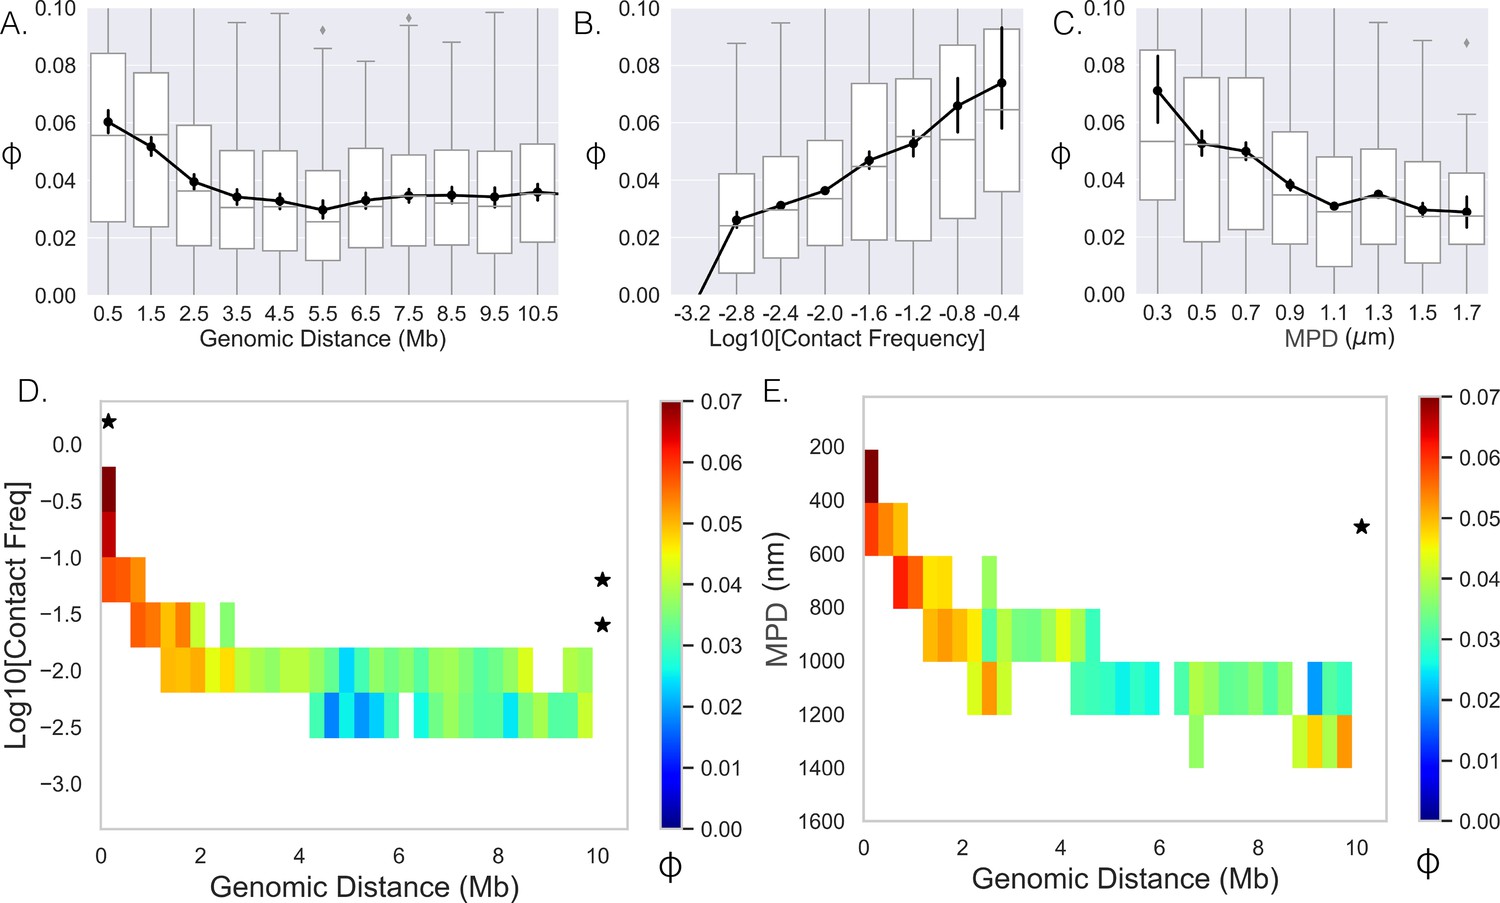
Limited variability prevents quantification.
(A–,C) The Spearman correlation coefficient between genes as a function of genomic distance, contact frequency, and median distance. Black lines and dots are means and error bars are SEM from bootstrapping (Appendix 1), boxplots show the quartiles as above. (D) Average correlation coefficients of genes given that their genomic distance and contact frequencies were within a specific range. (E) Average correlation coefficient of genes given that their genomic distance and median distance were within the specific range. An * illustrates whether the average correlation coefficients along that dimension are correlated (p-value<0.01) (Appendix 1).
Figure 4
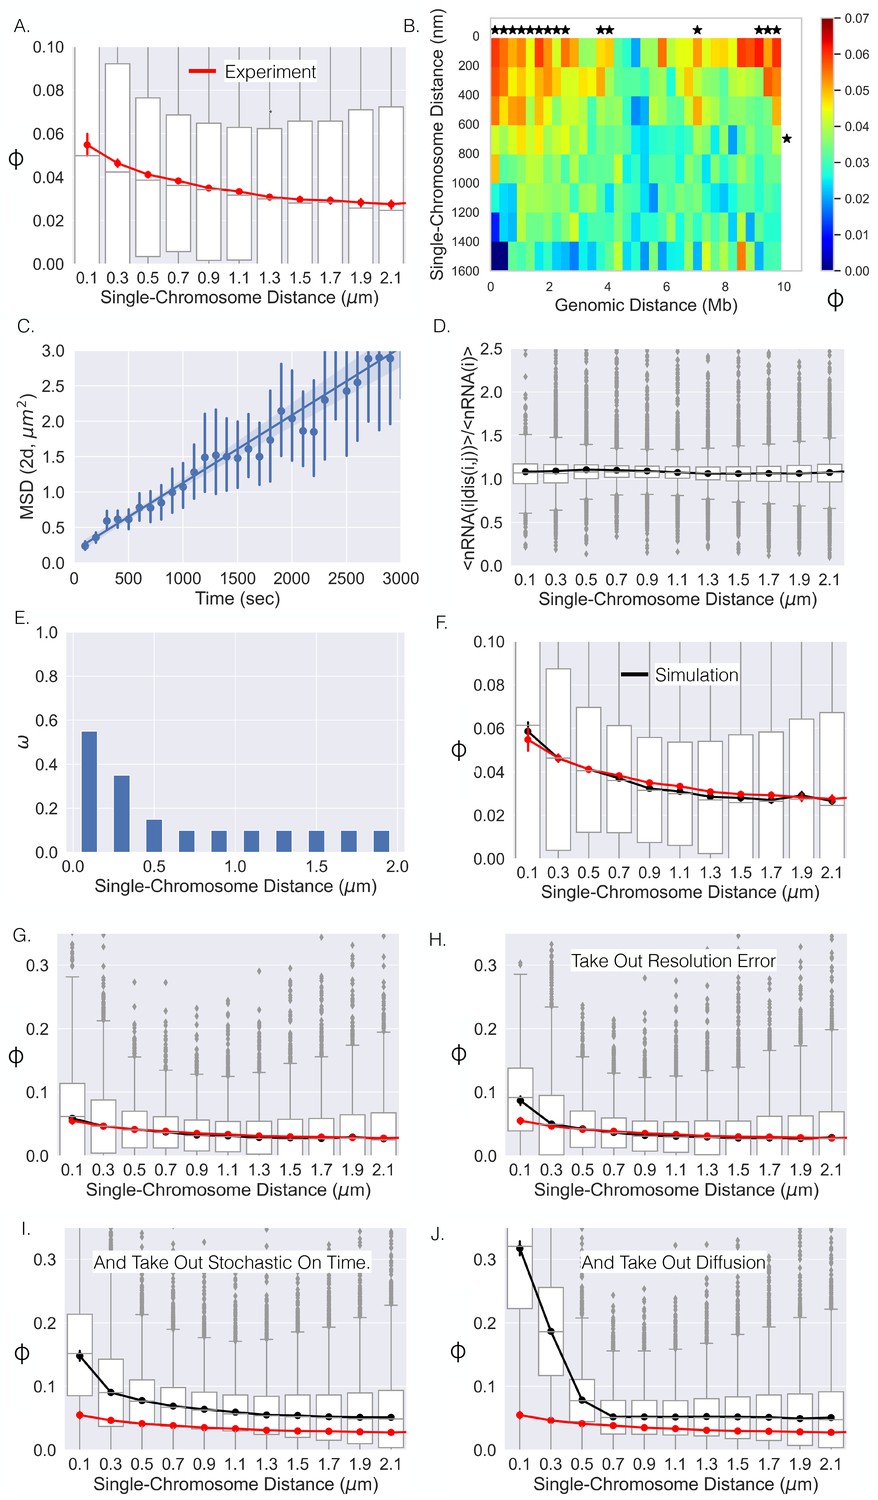
Single-chromosome distance dictates nRNA correlation.
(A) The correlation coefficients between genes as a function of single-chromosome distance. (B) Average correlation coefficients of genes given that their genomic distance and single-chromosomal distance were within a specific range. An * illustrates whether the average correlation coefficients along that dimension are correlated (p-value<0.01) (Appendix 1). (C) The mean-squared displacement of active TFF1, the fitted line, and 95% CI shaded (error bars are individual 95% CIs). (D) The average number of chromosomes with nRNA for gene given the distance between gene and divided by the average with all distances. (E) The optimal function for the model that results in the black curve in (F). (F) The correlation–distance relationship for all pairs of genes from the simulation utilizing the function in (E). The boxplots here are from simulation, red curve is shown for reference and is the experimental data from (A). (G) The same as (F) but on a different scale. (H) The results of the simulation without resolution error of the experiment. (I) Simulation results without resolution error and with nRNAs having a deterministic on time. (J) Simulation results without resolution error, with deterministic on times, and no chromatin diffusion for all pairs of genes.
Figure 5
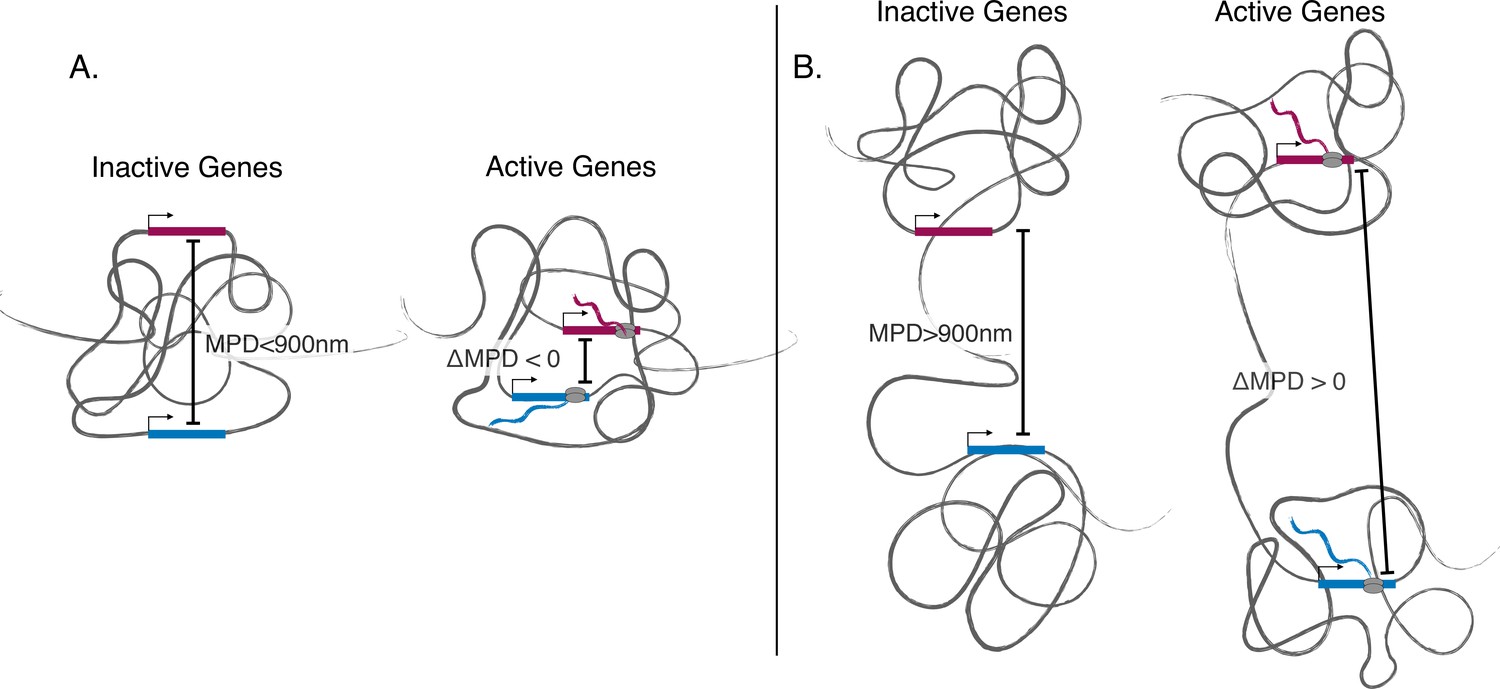
Illustration showing discovered phenomena.
(A) An illustration showing the movement toward the same local centroid of genes separated by a smaller median physical distances (MPD). Here, the genes move toward the same local centroid and hence have a smaller MPD when active. (B) An illustration showing genes separated by a larger MPD. Here the genes still move toward their own local centroids when active but are arranged in such a way that they move away from each other when active.
Appendix 1—figure 1
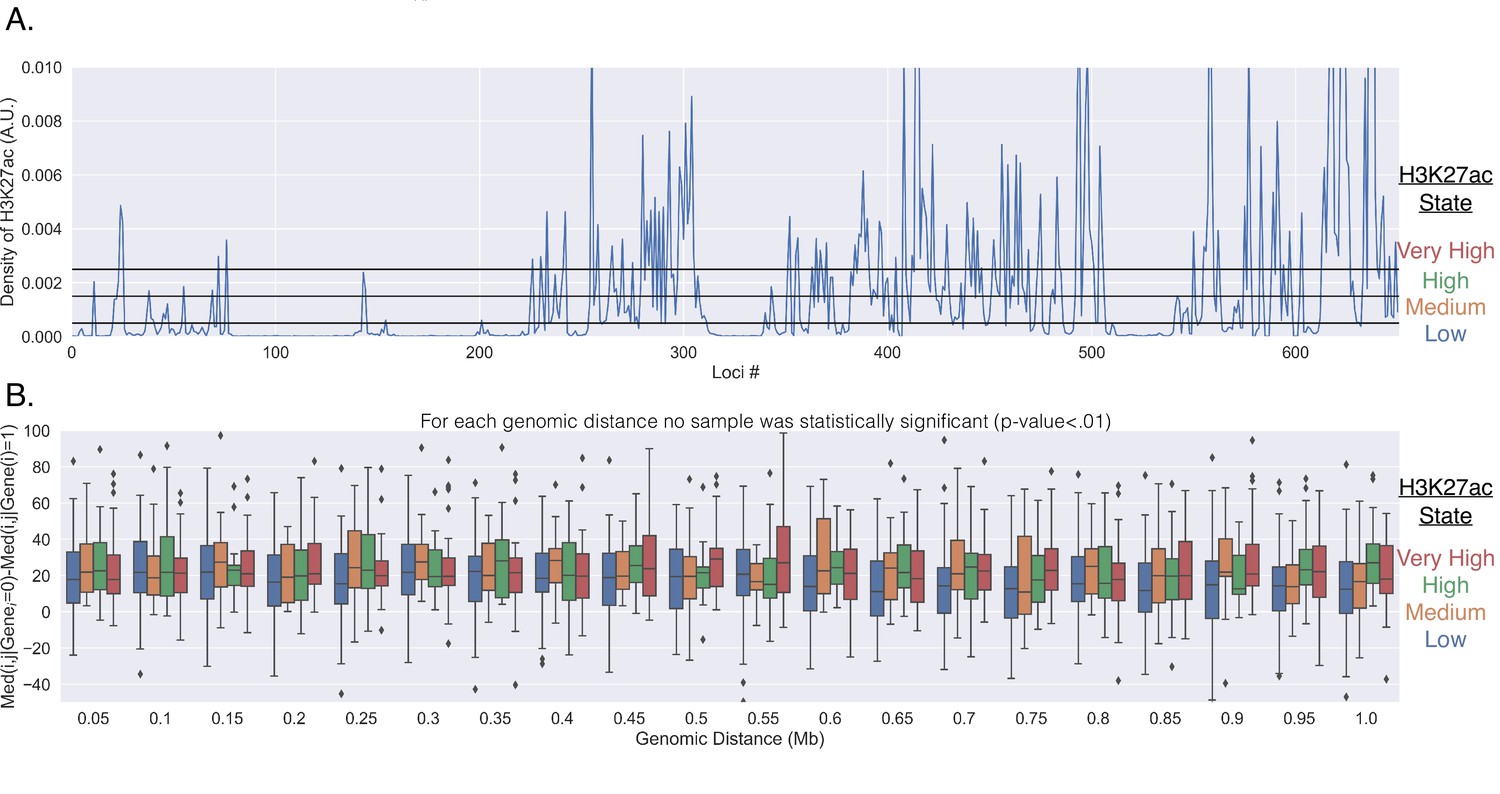
Genes do not reposition for enhancer activation.
(A) The normalized number of reads within the corresponding 50 kb segment of chromosome 21. The reads were normalized by the total number of reads from the 651 chromosomal segments. The black horizontal lines show how the H3K27ac signal was partitioned into each group (low, medium, high, very high). (B) The difference in the median physical distance (MPD) between loci and , given the transcription state of the investigated gene located within loci . This difference is shown as a function of the genomic distance between the loci and was partitioned based off of the the H3K27ac state of loci (the different colors). For each genomic distance bin, t-tests were performed on the various pairs, and none were found to be significant (p-value < 0.01).
Appendix 1—figure 2
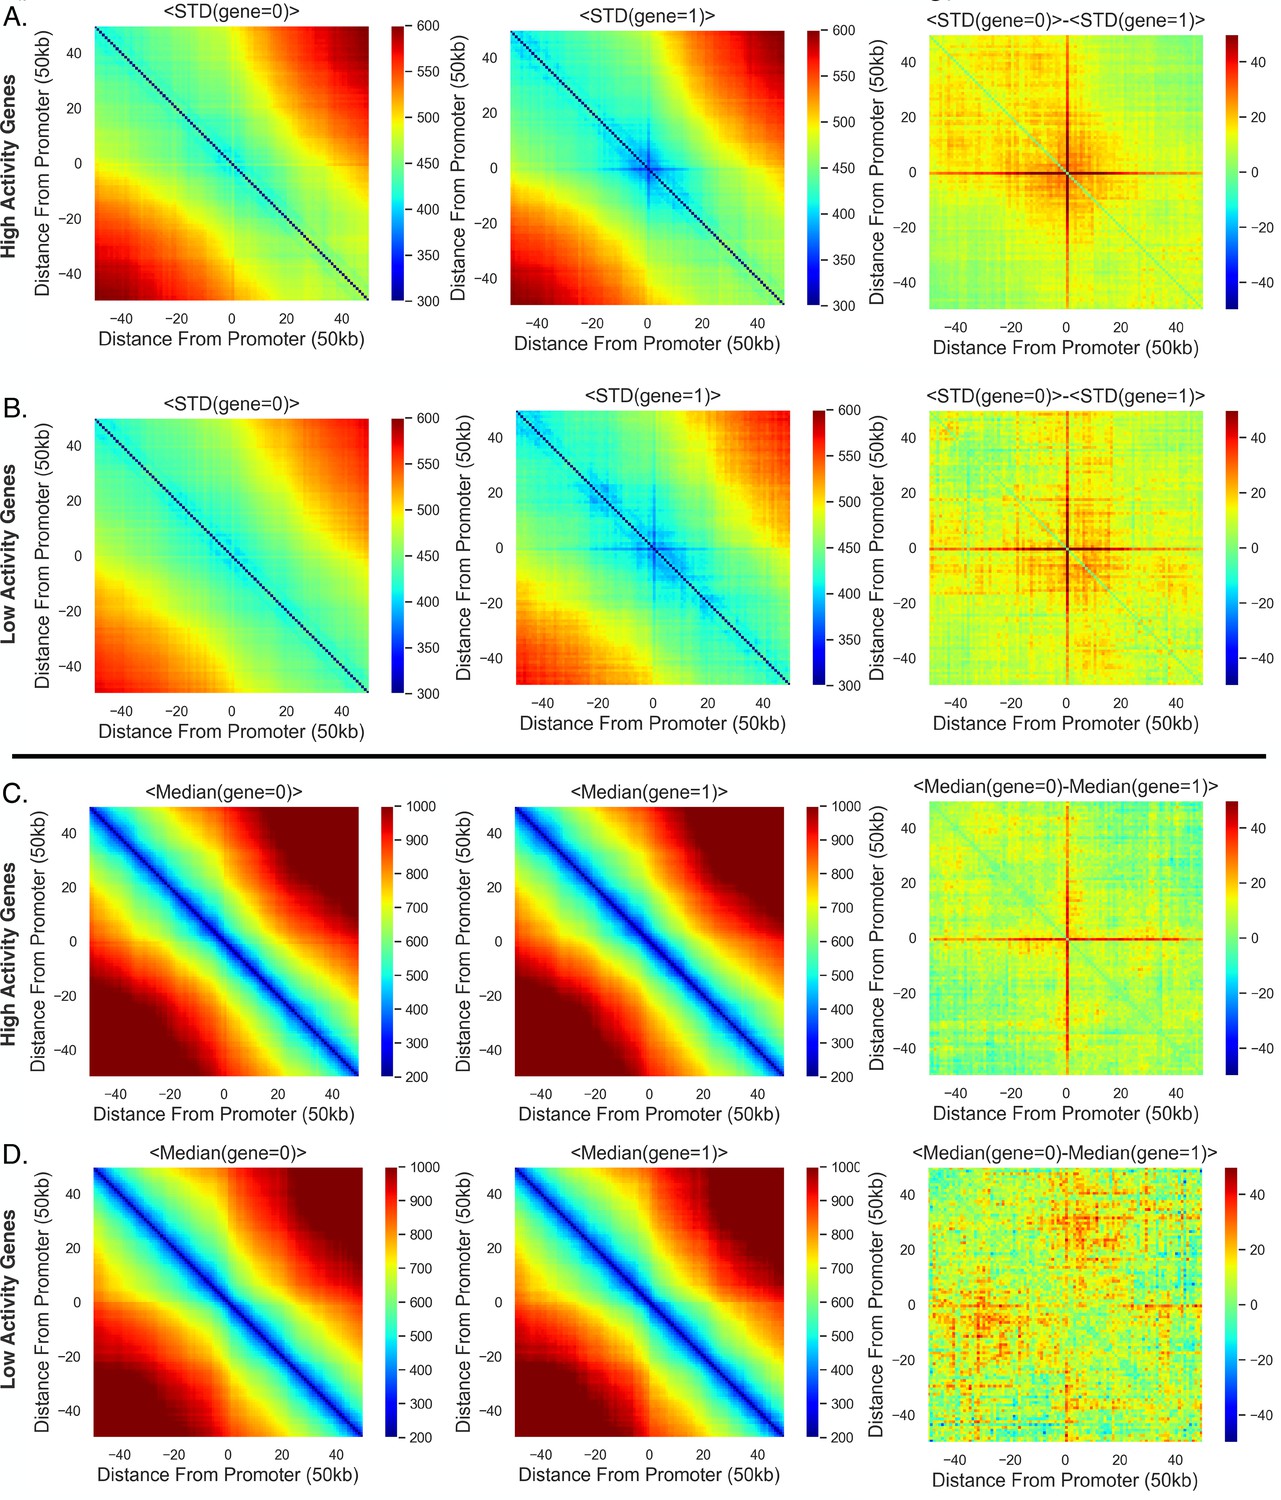
High-activity genes are more constrained with transcription and show a stronger repositioning trend.
(A) The average standard deviation (over all high-activity genes) given the transcription state of the gene, and the difference between the average standard deviations with the different transcription state. (B) Same as (A) but for the low-activity genes. (C) The same as (A) but for the average median distances for the high-activity genes. (D) Same as (C) but for the low-activity genes.
Appendix 1—figure 3
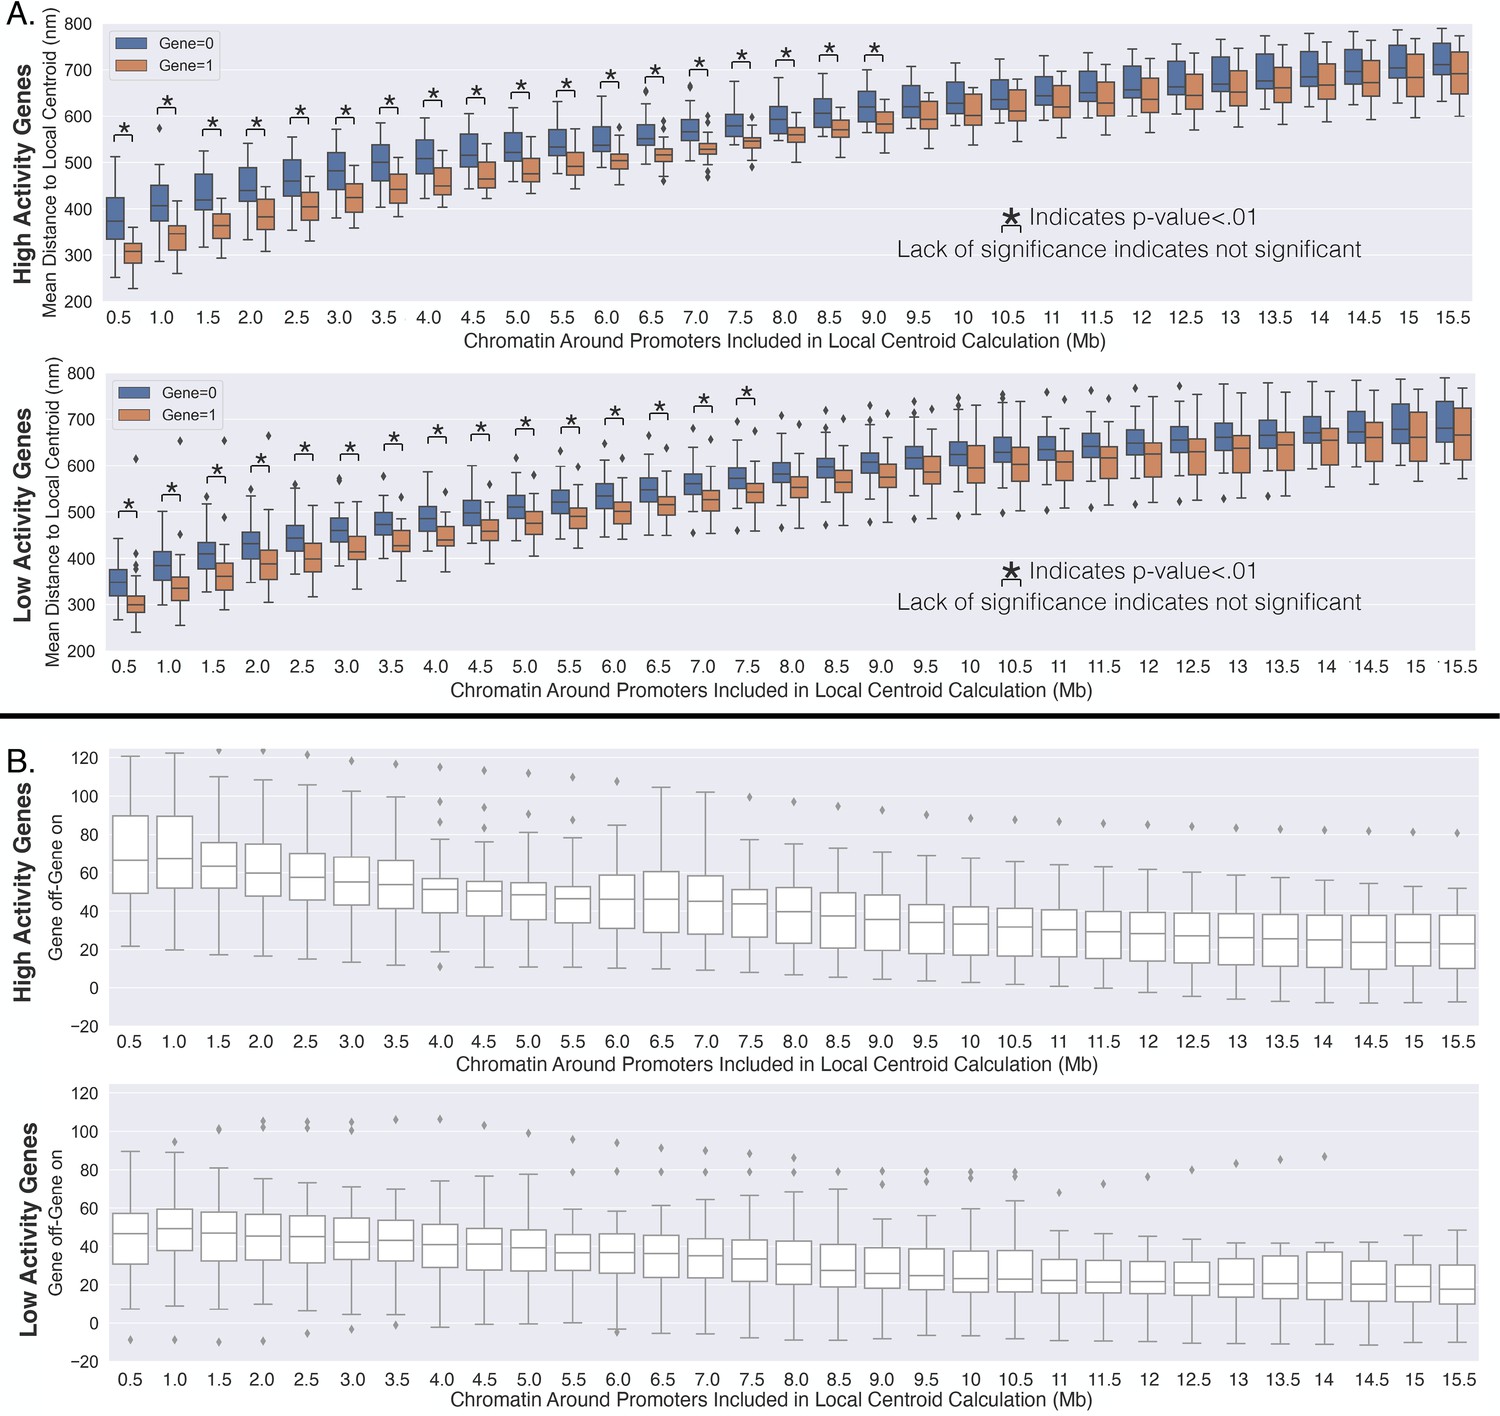
High-activity genes travel a farther distance toward the local centroid with transcription activation.
(A) The average distance to the local centroid as a function of the amount of chromatin included within the centroid calculation. This is calculated for high-activity genes (first row) and the low-activity genes (second row). Significance was defined as a p-value <0.01 with a t-test (Appendix 1). (B) The change in the average distance to the local centroid with transcription activation on a gene-by-gene basis (similar to the main text). The first row is for the high-activity genes, and the second row is for the low-activity genes.
Appendix 1—figure 4
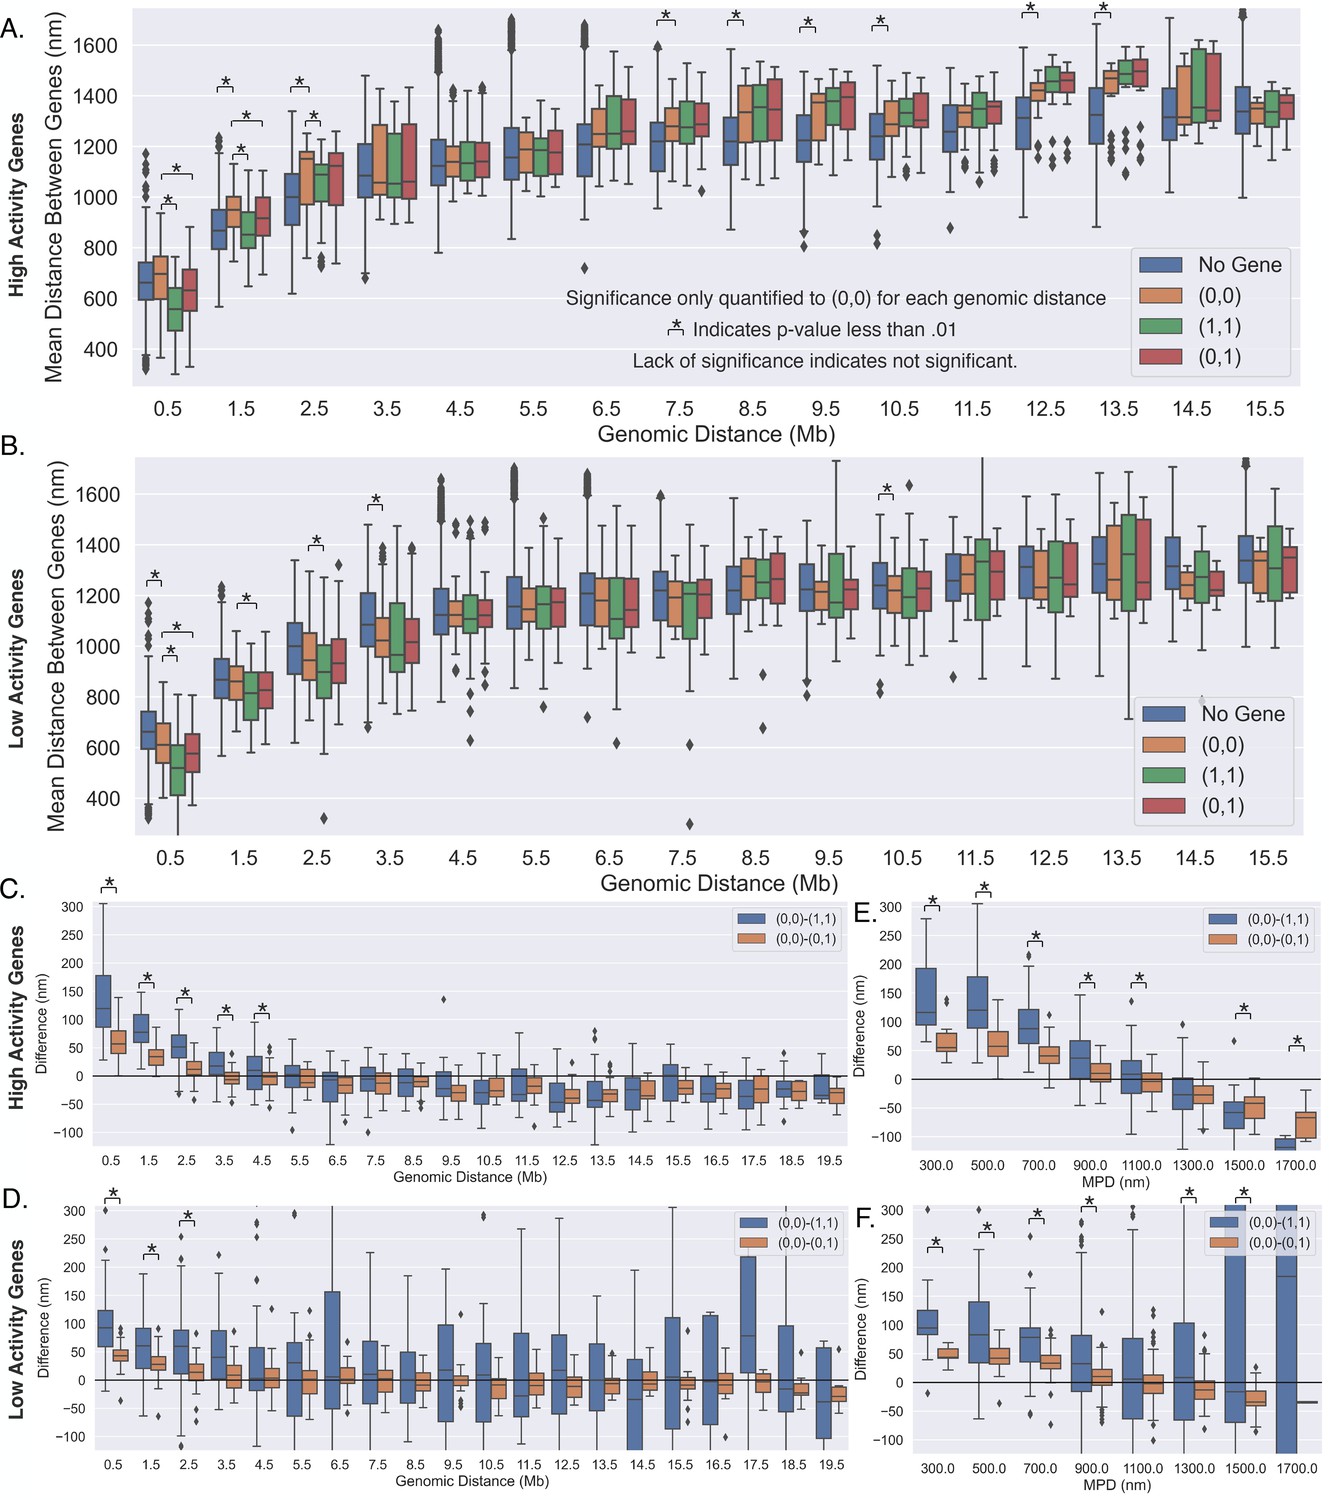
Pairs of high-activity genes move greater distances, toward or away from each other, depending upon transcription.
(A) The average distances between pairs of high-activity genes (depending upon transcription state) as a function of the genomic distance. (B) The average distances between pairs of low-activity genes (depending upon transcription state) as a function of the genomic distance. (C) The difference between the scenarios shown in (A), showing the difference in mean distance on a gene pair by gene pair basis, and a black line is shown to aid in the visualization of zero. (D) The difference between the scenarios shown in (B), showing the difference in mean distance on a gene pair by gene pair basis, and again a black line is shown to aid in the visualization of zero. (E) The same analysis in (C), but as a function of the median physical distance (MPD) between the high-activity genes. (F) The same analysis in (D), but as a function of the MPD between the low-activity genes. For all subplots: significance was defined as a p-value <0.01 with a t-test (Appendix 1).
Appendix 1—figure 5
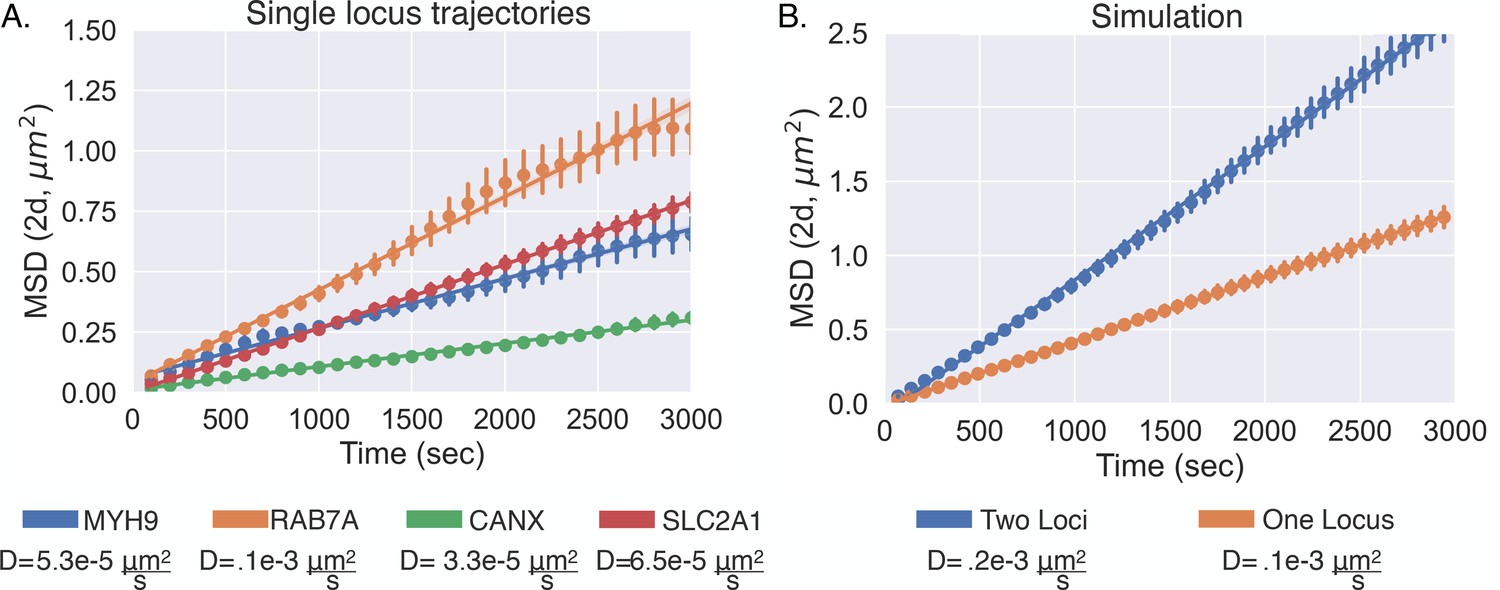
Diffusive behavior of single-allele-tagged genes.
(A) The mean squared displacement of four different genes with the fitted lines and error bars showing individual 95% confidence intervals (Appendix 1). The diffusion coefficients are listed under each gene for reference. (B) The mean square displacement from the simple diffusion simulation (see Appendix 1) illustrates how the diffusion coefficient increases when considering the distance of one locus relative to the other. Again, there are the fitted lines and error bars showing individual 95% confidence intervals (Appendix 1).
Additional files
Download links
A two-part list of links to download the article, or parts of the article, in various formats.
Downloads (link to download the article as PDF)
Open citations (links to open the citations from this article in various online reference manager services)
Cite this article (links to download the citations from this article in formats compatible with various reference manager tools)
Synthetic analysis of chromatin tracing and live-cell imaging indicates pervasive spatial coupling between genes
eLife 12:e81861.
https://doi.org/10.7554/eLife.81861


