Target cell-specific synaptic dynamics of excitatory to inhibitory neuron connections in supragranular layers of human neocortex
- Allen Institute for Brain Science, United States
- Department of Physiology & Biophysics, School of Medicine, University of Washington, United States
- Swedish Neuroscience Institute, United States
- Department of Laboratory Medicine & Pathology, School of Medicine, University of Washington, United States
- Department of Neurological Surgery, School of Medicine, University of Washington, United States
Figures
Figure 1
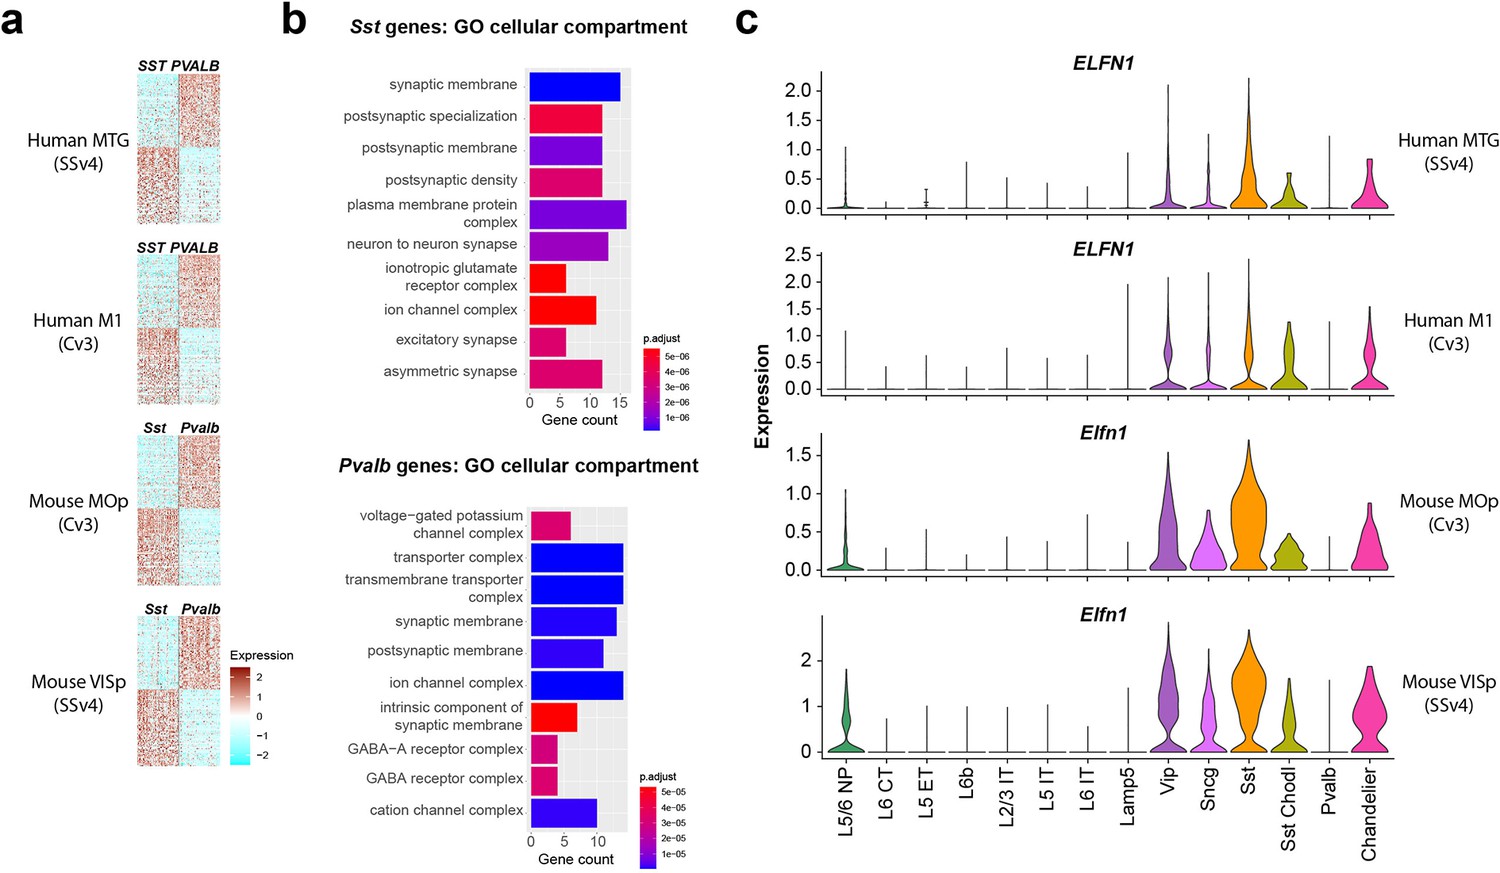
Single-nucleus transcriptomic differences between PVALB and SST types in human and mouse cortex.
(a) Heatmaps showing scaled log2 normalized expression of 147 differentially expressed genes (DEGs) that distinguish PVALB and SST types in both human MTG and mouse VISp. These genes show similar specificity in human M1 and mouse MOp, indicating conserved patterning across cortical areas. Heatmaps show 100 randomly sampled nuclei from each type. SSv4 indicates SMARTseq V4 chemistry, and Cv3 indicates 10 x Chromium V3 chemistry. (b) Gene ontology analysis for cellular compartment using conserved DEGs between SST and PVALB. Top 10 enriched categories are involved in synaptic structure and function. (c). Violin plots showing neuronal subclass expression levels of ELFN1 in human and Elfn1 in mouse cortex, illustrating selective expression in non-PVALB inhibitory neuron subclasses.
Figure 2 with 1 supplement
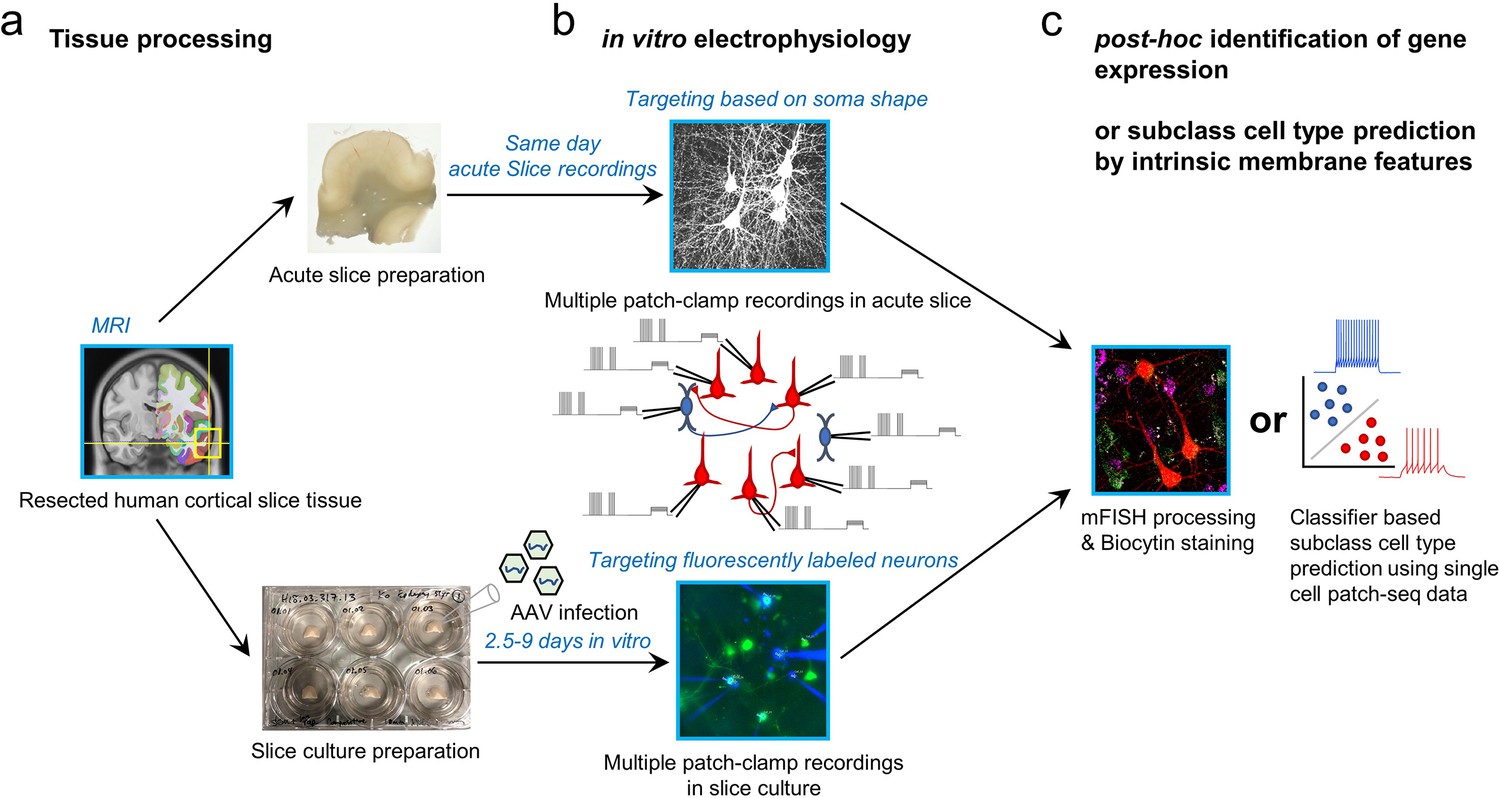
Schematic of experimental workflow.
(a) Human neocortical tissue from neurosurgical resections in either acute slice preparations within 45 min following scalpel excision from the patient (upper) or organotypic slice culture preparation with viral transduction (lower). (b) Up to eight simultaneous patch-clamp recordings are performed on either acute slices (upper) or slice culture after 2.5–9 days in vitro (lower). Targeting of neurons is either carried out by visually identifying cell bodies using an upright microscope with oblique illumination (upper) or by targeting neurons expressing fluorescent reporters following viral transduction (lower). (c) To identify subclass cell types in connectivity-assayed neurons, we applied multiplexed fluorescence in situ hybridization (mFISH) on fixed slices to identify marker gene expression, or used a machine learning classifier with cellular intrinsic membrane properties measured after connectivity assays.
Figure 2—figure supplement 1

Summary of donor information.
Thirty-one donors were used for this study, including samples from epilepsy treatment and tumor removal surgeries. Patient ages were distributed from 18 to 80 and epilepsy patients were usually younger than tumor patients (a–b). Pie charts displayed in (c–e) show diversity of donor sampling we included in the dataset in terms of their disease condition, hemisphere, brain area, and sex. p-Value in (a) from Wilcoxon rank sum test.
Figure 3 with 3 supplements
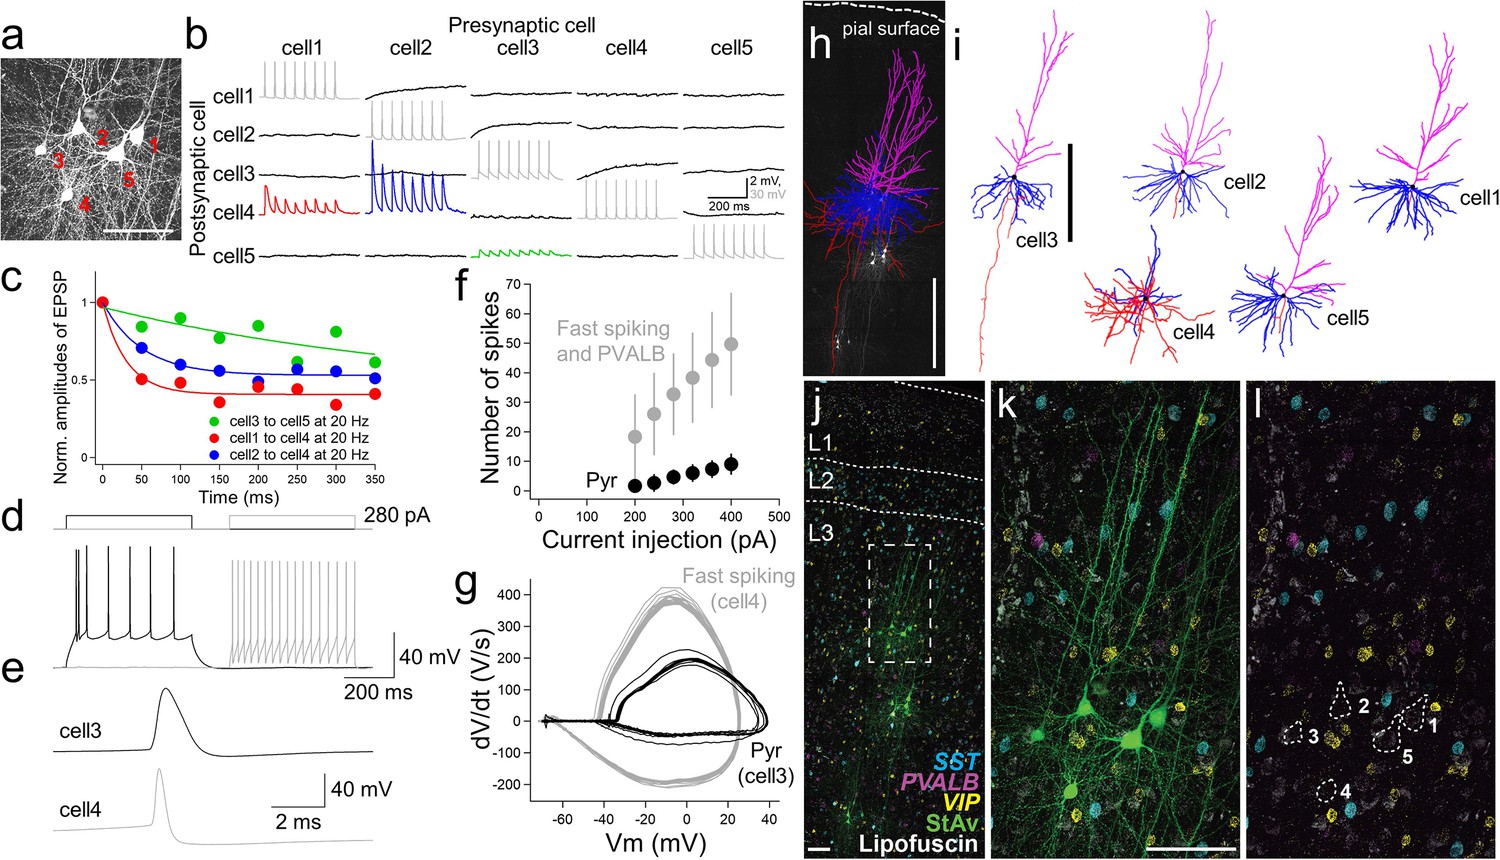
Physiology, morphology, and molecular identification of pyramidal-interneuron connections in human neocortex.
Example experiment using acute slice preparation with five cells simultaneously patched. (a) Maximum intensity projection montage confocal image of biocytin/streptavidin labeling. Scale bar, 50 µm. (b) Corresponding membrane voltage traces from connectivity assay. Presynaptic action potentials (gray) in individual neurons (cell 1 to cell 5) were sequentially generated by 8 brief current pulses at 20 Hz while simultaneously recording the postsynaptic membrane voltage in non-stimulated neurons in current-clamp mode (black). Traces averaged over 10 repetitive 8 pulse stimulations. This probing uncovered a strong and adapting excitatory synaptic connection from cell 2 to cell 4 (blue trace) and cell 1 to cell 4 (red trace) compared to the synaptic connection from cell 3 to cell 5 (green). (c) Summary plot of short-term synaptic dynamics with presynaptic 20 Hz stimulation (8 pulses at 20 Hz) in connected pairs as in (b). Amplitude normalized to size of initial EPSP. (d) Example traces of action potential generation by step current injection in regular spiking (cell 3, black) and fast spiking neurons (cell 4, gray). The same amount of current injection (280 pA) was applied to cell 3 and cell 4.(e) Spike shape comparison between regular and fast spiking neurons detected in the connectivity assay shown in (b). (f) Frequency-current curve of pyramidal neuron (Pyr; mean ± standard deviation, n=3), and fast spiking neuron (panel (k), cell 4) and PVALB positive neurons (including upper 2 cells shown in panel (g) of Figure 3—figure supplement 1) (mean ± standard deviation, n=3). (g), Phase plot (dV/dt vs V) analysis based on responses shown in (d). (h) Morphological reconstruction of the 5 recorded neurons shown in (a) with biocytin +confocal imaging. Scale bar, 500 µm.(i) Reconstruction of individual neurons. Scale bar, 500 µm. Blue, magenta, and red indicate basal dendrites, apical dendrites, and axons in pyramidal neurons (cell 1,2,3,5). For the interneuron (cell 4), blue and red indicate dendritic and axonal structures, respectively. (j) Fluorescence montage of cells imaged in (a), (j-l) stained by mFISH for inhibitory neuron subclass markers (PVALB, SST, and VIP) and biocytin. Multiple patch-clamp recordings were performed on three separate cell clusters in this slice (j). Note, substantial lipofuscin is observed in this slice. White box in (j) is shown at higher magnification for mFISH and biocytin (k), or mFISH only (l).
Figure 3—figure supplement 1
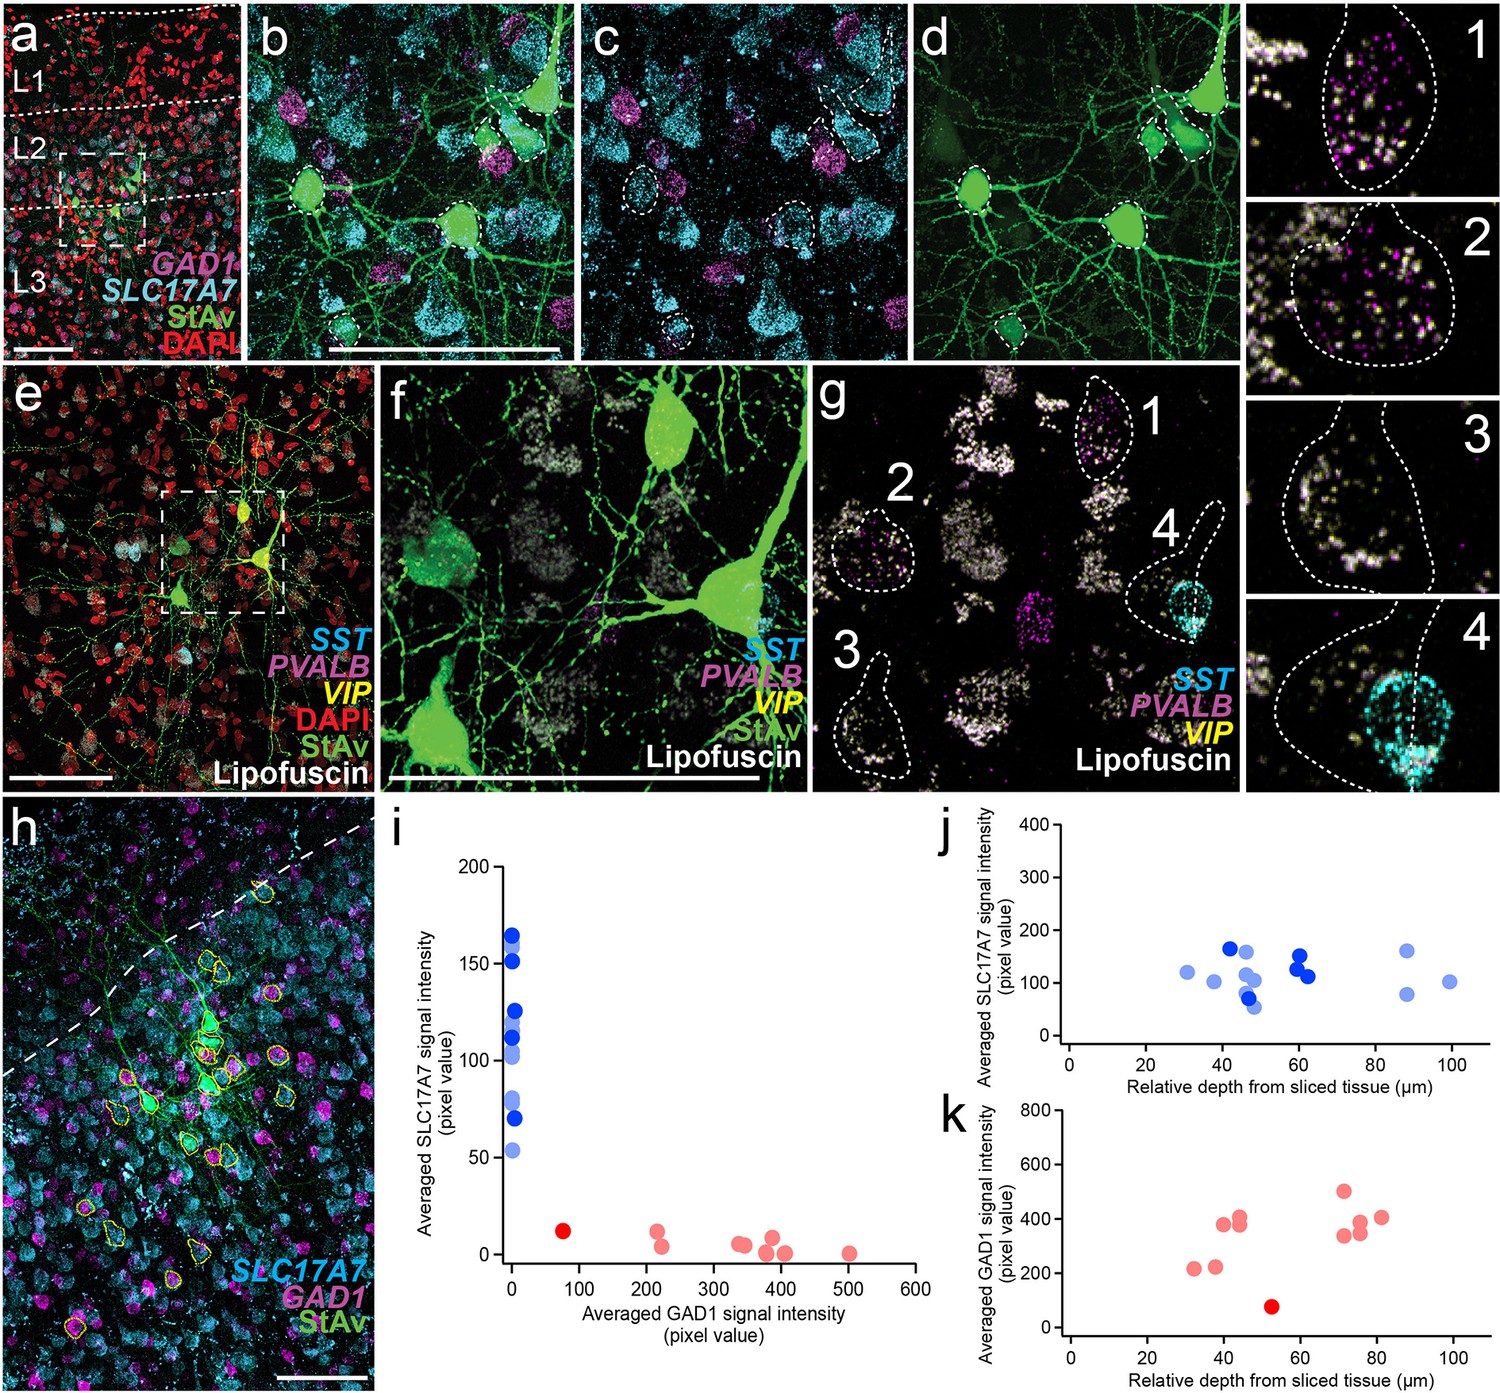
Two examples of multiple patch-clamp recordings with excitatory and inhibitory HCR markers in acute ex vivo human neocortex and depth dependence of HCR signals.
Two examples multiple patch-clamp recordings shown in (a–d,h–k) and in (e-g). (a) Fluorescence montage of maximum intensity projections showing mFISH staining for excitatory (SLC17A7) and inhibitory (GAD1) neuron marker transcripts, nuclei (DAPI), and patched neurons (biocytin). Note lack of SLC17A7 labeling in layer 1. (b–d) Enlargement of boxed region from (a. e) Fluorescence montage showing four adjacent multi-patched cells from a different experiment. (f–g) Two of the four patched neurons were labeled with PVALB transcript. Each cell is numbered and shown enlarged to the right. Note, although cell #4 overlaps with SST, this is a different Z-plane than the patched cells. No VIP-stained neurons were present in this field of view but were found outside of this region (data not shown). (h–k) Quantification of excitatory and inhibitory neuron markers in patched and unpatched neurons. (h) Co-labeling for SLC17A7 and GAD1 mRNA. Yellow lines show 3D manually segmented neurons in a maximum intensity projection montage image. (I) SLC17A7 and GAD1 expression is mutually exclusive. Blue indicates SLC17A7+neurons (patched neurons, blue; unpatched neurons, light blue) and red indicates GAD1+ + (patched neurons, red; non-patched neurons, light red). The same cells are displayed as a function of cortical depth in (j-k). (j), SLC17A7+positive neurons are displayed along relative depth of the slice. (k), Similarly, GAD1+-positive neurons are displayed along relative depth of the slice. Most labeled cells showed similar mRNA intensity in patched and unpatched neurons, except for one GAD1-positive neuron with lower transcript detection. Scale bars, + µm in (a,b,e,f,h). This analysis was conducted once but is representative of many individual staining experiments that included a class maker (like SLC17A7 or GAD1), a subclass marker (like SST or PVALB), and a patched cell marker streptavidin.
Figure 3—figure supplement 2

Examples of multiple patch-clamp recordings with inhibitory interneuron-targeted HCR staining in organotypic slice cultures.
(a) Fluorescent montage images of two neuron clusters evaluated by multiple patch-clamp recordings highlighted with boxes site1 and site2 with patched cell numbers after seven days in culture (7 DIV refer to 7 days in vitro). Patched neurons displayed with biocytin/streptavidin staining. (b) Fluorescent montage of SYFP2 expression from a GABAergic neuron enhancer AAV (AAV-DLX2.0-SYFP2). Right panel, high magnification images of site1 and site2 shown in (a) and (b). Patched neurons displayed with biocytin/streptavidin only staining (StAv; left) or SYFP2 (SYFP2; middle), mFISH, and lipofuscin (light purple; right). Asterisks mark SYFP2+ cells not marked by biocytin/streptavidin. Scale bar, 100 µm. (c–d) High-resolution images of individual patched cells stained by mFISH in round 1 against PVALB, SST, and VIP, and round 2 against LAMP5, GAD1, and VIP. Scale bar, 10 µm. Cell numbers are labeled consistently in (a-b). (e) Expression level of each gene for each patched cell was quantified based on average intensity per cell. The average intensity was normalized by maximum value detected among the manually segmented patched and non-patched cells shown in Figure 3—figure supplement 3.
Figure 3—figure supplement 3

HCR signal comparison between patched and unpatched neighboring neurons.
Both patched and unpatched neighboring neurons were manually segmented in 3D. Average intensity values of HCR signals in each neuron were quantified and displayed. Orange closed circles indicate the patched neurons shown in Figure 3—figure supplement 2 and blue closed circles indicate non-patched neighboring neurons.
Figure 4 with 4 supplements
Synaptic dynamics of pyramidal-interneuron connections show heterogeneity and are target-cell specific.
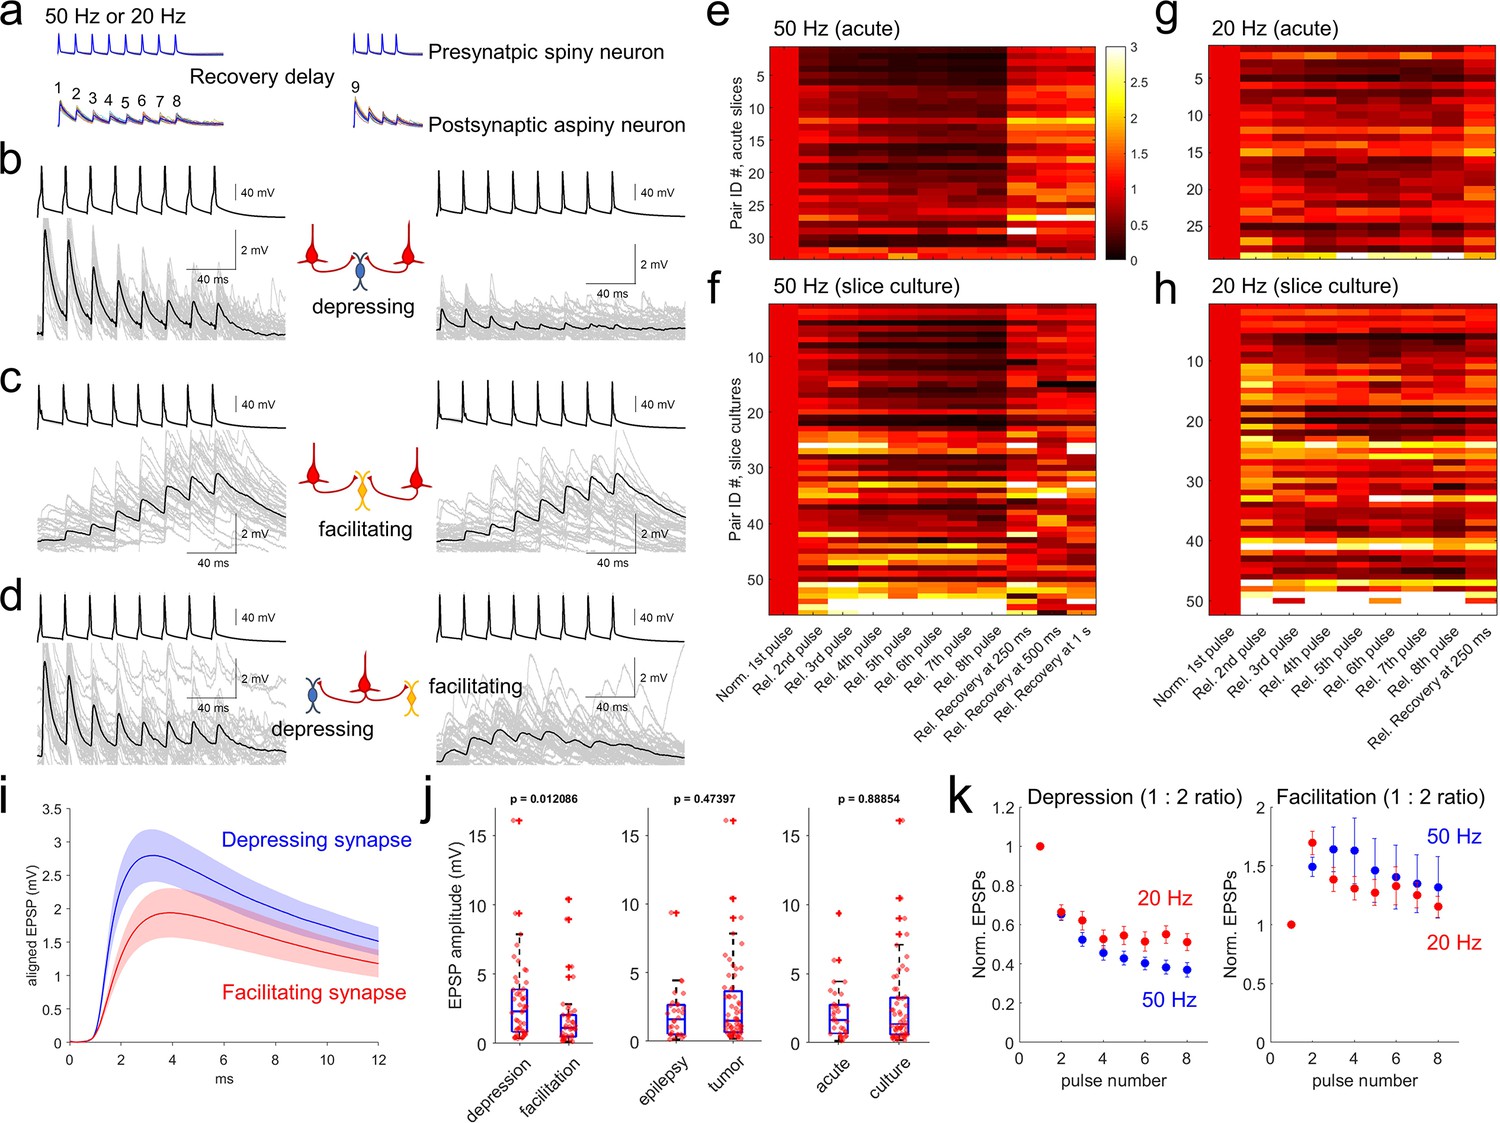
(a) Stimulation protocol of connectivity assays. Eight trained presynaptic spikes were generated with two main stimulus frequencies (20 and 50 Hz). Fixed 250ms recovery delay was used for 20 Hz stimulation and a range of recovery delays (from 62.5, 125, 250, 500ms, 1 s, 2, and 4 s) were interposed between the eight induction pulses and four recovery pulses. (b–d) Target cell-specific synaptic dynamics from pyramidal to interneuron connections. Two pyramidal neurons were connected to one interneuron and their synaptic dynamics were similar, that is, both were depressing (b), or both were facilitating (c). However, example in (d) shows one pyramidal neuron that was connected to two interneurons showing either depression (left panel) or facilitation (right panel). Averaged EPSP responses (blue, thick line) on top of individual responses traces (multiple colors) are displayed in each connected pair. (e–h) Initial EPSP sizes were normalized in connected pairs, and their relative synaptic dynamics according to presynaptic train stimulation (8 pulses) are displayed by heatmap. Heatmap rows sorted based on the size of EPSP, from largest (top row) to smallest (bottom row). Initial recovery pulse (denoted as 9 in panel a) responses out of 4 recovery pulses are displayed at 250ms, 500ms and 1 s at 50 Hz (e,f) and fixed recovery interval at 250ms at 20 Hz (g,h) as example responses. Synaptic connections found in acute slices (n=33 at 50 Hz in panel e); n=29 at 20 Hz in panel (g) and slice culture (n=56 at 50 Hz in panel f); n=52 at 20 Hz in panel (h). (i) Initial EPSP responses from 50 Hz stimulation were aligned from response onset and averaged. 1:2 ratio was determinant for classifying depression and facilitation at 50 Hz presynaptic stimulation. Aligned average EPSP kinetics are shown (depressing synapses, n=50; facilitating synapses, n=39). Displayed data indicate mean (blue, red)± s.e.m (shaded regions with light colors). (j) Amplitudes of EPSP responses (i.e. averaged first EPSP responses at 50 Hz stimulation in connected synapses) were compared between depressing (n=50) and facilitating (n=39) synapses defined by their 1:2 ratio at 50 Hz stimulation. EPSP amplitudes were compared from their tissue origins (n=30, epilepsy; n=59, tumor). EPSP amplitudes were also compared from their tissue preparation types (n=33, acute slice; n=56, slice culture). p-Values are from Wilcoxon rank sum test. (k) Kinetics of synaptic dynamics (1–8 pulses, normalized to first response) were compared at different frequencies (i.e. 50 Hz and 20 Hz presynaptic stimulation). Depression and facilitation synapses were defined based on 1:2 ratio. Kinetics of dynamics from depressing synapses are displayed (mean ± s.e.m; n=50, depression at 50 Hz, blue; n=29, depression at 20 Hz, red; left). Similarly, kinetics of dynamics from facilitating synapses are displayed (n=39, facilitation at 50 Hz; n=50, facilitation at 20 Hz; right).
Figure 4—figure supplement 1
Short-term synaptic dynamics with various methods (i.e. 20 Hz vs 50 Hz, and additional definition with 1:8 and 1:6–8 ratio) and impacts for disease condition or slice preparation.
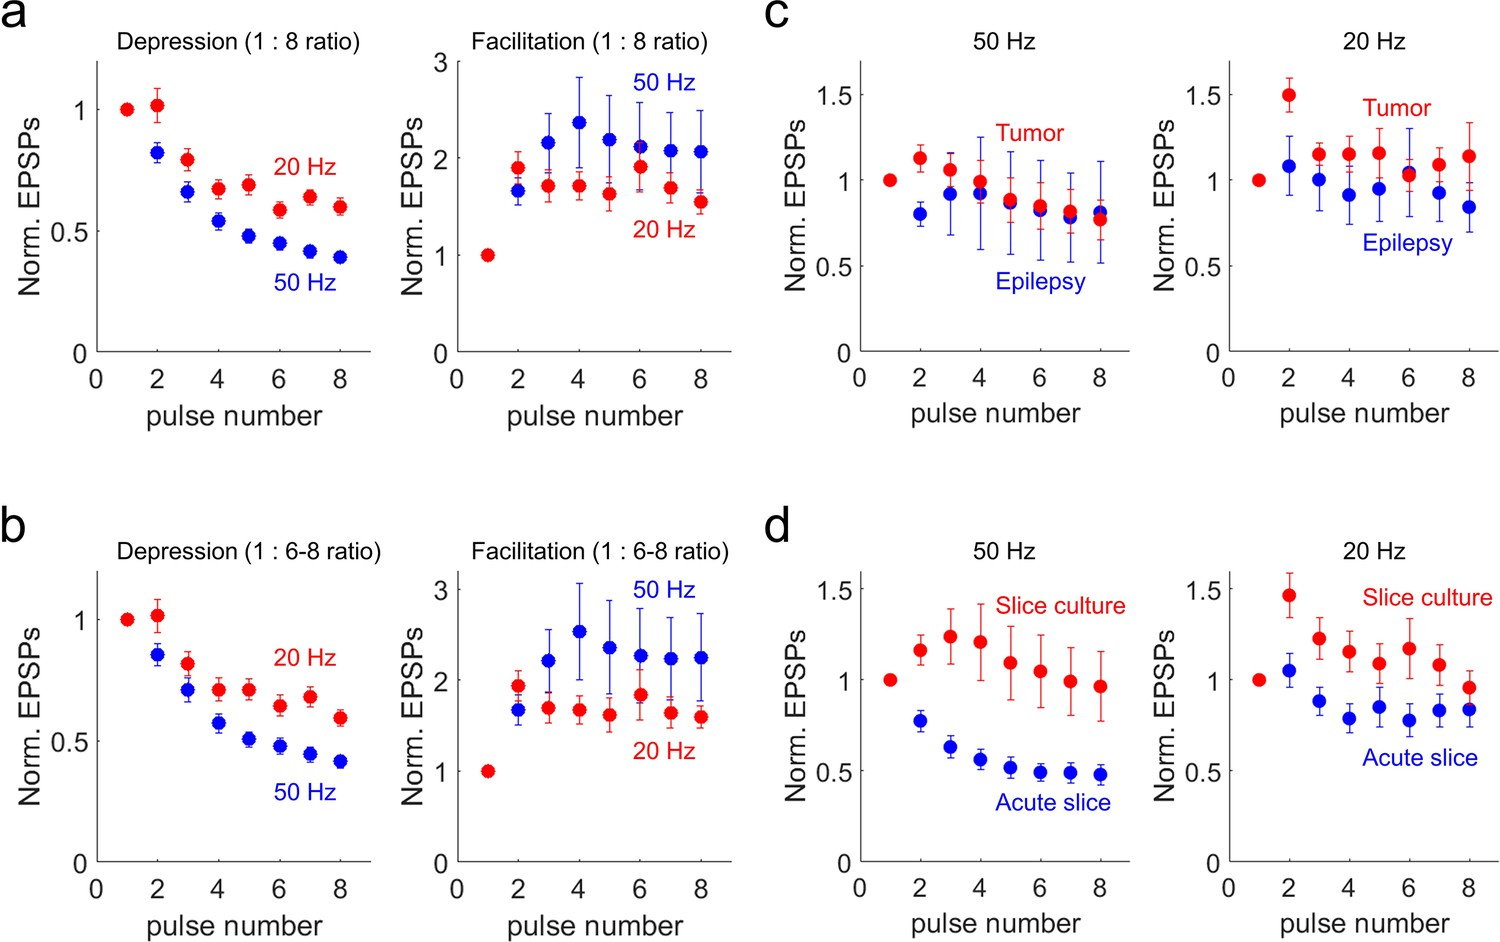
(a) Kinetics of synaptic dynamics. Depression and facilitation synapses were defined based on 1:8 ratio. Kinetics of dynamics from depressing synapses are displayed (n=71, depression at 50 Hz, blue; n=53, depression at 20 Hz, red; left). Similarly, kinetics of dynamics from facilitating synapses are displayed (n=18, facilitation at 50 Hz; n=26, facilitation at 20 Hz; right). (b) Kinetics of synaptic dynamics. Depressing and facilitating synapses were defined based on 1:6–8 ratio (average of 6–8 pulses compared to first pulse). Kinetics of dynamics from depressing synapses are displayed (n=68, depression at 50 Hz, blue; n=52, depression at 20 Hz, red; left). Similarly, kinetics of dynamics from facilitating synapses are displayed (n=21, facilitation at 50 Hz; n=27, facilitation at 20 Hz; right). Displayed data indicate mean ± s.e.m (error bars). (c–d), Kinetics of synaptic dynamics were compared from their tissue origins or slice preparation (1:2 ratio). (c), Left panel shows at 50 Hz (n=30, epilepsy, blue; n=59, tumor, red) and right panel shows at 20 Hz (n=29, epilepsy, blue; n=50, tumor, red). (d), Left panel shows at 50 Hz (n=33, acute, blue; n=56, slice culture, red) and note that only 4 out of 33 synapses showed synaptic facilitation at 50 Hz stimulation (1:2 ratio) in acute preparation and averaged values show strong depression. Right panel shows at 20 Hz (n=29, acute slice, blue; n=50, slice culture, red). Displayed data indicate mean ± s.e.m (error bars).
Figure 4—figure supplement 2
EPSP kinetic properties between depressing and facilitating synapses were not statistically different (Related to Figure 4i).
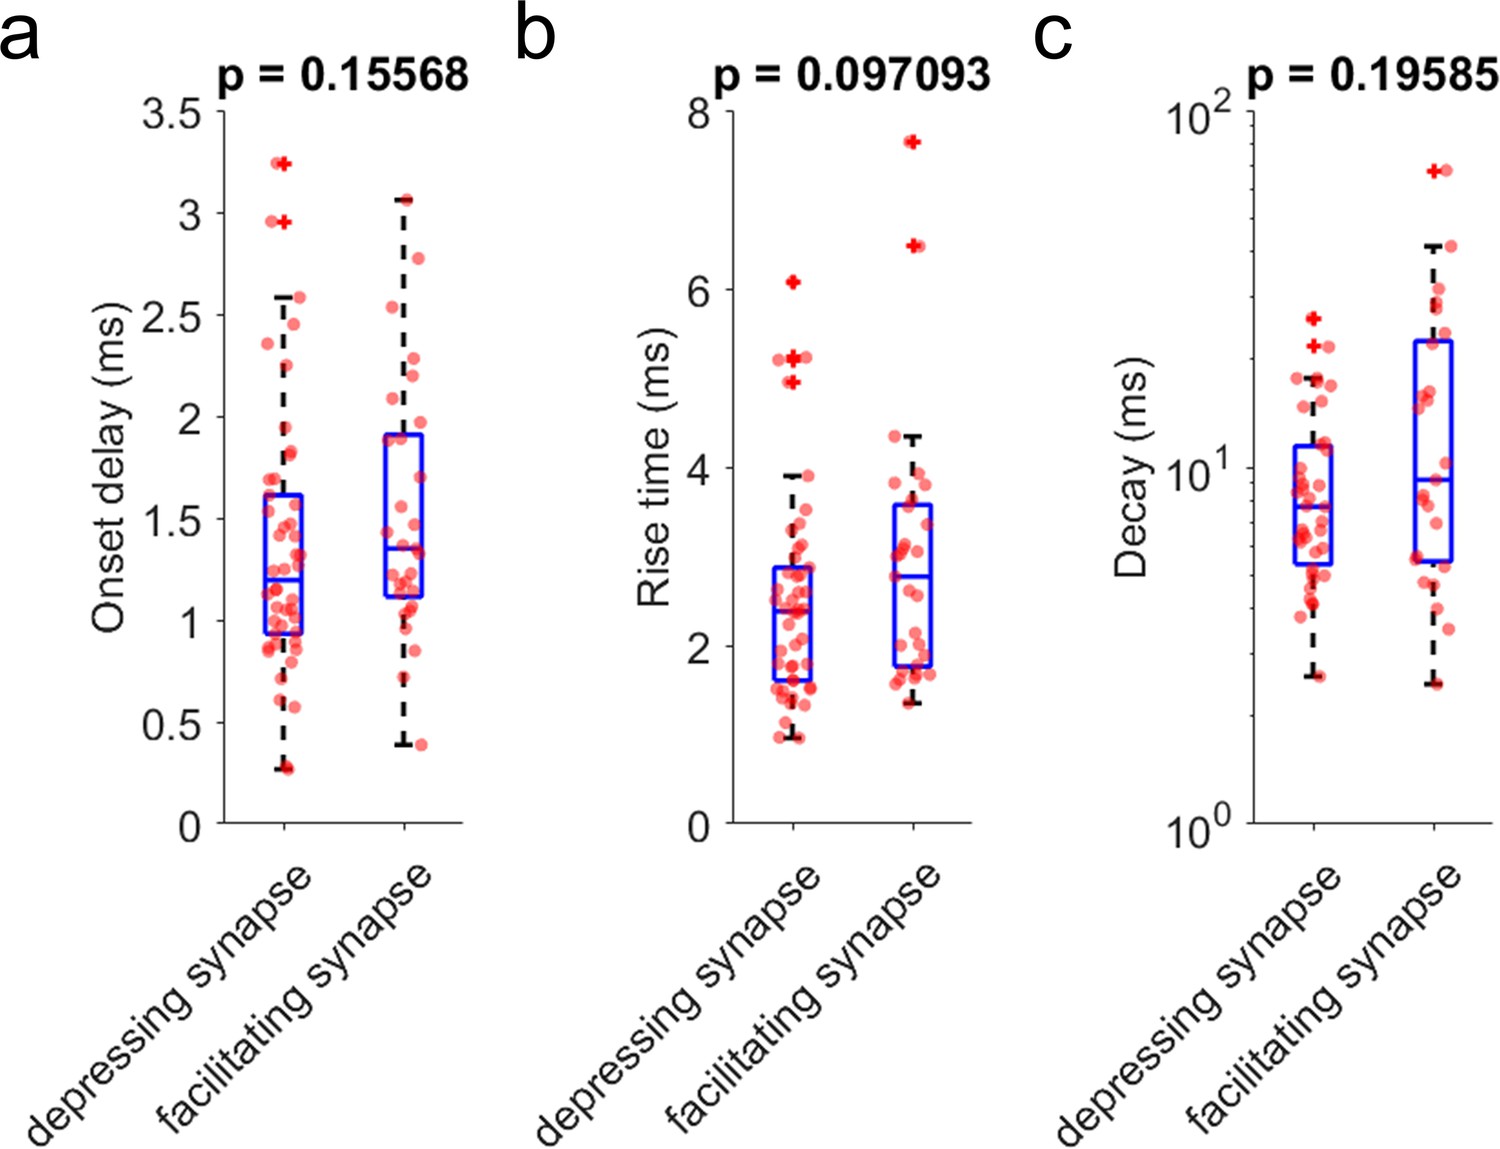
Initial EPSP responses from 50 Hz stimulation were aligned from response onset and averaged (Figure 4i). 1:2 ratio was determinant for classifying synapses as depressing and facilitating at 50 Hz presynaptic stimulation (depressing synapses (n=50) and facilitating synapses (n=39)). (a), Onset delay (n=46, depressing synapses; n=29, facilitating synapses). (b), Rise time defined by time from response onset to peak (n=46, depressing synapses; n=29, facilitating synapses). (c), Decay time constant (n=39, depressing synapses; n=25, facilitating synapses). p-Values are from Wilcoxon rank sum test.
Figure 4—figure supplement 3

Paired pulse ratios are strongly correlated with their recovery parameters.
We defined the recovery parameter as normalized mean responses of early recovery time periods including 62.5ms, 125ms, and 250ms. Regression line (red) with fitting confidence bounds (shaded region, light red) were displayed.
Figure 4—figure supplement 4

No correlation found between paired pulse ratios and days after slice culture in synapse types (i.e., depressing and facilitating synapses).
Paired pulse ratios (1:2 ratio) were displayed as a function of DIV (days in vitro) and there is no significant correlation found (depressing synapses, n=50 at 50 Hz; facilitating synapses, n=39 at 50 Hz; upper panel). Linear regression (red) was performed in each group and displayed with confidence interval (shaded, light red). Similarly, we didn’t see any correlation when we adopted different metric for the rate of synaptic dynamics such as 1:8 ratio,1-3:6–8 ratio (data not shown).
Figure 5
post-hoc HCR (mFISH) staining confirmed differentiated synaptic dynamics from excitatory pyramidal neurons to PVALB (depressing) and SST (facilitating) positive interneurons.
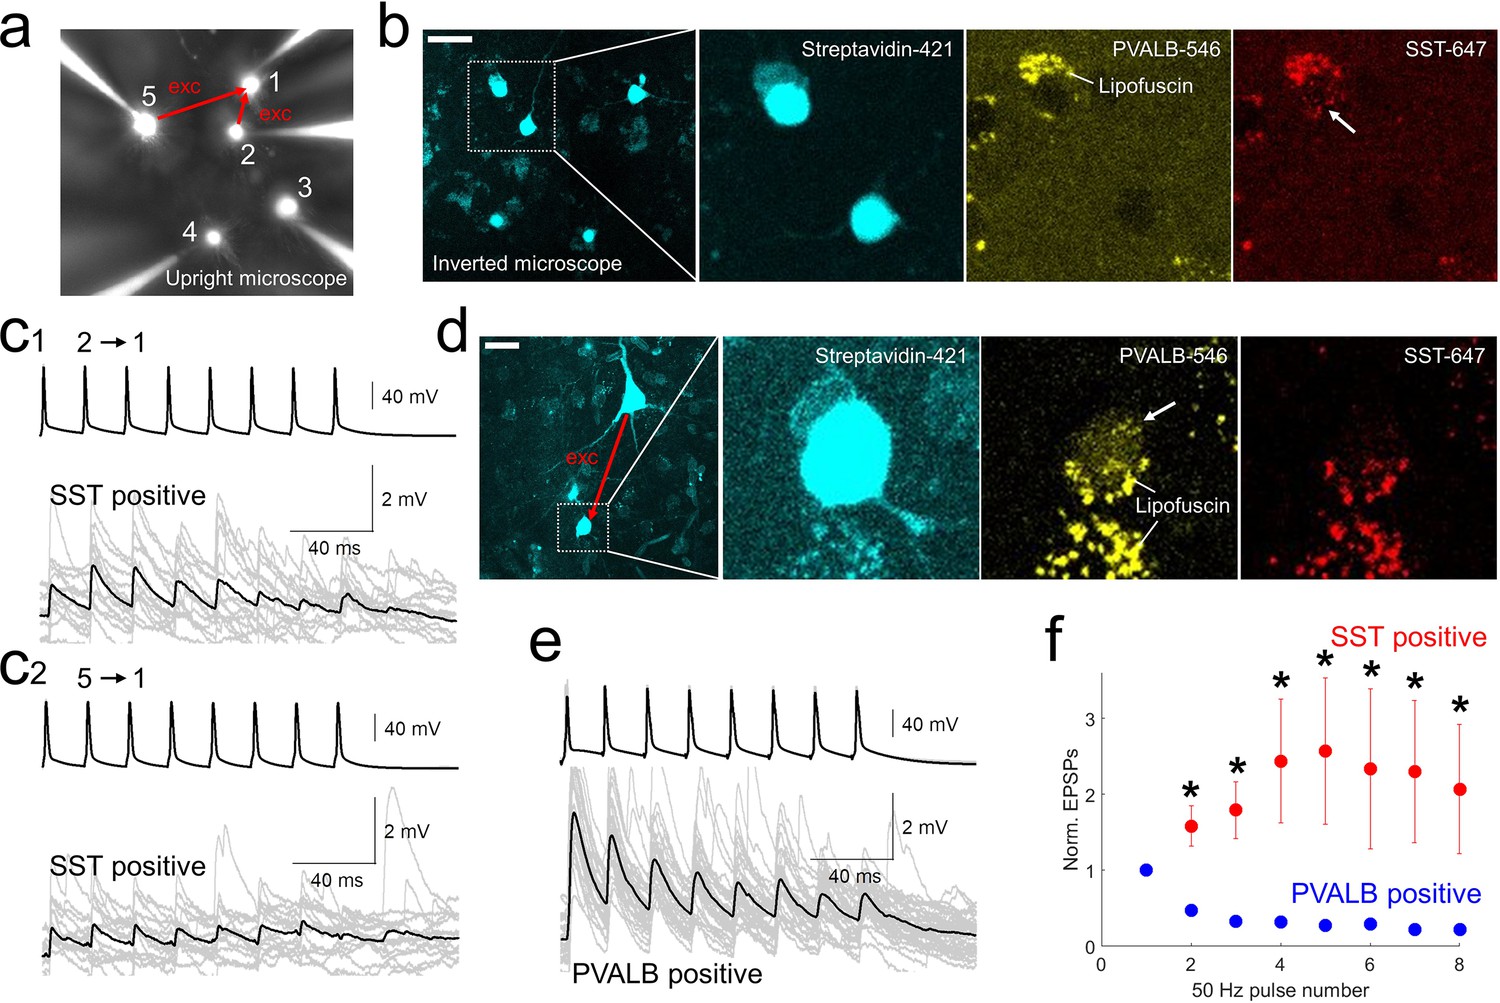
(a-b).multiple patch-clamp recordings were performed underneath upright microscope (cascade blue, fluorescent dye included with biocytin on the patch pipettes, a) and biocytin filled patched cells, stained with streptavidin (left two panels, b) and their HCR staining were identified on the inverted microscope. Example of SST-stained neuron (cell 1) in connectivity assay from slice culture. Note that lipofuscin signal was seen in both PVALB (546 nm) and SST (647 nm) channels, but HCR signals were shown up separately in one or the other channel. c1-2, Corresponding synaptic dynamics at 50 Hz stimulation. In this example, tw o pyramidal neurons (cell 2 and cell 5) were connected to a SST-positive neuron (cell 1). (d) Example of PVALB-stained neuron in connectivity assay from acute slice (d). (e) Corresponding synaptic dynamics at 50 Hz presynaptic stimulation is displayed. Averaged EPSP responses (black, thick line) on top of individual responses traces (gray) are displayed for each connected pair in (c1, c2) and (e). (f) Summary plot of normalized synaptic dynamics from PVALB positive (blue; n=6) and SST positive (red; n=6) neurons. Displayed data indicate mean ± s.e.m (error bars; *, p<0.05 for both Wilcoxon rank sum test and false discovery rate (FDR) corrected Wilcoxon rank sum test).
Figure 6 with 3 supplements
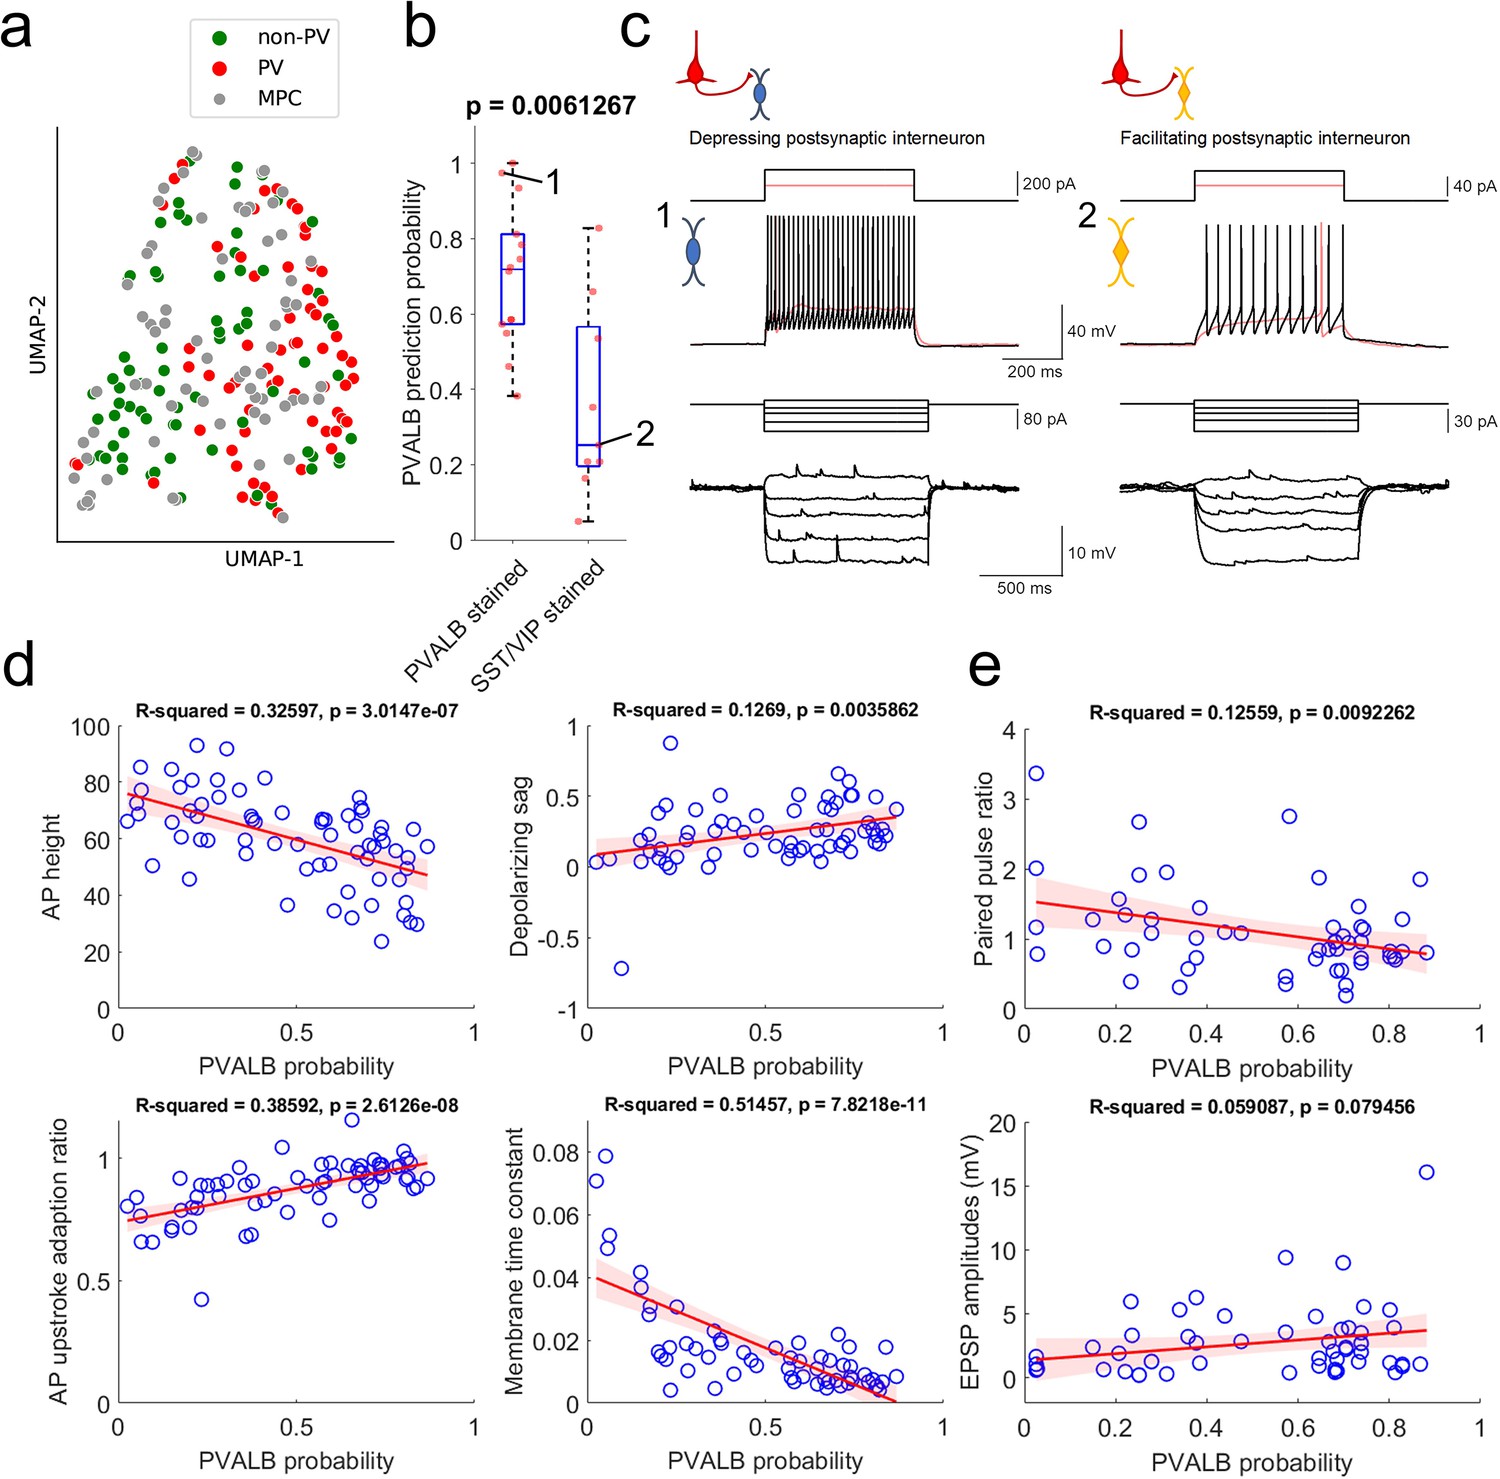
Prediction of PVALB and non-PVALB subclass cell type identities in postsynaptic interneurons by intrinsic membrane properties-based classifier using human Patch-seq data obtained from AAV virally labeled slice cultures.
(a) UMAP visualization of PVALB and non-PVALB cell types based on their intrinsic membrane properties using human single cell Patch-seq data and alignment with postsynaptic cell intrinsic properties from multiple patch-clamp connectivity assay. (b) Correlation between PVALB probability predicted by intrinsic properties-based classifier and their subclass identity based on HCR staining (PVALB stained, n=14; SST/VIP stained, n=9). Classification based on PVALB and non-PVALB cell prediction. p Value from Wilcoxon rank sum test. (c) Example traces of intrinsic membrane properties from postsynaptic cells, showing synaptic depression (cell 1, PVALB positive) and facilitation (cell 2, SST positive). Two representative examples of outward step current injections (red and black trace) and corresponding voltage responses (red and black trace) shown in upper panels. (d) Examples of identified dominant features to segregate PVALB and non-PVALB interneurons. Regression line (red) with fitting confidence bounds (shaded region, light red) were displayed. (e) Correlation between PVALB probability and their paired pulse (1:2 ratio, upper) or EPSP amplitudes (lower) at 50 Hz presynaptic stimulation protocol. Regression line (red) with fitting confidence bounds (shaded region) in (d,e).
Figure 6—figure supplement 1

Classifier prediction with 20 Hz pulse trains.
Lower correlation is shown between PVALB probability and their paired pulse ratio (upper) or EPSP amplitudes (lower) with 20 Hz presynaptic stimulation protocol than 50 Hz stimuli. Regression line (red) with fitting confidence bounds (shaded region).
Figure 6—figure supplement 2

EPSP amplitudes and paired pulse ratios are correlated in non-PVALB neurons predicted by classifier.
PVALB (as classifier probability over 0.6; n=28) and non-PVALB (as classifier probability below 0.4; n=20) neurons are assigned from the classifier and linear regression (red) was performed in two groups and displayed with confidence interval (shaded, light red).
Figure 6—figure supplement 3

No correlation found between paired pulse ratios and days after slice culture in predicted subclass cell types (i.e. PVALB and non-PVALB).
PVALB and non-PVALB neurons were determined by the classifier-based probability (probability over 0.6 as PVALB, n=28; probability below 0.4 as non-PVALB, n=20). Linear regression (red) was performed in each group and displayed with confidence interval (shaded, light red). Similarly, we did not see any correlation when we adopted different metric for the rate of synaptic dynamics such as 1:8 ratio,1-3:6–8 ratio (data not shown).
Author response image 1
Additional files
-
Supplementary file 1
PVALB versus SST subclass differential gene expression analysis.
- https://cdn.elifesciences.org/articles/81863/elife-81863-supp1-v2.docx
-
Supplementary file 2
List of intrinsic membrane properties classifier features and linear discriminant analysis (LDA) coefficients.
- https://cdn.elifesciences.org/articles/81863/elife-81863-supp2-v2.docx
-
MDAR checklist
- https://cdn.elifesciences.org/articles/81863/elife-81863-mdarchecklist1-v2.pdf
Download links
A two-part list of links to download the article, or parts of the article, in various formats.
Downloads (link to download the article as PDF)
Open citations (links to open the citations from this article in various online reference manager services)
Cite this article (links to download the citations from this article in formats compatible with various reference manager tools)
Target cell-specific synaptic dynamics of excitatory to inhibitory neuron connections in supragranular layers of human neocortex
eLife 12:e81863.
https://doi.org/10.7554/eLife.81863


