Molecular and anatomical characterization of parabrachial neurons and their axonal projections
- Department of Biochemistry, Howard Hughes Medical Institute, University of Washington, United States
- Center for the Neurobiology of Addiction, Pain, and Emotion, Department of Anesthesiology and Pain Medicine, University of Washington, United States
- Department of Pharmacology, University of Washington, United States
Figures
Figure 1 with 1 supplement
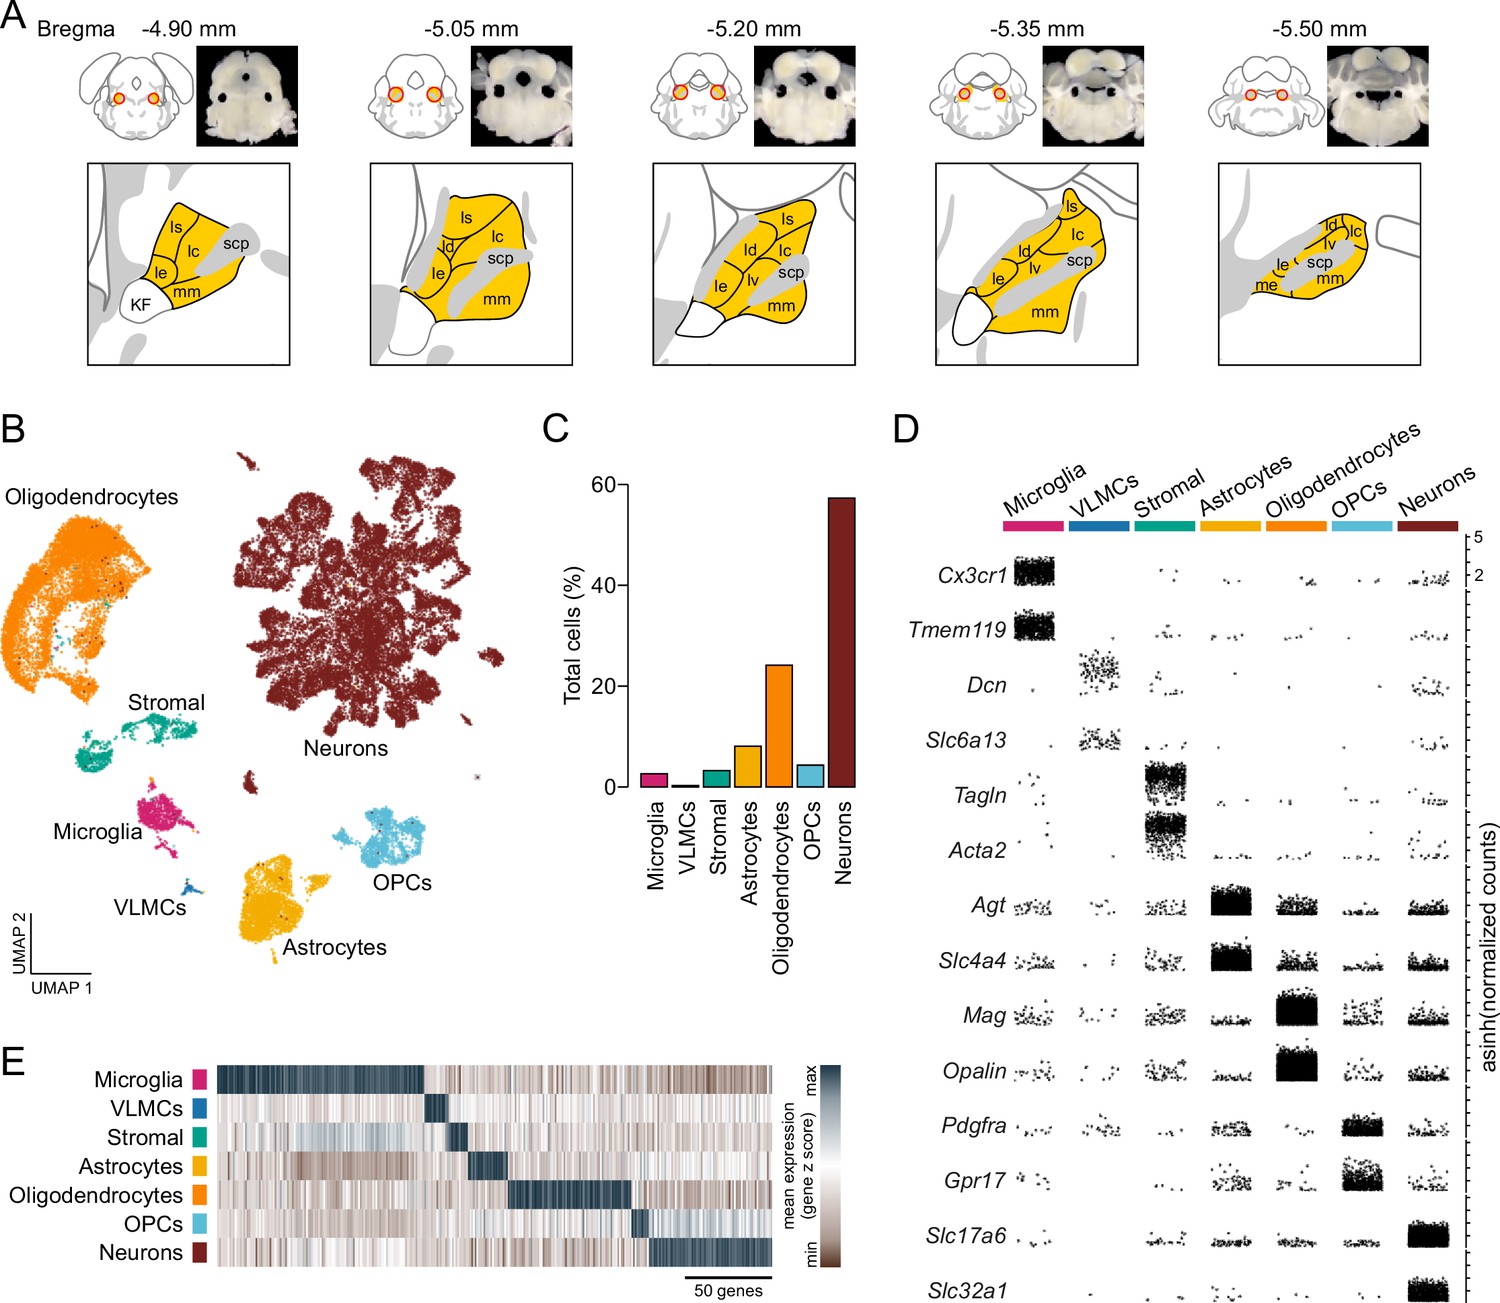
Single-cell RNA sequencing identifies resident cellular classes within the parabrachial nucleus (PBN).
(A) Brain sections showing location of PBN and approximate boundaries of punches used for scRNA-Seq. PBN subregions from Allen Mouse Brain Atlas are shown in yellow; abbreviations are the same as in Figure 4. (B) Cells were clustered according to their transcriptional profiles and plotted in uniform manifold approximation and projection space. (C) Percentage of total cells comprised by each cluster. (D) Expression of canonical features across PBN clusters. Each point represents a single transcript plotted according to its asinh-normalized expression level. (E) Classes of PBN cell types are distinguished by unique transcriptional profiles comprised of multiple genes.
Figure 1—figure supplement 1
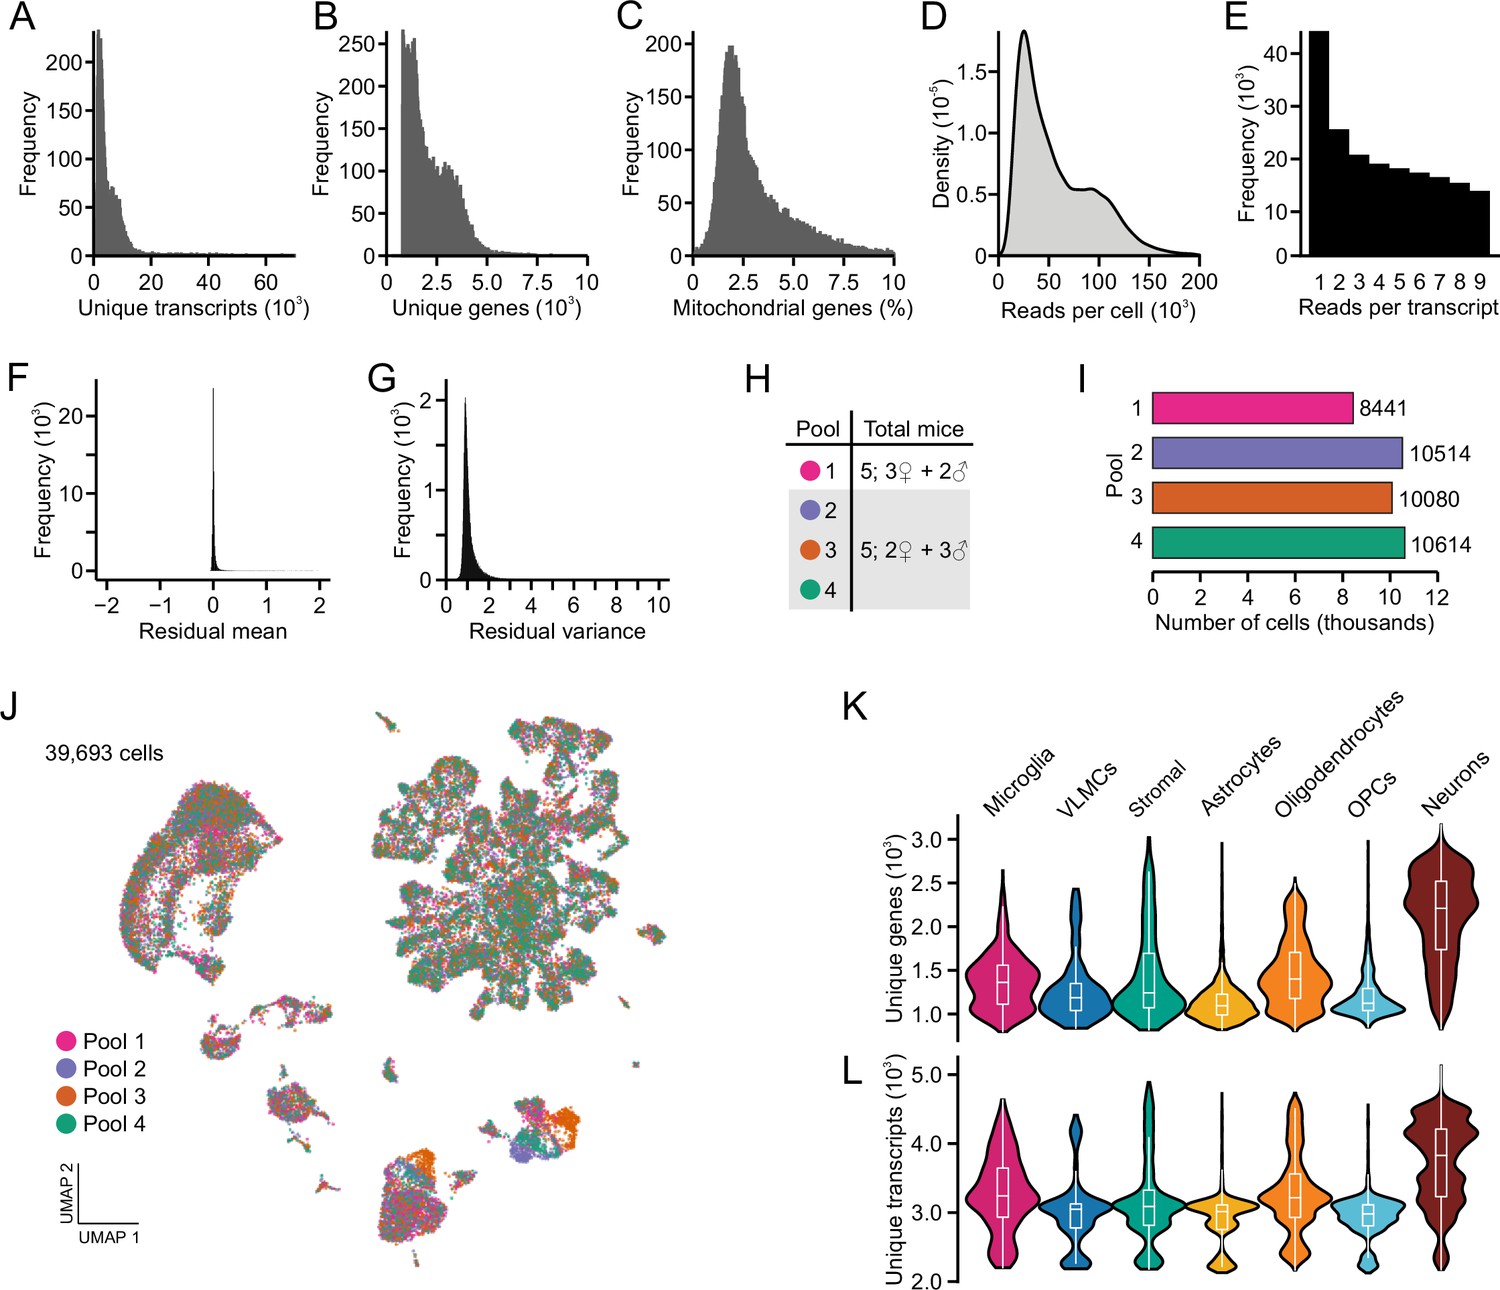
Technical metrics in scRNA sequencing analysis of resident parabrachial nucleus cell types.
(A) Distribution of unique transcripts per cell. (B) Distribution of unique genes per cell. (C) Distribution of percent mitochondrial reads per cell. (D) Distribution of total sequencing reads per cell. (E) Distribution of reads per transcript. (F) Following integration, the mean of residuals centers on zero. (G) Following integration, mean variance centers on one. (H) Number and sex of mice used in each library pool. (I) Number of cells sequenced from each library pool. (J) Following integration, each pool is represented uniformly across uniform manifold approximation and projection space. (K) Distribution of unique genes across each cell type. (L) Distribution of unique transcripts across each cell type.
Figure 2 with 1 supplement
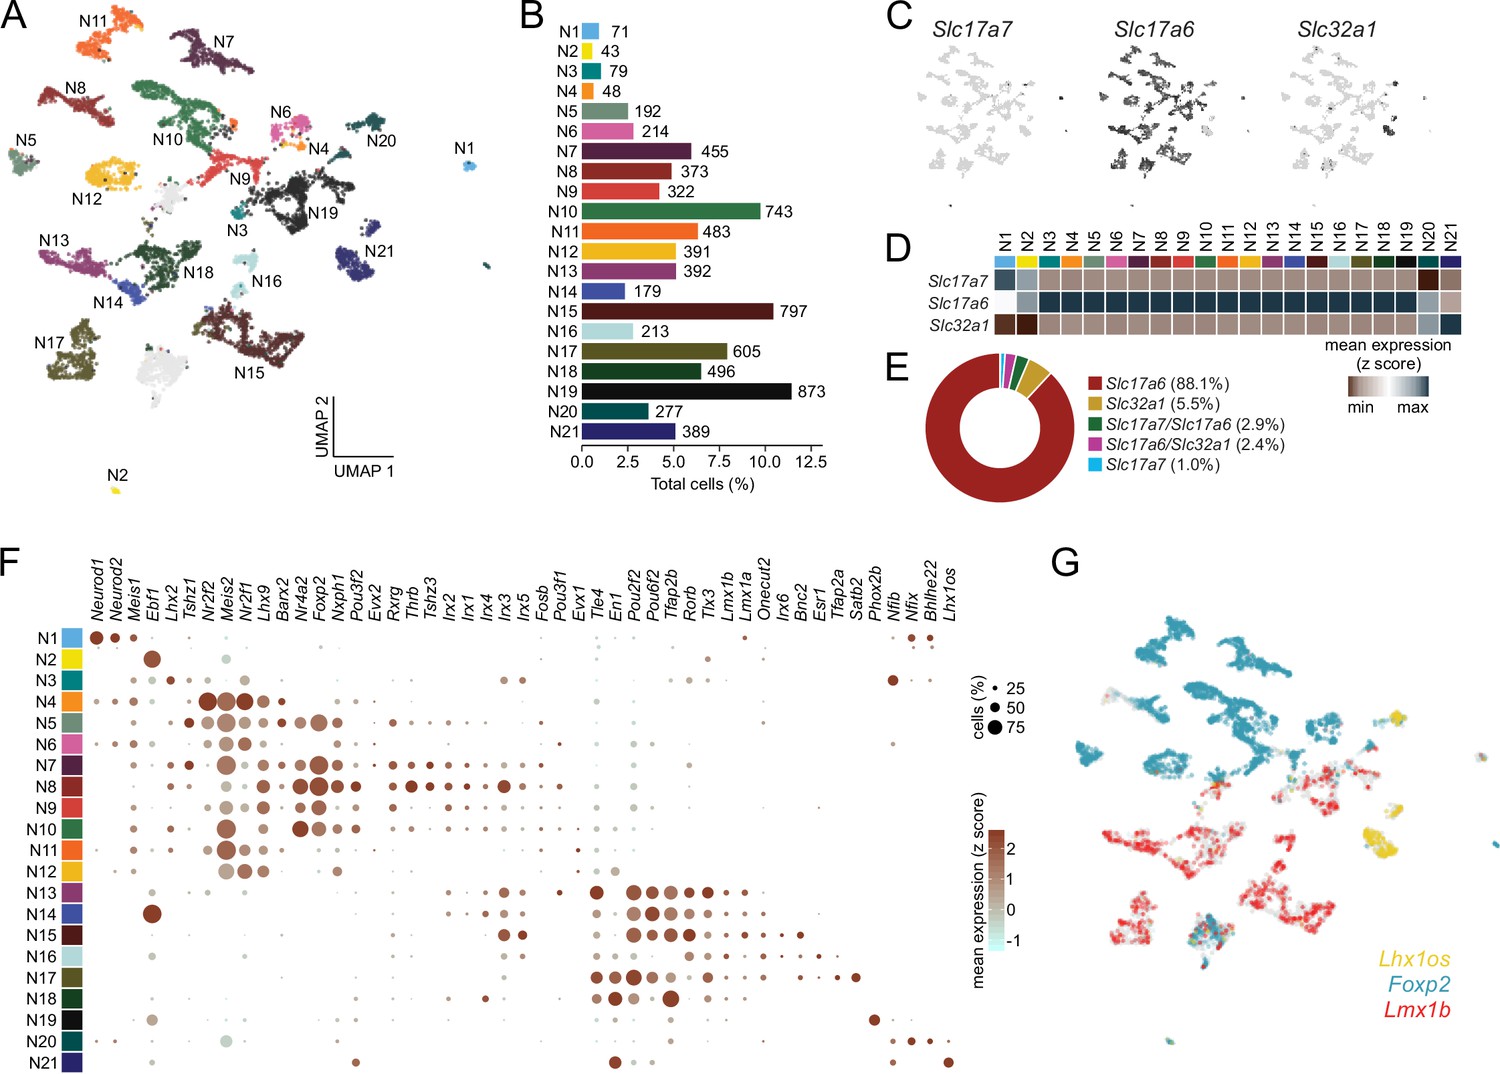
Single-cell RNA sequencing identifies discrete classes of parabrachial nucleus (PBN) neurons.
(A) Neurons were clustered according to their transcriptional profiles and plotted in uniform manifold approximation and projection (UMAP) space. Two clusters were omitted from analysis (gray; see Materials and methods). (B) Percentage of total neurons comprised by each neuronal subcluster. (C) Expression values of fast neurotransmitters in UMAP space. (D) Average expression of fast neurotransmitters across neuronal subclusters. (E) Percentage of neurons individually expressing or co-expressing fast neurotransmitters. (F) Transcription factor expression across neuronal subclusters plotted according to their average normalized expression and fraction of cells expressing each gene. (G) Expression of the transcription factors Foxp2, Lmx1b, and Lhx1os across neurons in UMAP space.
Figure 2—figure supplement 1
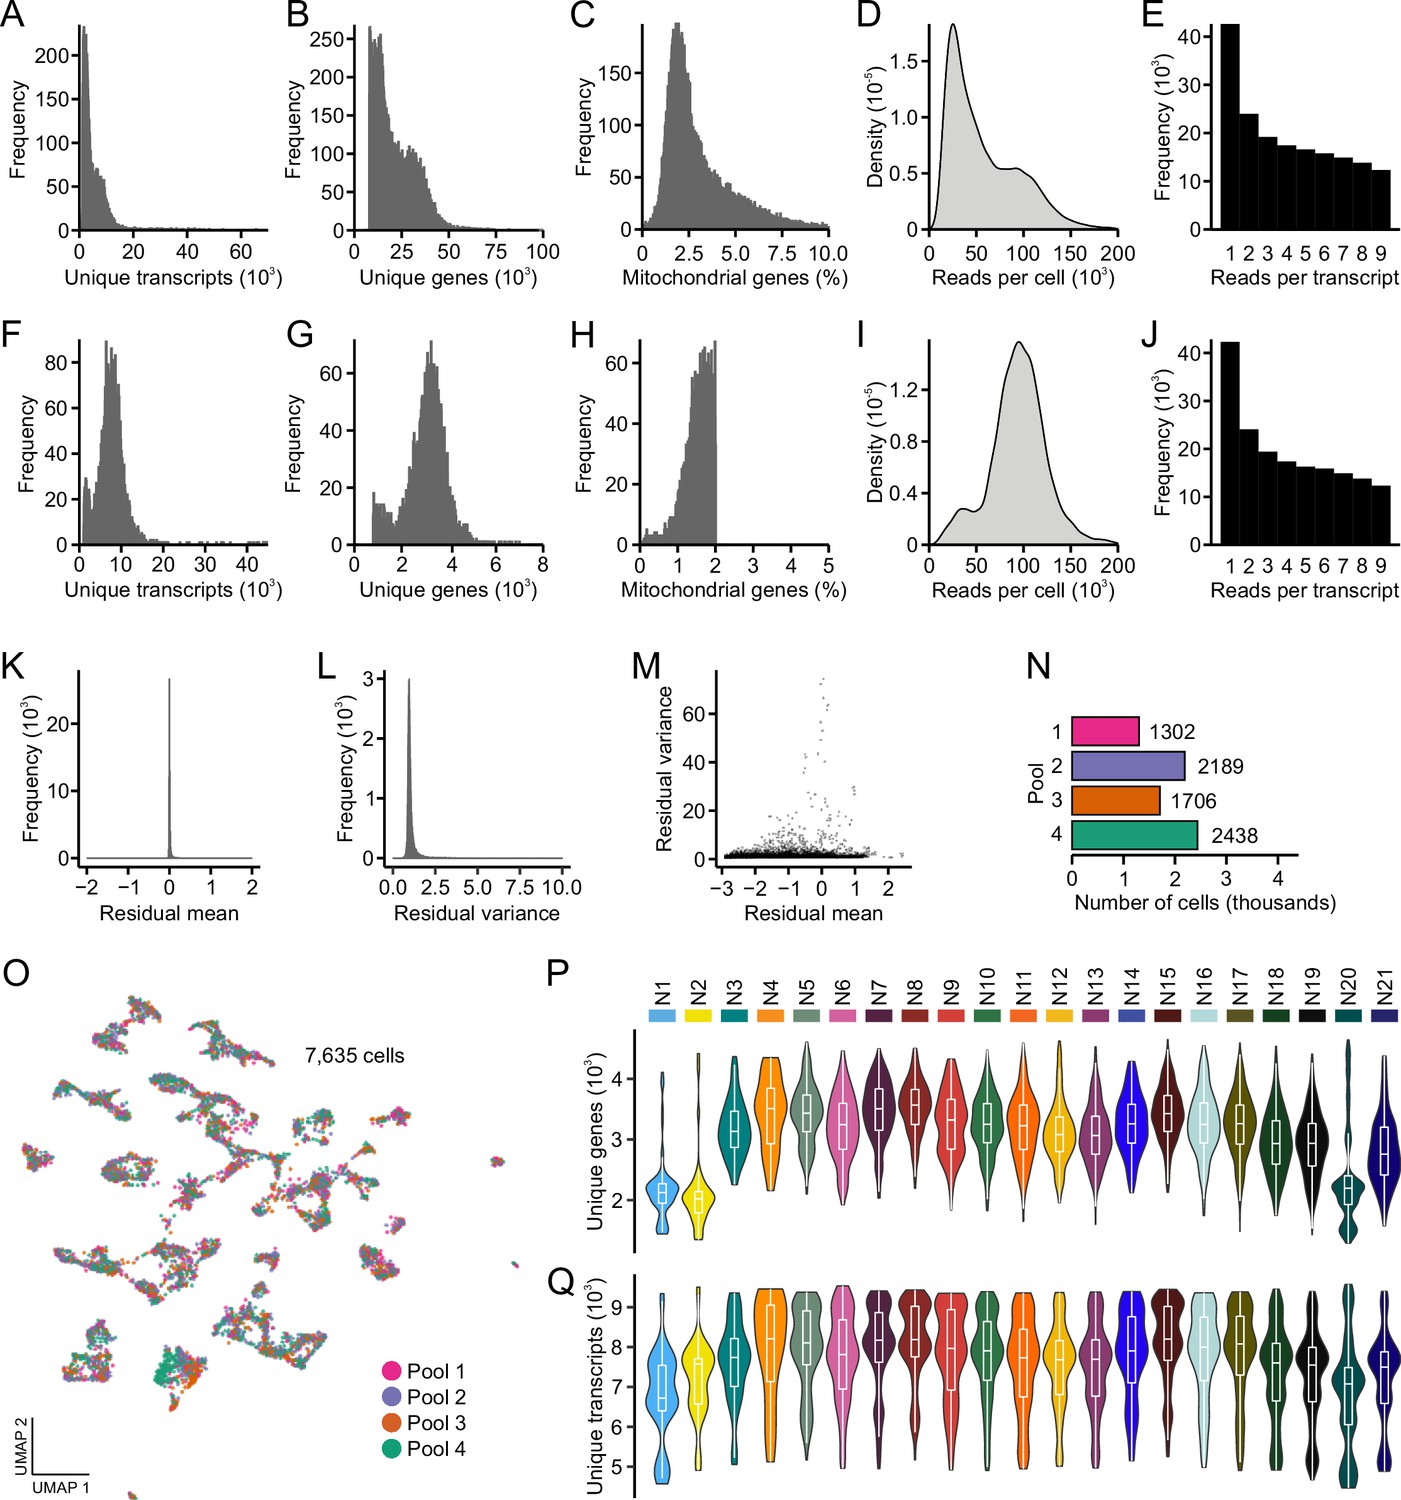
Technical metrics in scRNA sequencing analysis of neuronal subclusters.
(A) Distribution of unique transcripts per cell. (B) Distribution of unique genes per cell. (C) Distribution of percent mitochondrial reads per cell. (D) Distribution of total sequencing reads per cell. (E) Distribution of reads per transcript. (F) Distribution of unique transcripts per cell after thresholding. (G) Distribution of unique genes per cell after thresholding. (H) Distribution of percent mitochondrial reads per cell after thresholding. (I) Distribution of total sequencing reads per cell after thresholding. (J) Distribution of reads per transcript after thresholding. (K) Following integration, the mean of residuals centers on zero. (L) Following integration, mean variance centers on one. (M) High-variance residuals were assessed for clustering analysis. (N) Number of cells in each library pool. (O) Following integration, each pool is represented uniformly across uniform manifold approximation and projection space. (P) Distribution of unique genes across each neuronal subcluster. (Q) Distribution of unique transcripts across each neuronal subcluster.
Figure 3
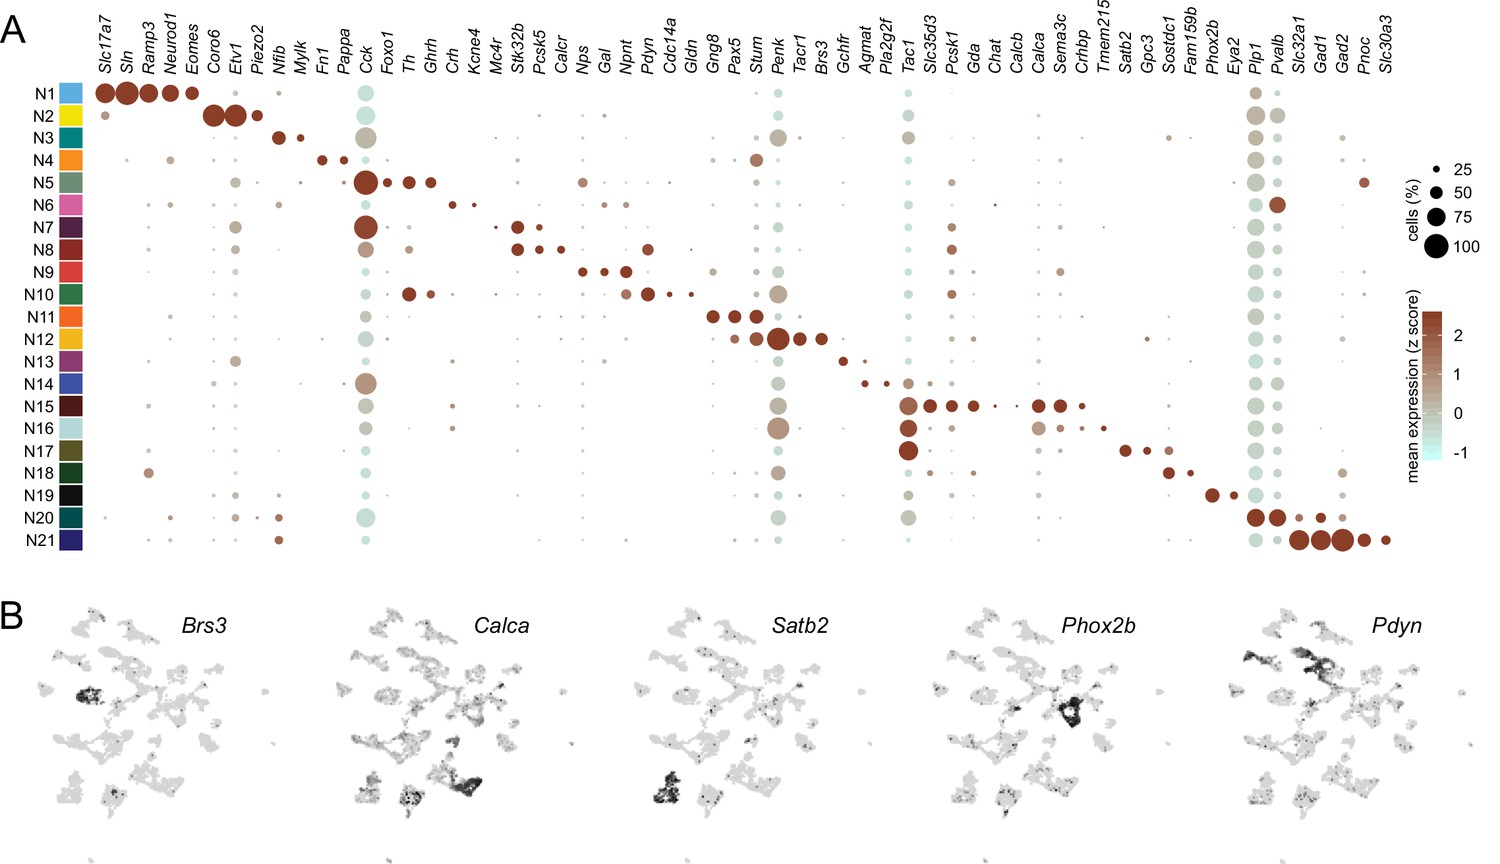
Distinguishing features of each neuronal subcluster.
(A) Expression of select differentially expressed features across neuronal subclusters plotted according to their average normalized expression and fraction of cells expressing each gene. (B) Expression of select genes plotted in uniform manifold approximation and projection space.
Figure 4 with 1 supplement
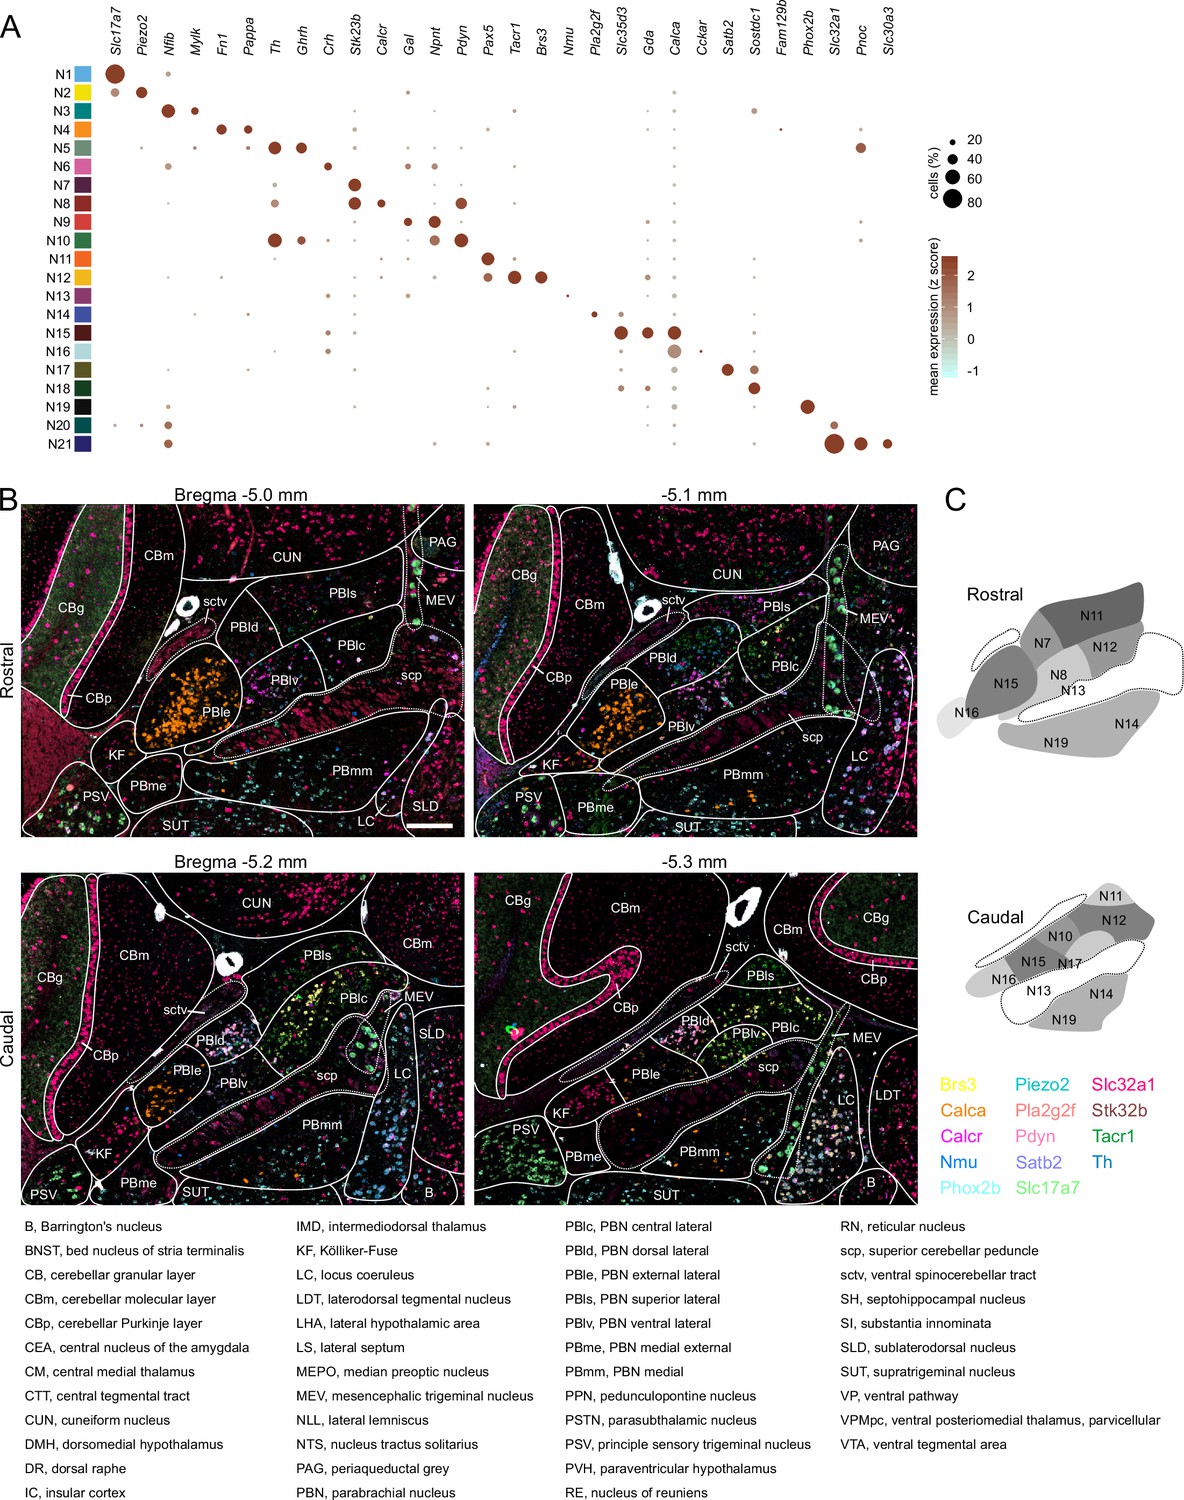
Localization of mRNAs in subregions of the parabrachial nucleus (PBN) based on HiPlex results.
(A) Expression of genes selected as HiPlex probes within the scRNA-seq dataset. (B) Example of how the regions of interest denoting PBN subregions were drawn for analysis of 15 probes from the first HiPlex experiment. Probes and their colors are indicated. (C) Diagram of the approximate location of 12 of the identified clusters in a rostral and caudal PBN. Scale bar, 200 μm. (D) List of abbreviations from AMBA used throughout the manuscript and figures.
Figure 4—figure supplement 1
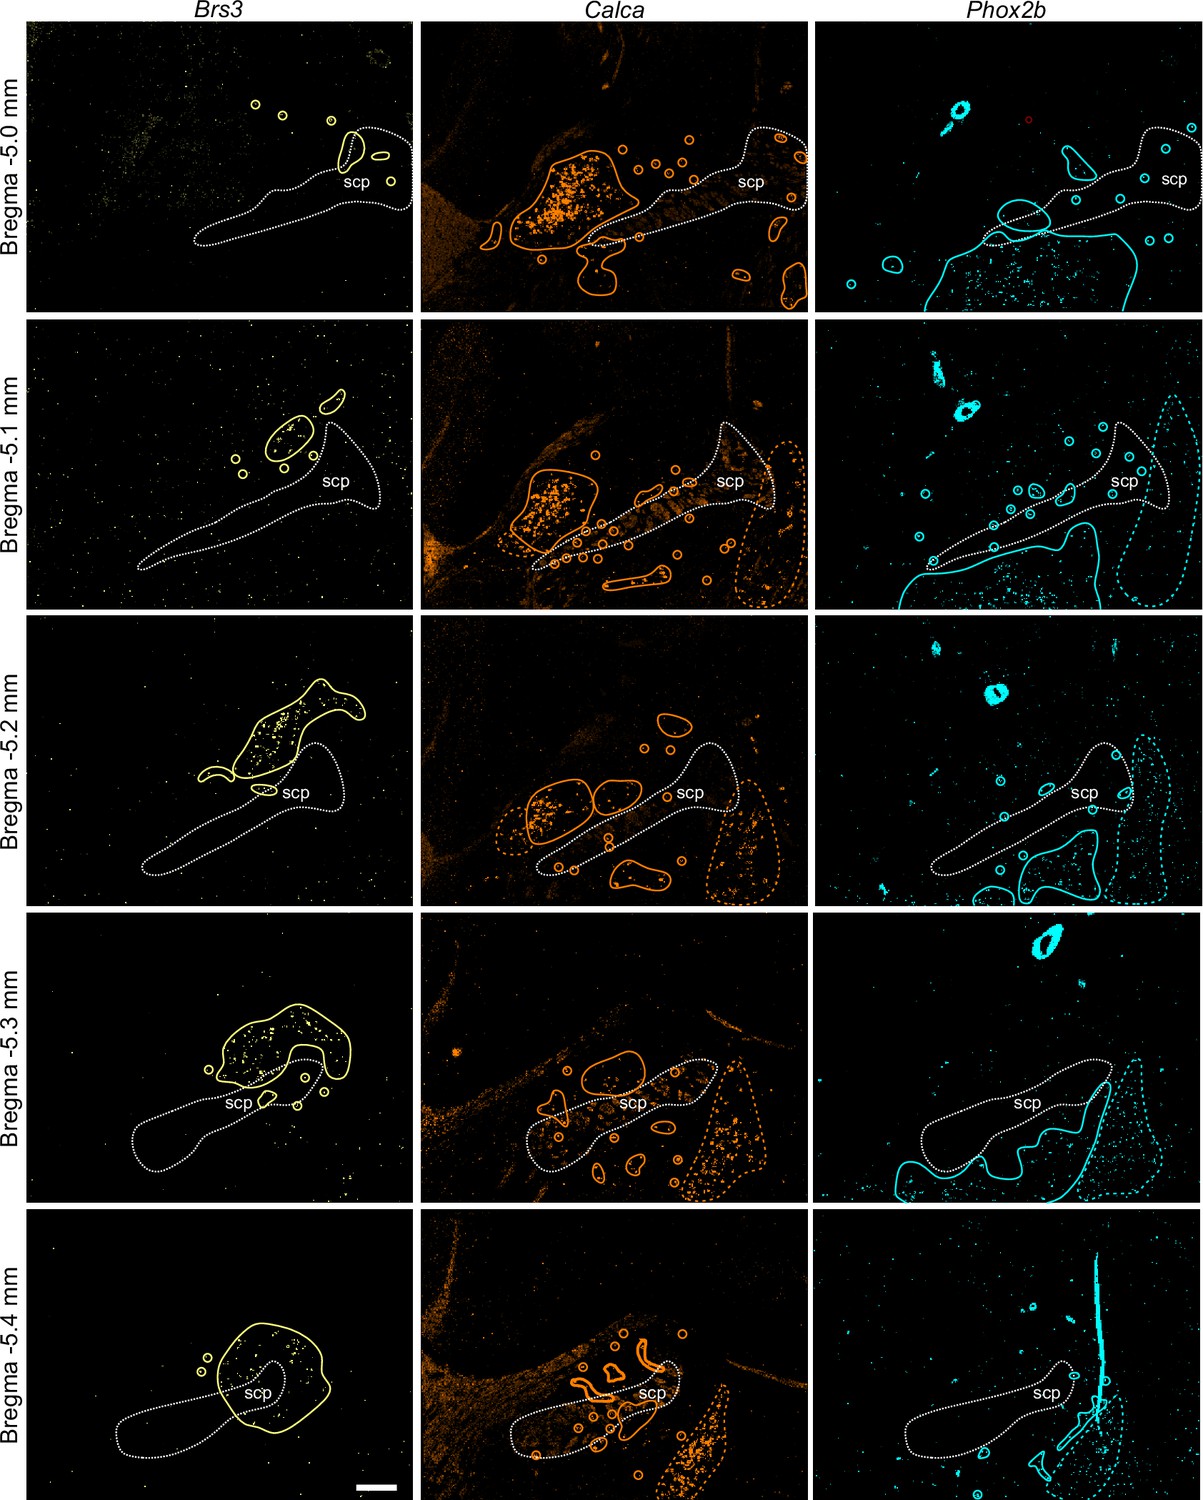
Example of HiPlex staining for Brs3, Calca, and Phox2b for five Bregma levels.
Solid lines surround clusters of positive neurons or individual neurons, colored dashed lines indicate expression outside the parabrachial nucleus, such as in Kölliker-Fuse and locus coeruleus. Scale bar, 200 μm. scp: superior cerebellar peduncle.
Figure 5 with 6 supplements
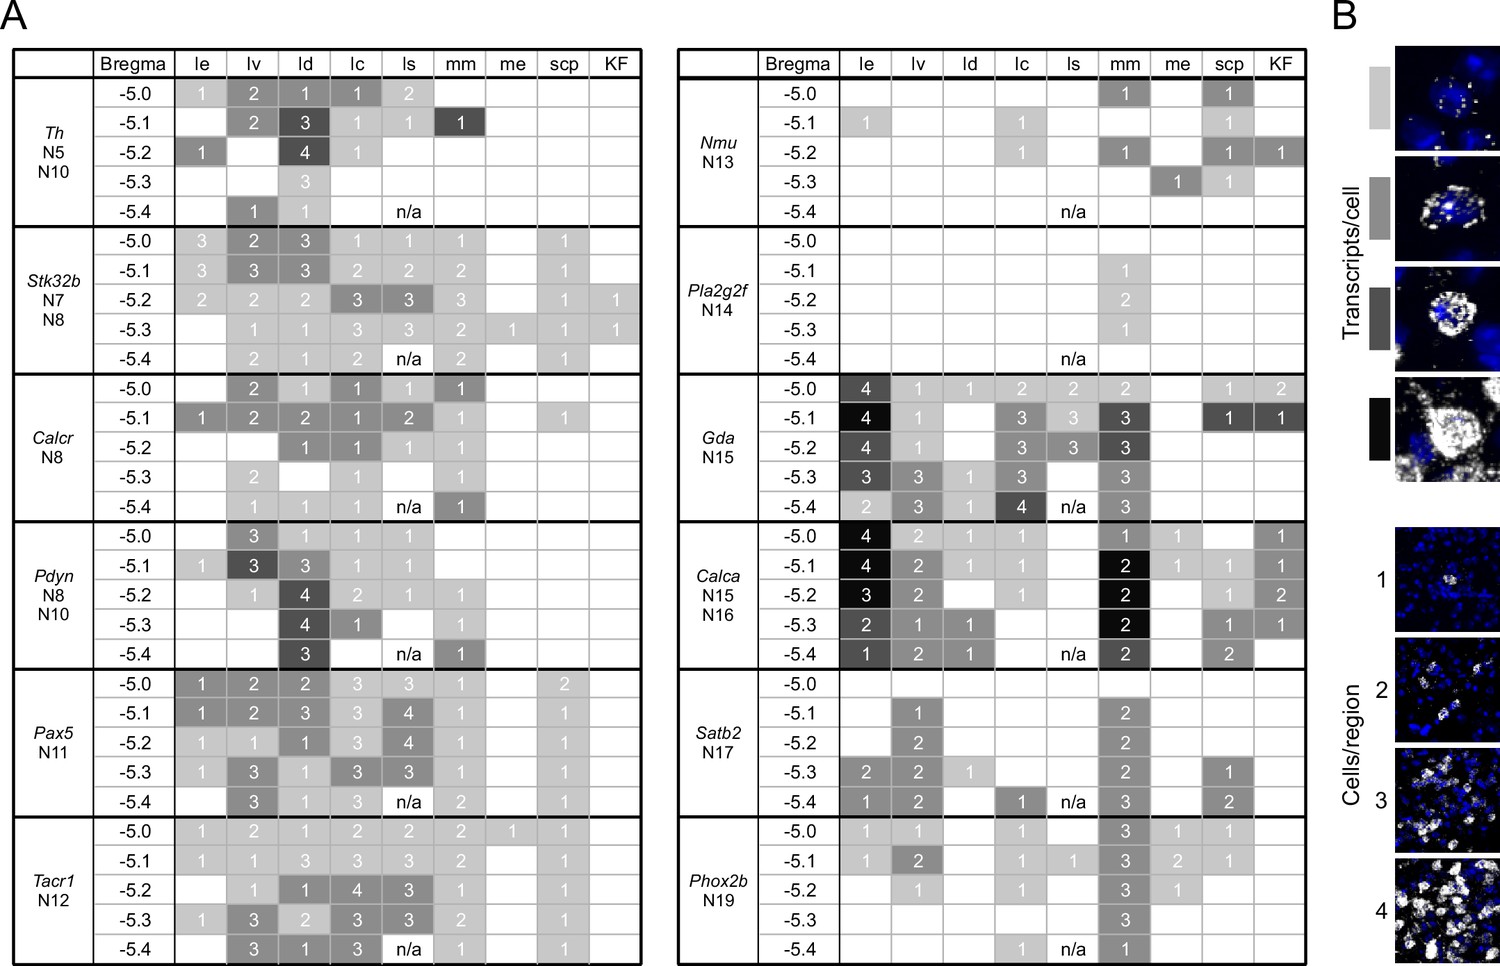
A guide to HiPlex results showing relative strength and abundance of mRNA expression in parabrachial nucleus (PBN) subregions.
(A) Qualitative expression for 12 genes that can be used to identify different subregions in the PBN. Strength of expression and percentage of cells in subregions of the cells were analyzed for five bregma levels. (B) Key for the colors and numbers in the table. Shade of gray gets darker as the number of transcripts per cell increases, and the number represents an estimate of the number of positive cells per subregion. The abbreviations are defined in Figure 4.
Figure 5—figure supplement 1
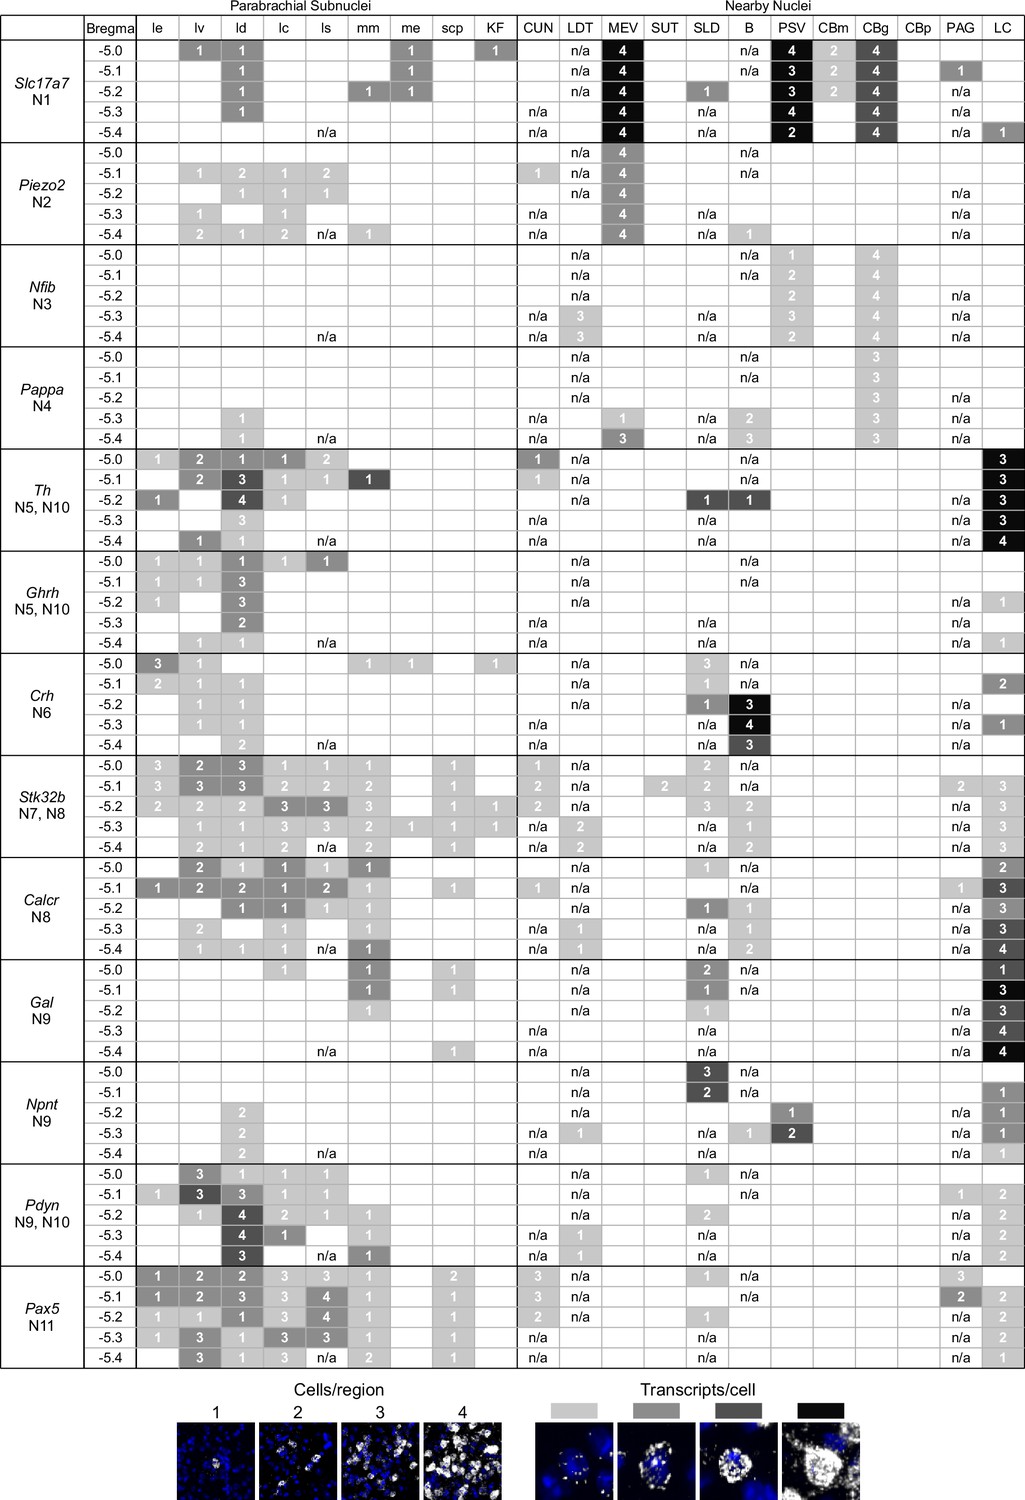
Guide of HiPlex results for all probes with signal in parabrachial nucleus and surrounding area, page 1.
Figure 5—figure supplement 2
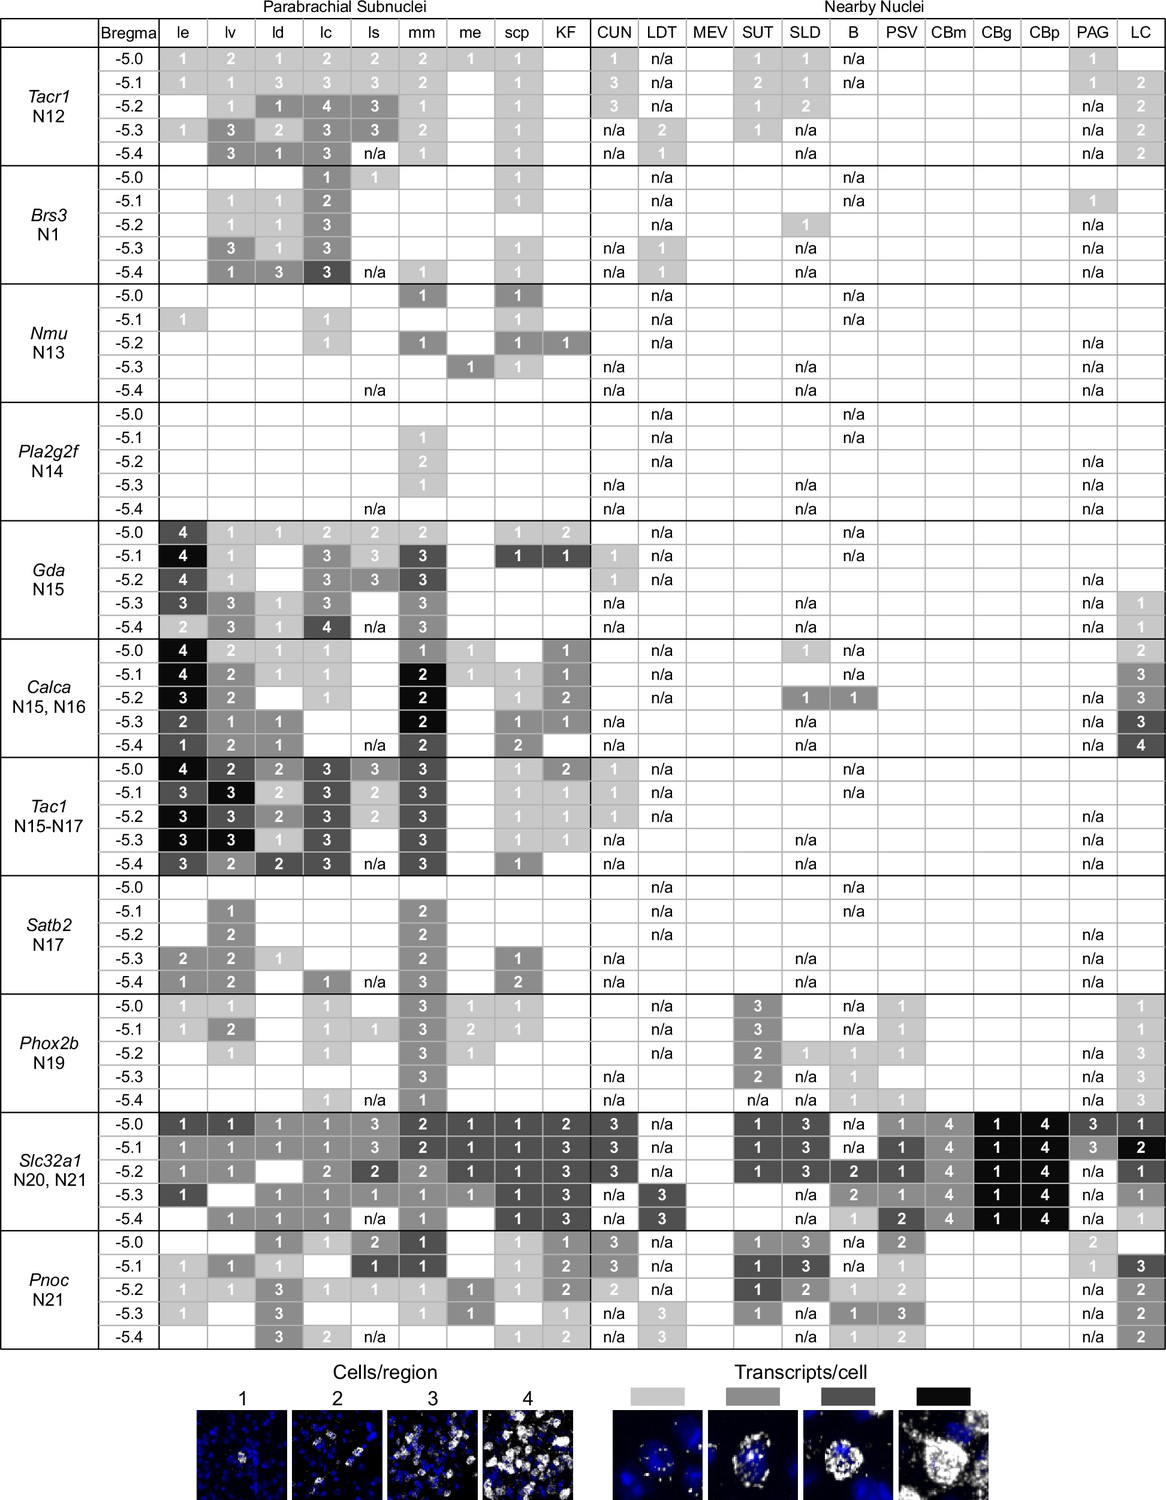
Guide of HiPlex results for all probes with signal in parabrachial nucleus and surrounding area, page 2.
Figure 5—figure supplement 3
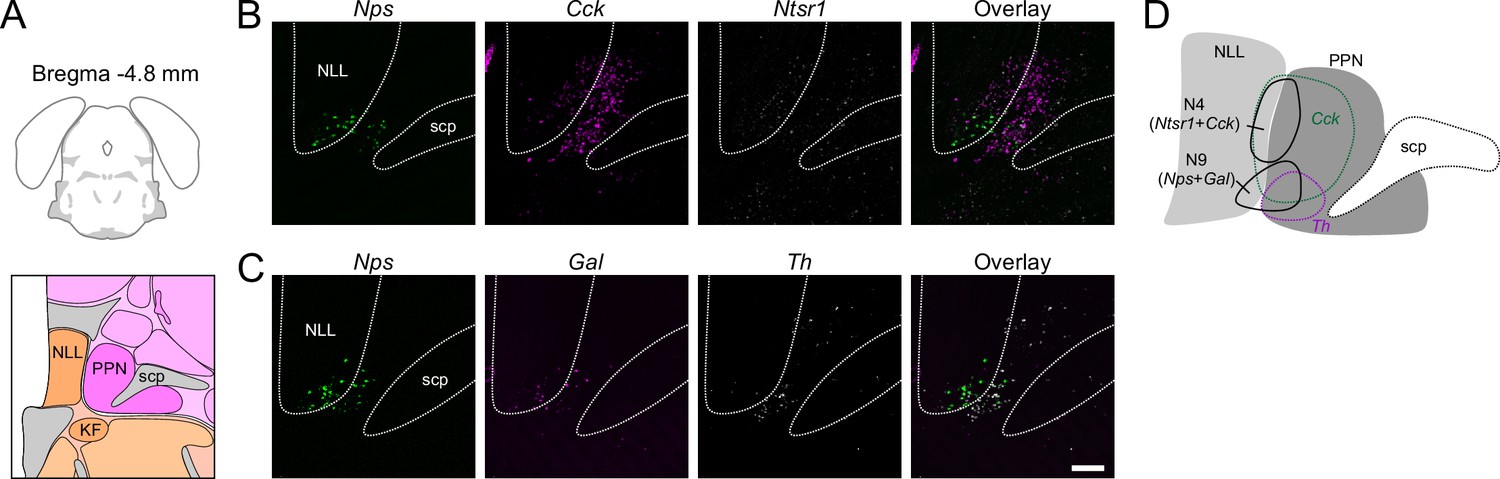
RNAscope for Cck, Gal, Nps, Ntsr1, and Th in far rostral parabrachial nucleus (PBN).
(A) AMBA showing absence of PBN around Bregma –4.8 mm. (B) Ntsr1 co-labels a portion of Cck cells that run into the nucleus of the lateral lemniscus (NLL) and do not overlap with Nps. (C) Gal and Nps are co-expressed in cells ventral to the Ntsr1 population that also runs into the NLL. Th is also present ventrally but does not overlap. (D) Diagram showing approximate location of clusters (N4) and (N9) along with Cck and Th populations in the far rostral PBN region. Scale bar, 200 μm.
Figure 5—figure supplement 4
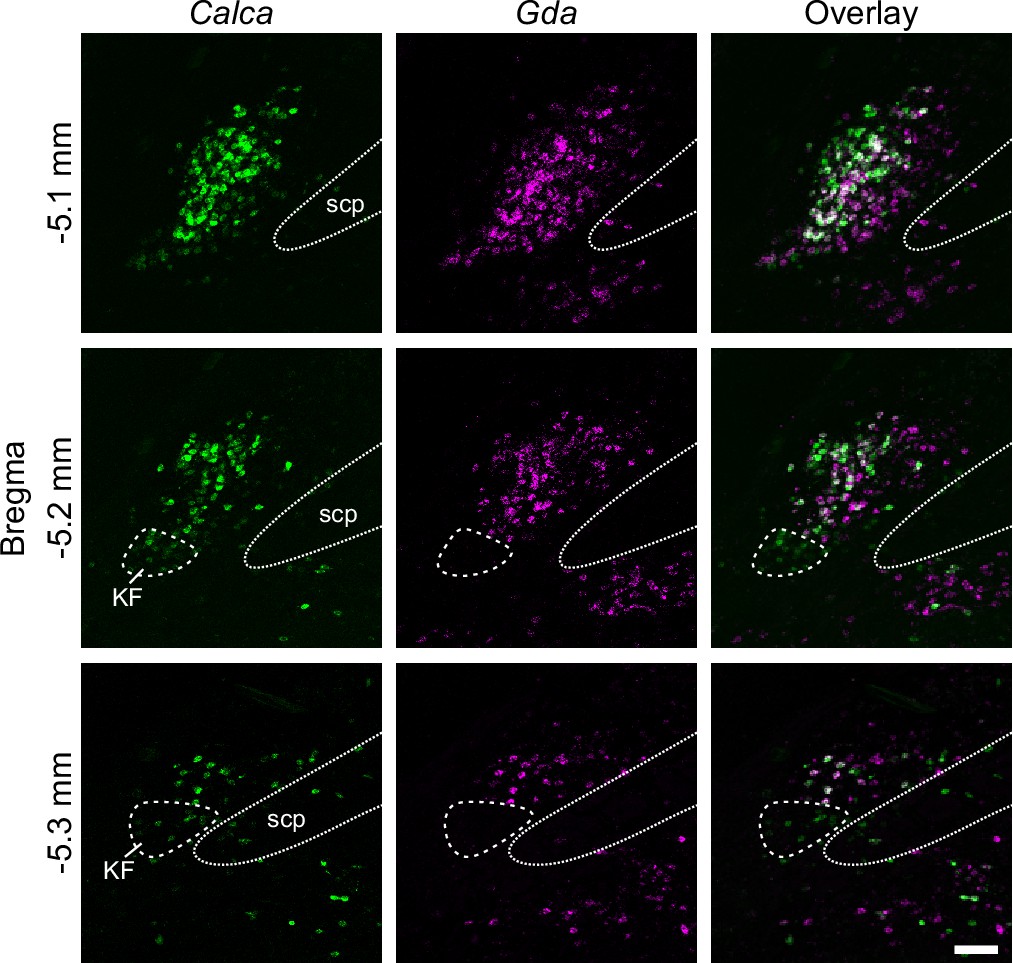
RNAscope for Calca and Gda.
Co-expression represents N15 based on scRNA-Seq data. Calca-only cells that do not express Gda (circled by dashed line) are in the ventral lateral PBle that extends partially into the Kölliker-Fuse (KF) represent (N16). Scale bar, 100 μm. scp: superior cerebellar peduncle.
Figure 5—figure supplement 5
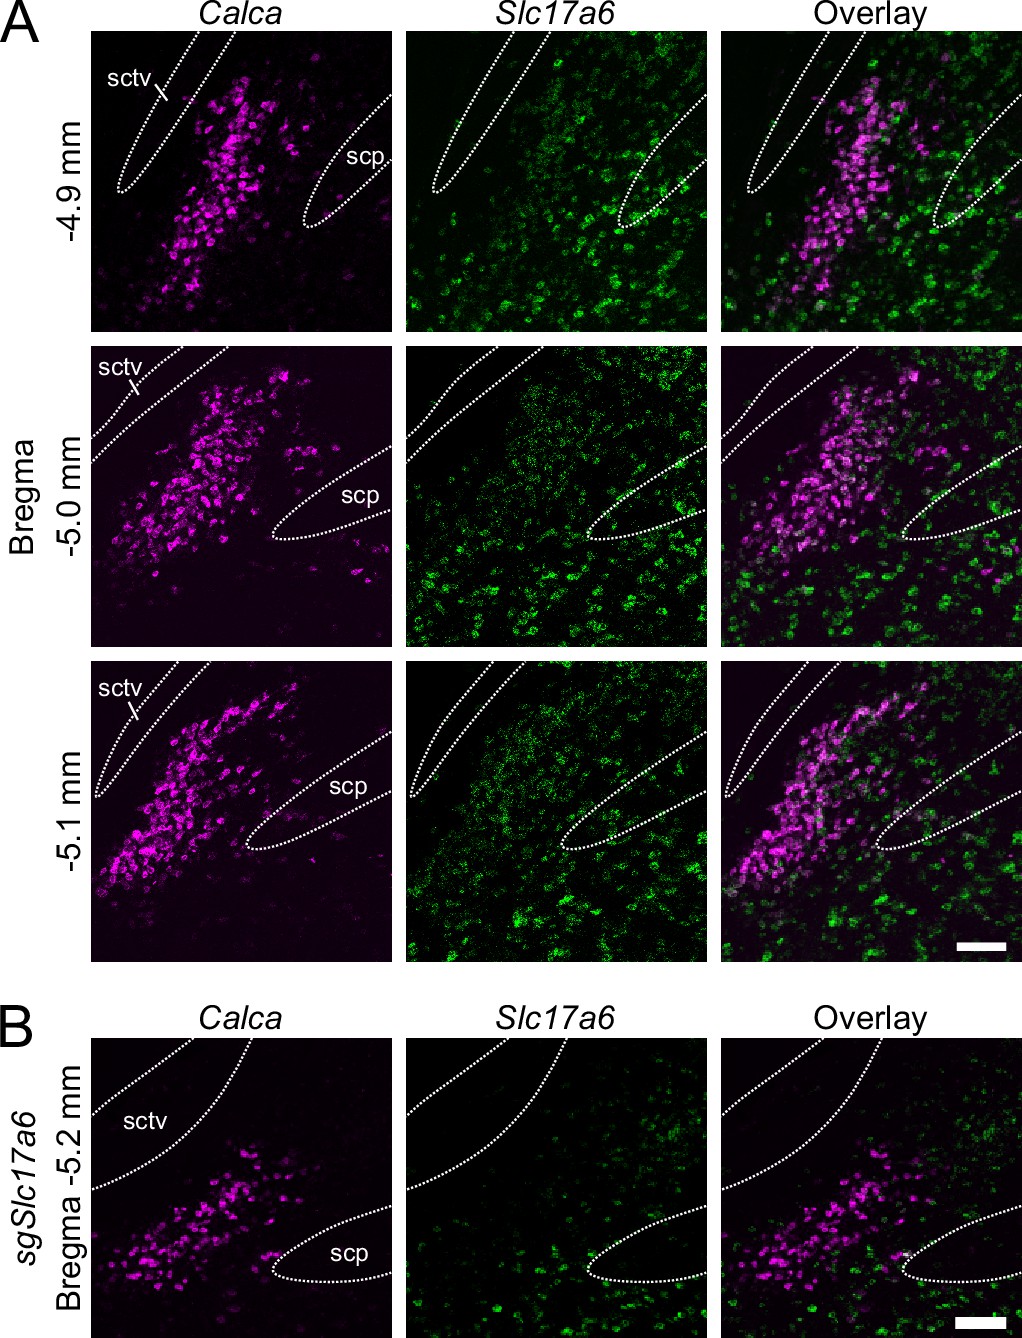
RNAscope for Calca and Slc17a6.
(A) Nearly all Slc17a6-positive cells in the core of PBle also express Calca. Scale bar, 100 μm. (B) After injection of AAV1-DIO-SaCas9 and two guide RNAs targeted to Slc17a6 (sgSlc17a6) into parabrachial nucleus of CalcaCre mice, there are few cells with normal Slc17a6 expression among the Calca neurons. scp: superior cerebellar peduncle, sctv: ventral spinocerebellar tract.
Figure 5—figure supplement 6
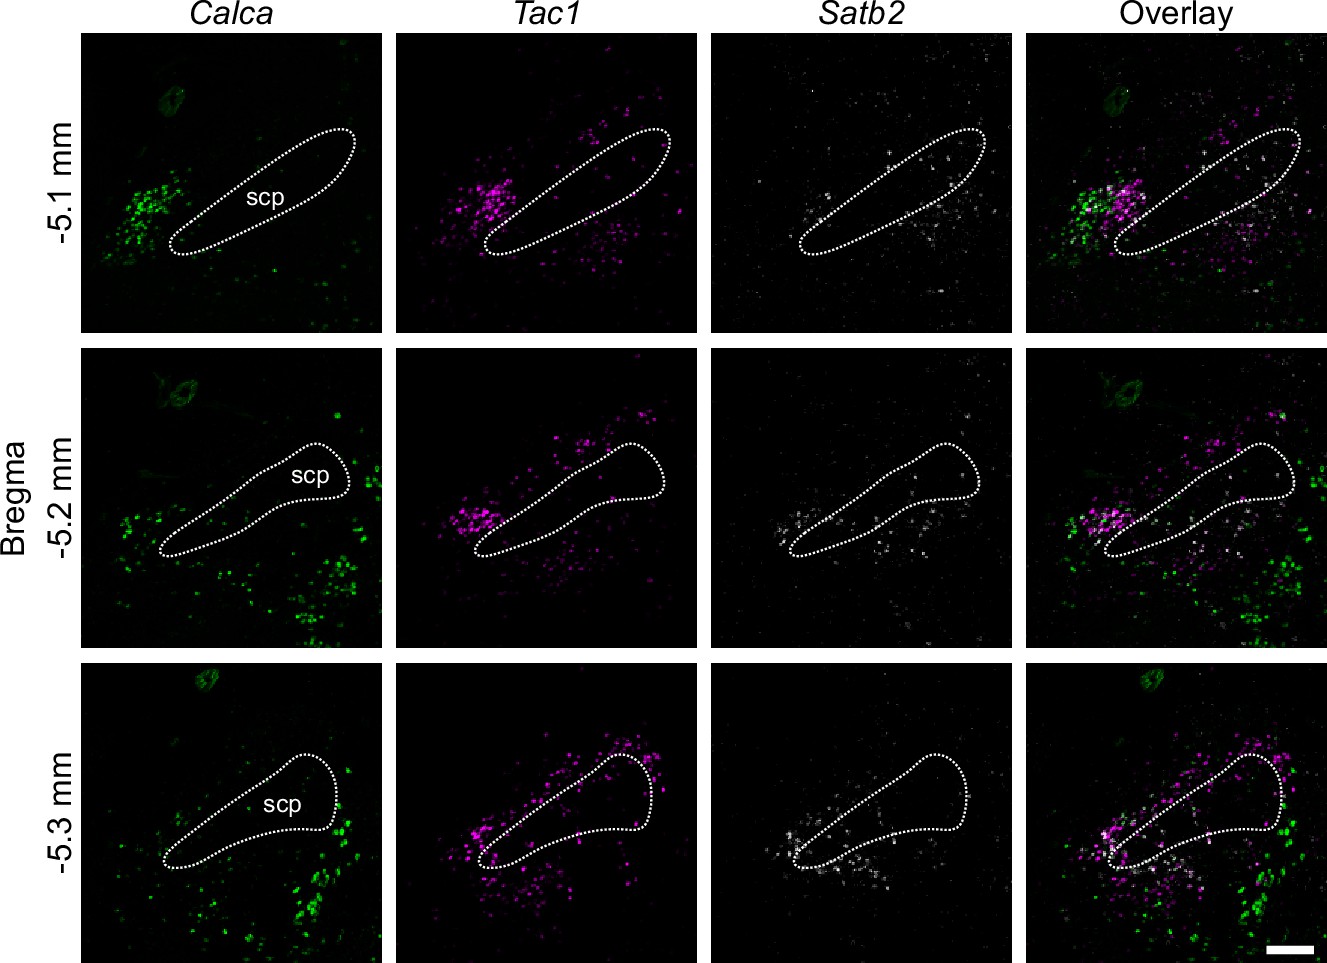
RNAscope for Calca, Satb2, and Tac1.
Difference in expression patterns of Calca, Satb2, and Tac1. Scale bar, 200 μm.
Figure 6
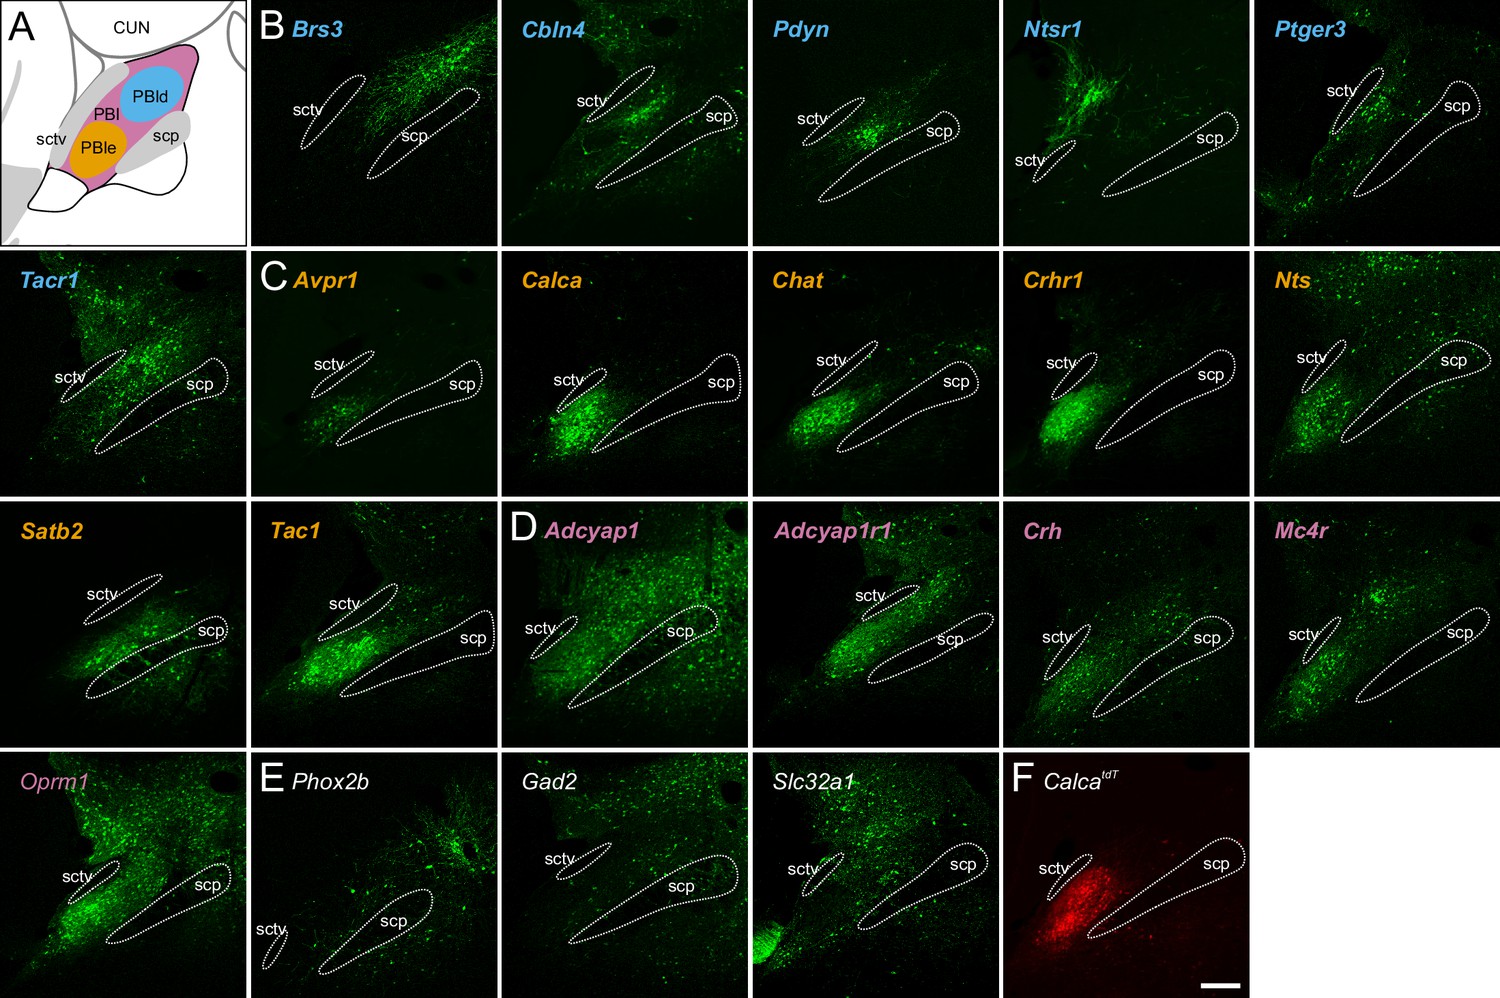
Parabrachial nucleus (PBN) expression in Cre-driver mouse lines.
(A) Schematic of the PBN showing PBle in orange-dotted line, dorsal PBN regions in blue-dotted line, and expression in both in pink. (B) Five Cre-driver lines (blue lettering) with expression primarily in dorsal PBN. (C) Six Cre-driver lines (orange) primarily in PBle. Satb2 is included here because its projection pattern resembles that of this group. (D) Five Cre-driver lines (pink) with expression in several PBN regions. (E) Five Cre-driver lines (gray) with expression patterns that do not fit with the other categories. (F) Image of Calca-tdTomato expression in the PBN for comparison. All images of viral expression are in mid-PBN sections; approximately Bregma –5.2 mm. Scale bar, 200 μm. Source data available at Zenodo DOI: 10.5281/zenodo.6707404 and includes complete TIFF stacks for each of these Cre-drivers and CalcatdT.
Figure 7
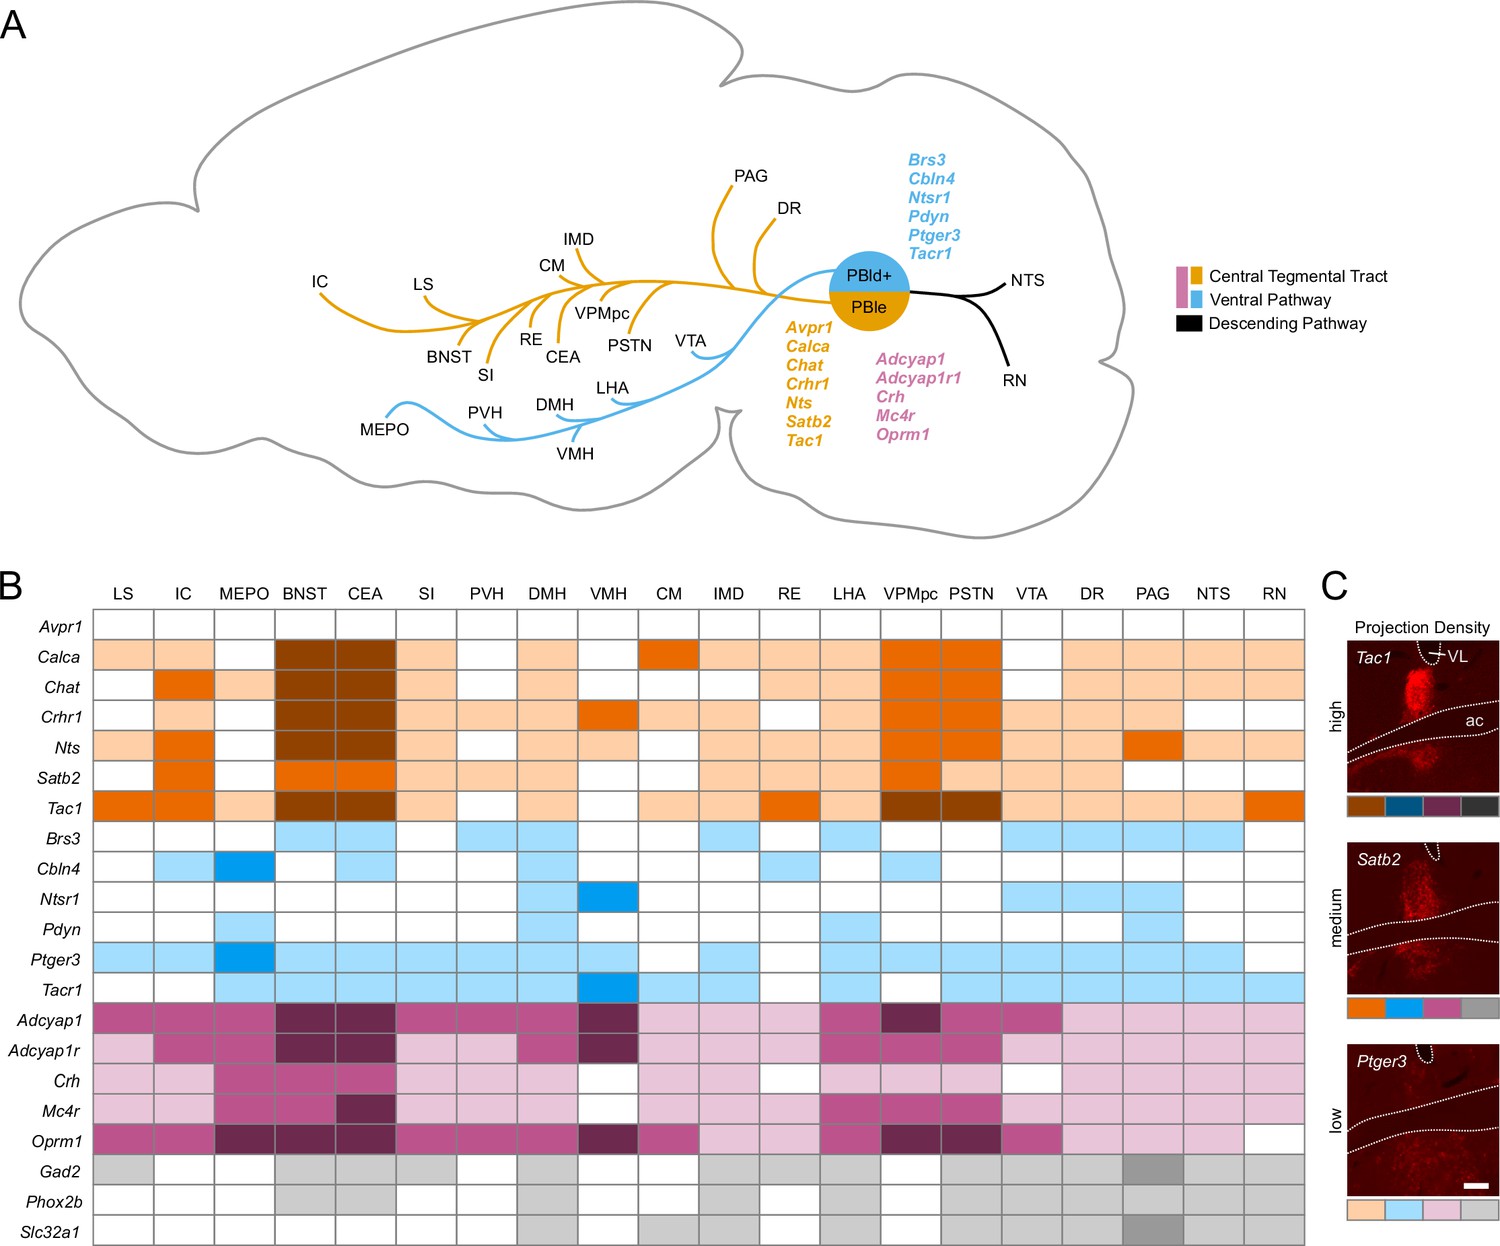
Descending pathways from the parabrachial nucleus (PBN) and surrounding regions and the strength of their projections.
(A) Diagram showing the two main ascending projection pathways from the PBN, adapted from Figure 14 from Huang et al., 2021b. Genes are listed in a matched color with their pathway; pink genes follow both pathways. Many genes from each group have projections into the descending pathway that are not shown. (B) Guide showing approximate density of synaptophysin in a subset of target regions along with their abbreviations. Colors represent the pathways; darker shades indicate denser innervation.
Figure 8
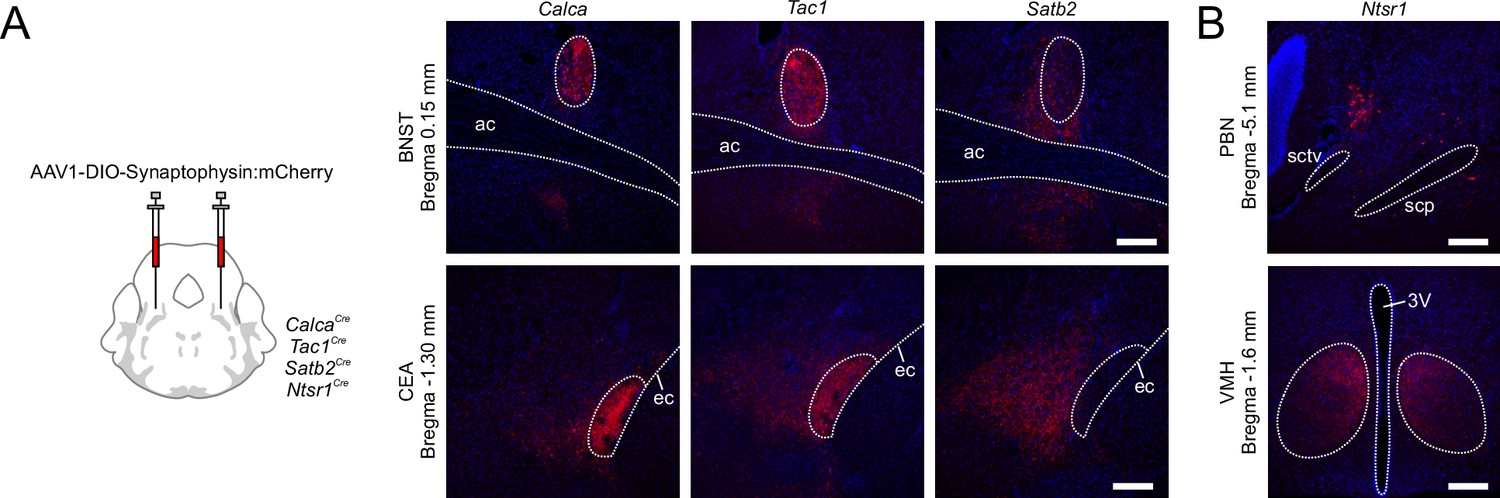
Projection patterns in target brain regions.
(A) Comparison of synaptophysin:mCherry staining in bed nucleus of stria terminalis (BNST) and central nucleus of the amygdala (CEA) for Calca, Tac1, and Satb2 Cre-driver lines. Scale bars, 200 μm. (B) Example of cell body location in nucleus of the lateral lemniscus region adjacent to parabrachial nucleus (PBN) for Ntsr1Cre mice (top); these neurons project almost exclusively to the ventromedial hypothalamus (VMH) (bottom). Scale bars, 200 μm.
Videos
Video 1
Video showing the projection pattern of Calca neurons that reside in the PBN.
Tables
Table 1
Neuropeptides and G-protein-coupled receptors (GPCRs) with restricted expression in the 21 neuronal subclusters.
These data are extracted from Supplementary file 3 and Supplementary file 4.
| Subcluster | Neuropeptide | GPCR receptor |
|---|---|---|
| N1 | -- | -- |
| N2 | -- | Adora2, Gpr156, Gpr157, Gprc5c2, Olfr90, Olfr889, P2ry14* |
| N3 | Apln | Cckbr2, Mc4r3, Mchr12 |
| N4 | Npy2 | Fzd2, Grpr, Ntsr12 |
| N5 | Ghrh2, Nmb2, Nps*2, Pnoc*2 | Olfr552, Qrfpr |
| N6 | Crh* | Lgr5 |
| N7 | Grp*2, Npy2, Prok23 | Chrm12, Fzd7, Fzd82, Mc4r3, Npbwr12, Npy2r, Rxfp3 |
| N8 | Grp*2, Pdyn*2, Prok23 | Calcr3, Cckbr2, Ednra2, Fzd82, Gpr6, Mc3r, Npbwr12 |
| N9 | Gal*, Nps*2 | Chrm12, Ednra2, Mchr12 |
| N10 | Ghrh2, Nmb2, Penk*3, Pdyn*2, Prok23 | Agtr2, Mc4r3 |
| N11 | Edn1, Sct | Calcr3, Ntsr1, Olfr876 |
| N12 | Penk*3 | Brs3, Calcr3, Tacr1* |
| N13 | Nmb2, Nmu | Ptgfr |
| N14 | -- | F2rl22, Gabrb22, Hrh23 |
| N15 | Calca*, Calcb, Gast, Tac1*3 | Avpr1a, F2rl22, Galr1, Hrh23, Npr34 |
| N16 | Calca*, Penk*3, Nts*, Tac1*3 | Cckar, F2rl22, Hrh23, Npr34 |
| N17 | Tac1*3 | Gabrb22, Npr34 |
| N18 | -- | Npr34 |
| N19 | -- | -- |
| N20 | -- | Gprc5c2 |
| N21 | Pnoc*2, Trh | -- |
-
Bold, highly expressed and unique to this subcluster.
-
Bold*, highly expressed in this subcluster but also expressed in others at lower levels.
-
Superscript, number of subclusters with expression.
Table 2
Enrichment of mRNAs for neuropeptides in Calca neurons based on RiboTag experiment.
Enrichment is measured as the ratio of immunoprecipitated (Ippt) to input. Housekeeping and glial mRNAs are included for reference.
| Gene | Input | Ippt | Enrichment | |
|---|---|---|---|---|
| Calca | 373 | 2277 | 6.10 | |
| Nts | 175 | 1013 | 5.78 | |
| Vgf | 300 | 1343 | 4.47 | |
| Cbln2 | 266 | 1138 | 4.27 | |
| Adcyap1 | 923 | 3299 | 3.57 | |
| Tac1 | 243 | 934 | 3.84 | |
| Sst | 1011 | 2583 | 2.55 | |
| Scg2 | 3499 | 7641 | 2.18 | |
| Nucb2 | 266 | 563 | 2.11 | |
| Pnoc | 264 | 549 | 2.07 | |
| Chga | 825 | 1597 | 1.93 | |
| Cartpt | 115 | 189 | 1.64 | |
| Reference genes | ||||
| Gapdh | 3192 | 3583 | 1.12 | Housekeeping |
| Actb (5)* | 8340 | 6640 | 0.80 | Housekeeping |
| Gfap | 1219 | 532 | 0.44 | Astrocytes |
| Mbp (2) | 9395 | 4148 | 0.44 | Oligodendrocytes |
| Aif1 (3) | 1914 | 512 | 0.27 | Microglia |
| S100b | 1330 | 331 | 0.25 | Oligodendrocytes/astrocytes |
-
*
(...) average of n values.
Table 3
Cre-driver lines of mice used in parabrachial nucleus (PBN) studies.
List of mice (and source) that have been used to study PBN expression and projection patterns.
| Cre-driver | Extent of analysis | Source | Identifiers |
|---|---|---|---|
| Adcyap1 | Extensive | This paper | JAX Strain #:030155 |
| Adcyap1r1 | Extensive | This paper | JAX Strain #:035572 |
| Avpr1a | Extensive | This paper | JAX Strain #:035573 |
| Brs3 | Moderate to extensive | This paper; Mogul et al., 2021 | JAX Strain #:030540 |
| Calca | Limited to extensive | This paper; Chen et al., 2018; Bowen et al., 2020; Huang et al., 2021b; Kaur et al., 2017 | JAX Strain #:033168 |
| Cbln4 | Extensive | This paper (previously unpublished; see Methods) | |
| Cck | Limited to extensive | Grady et al., 2020; Yang et al., 2020 | JAX Strain #: 012706 |
| Chat | Extensive | This paper | JAX Strain #: 006410, 031661 |
| Crh | Extensive | This paper | JAX Strain #: 012704 |
| Crhr1 | Extensive | This paper, Sanford et al., 2017 | |
| Esr1 | Limited | Grady et al., 2020 | JAX Strain #: 017913, 031386 |
| Gad2 | Moderate | This paper | JAX Strain #:028867 |
| Ghsr | Limited | Le May et al., 2021 | |
| Mc4r | Extensive | This paper | JAX Strain #: 030759 |
| Nts | Extensive | This paper | JAX Strain #:017525 |
| Ntsr1 | Extensive | This paper (previously unpublished; see Methods) | |
| Oprm1 | Extensive | This paper, Liu et al., 2022 | JAX Strain #:035574 |
| Oxtr | Moderate | Ryan et al., 2017 | JAX Strain #: 030543 |
| Pdyn | Limited to extensive | This paper (previously unpublished; see Methods); Grady et al., 2020; Huang et al., 2021a; Norris et al., 2021 | JAX Strain #: 927958 |
| Penk | Limited | Norris et al., 2021 | JAX Strain #: 025112 |
| Phox2b | Extensive | This paper | JAX Strain #: 016223 |
| Prlr | Limited | Kokay et al., 2018 | |
| Ptger3 | Extensive | This paper | JAX Strain #:035575 |
| Satb2 | Moderate to extensive | This paper; Jarvie et al., 2021; Fu et al., 2019 | JAX Strain #: 030546 |
| Slc17a6 | Moderate to extensive | Chiang et al., 2020; Grady et al., 2020; Huang et al., 2021b | JAX Strain #: 028863 |
| Slc32a1 | Extensive | This paper | JAX Strain #: 028862 |
| Tac1 | Limited to extensive | This paper; Barik et al., 2018 | JAX Strain #: 021877 |
| Tacr1 | Limited to extensive | This paper (previously unpublished; see Methods); Barik et al., 2021; Deng et al., 2020 |
Key resources table
| Reagent type (species) or resource | Designation | Source or reference | Identifiers | Additional information |
|---|---|---|---|---|
| Strain, strain background (Mus musculus) | Refer to Table 3 for sources of all Cre-driver lines of mice. | |||
| Strain, strain background (AAV1) | pAAV1-Ef1ɑ-DIO-YFP | Karl Deisseroth | Addgene Plasmid #27056 RRID:Addgene_27056 | |
| Strain, strain background (AAV1) | pAAV1-Ef1ɑ-DIO-Synaptophysin-mCherry | Roman et al., 2016 | ||
| Antibody | Anti-GFP (chicken polyclonal) | Abcam | Cat#: ab13970 RRID:AB_300798 | 1:10,000 |
| Antibody | Anti-dsRed (rabbit monoclonal) | Takara | Cat#: 632496 RRID:AB_10013483 | 1:1,000 |
| Antibody | Alexa Fluor 488 anti-chicken (donkey monoclonal) | Jackson ImmunoResearch | Cat#: 703-545-155 RRID:AB_2340375 | 1:500 |
| Antibody | Alexa Fluor 494 anti-rabbit (donkey monoclonal) | Jackson ImmunoResearch | Cat#: 711-585-152 RRID:AB_2340621 | 1:500 |
| Commercial assay or kit | RNAscope HiPlex12 Reagents Kit (488, 550, 647) | Advanced Cell Diagnostics | Cat No. 324108 | |
| Commercial assay or kit | RNAscope HiPlex Probe- Mm-Brs3-T2 | Advanced Cell Diagnostics | Cat No. 454111-T2 | |
| Commercial assay or kit | RNAscope HiPlex Probe- Mm-Calcr-T6 | Advanced Cell Diagnostics | Cat No. 494071-T6 | |
| Commercial assay or kit | RNAscope HiPlex Probe- Mm-Crh-T9 | Advanced Cell Diagnostics | Cat No. 316091-T9 | |
| Commercial assay or kit | RNAscope HiPlex Probe- Mm-Fn1-T4 | Advanced Cell Diagnostics | Cat No. 316951-T4 | |
| Commercial assay or kit | RNAscope HiPlex Probe- Mm-Gal-T8 | Advanced Cell Diagnostics | Cat No. 400961-T8 | |
| Commercial assay or kit | RNAscope HiPlex Probe- Mm-Ghrh-T3 | Advanced Cell Diagnostics | Cat No. 470991-T3 | |
| Commercial assay or kit | RNAscope HiPlex Probe- Mm-Nfib-T4 | Advanced Cell Diagnostics | Cat No. 586511-T4 | |
| Commercial assay or kit | RNAscope HiPlex Probe- Mm-Nmu-T5 | Advanced Cell Diagnostics | Cat No. 446831-T5 | |
| Commercial assay or kit | RNAscope HiPlex Probe- Mm-Npnt-T11 | Advanced Cell Diagnostics | Cat No. 316771-T11 | |
| Commercial assay or kit | RNAscope HiPlex Probe- Mm-Pappa-T5 | Advanced Cell Diagnostics | Cat No. 443921-T5 | |
| Commercial assay or kit | RNAscope HiPlex Probe- Mm-Pax5-T6 | Advanced Cell Diagnostics | Cat No. 541761-T6 | |
| Commercial assay or kit | RNAscope HiPlex Probe- Mm-Pdyn-T7 | Advanced Cell Diagnostics | Cat No. 318771-T7 | |
| Commercial assay or kit | RNAscope HiPlex Probe- Mm-Piezo2-O1-T12 | Advanced Cell Diagnostics | Cat No. 500501-T12 | |
| Commercial assay or kit | RNAscope HiPlex Probe- Mm-Pla2g2f-O1-T1 | Advanced Cell Diagnostics | Cat No. 1006331-T1 | |
| Commercial assay or kit | RNAscope HiPlex Probe- Mm-Pnoc-T2 | Advanced Cell Diagnostics | Cat No. 437881-T2 | |
| Commercial assay or kit | RNAscope HiPlex Probe- Mm-Satb2-T10 | Advanced Cell Diagnostics | Cat No. 413261-T10 | |
| Commercial assay or kit | RNAscope HiPlex Probe- Mm-Slc17a7-T3 | Advanced Cell Diagnostics | Cat No. 416631-T3 | |
| Commercial assay or kit | RNAscope HiPlex Probe- Mm-Slc32a1-T1 | Advanced Cell Diagnostics | Cat No. 319191-T1 | |
| Commercial assay or kit | RNAscope HiPlex Probe- Mm-Slc32a1-T8 | Advanced Cell Diagnostics | Cat No. 319191-T8 | |
| Commercial assay or kit | RNAscope HiPlex Probe- Mm-Sostdc1-T12 | Advanced Cell Diagnostics | Cat No. 313151-T12 | |
| Commercial assay or kit | RNAscope HiPlex Probe- Mm-Stk32b-T11 | Advanced Cell Diagnostics | Cat No. 564841-T11 | |
| Commercial assay or kit | RNAscope HiPlex Probe- Mm-Th-T9 | Advanced Cell Diagnostics | Cat No. 317621-T9 | |
| Commercial assay or kit | RNAscope HiPlexUp Reagent | Advanced Cell Diagnostics | Cat No. 324190 | |
| Commercial assay or kit | RNAscope Probe - Mm-Calca-alltv-C2 | Advanced Cell Diagnostics | Cat No. 417961-C2 | |
| Commercial assay or kit | RNAscope Probe - Mm-Cck-C3 | Advanced Cell Diagnostics | Cat No. 402271-C3 | |
| Commercial assay or kit | RNAscope Probe - Mm-Gal-C2 | Advanced Cell Diagnostics | Cat No. 400961-C2 | |
| Commercial assay or kit | RNAscope Probe - Mm-Gda-C3 | Advanced Cell Diagnostics | Cat No. 520531-C3 | |
| Commercial assay or kit | RNAscope Probe - Mm-Nps | Advanced Cell Diagnostics | Cat No. 485201 | |
| Commercial assay or kit | RNAscope Probe – Mm-Ntsr1-C2 | Advanced Cell Diagnostics | Cat No. 422411-C2 | |
| Commercial assay or kit | RNAscope Probe- Mm-Pdyn-C3 | Advanced Cell Diagnostics | Cat No. 318771-C3 | |
| Commercial assay or kit | RNAscope Probe- Mm-Satb2 | Advanced Cell Diagnostics | Cat No. 413261 | |
| Commercial assay or kit | RNAscope Probe - Mm-Slc17a6 | Advanced Cell Diagnostics | Cat No. 319171 | |
| Commercial assay or kit | RNAscope Probe- Mm-Tac1-C3 | Advanced Cell Diagnostics | Cat No. 410351-C3 | |
| Commercial assay or kit | RNAscope Probe- Mm-Th-C3 | Advanced Cell Diagnostics | Cat No. 317621-C3 | |
| Commercial assay or kit | RNAscope Fluorescent Multiplex Reagent Kit | Advanced Cell Diagnostics | Cat No. 320850 | |
| Commercial assay or kit | Chromium Single Cell Controller & Accessory Kit | 10 X Genomics | Cat # 120263 | |
| Commercial assay or kit | Chromium Single Cell 3’ Library and Gel Bead Kit v2 | 10 X Genomics | Cat # 120267 | |
| Commercial assay or kit | Chromium Single Cell A Chip Kit | 10 X Genomics | Cat # 120236 | |
| Commercial assay or kit | Chromium i7 Multiplex Kit | 10 X Genomics | Cat # 120262 | |
| Commercial assay or kit | Dead Cell Removal Kit | Miltenyi Biotec | Cat # 130-090-101 | |
| Commercial assay or kit | Illumina HiSeq | Genewiz | ||
| Commercial assay or kit | SPRIselect | Beckman Coulter | Product No: B23317 | |
| Commercial assay or kit | 4200 TapeStation | Agilent | G2991AA | |
| Commercial assay or kit | High Sensitivity D5000 ScreenTape | Agilent | Part Number: 5067–5592 | |
| Other | Normal donkey serum | Jackson ImmunoResearch | Cat#:017-000-121 RRID:AB_2337258 | See: Materials and Methods Stereotaxic Surgery and Projection Tracing |
| Software, algorithm | RNAscope HiPlex Image Registration Software | Advanced Cell Diagnostics | Cat # 300065 | |
| Software, algorithm | FIJI | ImageJ | RRID: SCR_002285 | |
| Software, algorithm | NeuroInfo | MBF Bioscience | ||
| Software, algorithm | R | https://www.r-project.org/; RRID: SCR_001905 | ||
| Software, algorithm | Seurat v3.1.2 | https://Github.com/JonathanShor/DoubletDetection; RRID:SCR_016341 | ||
| Software, algorithm | bcl2fastq v2.18.0.12 | https://www.illumina.com/; RRID: SCR_015058 | ||
| Software, algorithm | Cell Ranger v3.1.0 | 10 X Genomics; RRID: SCR_017344 | ||
| Software, algorithm | SAMtools v1.10 | https://www.htslib.org/; RRID: SCR_002105 | ||
| Software, algorithm | Python | https://www.python.org/; RRID: SCR_008394 |
Additional files
-
Supplementary file 1
Table denoting the average normalized expression, fraction of cells expressing, and likelihood ratio p-value for every gene in each cluster.
- https://cdn.elifesciences.org/articles/81868/elife-81868-supp1-v2.xlsx
-
Supplementary file 2
Table denoting the average normalized expression, fraction of cells expressing, and likelihood ratio p-value for every gene in each neuronal subcluster.
- https://cdn.elifesciences.org/articles/81868/elife-81868-supp2-v2.xlsx
-
Supplementary file 3
Expression of neuropeptides across neuronal subclusters plotted according to their average normalized expression and fraction of cells expressing each gene.
- https://cdn.elifesciences.org/articles/81868/elife-81868-supp3-v2.pdf
-
Supplementary file 4
Expression of G-protein-coupled receptors across neuronal subclusters plotted according to their average normalized expression and fraction of cells expressing each gene.
- https://cdn.elifesciences.org/articles/81868/elife-81868-supp4-v2.pdf
-
Supplementary file 5
HiPlex data for all probes at five Bregma levels of the parabrachial nucleus.
- https://cdn.elifesciences.org/articles/81868/elife-81868-supp5-v2.pptx
-
Supplementary file 6
Data for Ribotag experiment showing all genes (1) and genes significantly enriched/depleted (p<0.05) sorted by fold change (FC, 2).
- https://cdn.elifesciences.org/articles/81868/elife-81868-supp6-v2.xlsx
-
MDAR checklist
- https://cdn.elifesciences.org/articles/81868/elife-81868-mdarchecklist1-v2.docx
Download links
A two-part list of links to download the article, or parts of the article, in various formats.
Downloads (link to download the article as PDF)
Open citations (links to open the citations from this article in various online reference manager services)
Cite this article (links to download the citations from this article in formats compatible with various reference manager tools)
Molecular and anatomical characterization of parabrachial neurons and their axonal projections
eLife 11:e81868.
https://doi.org/10.7554/eLife.81868


