Critical roles for ‘housekeeping’ nucleases in type III CRISPR-Cas immunity
- Microbiology Department, University of Illinois Urbana-Champaign, United States
Figures
Figure 1 with 1 supplement
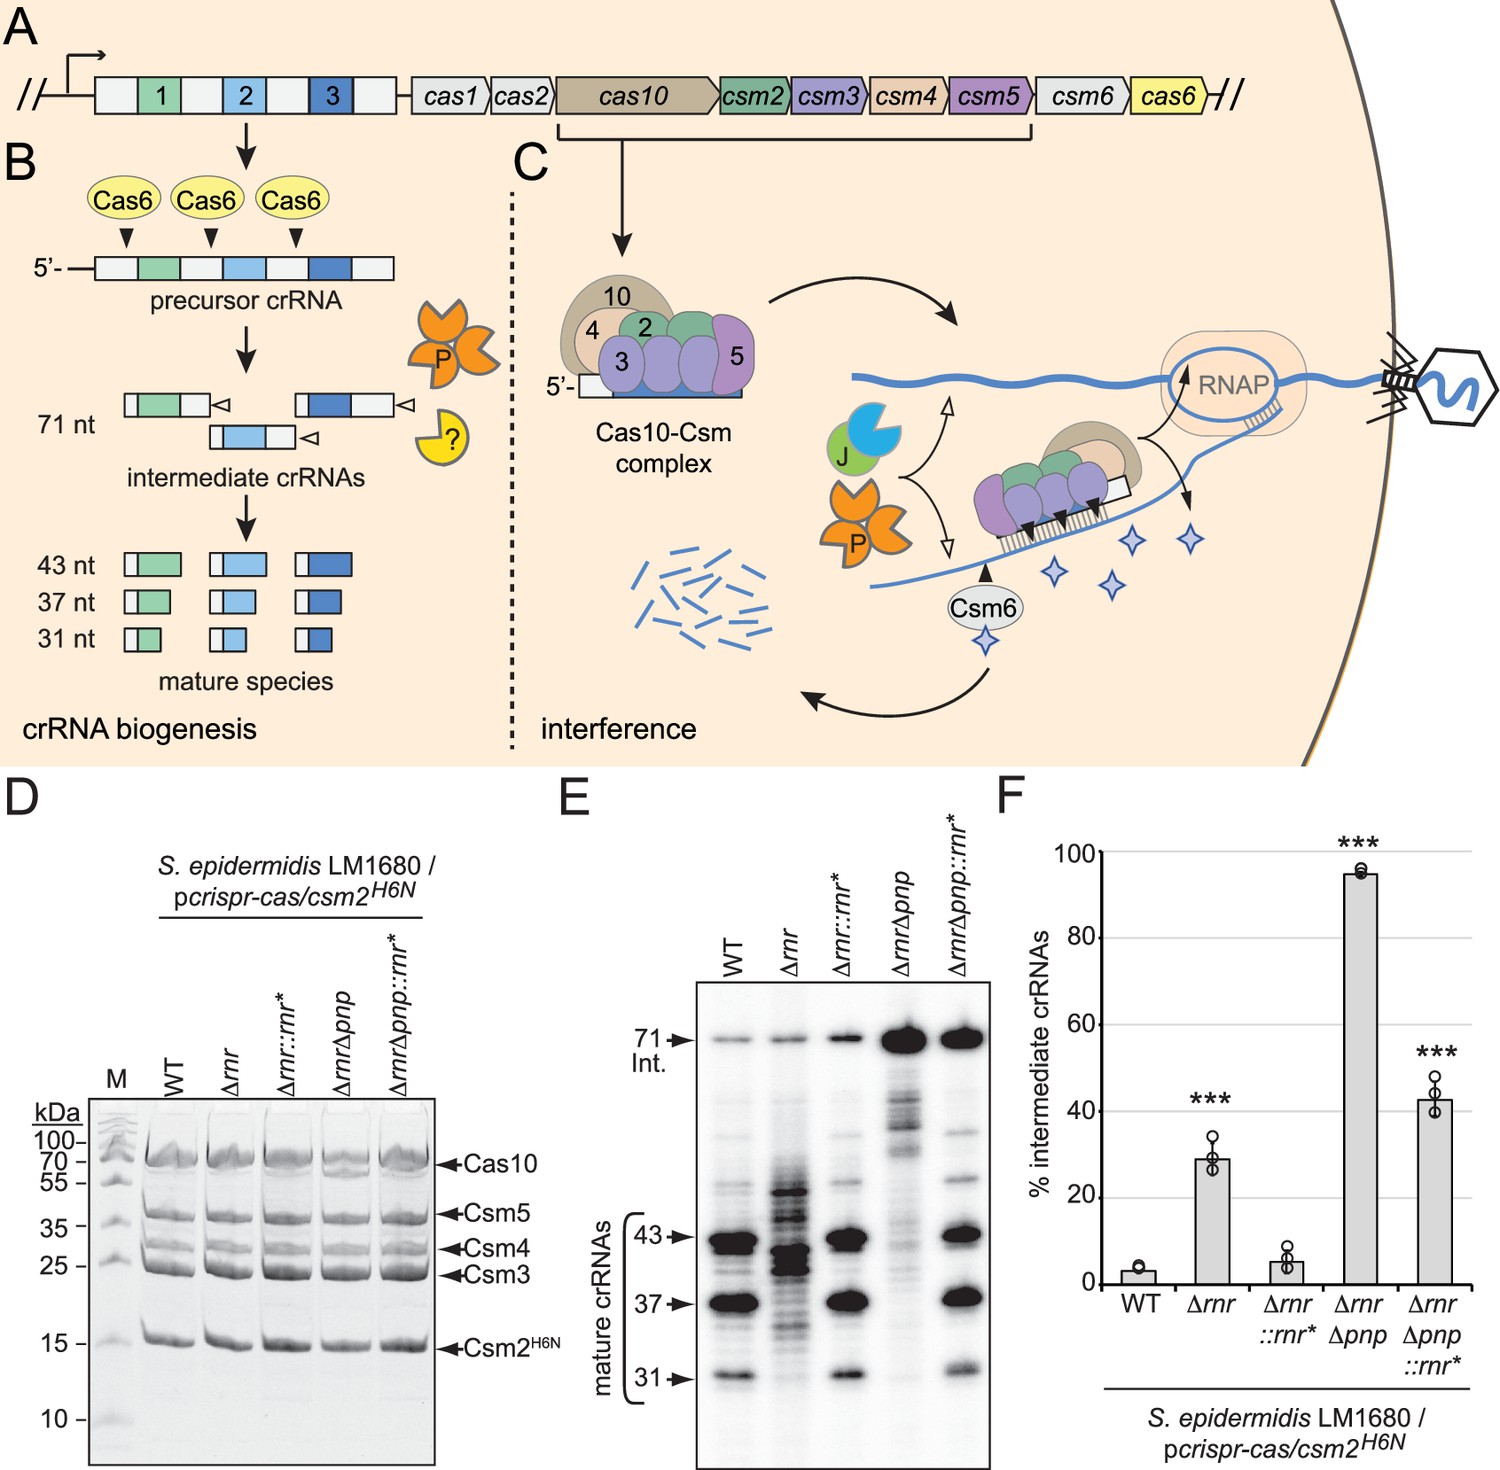
RNase R and PNPase are necessary for crRNA maturation in the cell.
(A) The type III-A CRISPR-Cas system (herein referred to as CRISPR-Cas10) in S. epidermidis RP62a encodes three spacers (colored squares), four repeats (light gray squares), and nine CRISPR-associated (cas and csm) genes (colored pentagons). (B) During crRNA biogenesis, the repeat-spacer array is transcribed into a precursor crRNA and processed into mature species in two steps. In the first step, the endoribonuclease Cas6 cleaves within repeat sequences to generate intermediate crRNAs of 71 nt in length. In the second step, intermediates are trimmed on their 3′-ends by PNPase and other unknown nuclease(s), which are the subject of this study. These activities generate mature crRNAs that range from 43 to 31 nt in length. (C) Mature crRNAs associate with Cas10, Csm2, Csm3, Csm4, and Csm5 in various stoichiometries to form the Cas10-Csm effector complex. Interference is initiated when the effector complex binds to invading transcripts that bear complementarity to the crRNA. During interference, invading DNA and RNA are degraded by CRISPR-associated (Cas) and non-Cas nucleases (see text for details). Filled triangles illustrate events catalyzed by Cas enzymes, and open triangles illustrate events catalyzed by non-Cas nucleases. P, PNPase; J, RNase J1/J2; RNAP, RNA polymerase. Purple stars represent cyclic oligoadenylate molecules produced by Cas10. (D) Cas10-Csm complexes extracted from indicated S. epidermidis LM1680 strains bearing pcrispr-cas/csm2H6N are shown. The plasmid pcrispr-cas contains the entire CRISPR-Cas10 system with a 6-His tag on the N-terminus of Csm2. Whole-cell lysates from indicated strains were subjected to Ni2+ affinity chromatography, and purified complexes were resolved in an SDS-PAGE gel and visualized with Coomassie G-250 staining. M, denaturing protein marker; kDa, kilodalton. See Figure 1—source data 1. (E) Total crRNAs associated with Cas10-Csm complexes in panel (D) are shown. Complex-bound crRNAs were extracted from complexes, radiolabeled at their 5′-ends, and resolved on a denaturing gel. See Figure 1—source data 2. (F) Fractions of complex-bound intermediate crRNAs relative to total crRNAs are shown for indicated strains. The percent intermediate crRNAs represents the ratio of the intermediate (71 nt) band density to the sum of band densities of the major crRNA species (71, 43, 37, and 31 nt). Data shown represents an average of three independent trials (± S.D). A two-tailed t-test was performed to determine significance and *** indicates p<0.0005. See Figure 1—source data 3.
-
Figure 1—source data 1
Raw uncropped image for panel D.
- https://cdn.elifesciences.org/articles/81897/elife-81897-fig1-data1-v2.zip
-
Figure 1—source data 2
Raw uncropped image for panel E.
- https://cdn.elifesciences.org/articles/81897/elife-81897-fig1-data2-v2.zip
-
Figure 1—source data 3
Percent intermediate crRNAs for individual replicates in panel F.
- https://cdn.elifesciences.org/articles/81897/elife-81897-fig1-data3-v2.xlsx
Figure 1—figure supplement 1
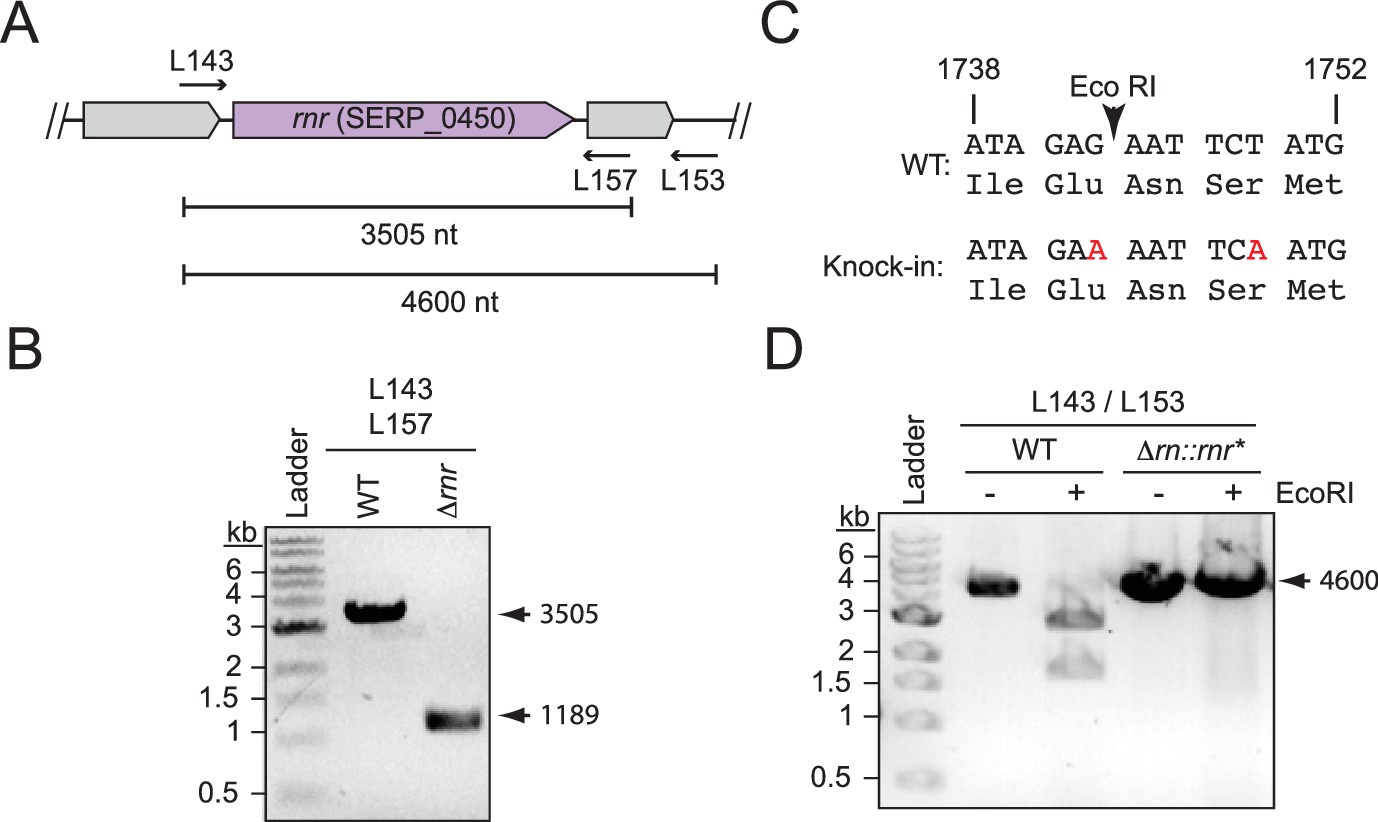
Confirmation of rnr knock-out and knock-in S. epidermidis strains.
(A) Illustration of the rnr genomic locus and corresponding primers used to amplify the gene (see Supplementary file 2 for primer sequences). (B) PCR products of rnr region from representative S. epidermidis WT and knock-out strains are shown. The rnr gene was deleted using the pKOR1 allelic replacement system (Bae and Schneewind, 2006). Following mutagenesis, the rnr deletion was confirmed by PCR amplification of the genomic locus with primers L143/L157 and sequencing the PCR product. See Figure 1—figure supplement 1—source data 1. (C) A segment of the coding region of rnr into which two silent mutations were introduced (red nucleotides) to distinguish the knock-in strain from wild-type. The two silent mutations in rnr gene (rnr*) remove a native EcoRI restriction site naturally found within rnr gene. The rnr* variant was replaced into its original genetic locus in knockout strains using the pKOR1 allelic replacement system (Bae and Schneewind, 2006). (D) PCR products of rnr region from representative S. epidermidis wild-type and knock-in strains are shown. Following mutagenesis, rnr* was confirmed by PCR amplifying genomic DNA with primers L143/L153, and digesting PCR products with EcoRI restriction enzyme, and sequencing the PCR product. kb, kilobase. See Figure 1—figure supplement 1—source data 2.
-
Figure 1—figure supplement 1—source data 1
Raw uncropped image for panel B.
- https://cdn.elifesciences.org/articles/81897/elife-81897-fig1-figsupp1-data1-v2.zip
-
Figure 1—figure supplement 1—source data 2
Raw uncropped image for panel D.
- https://cdn.elifesciences.org/articles/81897/elife-81897-fig1-figsupp1-data2-v2.zip
Figure 2 with 1 supplement
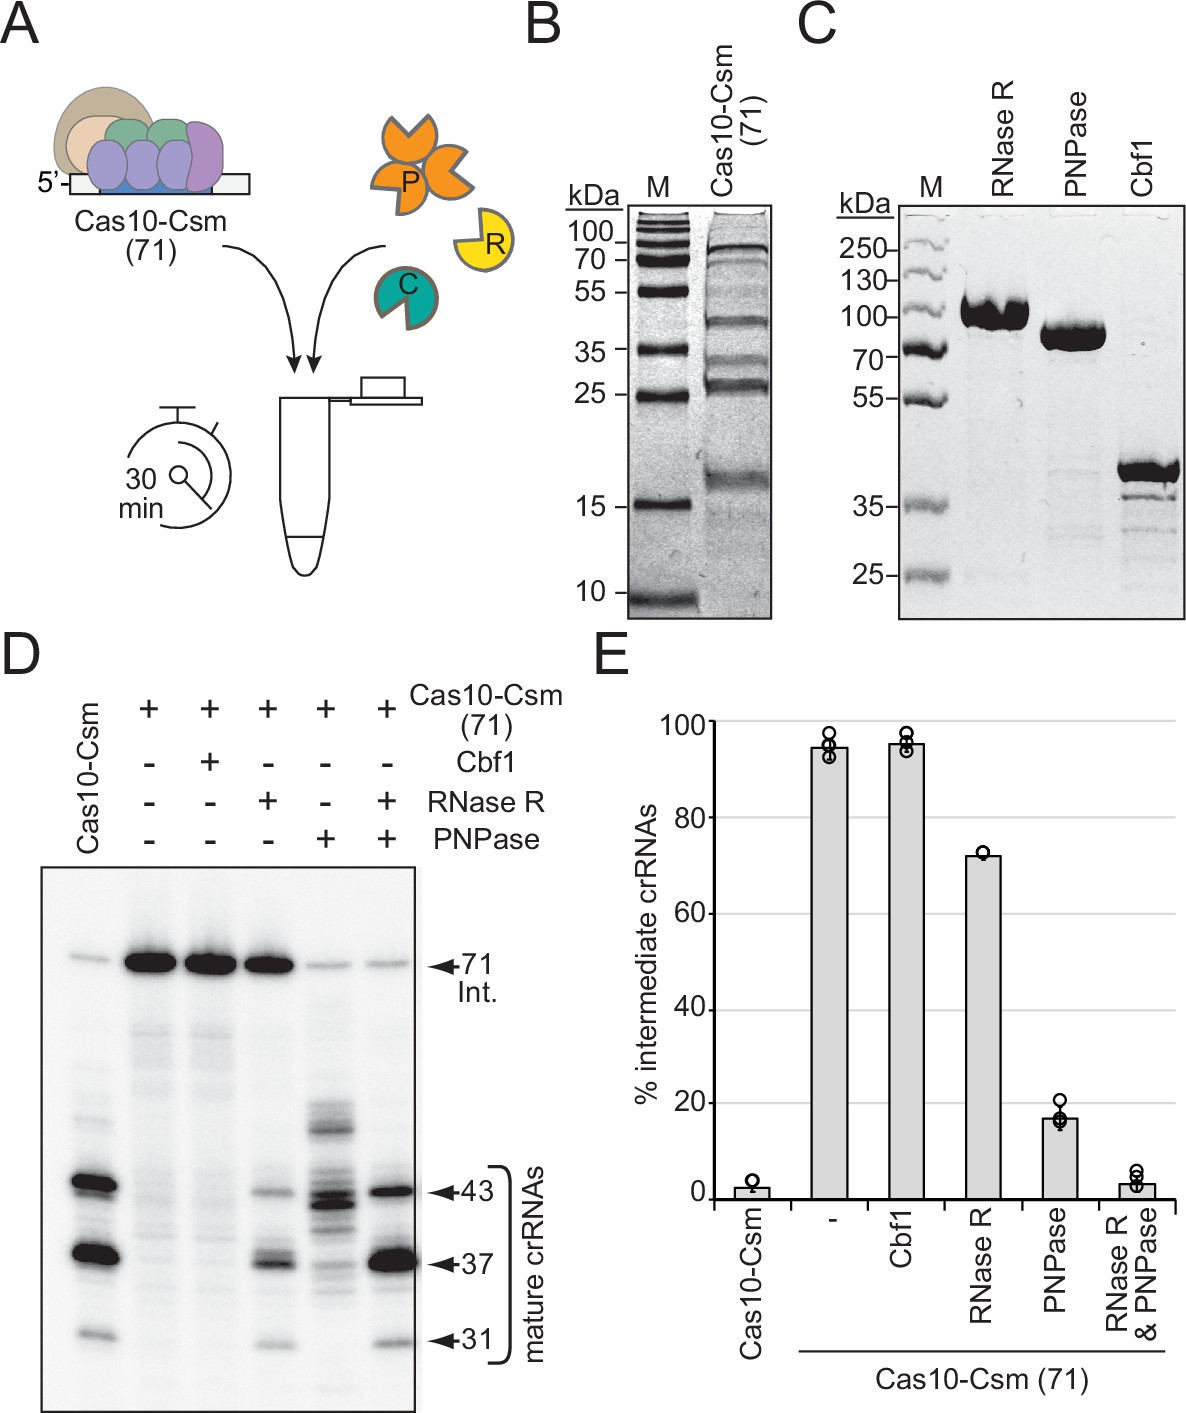
RNase R and PNPase are sufficient to complete crRNA maturation in a purified system.
(A) Illustration of experimental flow of the crRNA maturation nuclease assay. P, PNPase; R, RNase R; C, Cbf1; Cas10-Csm (71), Cas10-Csm complexes purified from S. epidermidis LM1680ΔpnpΔrnr. (B) Purified Cas10-Csm (71) complexes used in this assay. See Figure 2—source data 1. M, denaturing protein marker. kDa, kilodalton. (C) Purified recombinant exonucleases RNase R, PNPase, and Cbf1 used in this assay. See Figure 2—source data 2. (D) Cas10-Csm (71) complexes were incubated with indicated nucleases for 30 min at 37°C. After digestion, crRNAs were extracted from the complexes, radiolabeled at their 5′-ends, and resolved on a denaturing gel. The leftmost lane shows crRNAs extracted from Cas10-Csm complexes purified from WT cells as a control. See also Figure 2—figure supplement 1 and Figure 2—source data 3. (E) Quantification of complex-bound intermediate crRNAs (relative to total crRNAs) following crRNA maturation assays. The data represent an average of 2–4 independent trials (± S.D). See Figure 2—source data 4.
-
Figure 2—source data 1
Raw uncropped image for panel B.
- https://cdn.elifesciences.org/articles/81897/elife-81897-fig2-data1-v2.zip
-
Figure 2—source data 2
Raw uncropped image for panel C.
- https://cdn.elifesciences.org/articles/81897/elife-81897-fig2-data2-v2.zip
-
Figure 2—source data 3
Raw uncropped image for panel D.
- https://cdn.elifesciences.org/articles/81897/elife-81897-fig2-data3-v2.zip
-
Figure 2—source data 4
Percent intermediate crRNAs for individual replicates in panel E.
- https://cdn.elifesciences.org/articles/81897/elife-81897-fig2-data4-v2.xlsx
Figure 2—figure supplement 1
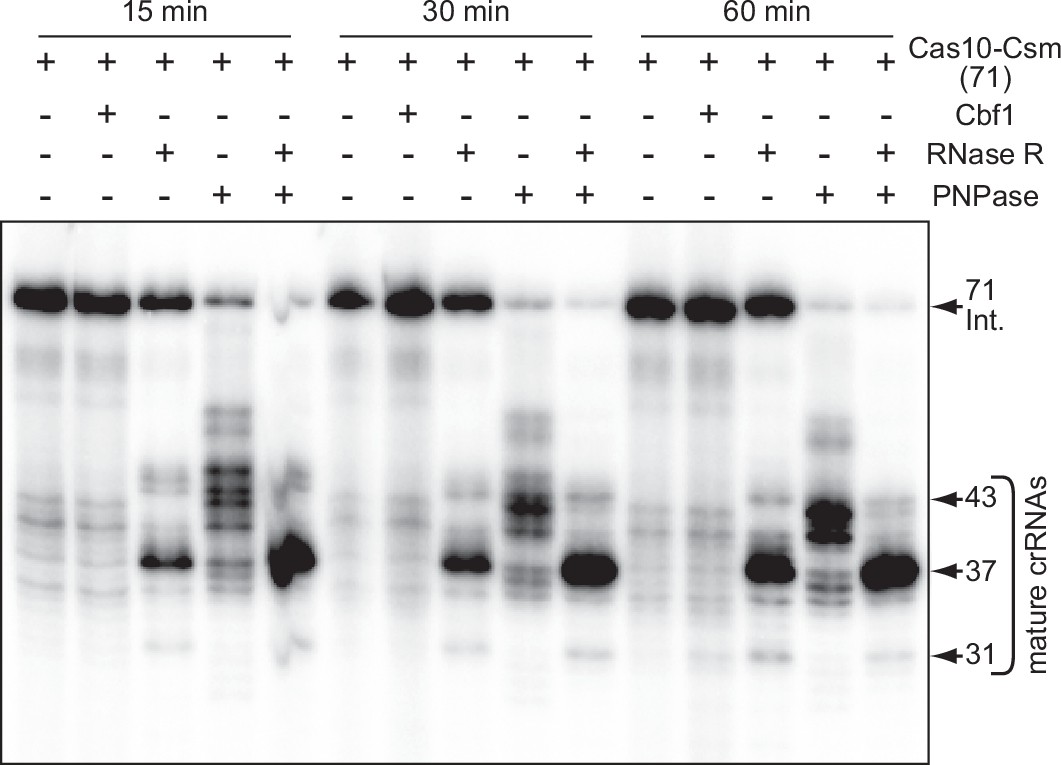
RNase R alone cannot complete crRNA maturation in a purified system.
Total crRNAs associated with purified Cas10-Csm (71) complexes are shown after digestion with indicated nucleases for different timepoints (15, 30, and 60 min). CrRNAs were extracted using TRIzol Reagent, radiolabeled at their 5′-ends, and resolved on a denaturing gel. The gel shown is a representative of two independent trials. See Figure 2—figure supplement 1—source data 1.
-
Figure 2—figure supplement 1—source data 1
Raw uncropped image.
- https://cdn.elifesciences.org/articles/81897/elife-81897-fig2-figsupp1-data1-v2.zip
Figure 3 with 2 supplements
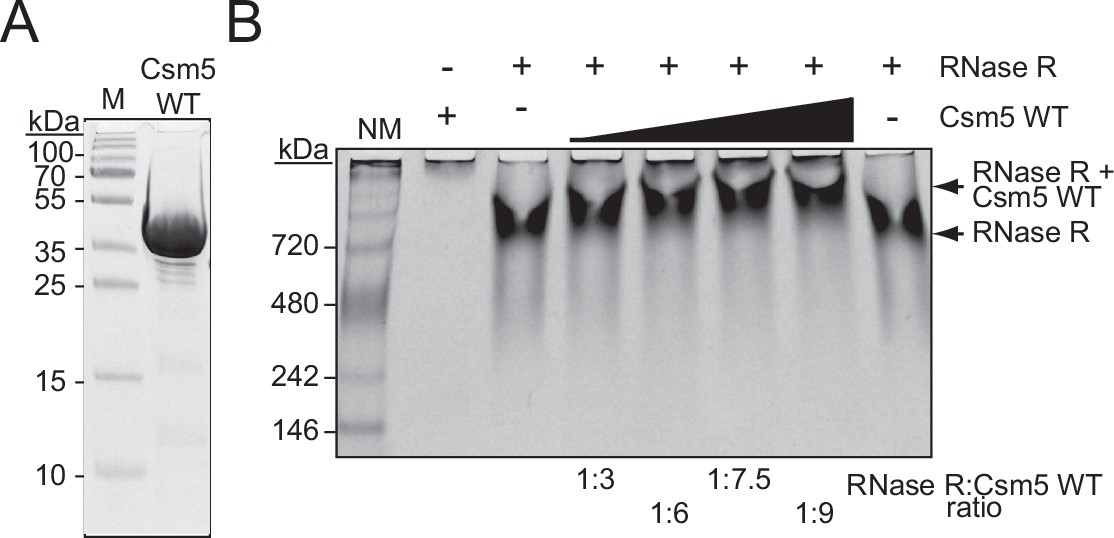
Csm5 interacts with RNase R.
(A) Purified recombinant WT Csm5 is shown. The protein was resolved in an SDS-PAGE gel and visualized using Coomassie G-250 staining. M, denaturing protein marker; kDa, kilodalton. See Figure 3—source data 1. (B) Native gel showing RNase R resolved with increasing proportions of Csm5 WT. Shown is a representative of three independent trials. NM, native protein marker. See also Figure 3—figure supplement 1, Figure 3—figure supplement 2, and Figure 3—source data 2.
-
Figure 3—source data 1
Raw uncropped image for panel A.
- https://cdn.elifesciences.org/articles/81897/elife-81897-fig3-data1-v2.zip
-
Figure 3—source data 2
Raw uncropped image for panel B.
- https://cdn.elifesciences.org/articles/81897/elife-81897-fig3-data2-v2.zip
Figure 3—figure supplement 1
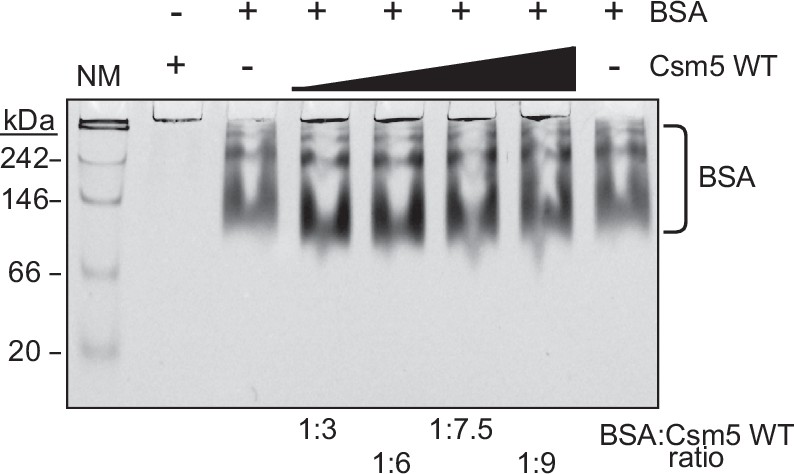
Csm5 does not interact with bovine serum albumin (BSA).
Shown is a native gel in which BSA was resolved alone or with increasing concentrations of Csm5 WT. The gel shown is a representative of three independent trials. NM, native protein marker; kDa, kilodalton. See Figure 3—figure supplement 1—source data 1.
-
Figure 3—figure supplement 1—source data 1
Raw uncropped image.
- https://cdn.elifesciences.org/articles/81897/elife-81897-fig3-figsupp1-data1-v2.zip
Figure 3—figure supplement 2
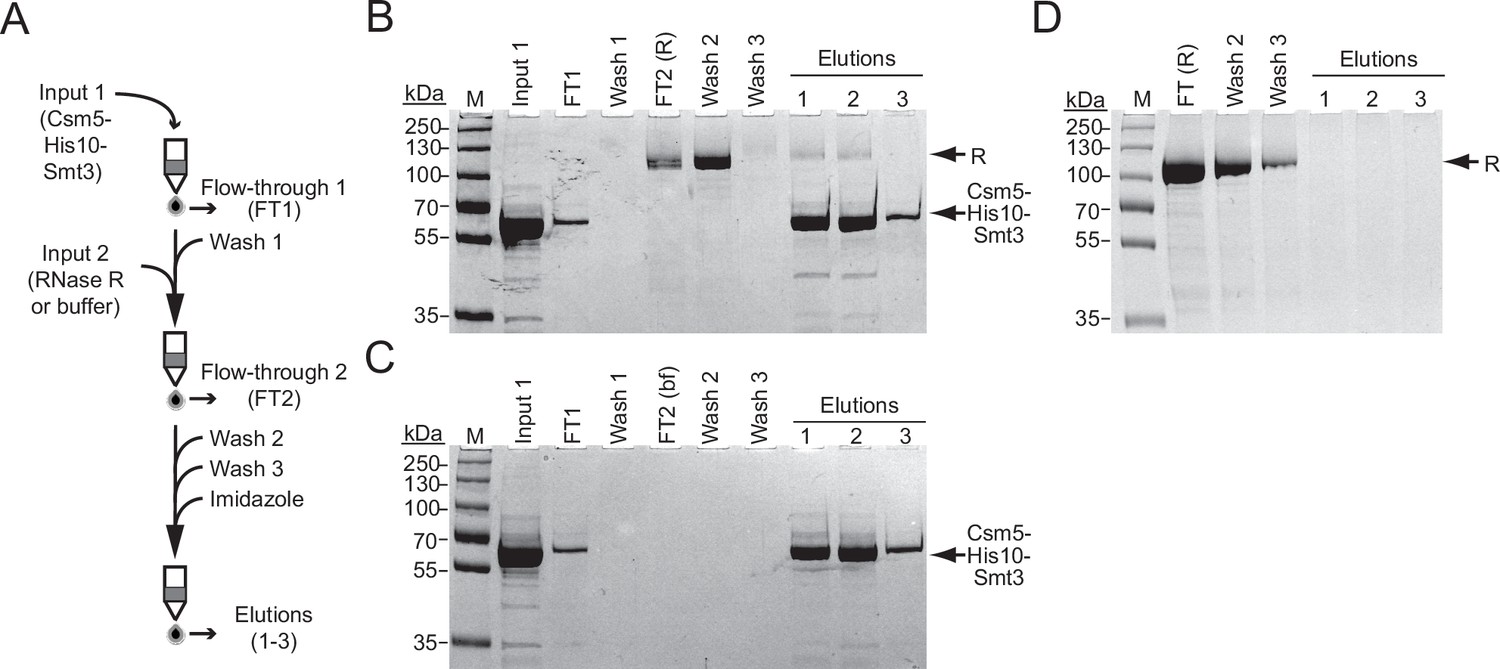
Csm5 interacts weakly with RNase R in a pulldown assay.
(A) Illustration of a pulldown assay in which Csm5-His10-Smt3 (input 1) is loaded onto a Ni2+-agarose column, the column is washed to remove unbound protein, and then untagged RNase R or protein buffer (input 2) is allowed to flow through the column. Following extensive washing of unbound proteins, those remaining in the column are eluted three times using imidazole. (B, C) The results of pulldown assays when RNase R (B) or protein buffer (C) is used as input 2. Proteins from indicated fractions were resolved on denaturing SDS-PAGE and visualized using Coomassie G-250 stain. R, RNase R; bf, protein buffer; M, denaturing protein marker; kDa, kilodalton. The gels shown are representatives of three independent trials. See Figure 3—figure supplement 2—source data 1 and 2. (D) A control experiment in which untagged RNase R is applied to the column in the absence of Csm5 and subjected to the same washes and elution steps as in panels (B) and (C). The gel shown is a representative of three independent trials. See Figure 3—figure supplement 2—source data 3.
-
Figure 3—figure supplement 2—source data 1
Raw uncropped image for panel B.
- https://cdn.elifesciences.org/articles/81897/elife-81897-fig3-figsupp2-data1-v2.zip
-
Figure 3—figure supplement 2—source data 2
Raw uncropped image for panel C.
- https://cdn.elifesciences.org/articles/81897/elife-81897-fig3-figsupp2-data2-v2.zip
-
Figure 3—figure supplement 2—source data 3
Raw uncropped image for panel D.
- https://cdn.elifesciences.org/articles/81897/elife-81897-fig3-figsupp2-data3-v2.zip
Figure 4 with 1 supplement
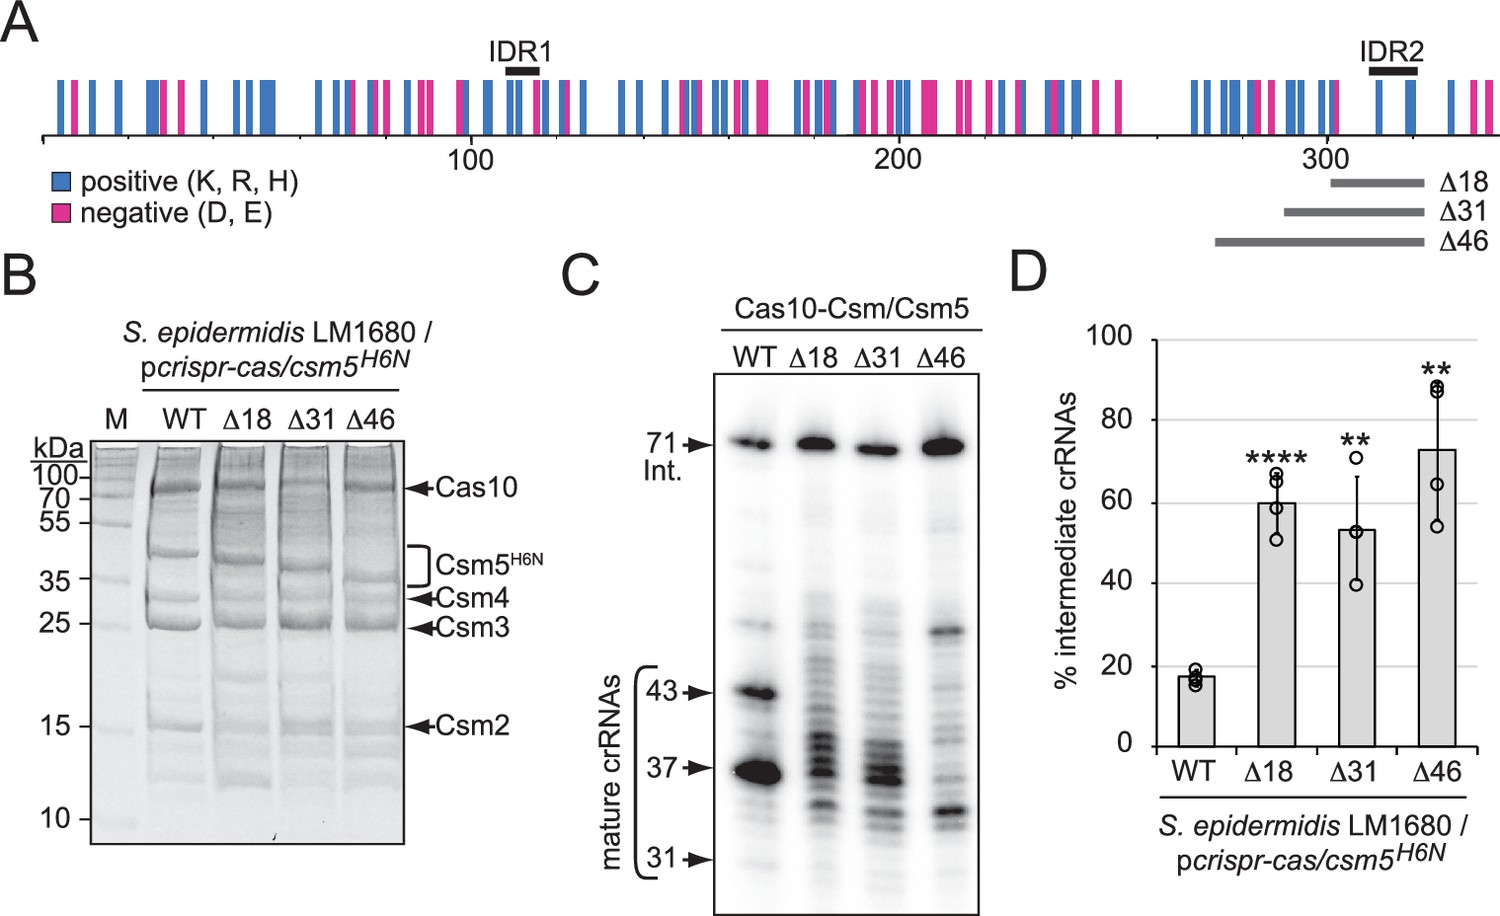
A predicted disordered region in Csm5 promotes crRNA maturation.
(A) Illustration showing the distribution of charged residues, predicted disordered regions, and truncations introduced in Csm5. Positions of charged residues (positive, cyan; negative, magenta) are shown as vertical bars. Predicted intrinsically disordered regions (IDR1 and IDR2) and regions that were truncated are delimited by black and gray horizontal bars above and below, respectively. K, lysine; R, arginine; H, histidine; D, aspartate; E, glutamate. See also Figure 4—figure supplement 1. (B) Cas10-Csm complexes with various Csm5 truncations are shown. Complexes were extracted from S. epidermidis LM1680 cells harboring pcrispr-cas/csm5H6N, which has a 6-His tag on the N-terminus of Csm5 to confirm full complex assembly. Complexes were purified using Ni2+ affinity chromatography, resolved on and SDS-PAGE gel, and visualized with Coomassie G-250 staining. M, denaturing protein marker; kDa, kilodalton. See also Figure 4—source data 1. (C) Total crRNAs bound to indicated Cas10-Csm complexes were extracted, radiolabeled at their 5′-ends, and resolved on a denaturing gel. See also Figure 4—source data 2. (D) Fractions of complex-bound intermediate crRNAs relative to total crRNAs are shown for Csm5 truncation mutants. The percent of intermediate crRNAs represents the ratio of the intermediate (71 nt) band density to the sum of band densities of the major crRNA species (71, 43, 37, and 31 nt). The data represents an average of four independent trials (± S.D). A two-tailed t-test was performed to determine significance and p-values obtained were <0.005 (**) or <0.00005 (****). See also Figure 4—source data 3.
-
Figure 4—source data 1
Raw uncropped image for panel B.
- https://cdn.elifesciences.org/articles/81897/elife-81897-fig4-data1-v2.zip
-
Figure 4—source data 2
Raw uncropped image for panel C.
- https://cdn.elifesciences.org/articles/81897/elife-81897-fig4-data2-v2.zip
-
Figure 4—source data 3
Percent intermediate crRNAs for individual replicates in panel D.
- https://cdn.elifesciences.org/articles/81897/elife-81897-fig4-data3-v2.xlsx
Figure 4—figure supplement 1
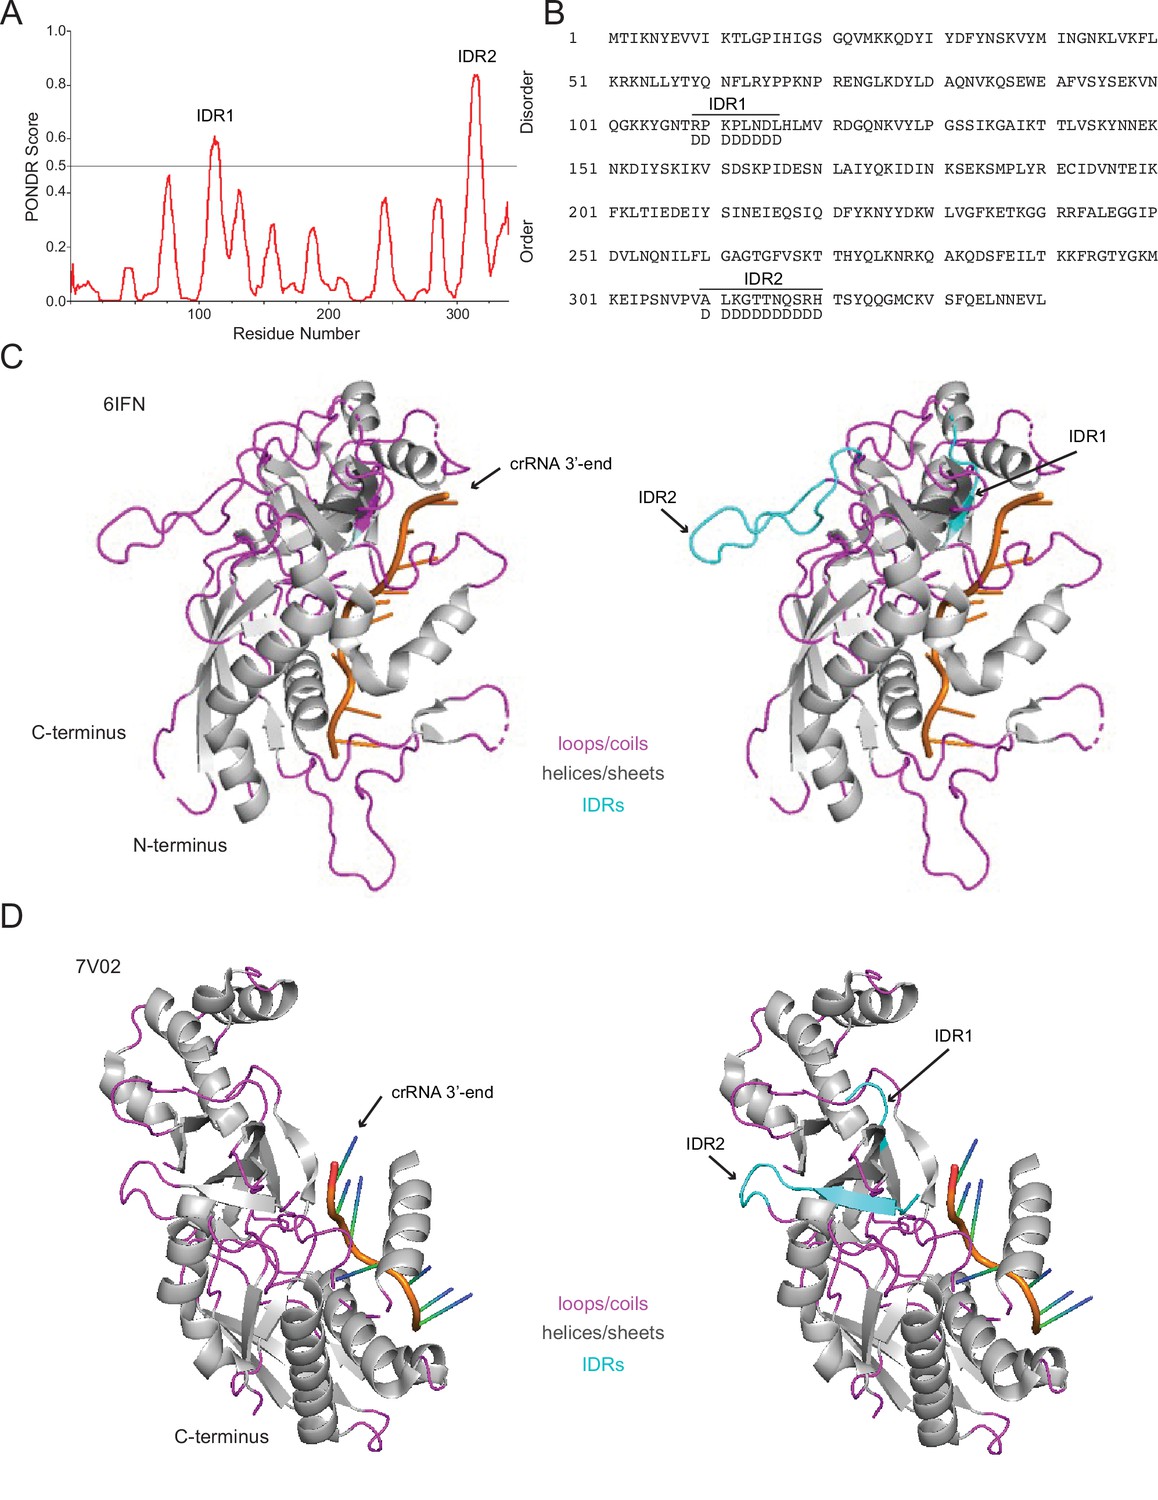
Predicted disordered regions of Csm5.
(A) Predicted disordered regions in S. epidermidis Csm5 are shown. The PONDR (Predictor of Natural Disordered Regions) score was derived from the web-based tool with the same name (pondr.com). Regions with a score of 0.5 or higher have a high probability of being disordered. The two putative disordered regions of Csm5 are labeled as IDR1 and IDR2. (B) The amino acid sequence of Csm5 is shown with putative disordered regions delimited. IDR1 encompasses residues 109–116, and IDR2 encompasses residues 310–320. (C, D) The Csm5 subunit of the unbound Cas10-Csm complex from Streptococcus thermophilus (C) as determined by You et al., 2019 (PDB ID 6IFN) and the Csm5 subunit of the unbound ‘short’ Cas10-Csm complex from S. epidermidis (D) as determined by Smith et al., 2022 (PDB ID 7V02). Csm5 is colored according to secondary structure with loops/coils in magenta and helices/sheets in gray. The bound crRNA is shown in orange. Homologous residues encompassing predicted IDRs in S. epidermidis Csm5 are shown in cyan on the right. The figure was generated using PyMOL.
Figure 5 with 1 supplement
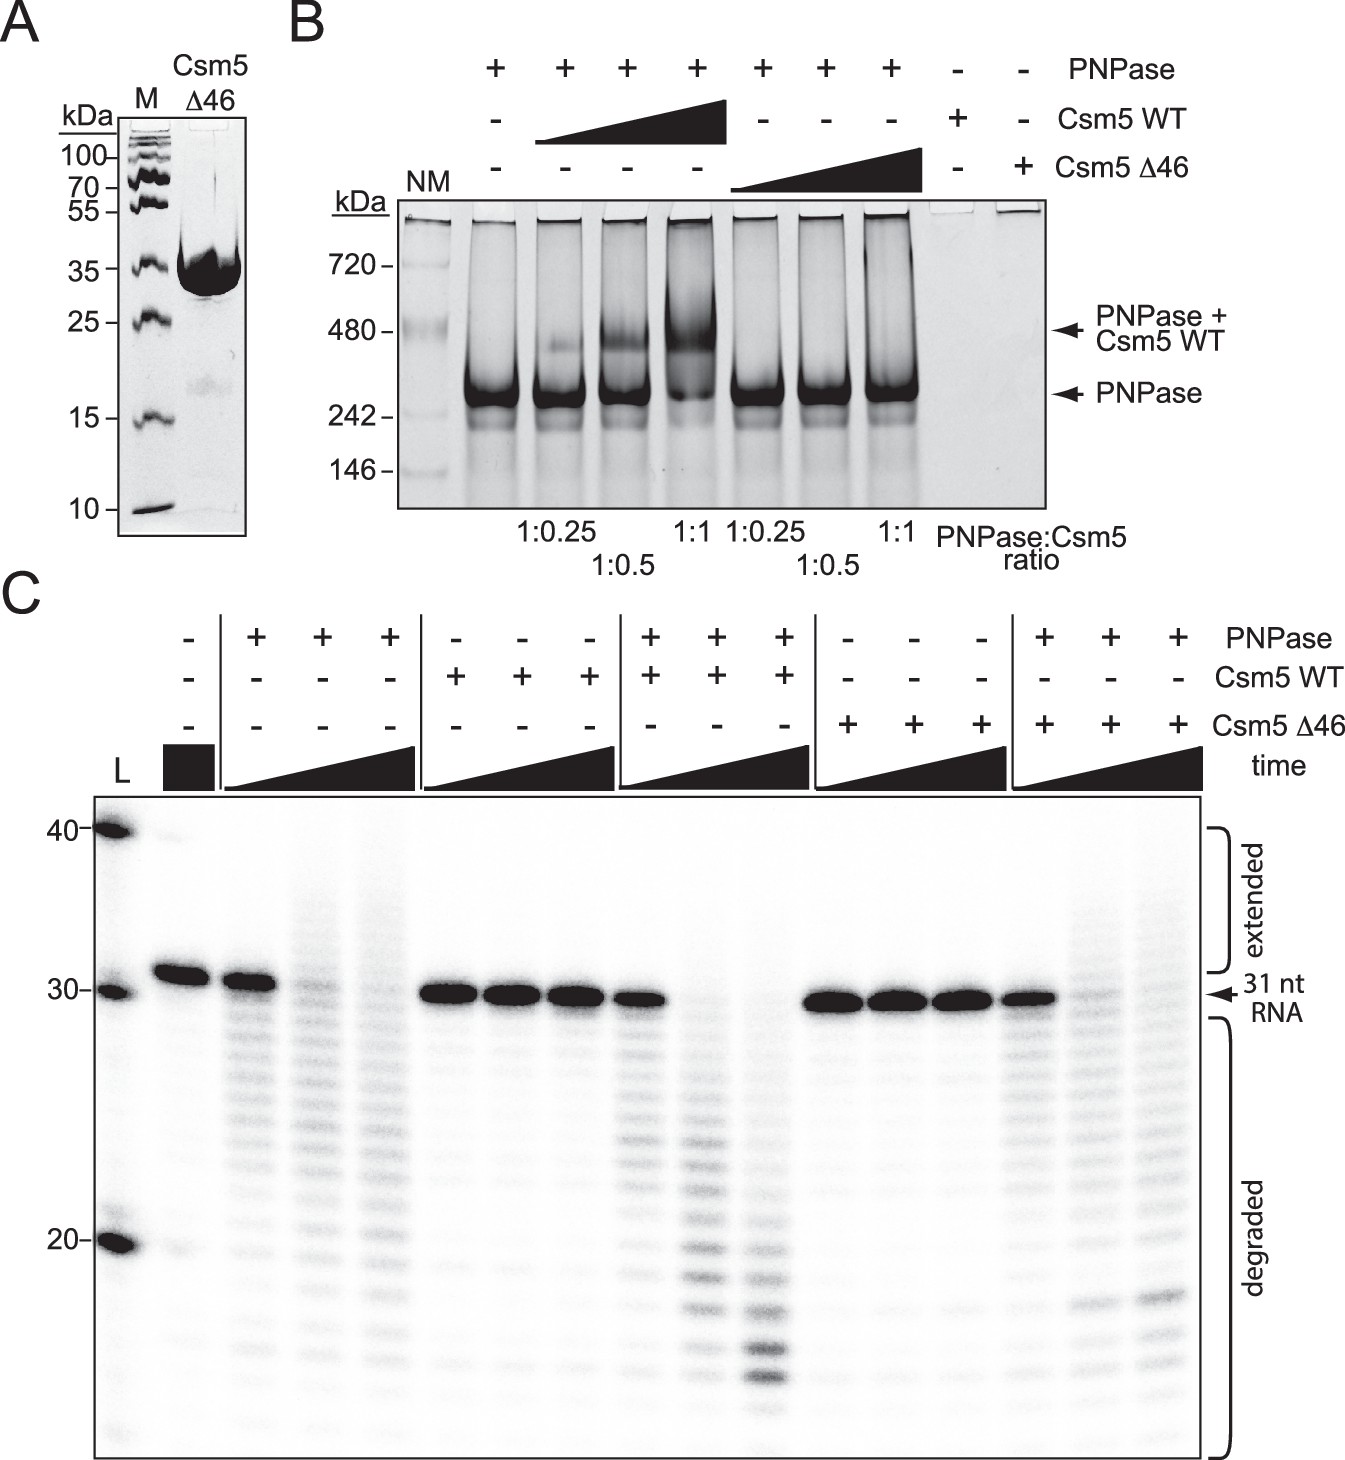
Csm5 interacts with and stimulates PNPase via a predicted disordered region.
(A) Purified recombinant Csm5Δ46 is shown, in which IDR2 has been deleted. The protein was resolved on an SDS-PAGE gel and visualized using Coomassie G-250 staining. M, denaturing protein marker; kDa, kilodalton. See also Figure 5—source data 1. (B) PNPase was resolved on a native gel with increasing amounts of Csm5 (WT and Δ46). Shown is a representative of three independent trials. NM, native protein marker. See also Figure 5—source data 2. (C) Nuclease assays conducted with PNPase and/or Csm5 (WT and Δ46) are shown. In these assays, a 5′-end labeled 31-nucleotide RNA substrate was combined with indicated proteins, incubated at 37°C for increasing amounts of time (0.5, 5, and 15 mins), and resolved on a denaturing gel. Shown is a representative of two independent trials. L, RNA Ladder. See also Figure 5—source data 3.
-
Figure 5—source data 1
Raw uncropped image for panel A.
- https://cdn.elifesciences.org/articles/81897/elife-81897-fig5-data1-v2.zip
-
Figure 5—source data 2
Raw uncropped image for panel B.
- https://cdn.elifesciences.org/articles/81897/elife-81897-fig5-data2-v2.zip
-
Figure 5—source data 3
Raw uncropped image for panel C.
- https://cdn.elifesciences.org/articles/81897/elife-81897-fig5-data3-v2.zip
Figure 5—figure supplement 1
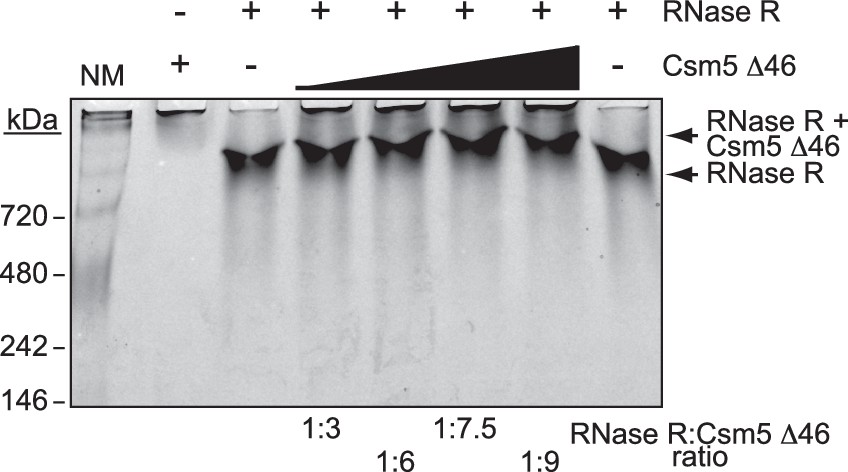
Csm5Δ46 retains interaction with RNase R.
Shown is a native gel in which RNase R was resolved alone or with increasing concentrations of Csm5Δ46. The gel shown is a representative of three independent trials. NM, native protein marker; kDa, kilodalton. See Figure 5—figure supplement 1—source data 1.
-
Figure 5—figure supplement 1—source data 1
Raw uncropped image.
- https://cdn.elifesciences.org/articles/81897/elife-81897-fig5-figsupp1-data1-v2.zip
Figure 6 with 1 supplement
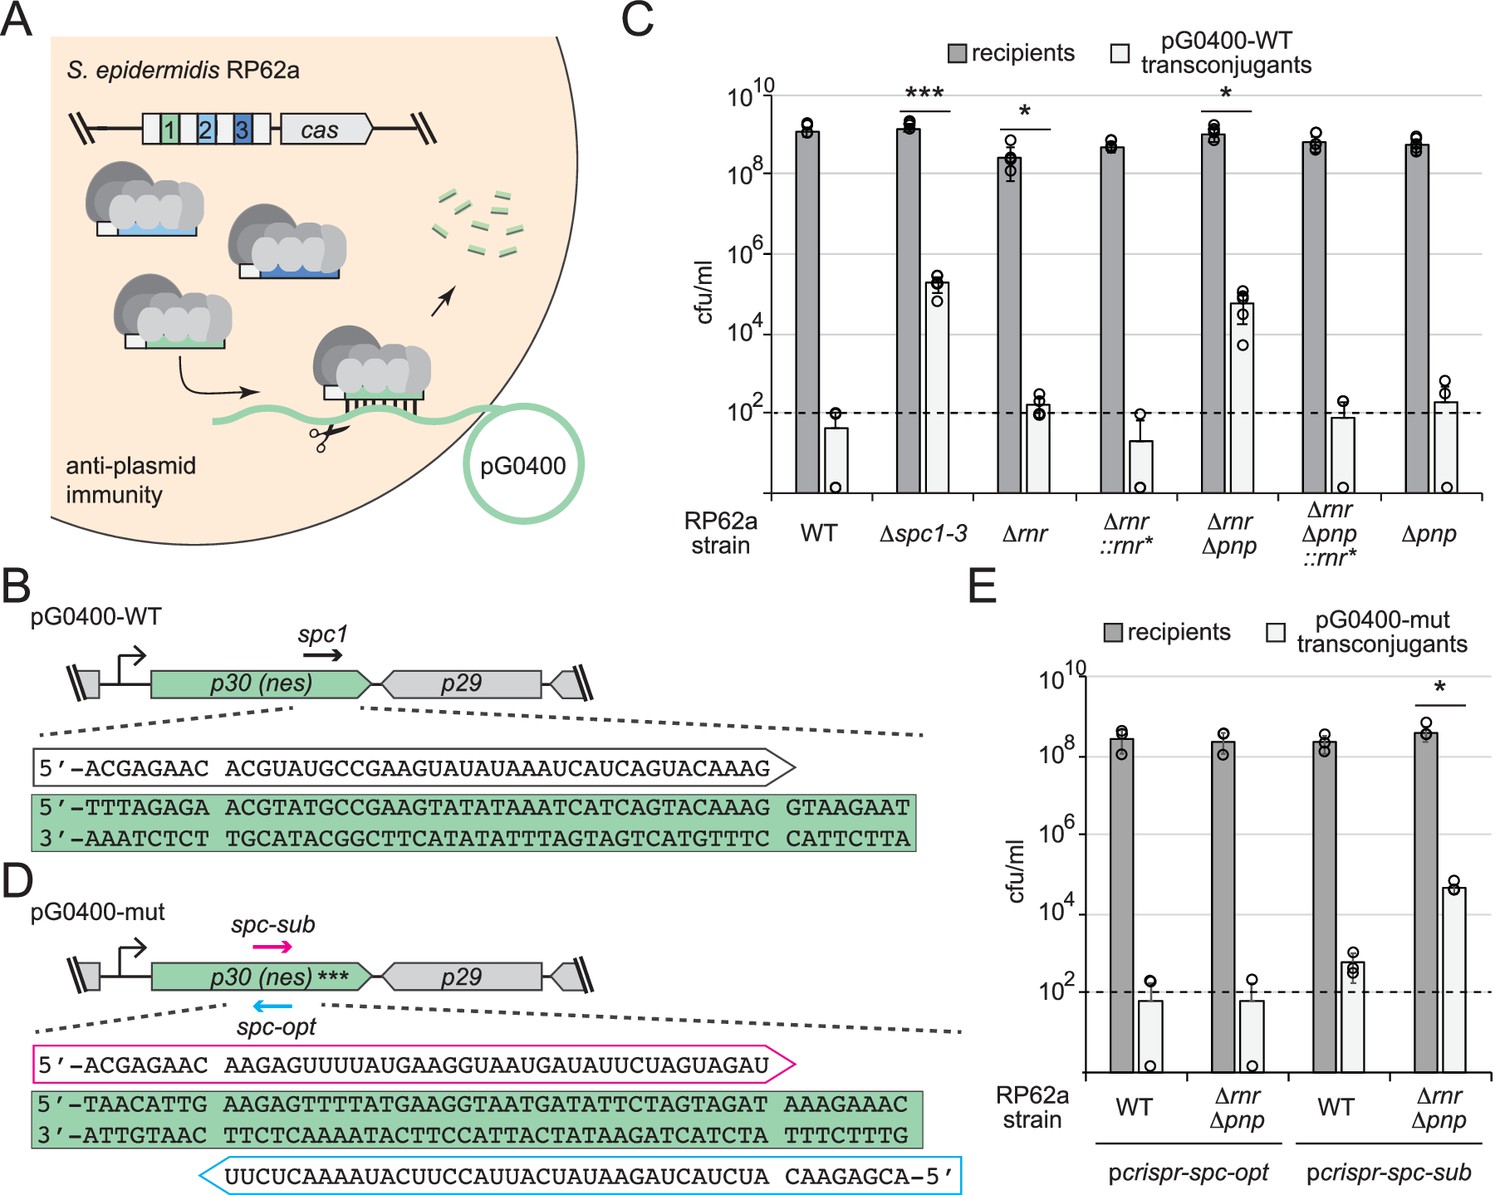
RNase R and PNPase work synergistically to promote robust anti-plasmid immunity.
(A) Illustration of the anti-plasmid assay is shown in which the conjugative plasmid pG0400 is transferred from a S. aureus RN4220 donor (not shown) into various S. epidermidis RP62a recipient strains. The first spacer in the CRISPR locus (green square) bears complementarity to the nickase (nes) gene in pG0400. (B, D) Sequences of protospacers and corresponding crRNAs targeting pG0400-WT (B) and pG0400-mut (D). Protospacer sequences are highlighted in green, and targeting crRNA sequences are shown in unfilled arrows. In pG0400-mut, asterisks represent nine silent mutations in the spc1 protospacer region. (C) Results from conjugation assays in which indicated S. epidermidis RP62a recipient strains were mated with S. aureus RN4220/pG0400-WT donor cells. See Figure 6—source data 1. (E) Results from conjugation assays in which various S. epidermidis RP62a recipient strains harboring indicated plasmids were mated with S. aureus RN4220/pG0400-mut donor cells. See Figure 6—source data 2. In panels (C) and (E), numbers of recipients and transconjugants following mating are shown in cfu/ml (colony-forming units per milliliter). Graphs show an average of five (C) or three (E) independent trials (± SD). Individual data points are shown with open circles, and data points on the x-axis represent at least one replicate where a value of 0 was obtained. The dotted line indicates the limit of detection for this assay. Two-tailed t-tests were performed on conjugation efficiencies to determine significance, and p-values of <0.05 (*) or <0.0005 (***) were obtained.
-
Figure 6—source data 1
Recipients, transconjugants, and conjugation efficiencies for independent replicates in panel C.
- https://cdn.elifesciences.org/articles/81897/elife-81897-fig6-data1-v2.xlsx
-
Figure 6—source data 2
Recipients, transconjugants, and conjugation efficiencies for independent replicates in panel E.
- https://cdn.elifesciences.org/articles/81897/elife-81897-fig6-data2-v2.xlsx
Figure 6—figure supplement 1
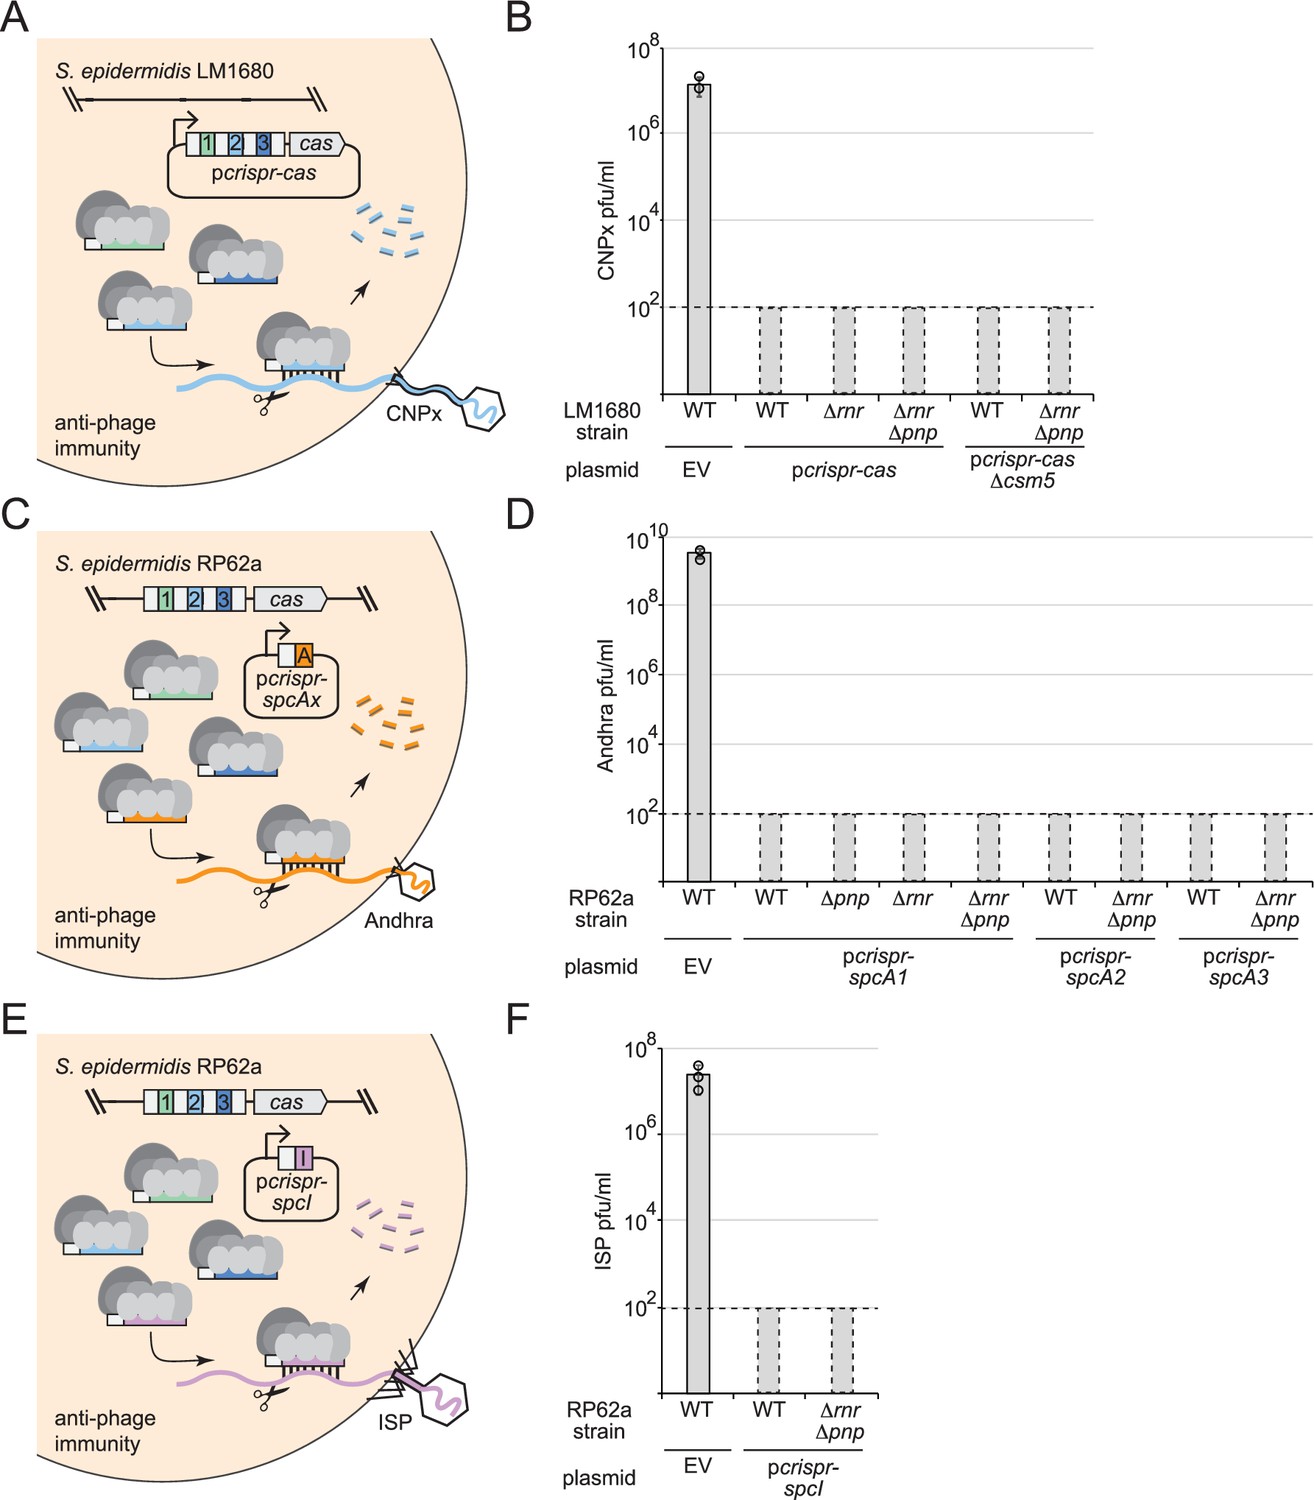
RNase R and PNPase are dispensable for anti-phage immunity.
(A) Illustration of the assay used to test anti-phage immunity in S. epidermidis LM1680. In this assay, dilutions of the siphophage CNPx are placed atop lawns of cells containing variants of pcrispr-cas, in which the second spacer (spc2, light blue square) bears complementarity to the phage genome. (B) Graph showing results for the anti-phage assay in panel (A). Indicated strains were challenged with CNPx and the resulting plaque-forming units per milliliter (pfu/ml) were enumerated. See Figure 6—figure supplement 1—source data 1. (C) Illustration of the assay used to test anti-phage immunity in S. epidermidis RP62a against phage Andhra. In this assay, the genome-encoded Cas10-Csm complex associates with crRNAs encoded in the plasmid pcrispr-spcAx (orange square) that target podophage Andhra. (D) Graph showing results for the anti-phage assay in panel (C). Each pcrispr-spcA construct contains a single spacer that targets genes that encode Andhra’s DNA polymerase (spcA1), major tail protein (spcA2), or lysin-like peptidase (spcA3). Indicated strains were challenged with Andhra and the resulting pfu/ml were enumerated. See Figure 6—figure supplement 1—source data 2. (E) Illustration of the assay used to test anti-phage immunity in S. epidermidis RP62a against phage ISP. In this assay, the genome-encoded Cas10-Csm complex associates with a spacer encoded in the plasmid pcrispr-spcI (purple square) that protects against myophage ISP. (F) Graph showing results for the anti-phage assay in panel (E). The pcrispr-spcI construct contains a single spacer that targets ISP’s lysin gene. Indicated strains were challenged with myophage ISP and the resulting pfu/ml were enumerated. See Figure 6—figure supplement 1—source data 3. For all phage challenge assays, the data shown is an average (± SD) of three independent trials. Dotted lines on graphs indicate the limits of detection for these assays, and bars with dotted borders were inserted below the line to indicate zero plaques counted. EV, empty vector.
-
Figure 6—figure supplement 1—source data 1
Phage plaque counts for individual replicates in panel B.
- https://cdn.elifesciences.org/articles/81897/elife-81897-fig6-figsupp1-data1-v2.xlsx
-
Figure 6—figure supplement 1—source data 2
Phage plaque counts for individual replicates in panel D.
- https://cdn.elifesciences.org/articles/81897/elife-81897-fig6-figsupp1-data2-v2.xlsx
-
Figure 6—figure supplement 1—source data 3
Phage plaque counts for individual replicates in panel F.
- https://cdn.elifesciences.org/articles/81897/elife-81897-fig6-figsupp1-data3-v2.xlsx
Figure 7
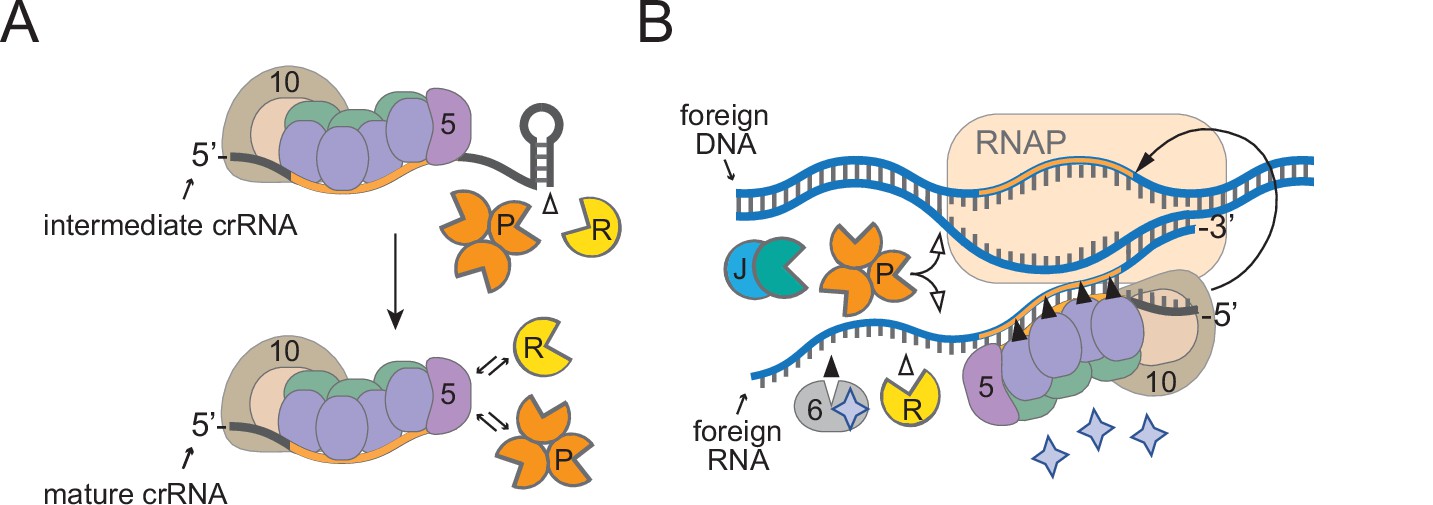
A model for how diverse housekeeping nucleases are enlisted to ensure successful defense.
(A) During Cas10-Csm complex assembly, Csm5 recruits and/or stimulates RNase R and PNPase through direct interactions. The unprotected 3′-ends of intermediate crRNAs are trimmed as a consequence of nuclease recruitment, resulting in the generation of the shorter mature species. (B) During interference, RNase R and PNPase work synergistically to help degrade invading nucleic acids alongside other Cas and non-Cas nucleases. Filled triangles illustrate events catalyzed by Cas proteins, and open triangles illustrate events catalyzed by non-Cas nucleases. Purple stars represent cyclic oligoadenylate molecules produced by Cas10. 5, Csm5; 6, Csm6; 10, Cas10; R, RNase R; P, PNPase; J, RNase J1/J2; RNAP, RNA polymerase.
Tables
Key resources table
| Reagent type (species) or resource | Designation | Source or reference | Identifiers | Additional information |
|---|---|---|---|---|
| Gene (Staphylococcus epidermidis) | cbf1 | NA | GenBank: CP000029.1_SERP1378 | Encodes Cbf1 |
| Gene (S. epidermidis) | rnr | NA | GenBank: CP000029.1_SERP0450 | Encodes RNase R |
| Gene (S. epidermidis) | pnp | NA | GenBank: CP000029.1_SERP0841 | Encodes PNPase |
| Gene (S. epidermidis) | csm5 | NA | GenBank: CP000029.1_SERP2457 | Encodes Csm5 |
| Strain, strain background (Staphylococcus aureus, RN4220) | RN4220 | PMID:21378186 | GenBank: NZ_AFGU00000000 | LA Marraffini (Rockefeller University) |
| Strain, strain background (S. epidermidis, RP62a) | RP62a | PMID:3679536 | GenBank: CP000029.1 | LA Marraffini (Rockefeller University) |
| Strain, strain background (S. epidermidis, LAM104) | Δspc1-3 | PMID:19095942 | LA Marraffini (Rockefeller University), derivative of RP62a with crispr deletion | |
| Strain, strain background (S. epidermidis, LM1680) | LM1680 | PMID:24086164 | LA Marraffini (Rockefeller University), derivative of RP62a with large deletion | |
| Strain, strain background (phage Andhra) | Andhra | PMID:28357414 | GenBank: KY442063 | Isolated in-house |
| Strain, strain background (phage ISP) | ISP | PMID:21931710 | GenBank: FR852584 | LA Marraffini (Rockefeller University) |
| Strain, strain background (phage CNPx) | CNPx | PMID:26755632 | GenBank: NC_031241 | LA Marraffini (Rockefeller University) |
| Genetic reagent (Staphylococcus epidermidis, RP62a) | RP62a Δpnp | PMID:30942690 | Created in-house | |
| Genetic reagent (S. epidermidis, RP62a) | RP62a Δrnr | This paper | The central 2316 nucleotides of the rnr coding region are deleted, see Figure 1—figure supplement 1 | |
| Genetic reagent (S. epidermidis, RP62a) | RP62a Δrnr::rnr* | This paper | A copy of rnr with two silent mutations reintroduced into the rnr locus, see Figure 1—figure supplement 1 | |
| Genetic reagent (S. epidermidis, RP62a) | RP62a Δrnr Δpnp | This paper | Contains in-frame deletions of rnr (described in the cells above) and pnp (PMID:30942690) | |
| Genetic reagent (S. epidermidis, RP62a) | RP62a Δrnr Δpnp::rnr* | This paper | A copy of rnr with two silent mutations reintroduced into the rnr locus, see Figure 1—figure supplement 1 | |
| Genetic reagent (S. epidermidis, LM1680) | LM1680 Δpnp | PMID:30942690 | Created in-house | |
| Genetic reagent (S. epidermidis, LM1680) | LM1680 Δrnr | This paper | The central 2316 nucleotides of the rnr coding region are deleted, see Figure 1—figure supplement 1 | |
| Genetic reagent (S. epidermidis, LM1680) | LM1680 Δrnr::rnr* | This paper | A copy of rnr with two silent mutations reintroduced into the rnr locus, see Figure 1—figure supplement 1 | |
| Genetic reagent (S. epidermidis, LM1680) | LM1680 Δrnr Δpnp | This paper | Contains in-frame deletions of rnr (described in the cells above) and pnp (PMID:30942690) | |
| Genetic reagent (S. epidermidis, LM1680) | LM1680 Δrnr Δpnp::rnr* | This paper | A copy of rnr with two silent mutations reintroduced into the rnr locus, see Figure 1—figure supplement 1 | |
| Recombinant DNA reagent | pKOR1 | PMID:16051359 | LA Marraffini (Rockefeller University) | |
| Recombinant DNA reagent | pKOR1-Δrnr | This paper | To create in-frame deletion of rnr via allelic replacement | |
| Recombinant DNA reagent | pKOR1-rnr* | This paper | To create complementation of rnr with silent mutations via allelic replacement | |
| Recombinant DNA reagent | pcrispr-cas | PMID:23935102 | LA Marraffini (Rockefeller University) | |
| Recombinant DNA reagent | pcrisprcas/csm5H6NΔ18 | This paper | Contains 18 amino acids deletion encompassing IDR2 in Csm5 | |
| Recombinant DNA reagent | pcrisprcas/csm5H6NΔ31 | This paper | Contains 31 amino acids deletion encompassing IDR2 in Csm5 | |
| Recombinant DNA reagent | pcrisprcas/csm5H6NΔ46 | This paper | Contains 46 amino acids deletion encompassing IDR2 in Csm5 | |
| Recombinant DNA reagent | pET28b-H10Smt3-csm5 | PMID:28204542 | Created in-house | |
| Recombinant DNA reagent | pET28b-H10Smt3-csm5Δ46 | This paper | Contains 46 amino acids deletion encompassing IDR2 in Csm5; for overexpression and purification of Csm5Δ46 | |
| Sequence-based reagent | 5'-ACGAGAACAC GUAUGCCGA AGUAUAUAAAUC | Eurofins MWG Operon | A 31-nt single-stranded RNA substrate for nuclease assays, see Figure 5 | |
| Sequence-based reagent | DNA oligonucleotides (multiple) | Eurofins MWG Operon | To build and sequence recombinant DNA constructs, see Supplementary file 2 | |
| Sequence-based reagent | Decade Markers System | Fisher Scientific | Cat# AM7778 | |
| Peptide, recombinant protein | EcoRI | New England Biolabs | Cat# R0101S | |
| Peptide, recombinant protein | T4 Polynucleotide kinase | New England Biolabs | Cat# M0201L | |
| Peptide, recombinant protein | T4 DNA Ligase | New England Biolabs | Cat# M0202S | |
| Peptide, recombinant protein | DpnI | New England Biolabs | Cat# R0176S | |
| Peptide, recombinant protein | Lysostaphin | AmbiProducts via Fisher | Cat# NC0318863 | |
| Peptide, recombinant protein | Pierce Protease and Phosphatase Inhibitor Mini Tablets | Thermo Fisher | Cat# 88669 | |
| Peptide, recombinant protein | SUMO Protease | MCLAB, http://www.mclab.com/SUMO-Protease.html | Cat# SP-100 | |
| Peptide, recombinant protein | Bovine serum albumin (BSA) | VWR | Cat# 97061-420 | |
| Peptide, recombinant protein | PageRuler Plus Prestained Protein Ladder, 10–250 kDa | Thermo Fisher | Cat# 26619 | |
| Peptide, recombinant protein | NativeMark Unstained Protein Standard | Invitrogen via Thermo Fisher | Cat# LC0725 | |
| Commercial assay or kit | EZNA Cycle Pure Kit | Omega Bio-tek via VWR | Cat# 101318-892 | |
| Commercial assay or kit | EZNA Plasmid DNA Mini Kit | Omega Bio-tek via VWR | Cat# 101318-898 | |
| Commercial assay or kit | Advance Centrifugal Devices 10K MWCO | Pall via VWR | Cat# 89131-980 | |
| Commercial assay or kit | Disposable Gravity Flow Columns for Protein Purification | G-Biosciences via VWR | Cat# 82021-346 | |
| Commercial assay or kit | G-25 Spin Columns | IBI Scientific via VWR | Cat# IB06010 | |
| Chemical compound or drug | HisPur Ni-NTA Resin | Thermo Fisher | Cat# 88222 | |
| Chemical compound or drug | TRIzol Reagent | Thermo Fisher | Cat#15596026 | |
| Chemical compound or drug | g-32P-ATP | PerkinElmer | Cat# BLU502H250UC | |
| Software, algorithm | ImageQuant TL | GE Healthcare/Life Sciences | RRID:SCR_014246 | Version 8.2, used for densitometry |
| Software, algorithm | PONDR | Molecular Kinetics, Inc, Washington State University and the WSU Research Foundation | pondr.com | Used to predict disordered regions in Csm5 |
| Software, algorithm | PyMOL | The PyMOL Molecular Graphics System, version 2.0 Schrödinger, LLC | RRID:SCR_000305 | Version 2.5, used for structural analyses |
| Software, algorithm | CRISPR-Cas10 Protospacer Selector Tool | ahatoum/CRISPR-Cas10- Protospacer-Selector is licensed under the GNU General Public License v3.0 (Bari et al., 2017) | https://github.com/ahatoum/CRISPR-Cas10-Protospacer-Selector | Used to predict protospacer sequence to target phage Andhra. |
Additional files
-
Supplementary file 1
Accompanies Figures 2, 3 and 5, Figure 3—figure supplement 1, and Figure 5—figure supplement 1.
Theoretical molecular weights and isoelectric points of purified proteins in this study.
- https://cdn.elifesciences.org/articles/81897/elife-81897-supp1-v2.docx
-
Supplementary file 2
DNA oligonucleotides used for cloning and PCR in this study.
- https://cdn.elifesciences.org/articles/81897/elife-81897-supp2-v2.docx
-
MDAR checklist
- https://cdn.elifesciences.org/articles/81897/elife-81897-mdarchecklist1-v2.docx
Download links
A two-part list of links to download the article, or parts of the article, in various formats.
Downloads (link to download the article as PDF)
Open citations (links to open the citations from this article in various online reference manager services)
Cite this article (links to download the citations from this article in formats compatible with various reference manager tools)
Critical roles for ‘housekeeping’ nucleases in type III CRISPR-Cas immunity
eLife 11:e81897.
https://doi.org/10.7554/eLife.81897


