Design principles for inflammasome inhibition by pyrin-only-proteins
- Department of Biophysics and Biophysical Chemistry, Johns Hopkins University School of Medicine, United States
- Division of Infectious Diseases, Johns Hopkins University School of Medicine, United States
- Division of Rheumatology, Johns Hopkins University School of Medicine, United States
- Department of Oncology, Johns Hopkins University School of Medicine, United States
Figures
Figure 1 with 2 supplements
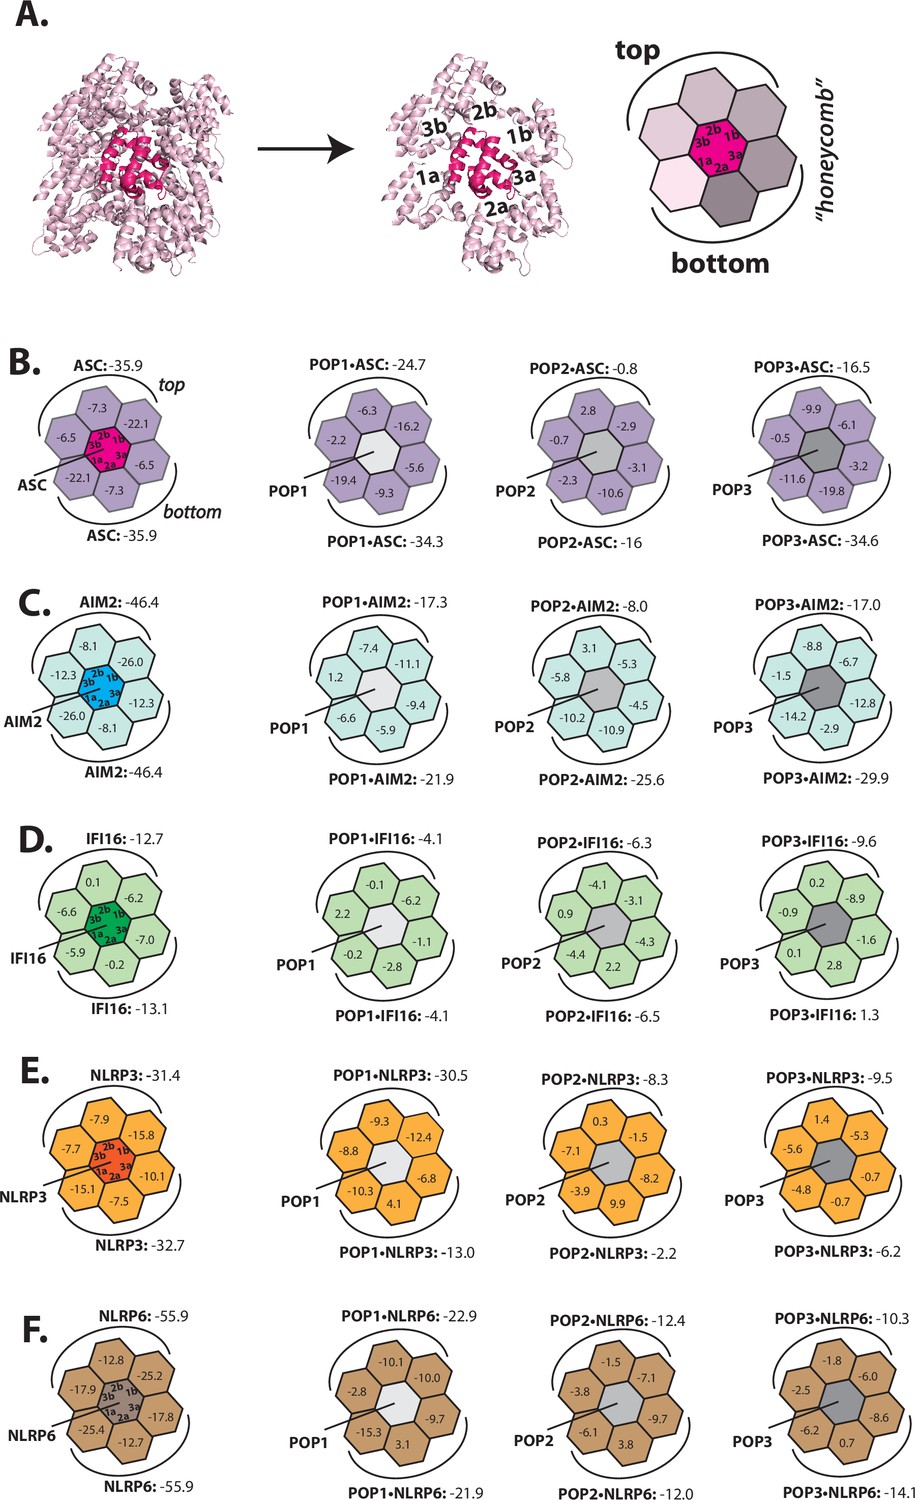
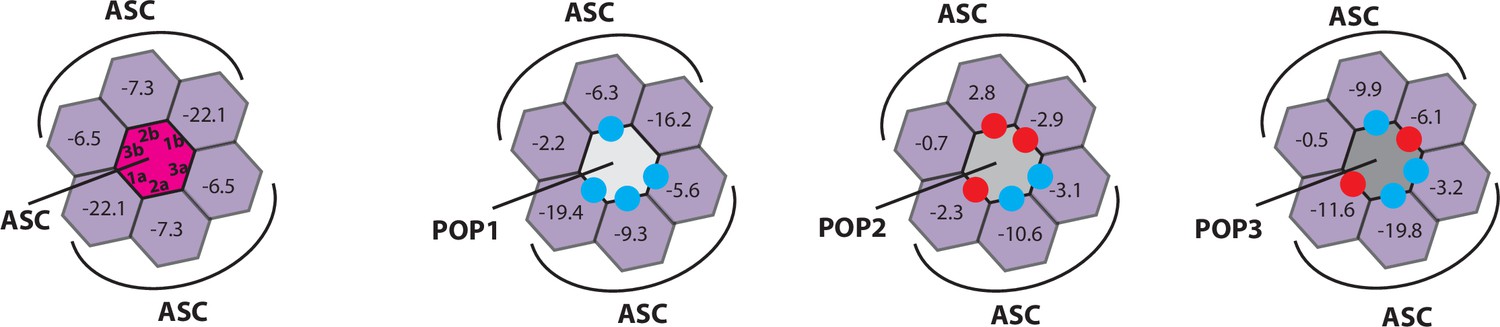
Rosetta in silico analyses of putative pyrin-only-protein (POP)•pyrin-domain (PYD) interactions.
(A) The ‘side view’ of the ASCPYD filament (PDB: 3j63). The center magenta protomer makes all six unique contacts with surrounding pink protomers for assembly. Each surrounding protomer is colored in a different shade of pink in the ‘honeycomb’ diagram. (B–F) Rosetta interface energy scores (∆Gs, Rosetta energy score, reu) at individual filament interfaces for homotypic assemblies (left) and putative interactions with POPs (right). Each hexagon represents a PYD or POP monomer. The sum of ∆Gs at the top and bottom half is also listed. The honeycombs were generated based on their respective cryo-EM structures except for IFI16PYD whose filament structure is unknown. We generated a homology model of IFI16PYD filament based on the GFP-tagged AIM2 filament (PDB: 6mb2), which produced more favorable ∆Gs than the one generated from the tagless-AIM2PYD filament (PDB: 7k3r; Figure 1—figure supplement 2).
Figure 1—figure supplement 1
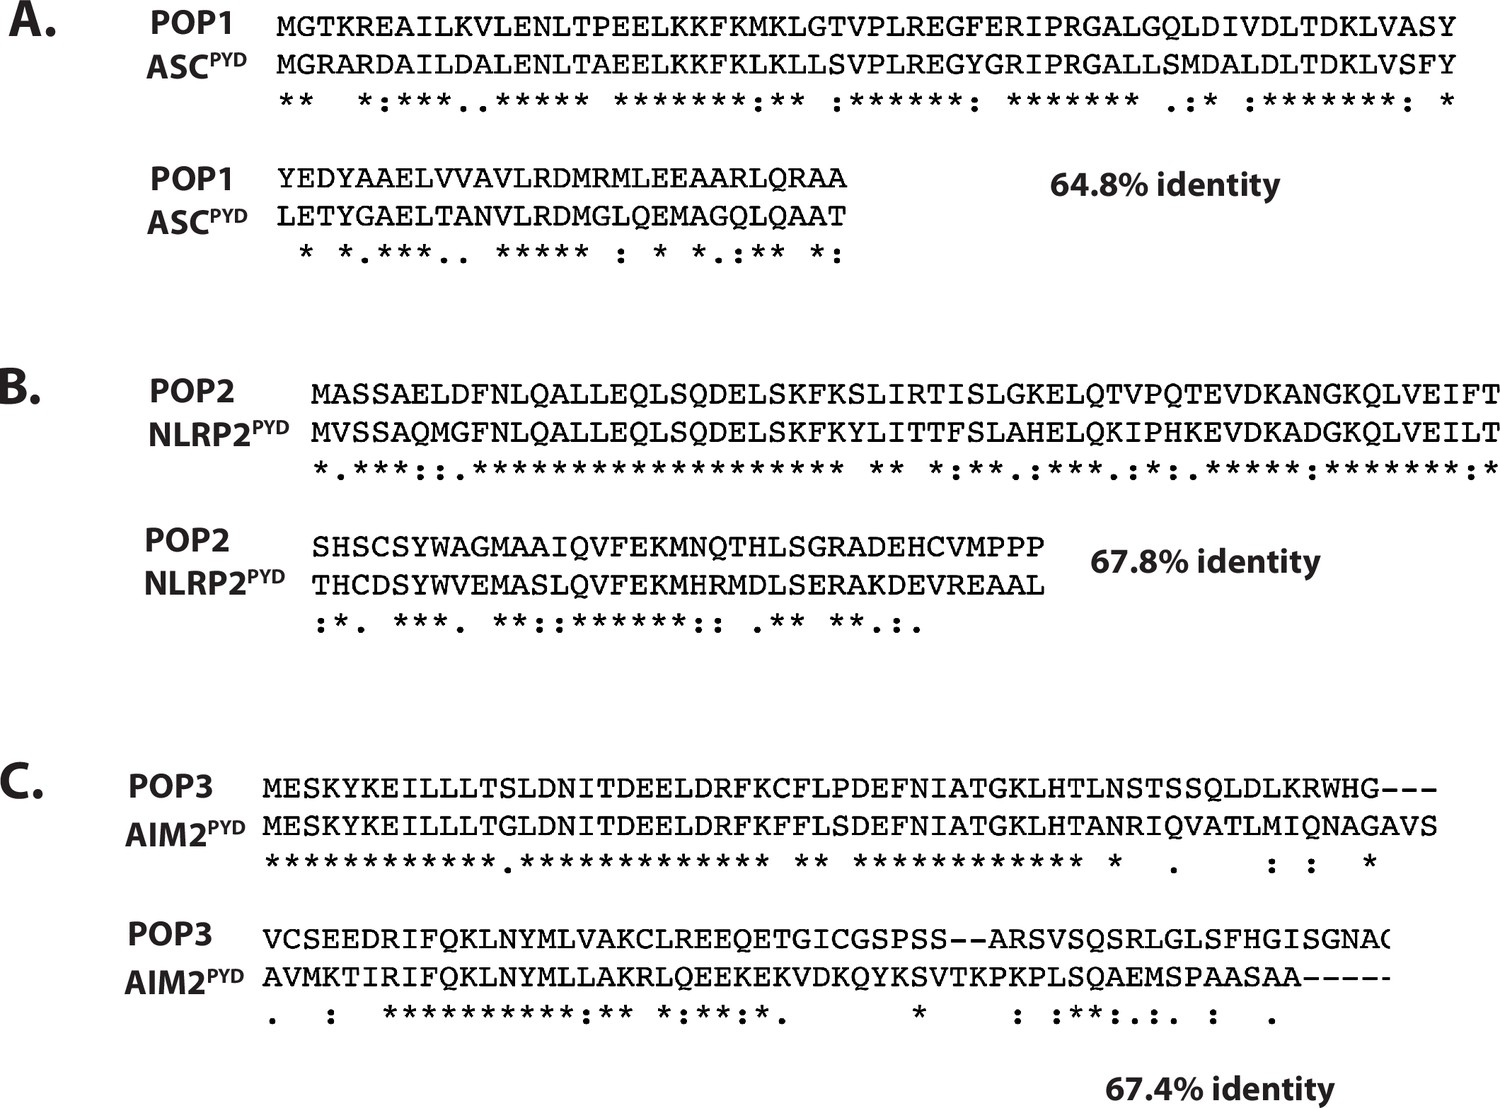
Amino acid sequence alignments of POPs.
(A–C) Amino acid (a.a.) sequence alignments of pyrin-only-proteins (POPs) and their most similar pyrin-domains (PYDs). See also de Almeida et al., 2015; Devi et al., 2020; Indramohan et al., 2018; Khare et al., 2014; Ratsimandresy et al., 2017.
Figure 1—figure supplement 2

FI16PYD honeycombs based on two different homology models.
We used the model based on PDB ID: 6mb2 as it showed more favorable homotypic PYD•PYD interactions (see also Materials and methods). PYD, pyrin-domain.
Figure 2 with 3 supplements

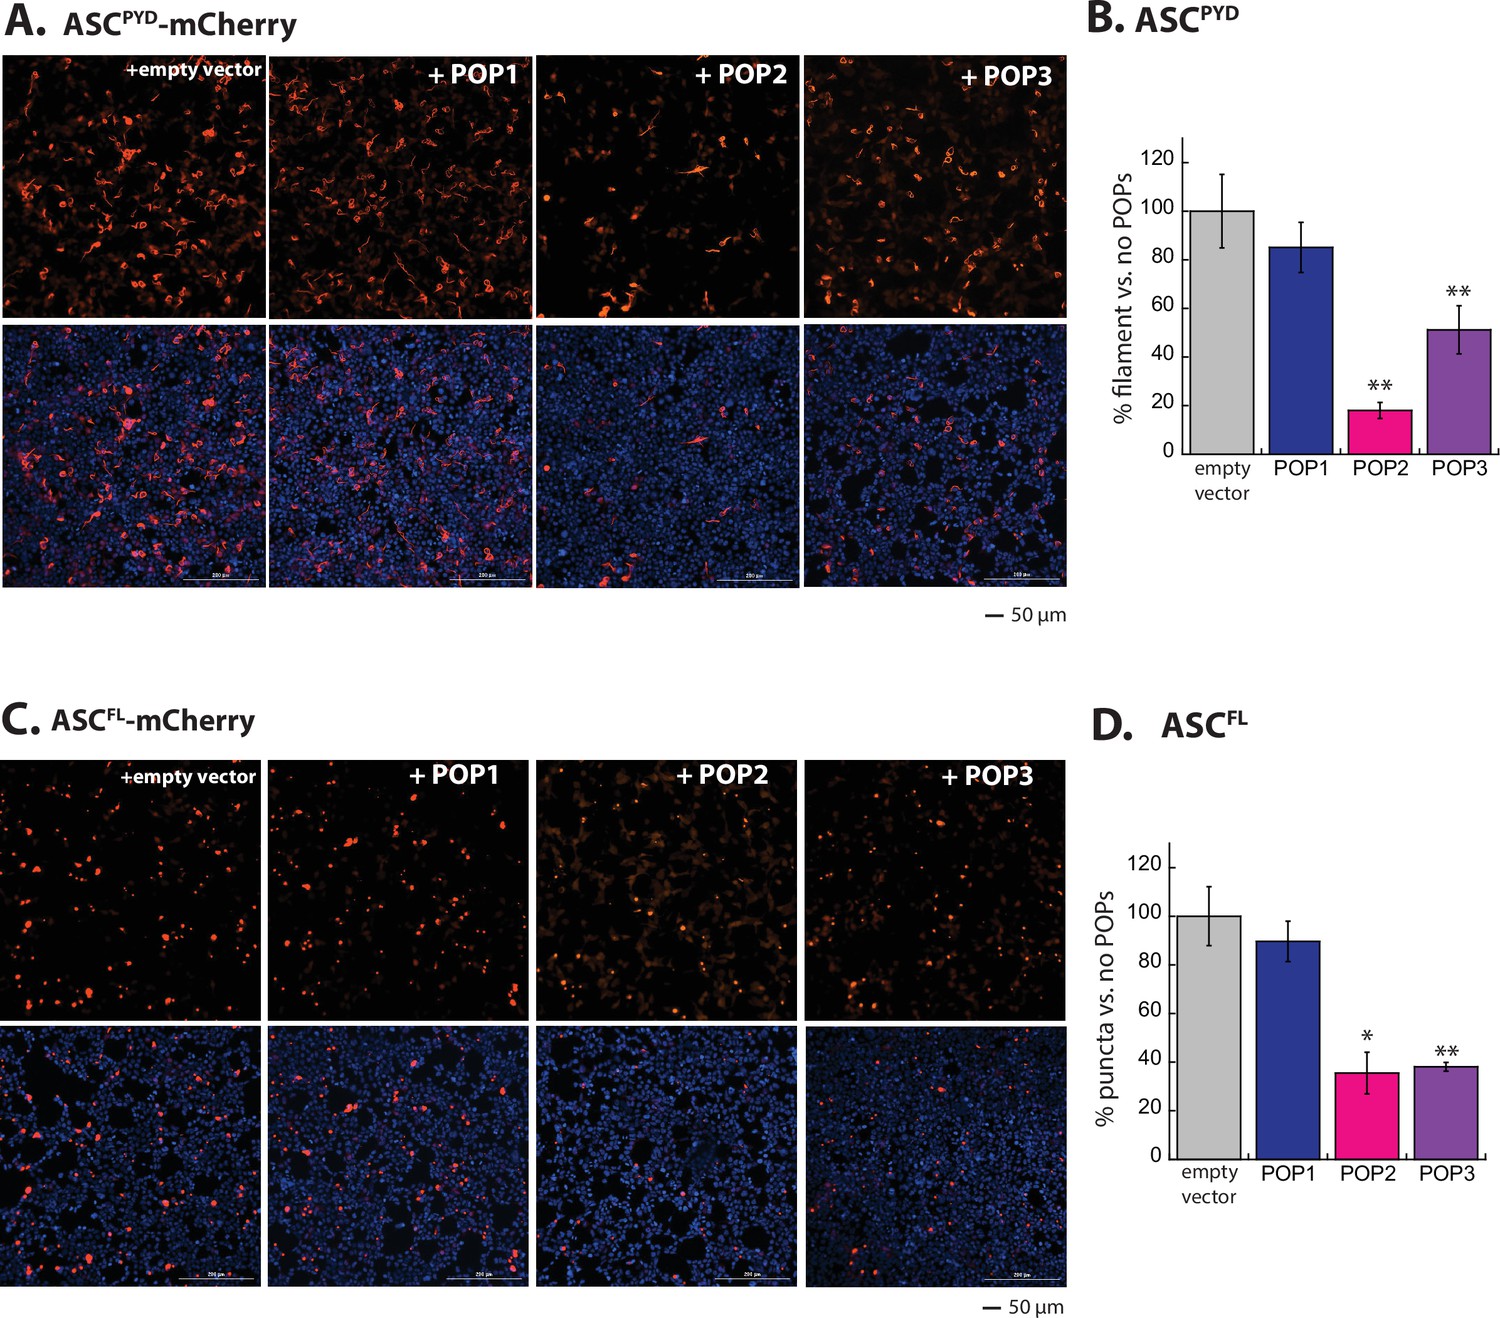
POP1 does not directly inhibit apoptosis-associated speck-forming protein-containing caspase-recruiting domain (ASC).
(A) Sample fluorescent microscope images of HEK293T cells co-transfected with mCherry-tagged ASCPYD (300 ng; crimson) plus eGFP alone or eGFP-tagged pyrin-only-proteins (POPs) (1200 ng; green). Blue: DAPI. (B) The relative amounts of ASCPYD-mCherry filaments (300 ng plasmid) in HEK293T cells when co-transfected with POP-eGFP (+) or eGFP alone (-) (600 and 1200 ng plasmids). n≥4. *: p≤0.05, **: p≤0.01; ***: p≤0.001, hereafter. (C) Sample fluorescent microscope images of HEK293T cells co-transfected with mCherry-tagged ASCFL (300 ng; crimson) plus eGFP alone or eGFP-tagged POPs (1200 ng; green). Blue: DAPI. (D) The relative amounts of ASCFL-mCherry puncta (300 ng plasmid) in HEK293T cells when co-transfected with POP-eGFP (+) or eGFP (-) (600 and 120 ng plasmids). N≥4. (E) Time-dependent increase in Förster resonance energy transfer (FRET) signals of a donor- and acceptor-labeled ASCPYD (2.5 µM total, black circle) was monitored with increasing concentrations POP1 (50 and 150 µM), POP2 (3.3, 6.7, 13.3, 26.7, and 40 µM), or POP3 (3.25, 7.5, 15, 20, and 30 µM); darker shades correspond to increasing POP concentrations. Two- and three-headed arrows indicate the increase in apparent nucleation time (or lack thereof). Arrows pointing upper right directions indicate the change (or lack thereof) in the elongation phase in the presence of the highest POP concentrations used. Data shown are representatives of at least three independent measurements (IC50s are average values of these experiments. N=3). (F) Negative-stain electron microscopy (nsEM) images of ASCPYD filaments (2.5 µM) in the presence and absence of POP1 (150 µM), POP2 (40 µM), or POP3 (30 µM).
-
Figure 2—source data 1
Data values used in plots from Figure 2 and Figure 2—figure supplements 1–2 and a folder containing uncropped gel images used in Figure 2—figure supplement 2.
- https://cdn.elifesciences.org/articles/81918/elife-81918-fig2-data1-v1.zip
Figure 2—figure supplement 1
Inhibition of ASC assembly by pyrin-only-proteins (POPs).
(A) Sample fluorescent microscope images of HEK293T cells co-transfected with mCherry-tagged ASCPYD (300 ng; crimson) plus the empty pCMV vector or the vector containing each pyrin-only-protein (POP) without any tags (1200 ng). Top panels are the mCherry channel only and the bottom panels are with DAPI. (B) The relative amounts of ASCPYD-mCherry filaments (300 ng plasmid) in HEK293T cells when co-transfected with each untagged POP or the empty vector (1200 ng plasmids). N=3. (A–D) Same experimental conditions and analyses as (A) and (B), but with ASCFL-mCherry.
Figure 2—figure supplement 2
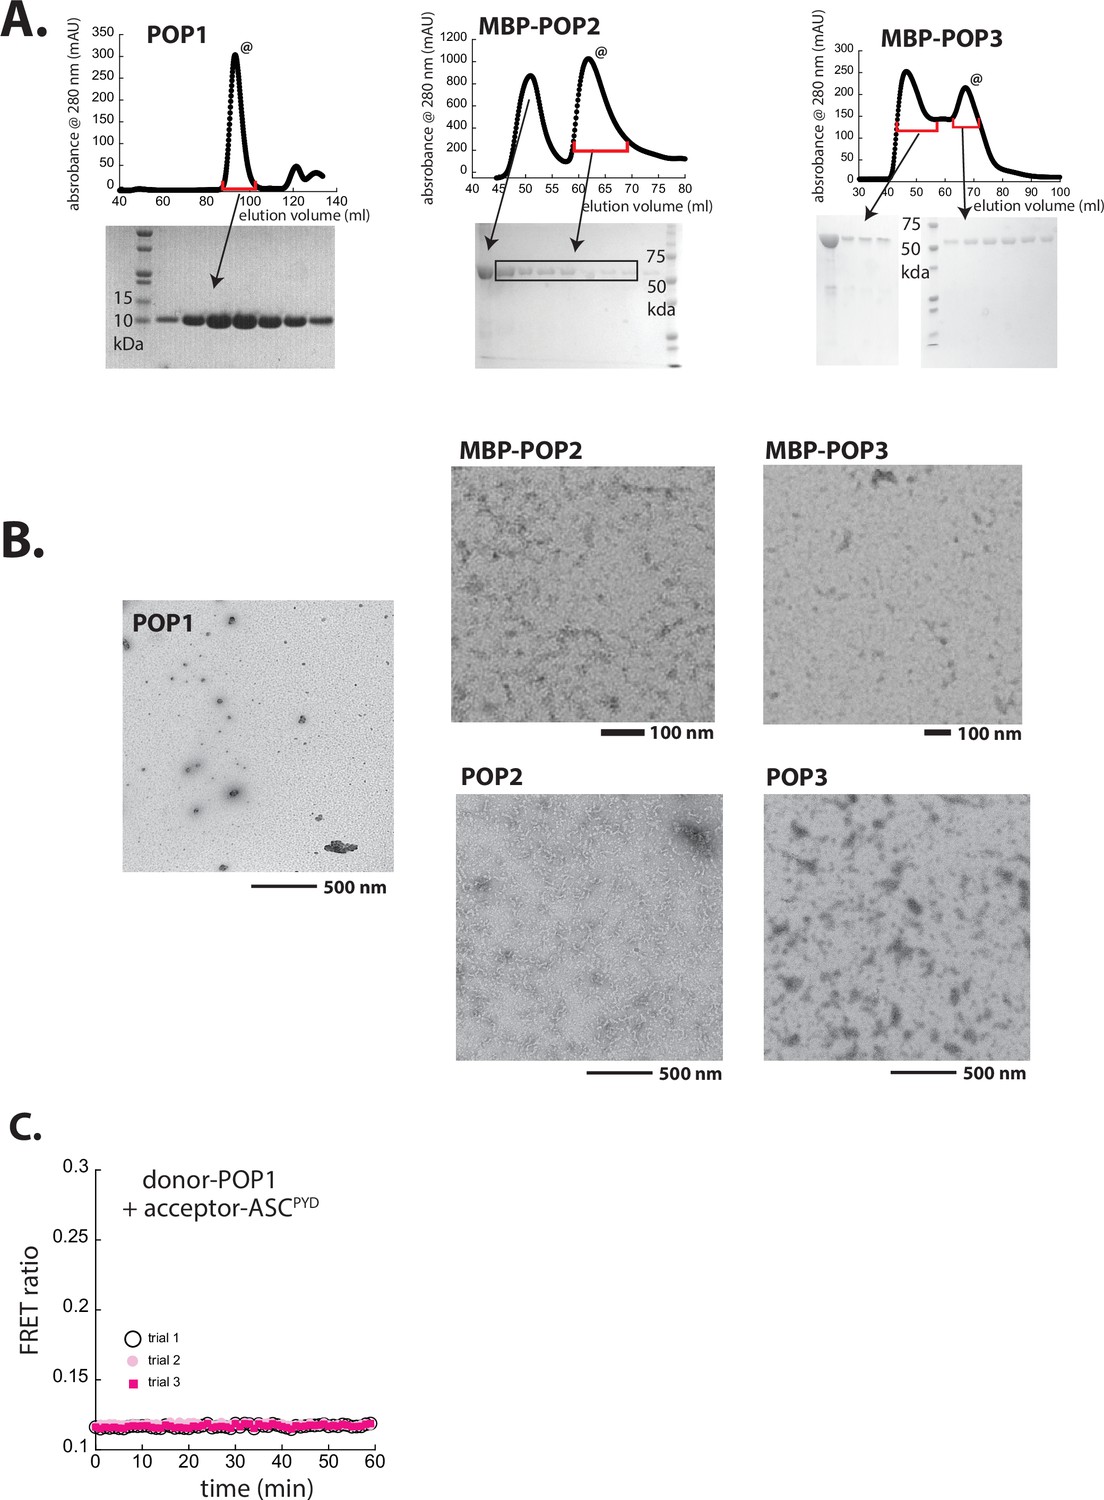
Preparation and characterization of recombinant POPs.
(A) Size-exclusion chromatography (SEC; Superdex 75, Cytiva) profiles of recombinant pyrin-only-proteins (POPs). @: peaks corresponding to monomeric POP1 and maltose-binding protein (MBP)-POP2/3 were collected and used in the current study. (B) Negative-stain electron microscopy (nsEM) images of untagged POP1 (100 µM), (MBP)-POP2 (20 µM), and (MBP)-POP3 (20 µM). MBP was removed by incubating with tobacco etch virus protease (TEVp) (5 µM) for 30 min. (C) Possible Förster resonance energy transfer (FRET) between donor-labeled POP1 and acceptor-labeled ASCPYD was tested over time upon adding TEVp (trials 1 and 2 are with 1.25 µM each protein and trial 3 is with 2.5 µM each protein).
Figure 2—figure supplement 3
Rosetta interface analysis results showing favorable (∆∆G≤3.5 reu, blue dots) and unfavorable (∆∆G≥10.0 reu, red dots) interactions between ASCPYD and pyrin-only-proteins (POPs).
Figure 3 with 3 supplements

Inhibition of AIM2-like receptor (ALR) assembly by pyrin-only-proteins (POPs).
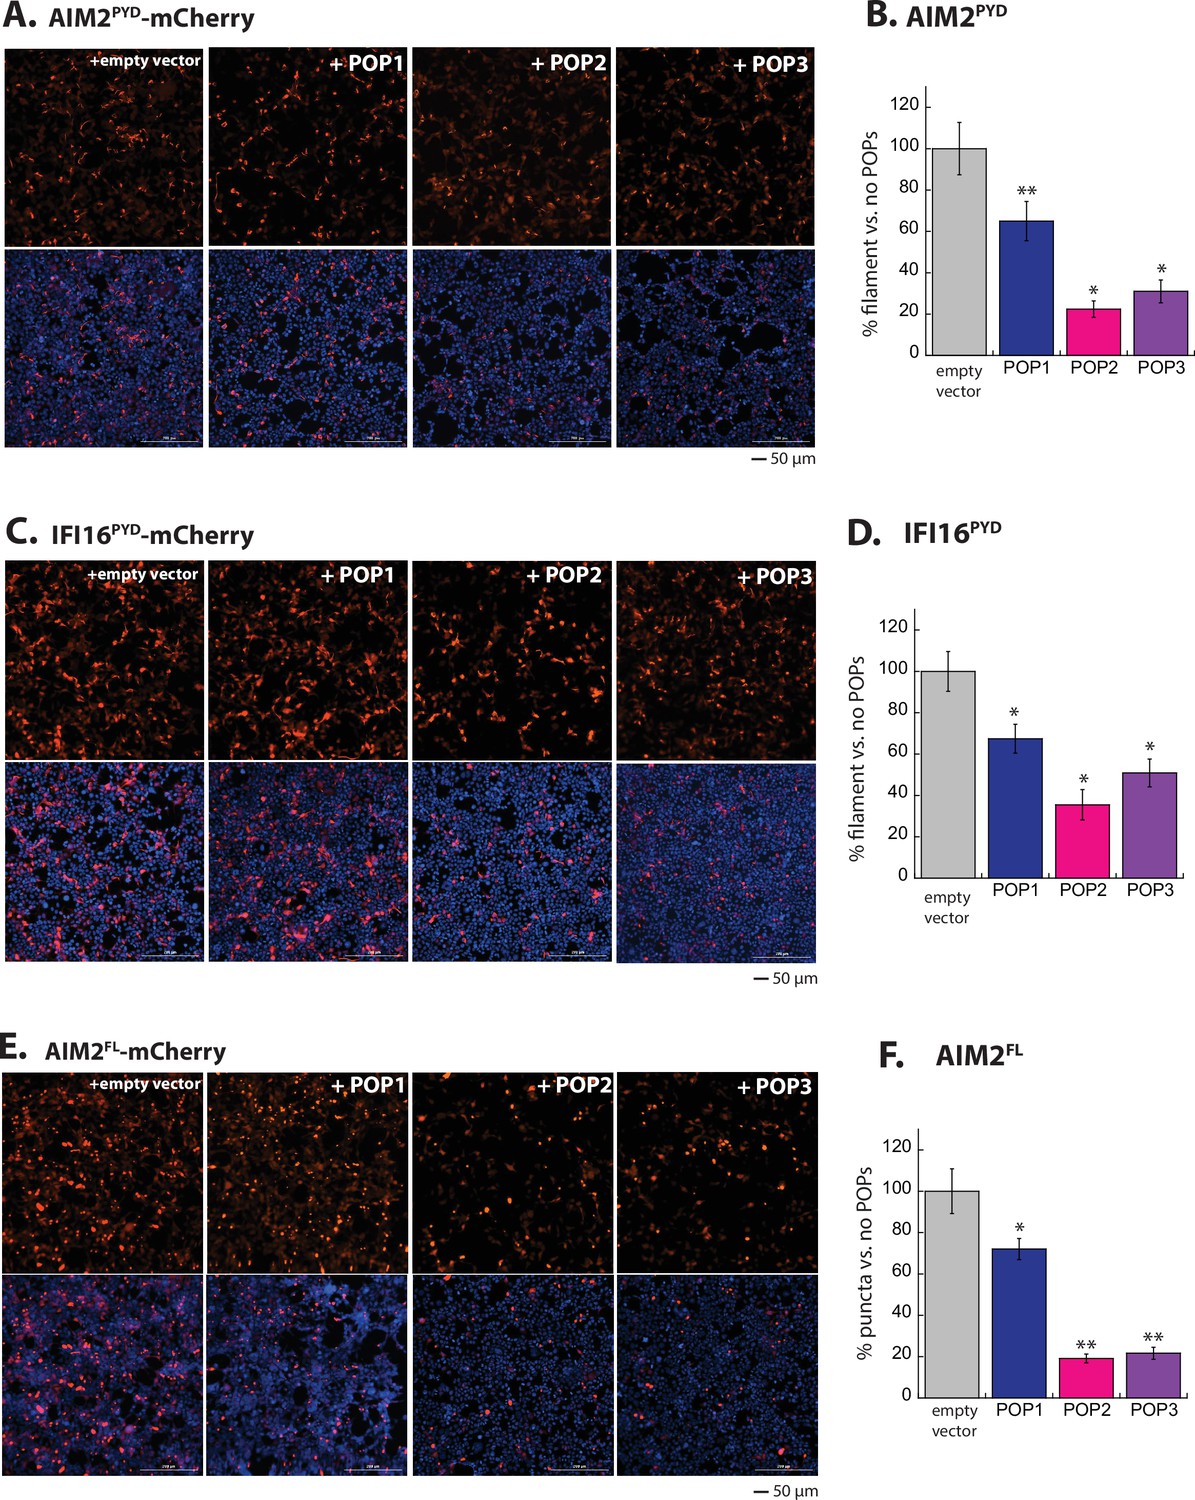
(A) Sample fluorescent microscope images of HEK293T cells co-transfected with mCherry-tagged AIM2PYD (300 ng; crimson) plus eGFP alone or POP-eGFP (1200 ng; green). Blue: DAPI. (B) The relative amounts of AIM2PYD-mCherry filaments (300 ng plasmid) in HEK293T cells when co-transfected with POP-eGFP (+) or eGFP alone (-) (600 and 1200 ng plasmids). N≥4. (C) Sample fluorescent microscope images of HEK293T cells co-transfected with mCherry-tagged IFI16PYD (300 ng; crimson) plus eGFP alone or eGFP-tagged POPs (1200 ng; green). Blue: DAPI. (D) The relative amount of IFI16PYD-mCherry filaments (300 ng plasmid) in HEK293T cells when co-transfected with POP-eGFP (+) or eGFP alone (-) (600 and 1200 ng plasmids). N≥4. (E) Time-dependent increase in Förster resonance energy transfer (FRET) signals of a donor- and acceptor-labeled AIM2PYD (2.5 µM, black) was monitored with increasing concentrations of POP1 (25, 50, 100, and 150 µM), POP2 (12.5, 25, 50, and 75 µM), or POP3 (7.5, 15, 30, 40, and 50 µM); darker shades correspond to increasing POP concentrations. Arrows pointing upper right directions indicate the change (or lack thereof) in the elongation phase in the presence of the highest POP concentrations used. Data shown are representatives of at least three independent measurements (IC50s are average values of these experiments. n=3). (F) Negative-stain electron microscopy (nsEM) images of AIM2PYD filaments (2.5 µM) in the presence and absence of POP1 (100 µM), POP2 (50 µM), or POP3 (40 µM).
-
Figure 3—source data 1
Data values used in plots from Figure 3 and Figure 3—figure supplements 1–3.
- https://cdn.elifesciences.org/articles/81918/elife-81918-fig3-data1-v1.xlsx
Figure 3—figure supplement 1
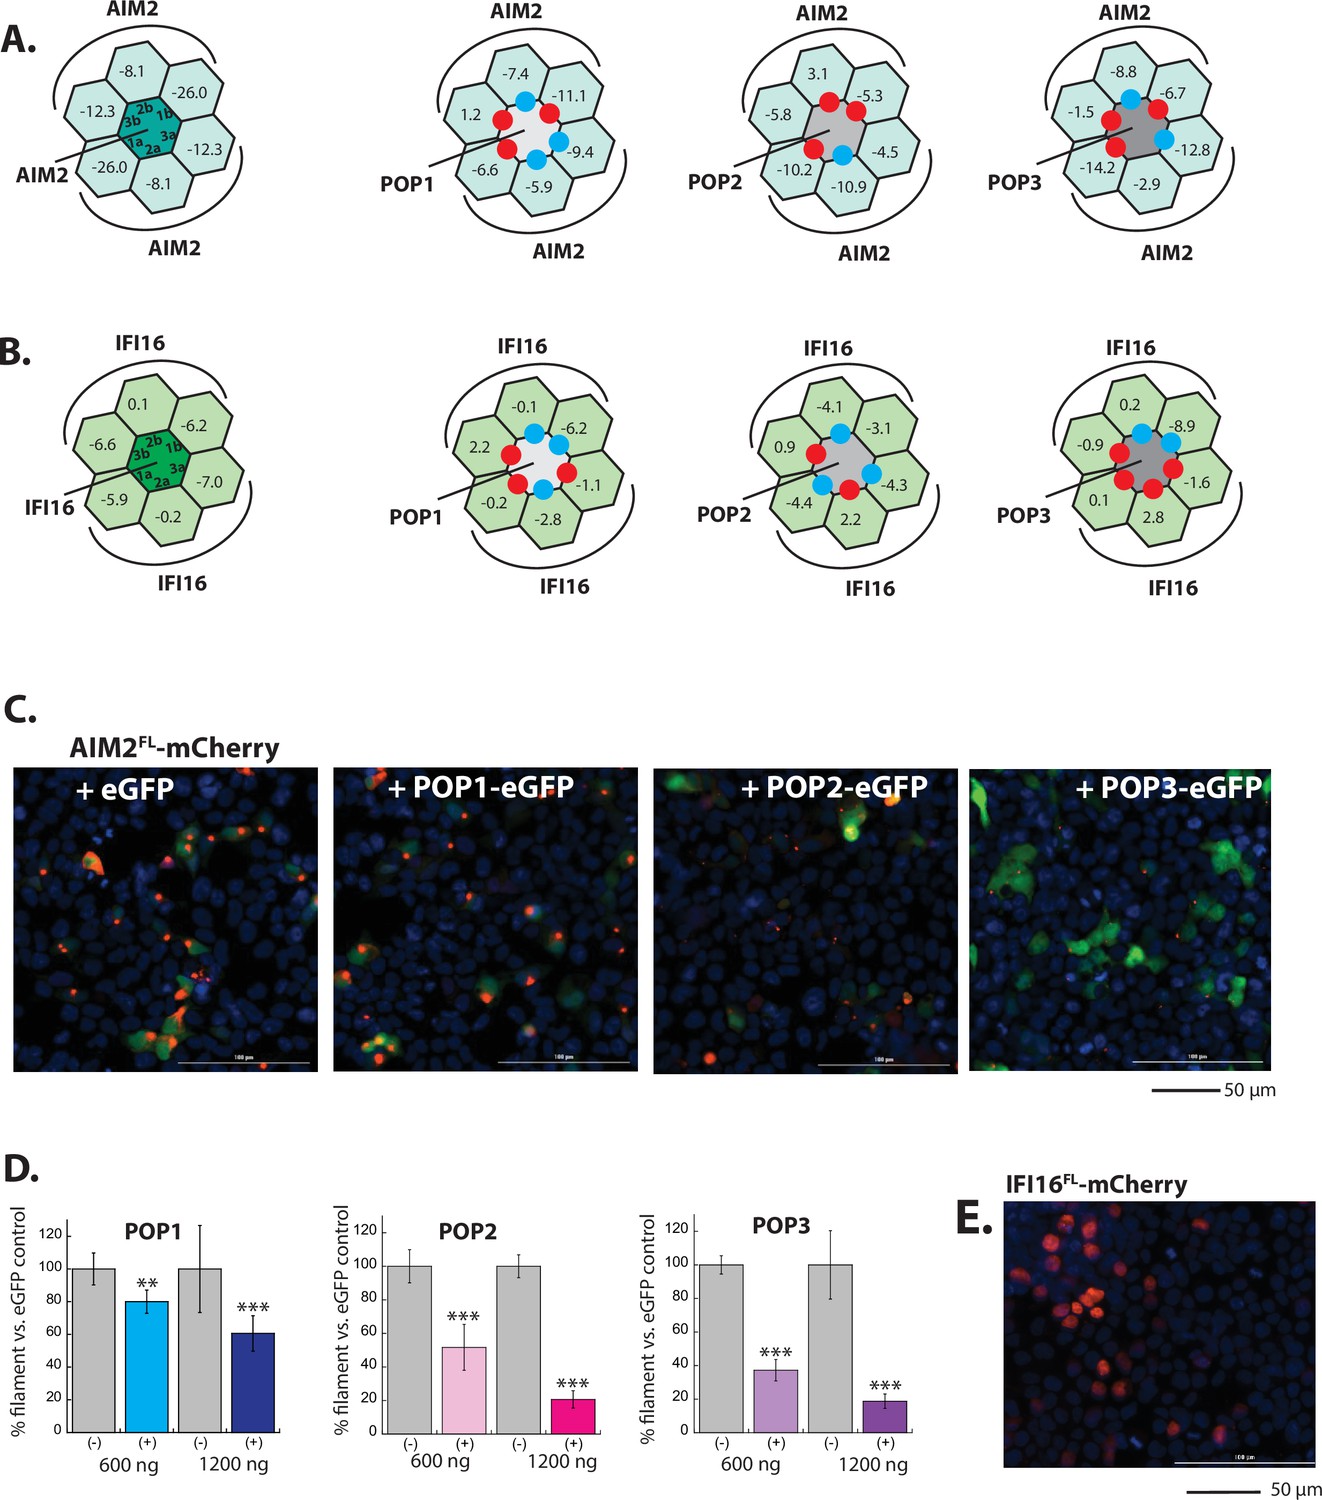
In silico and in cellulo analyses of POP•ALR interactions.
(A–B) Rosetta interface analyses results showing favorable (∆∆G≤3.5 reu, blue dots) and unfavorable (∆∆G≥10.0 reu, red dots) interactions between AIM2PYD (A)/IFI16PYD (B) and pyrin-only-proteins (POPs). For interferon inducible protein 16 (IFI16), we used ∆∆G≥5.0 reu or positive ∆Gs to identify unfavorable interactions due to the intrinsically weak interface energy scores. (D) Sample fluorescent microscope images of HEK293T cells co-transfected with mCherry-tagged AIM2FL (300 ng; crimson) plus eGFP alone or eGFP-tagged POPs (1200 ng; green). Blue: DAPI. (E) The relative amounts of AIM2FL-mCherry puncta (300 ng plasmid) in HEK293T cells when co-transfected with POP-eGFP (+) or eGFP alone (-) (600 and 120 ng plasmids). N≥4. (F) Sample fluorescent microscope images of HEK293T cells transfected with mCherry-tagged IFI16FL (300 ng; crimson). Note the overlap with DAPI staining (blue), thus its nuclear localization.
Figure 3—figure supplement 2
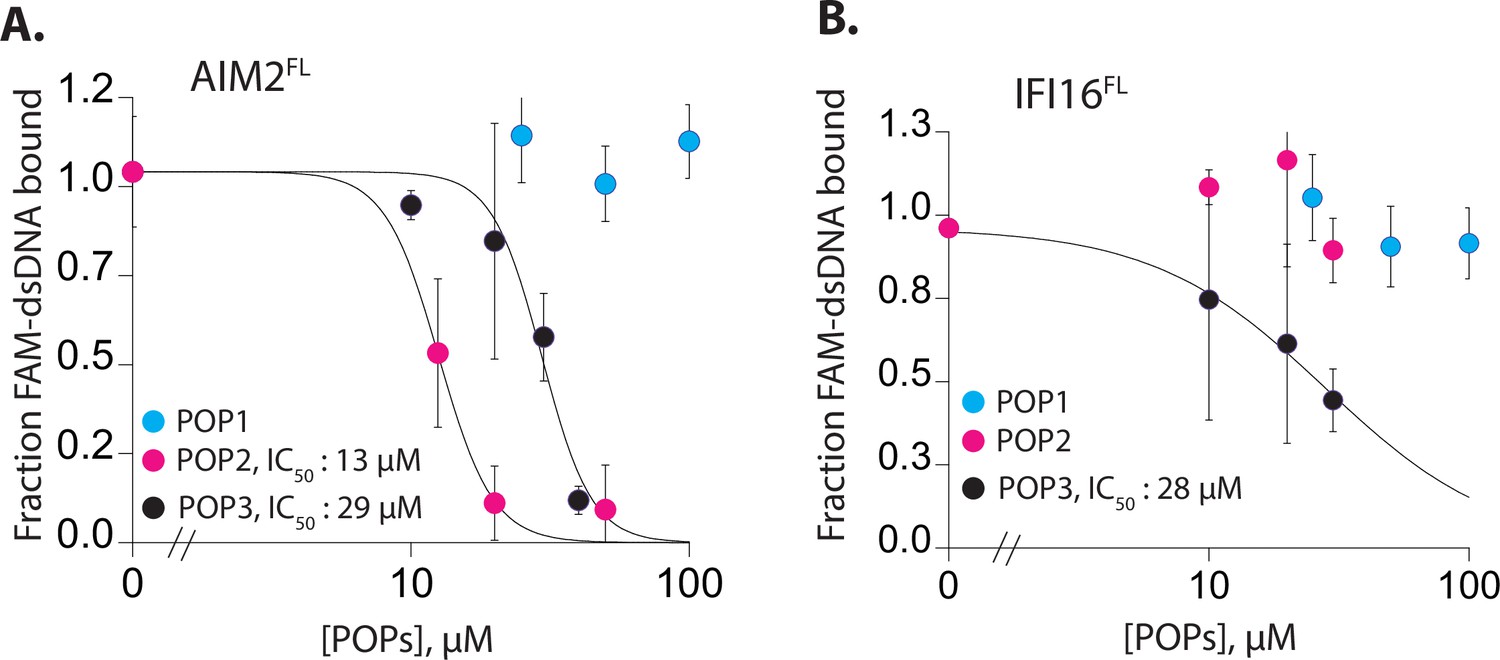
POPs inhibit the dsDNA binding activitiy of ALRs.
(A–B) Plots of fraction fluoresceine-amidate (FAM)-labeled 60 bp dsDNA (10 nM) bound to AIM2FL (100 nM, A) and interferon inducible protein 16 (IFI16) (200 nM, B) with increasing concentrations of pyrin-only-proteins (POPs). Shown is the average of two independent experiments for each POP.
Figure 3—figure supplement 3
POPs inhibit ALR oligomerization in cells.
(A) Sample fluorescent microscope images of HEK293T cells co-transfected with mCherry-tagged AIM2PYD (300 ng; crimson) plus the empty pCMV vector or the vector containing each pyrin-only-protein (POP) without any tags (1200 ng). Top panels are the mCherry channel only and the bottom panels are with DAPI. (B) The relative amounts of AIM2PYD-mCherry filaments (300 ng plasmid) in HEK293T cells when co-transfected with each untagged POP or empty vector (1200 ng plasmids). N=3. (C–F) Same experimental conditions and analyses as (A) and (B), but with IFI16PYD-mCherry (C–D) and AIM2FL-mCherry (E–F).
Figure 4 with 2 supplements
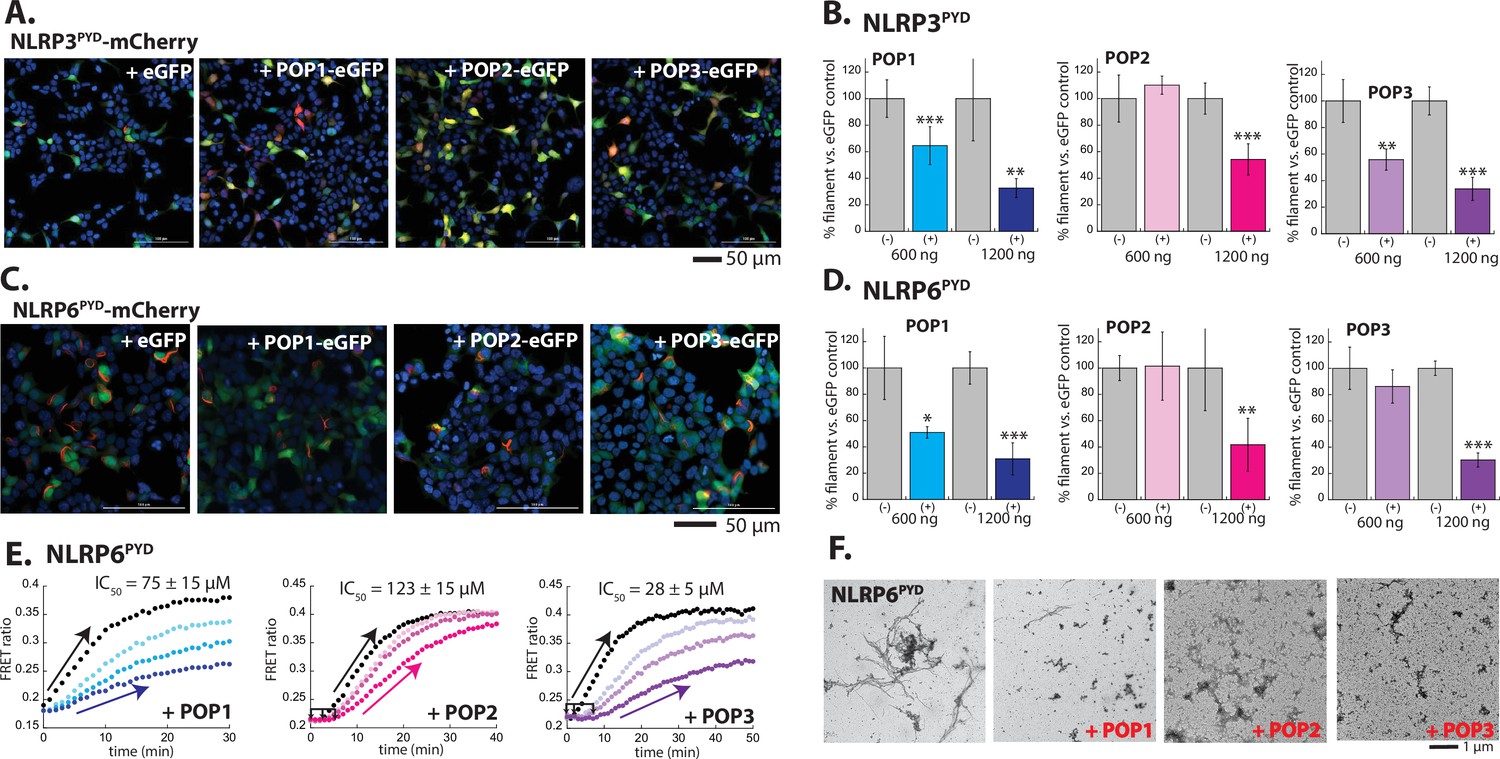
Inhibition of NLRPPYD assembly by pyrin-only-proteins (POPs).
(A) Sample fluorescent microscope images of HEK293T cells co-transfected with mCherry-tagged NLRP3PYD (600 ng; crimson) plus eGFP alone or eGFP-tagged POPs (1200 ng; green). Blue: DAPI. (B) The relative amounts of NLRP3PYD-mCherry filaments (600 ng plasmid) in HEK293T cells when co-transfected with POP-eGFP (+) or eGFP alone (-) (600 and 120 ng plasmids). N≥4. (C) Sample fluorescent microscope images of HEK293T cells co-transfected with mCherry-tagged NLRP6PYD (300 ng; crimson) plus eGFP alone or eGFP-tagged POPs (1200 ng; green). Blue: DAPI. (D) The relative amounts of NLRP6PYD-mCherry filaments (300 ng plasmid) in HEK293T cells when co-transfected with POP-eGFP (+) or eGFP alone (-) (600 and 120 ng plasmids). N≥4. (E) Time-dependent increase in Förster resonance energy transfer (FRET) signals of a donor- and acceptor-labeled NLRP6PYD (2.5 µM, black) was monitored with increasing concentrations of POP1 (25, 50, and 100 µM). POP2 (30, 60, and 120 µM). POP3 (15, 30, and 60 µM); darker color shades correspond to increasing POP concentrations. Two- and three-headed arrows indicate the increase in apparent nucleation time. Arrows pointing upper right directions indicate the change (or lack thereof) in the elongation phase in the presence of the highest POP concentrations used. Data shown are representatives of at least three independent measurements (IC50s are average values of these experiments. N=3). (F) Negative-stain electron microscopy (nsEM) images of NLRP6PYD filaments (5 µM) in the presence and absence of POP1 (100 µM), POP2 (30 µM), or POP3 (30 µM).
-
Figure 4—source data 1
Data values used in plots from Figure 4 and Figure 4—figure supplement 2.
- https://cdn.elifesciences.org/articles/81918/elife-81918-fig4-data1-v1.xlsx
Figure 4—figure supplement 1
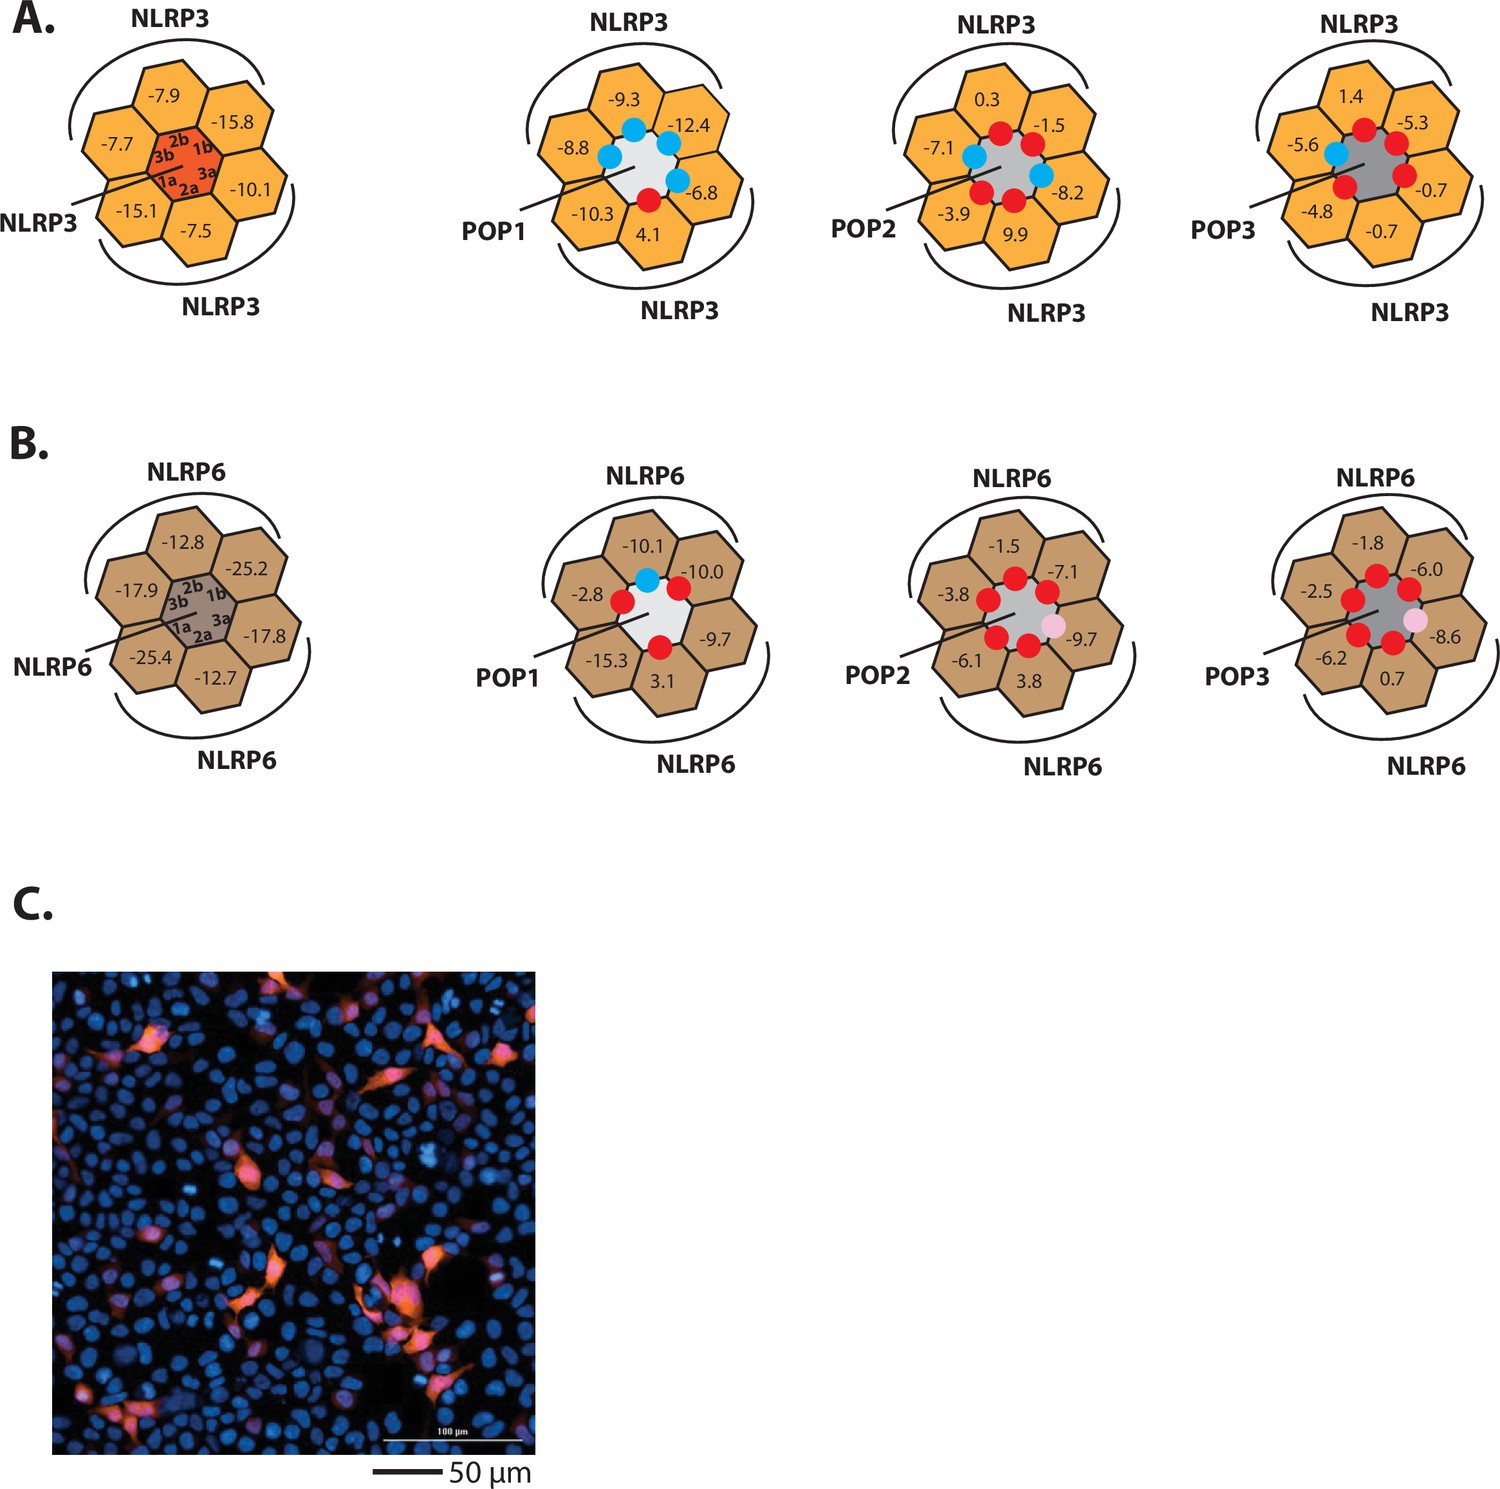
Investigating the interactions between POPs and NLRPs.
(A–B) Rosetta interface analyses results showing favorable (∆∆G≤3.5 reu, blue dots) and unfavorable (∆∆G≥10 reu, red dots) interactions between NLRP3PYD (A)/NLRP6PYD(B) and pyrin-only-proteins (POPs). Pink dots indicate interfaces that might allow the recognition between NLRP6PYD and POPs (∆G~9 reu). (C) Sample fluorescent microscope images of HEK293T cells transfected with mCherry-tagged NLRP2PYD (1000 ng; crimson). Blue: DAPI.
Figure 4—figure supplement 2
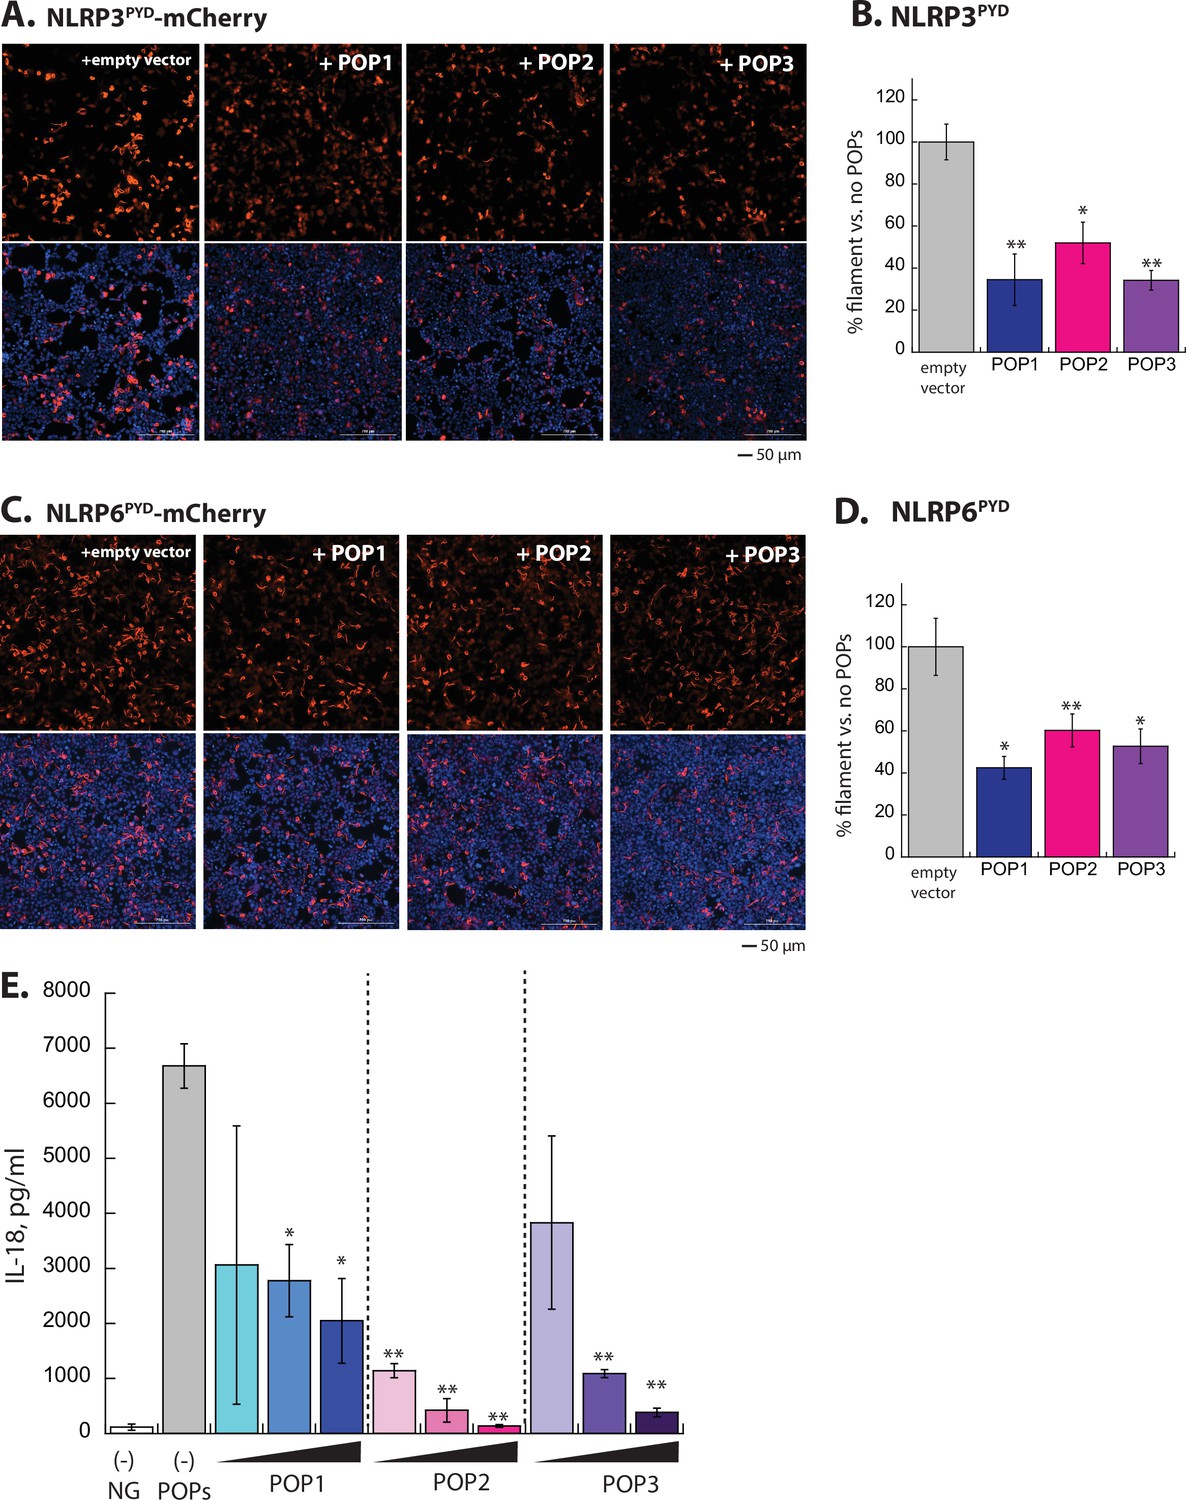
Experiments for testing the effect of POPs in NLRP oligomerization and signaling.
(A) Sample fluorescent microscope images of HEK293T cells co-transfected with mCherry-tagged NLRP3PYD (600 ng; crimson) plus the empty pCMV vector or the vector containing each pyrin-only-protein (POP) without any tags (1200 ng). Top panels are the mCherry channel only and the bottom panels are with DAPI. (B) The relative amounts of NLRP3PYD-mCherry filaments (600 ng plasmid) in HEK293T cells when co-transfected with each untagged POP or empty vector (1200 ng plasmids). N=3. (C–D) Same experimental conditions and analyses as (A) and (B), but with NLRP6PYD-mCherry (300 ng). (E) IL-18 release upon activating NLRP3 by nigericin was monitored by ELISA in the presence and absence of increasing POPs (250, 500, and 1000 ng). n=3. Of note, performing the t-test comparing the results from POP1 and POP3 at 500 ng yields p=0.042, thus indicating that POP3 is more effective than POP1.
Figure 5 with 1 supplement
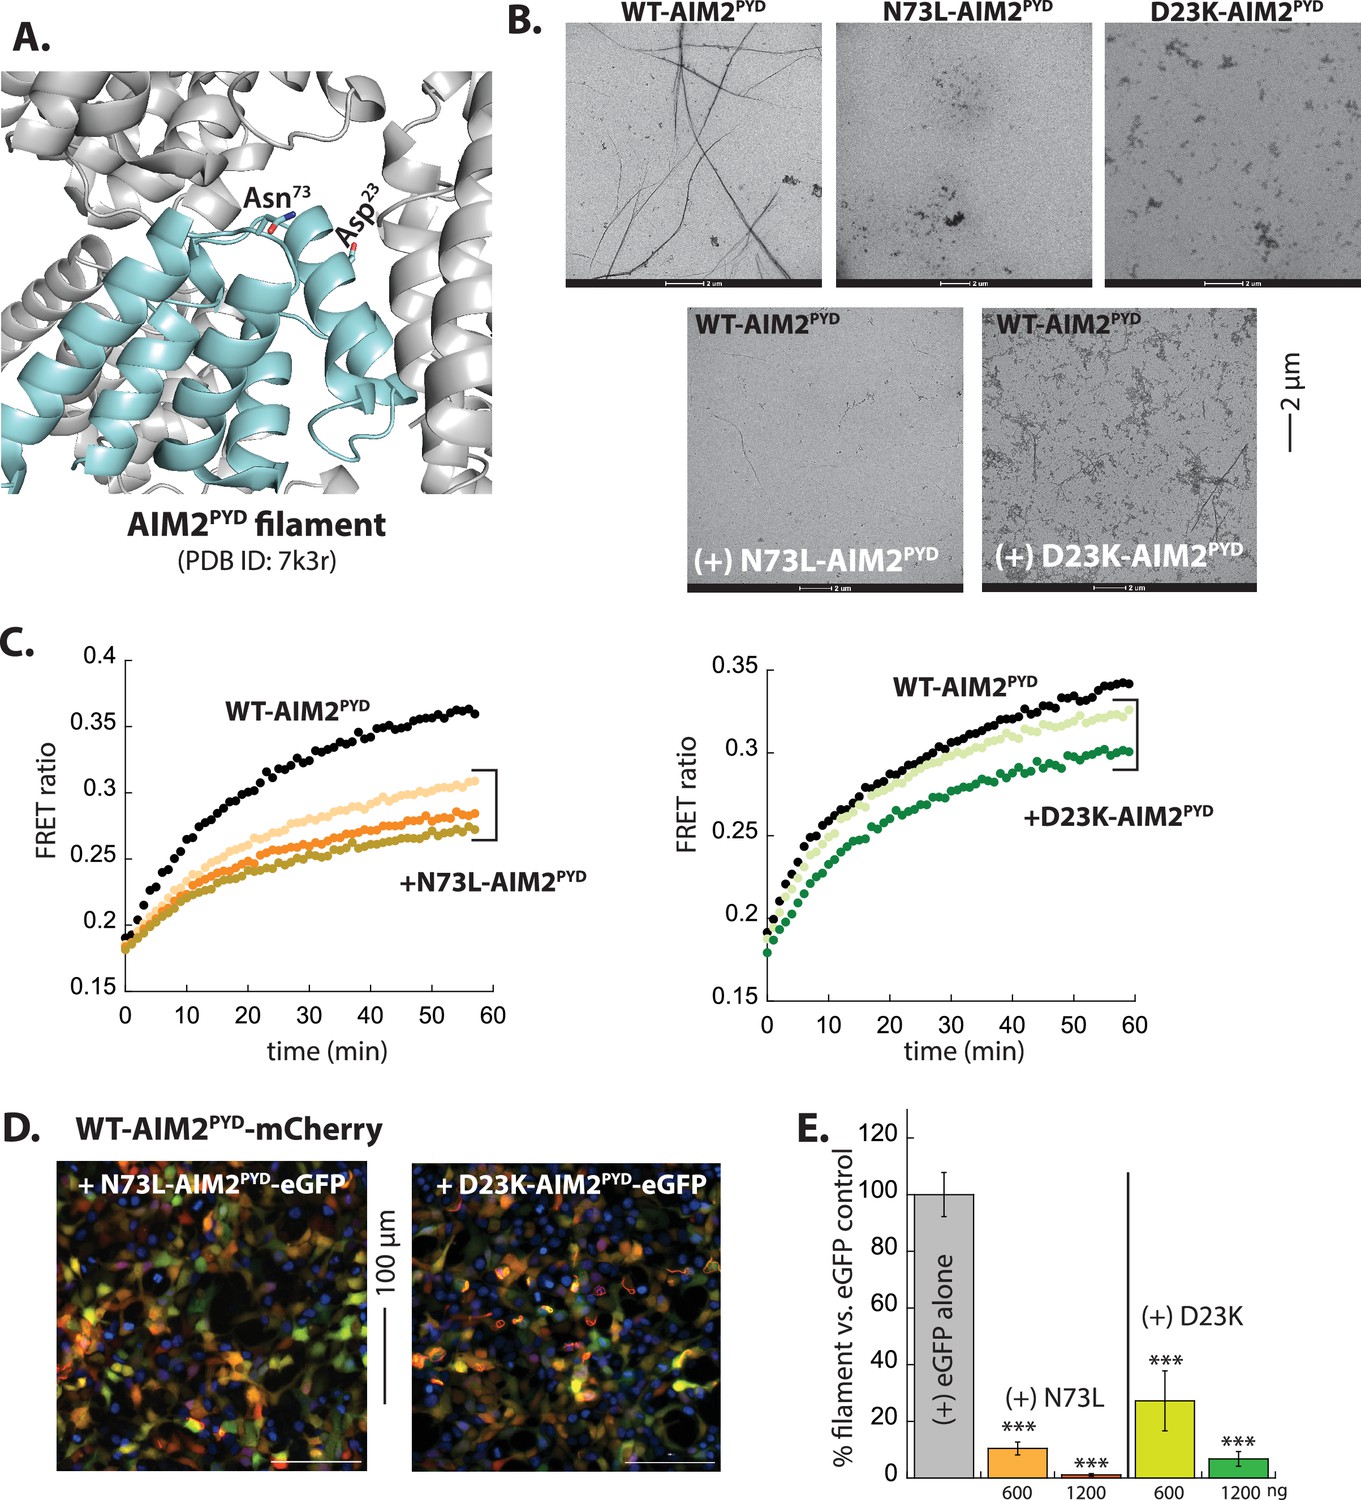
Reprogramming AIM2PYD into a pyrin-only-protein (POP)-like inhibitor.
(A) AIM2PYD filament ‘honeycomb’ showing the location of mutations. (B) Negative-stain electron microscopy (nsEM) images of AIM2PYD variants. WT: 2.7 µM, N73L: 3 µM, D23K: 30 µM. (C) Time-dependent increase in Förster resonance energy transfer (FRET) signals of a donor- and acceptor-labeled WT-AIM2PYD (2.5 µM, black) was monitored with increasing concentrations of AIM2PYD mutants (1 (brown), 2 (orange), and 3 (mustard) µM for N73L; 15 (light green) and 30 (dark green) µM for D23K). Data shown are representatives of at least three independent measurements. (D) Sample fluorescent microscope images of HEK293T cells co-transfected with mCherry-tagged AIM2PYD (300 ng plasmid; crimson) plus eGFP-tagged N73L- or D23K-AIM2PYD (1200 ng plasmids; green). Blue: DAPI. (E) The relative amount of AIM2PYD-mCherry filaments (300 ng plasmid) in HEK293T cells when co-transfected with N73L or D23K mutants (600 and 1200 ng plasmids). n≥4.
-
Figure 5—source data 1
Data values used in plots from Figure 5.
- https://cdn.elifesciences.org/articles/81918/elife-81918-fig5-data1-v1.xlsx
Figure 5—figure supplement 1
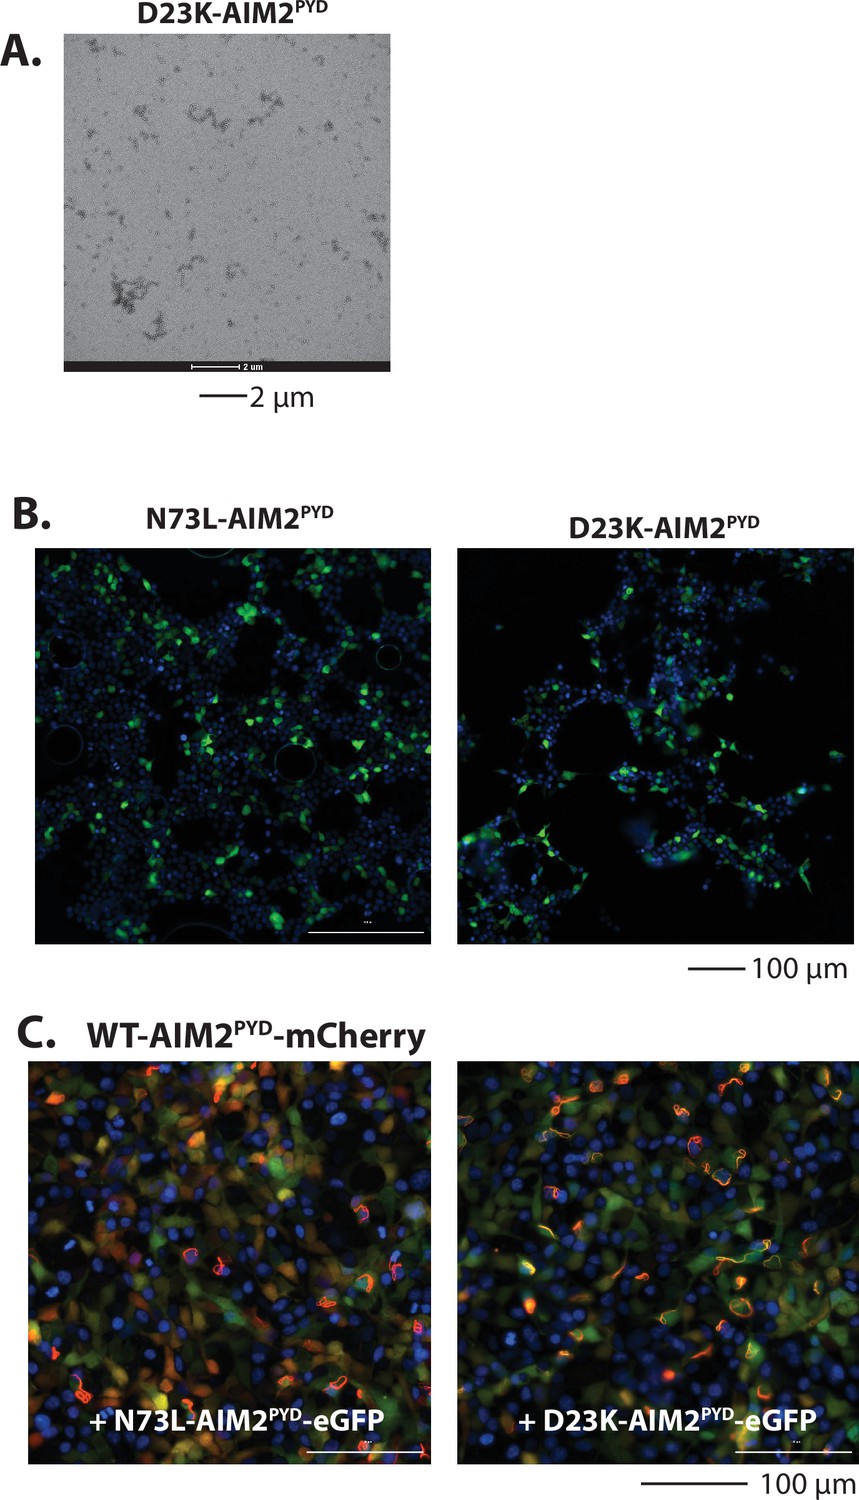
Reprogramming AIM2PYD as POP-like inhibitors.
(A) A sample negative-stain electron microscopy (nsEM) image of D23K-AIM2PYD at 15 µM. (B) Sample fluorescent microscope images of HEK293T cells transfected with eGFP tagged N73L- and D23K-AIM2PYD (600 ng). Blue: DAPI. (C) Sample fluorescent microscope images of HEK293T cells co-transfected with mCherry-tagged AIM2PYD (300 ng; crimson) plus eGFP-tagged N73L- or D23K-AIM2PYD (600 ng; green). Blue: DAPI.
Figure 6 with 1 supplement
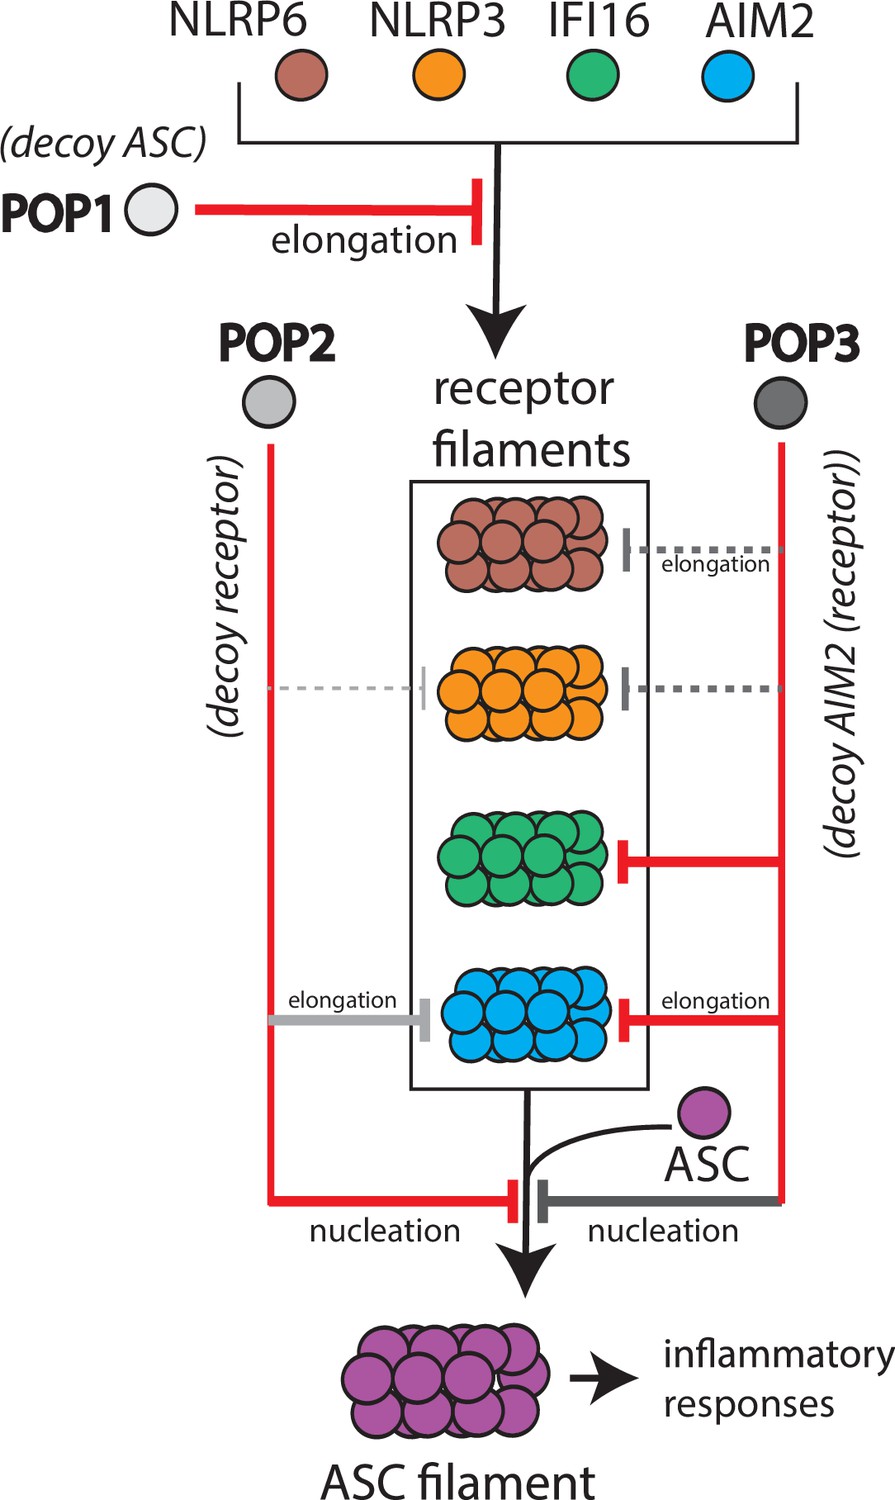
Target selection and mode of inhibition of pyrin-only-proteins (POPs).
A cartoon summarizing the refined intrinsic target specificity of POPs. Solid red lines indicate the most likely primary inhibitory targets for each POP. Solid gray lines indicate an additional target that each POP could also directly inhibit. Dotted gray lines indicate other possible targets for each POP.
Figure 6—figure supplement 1
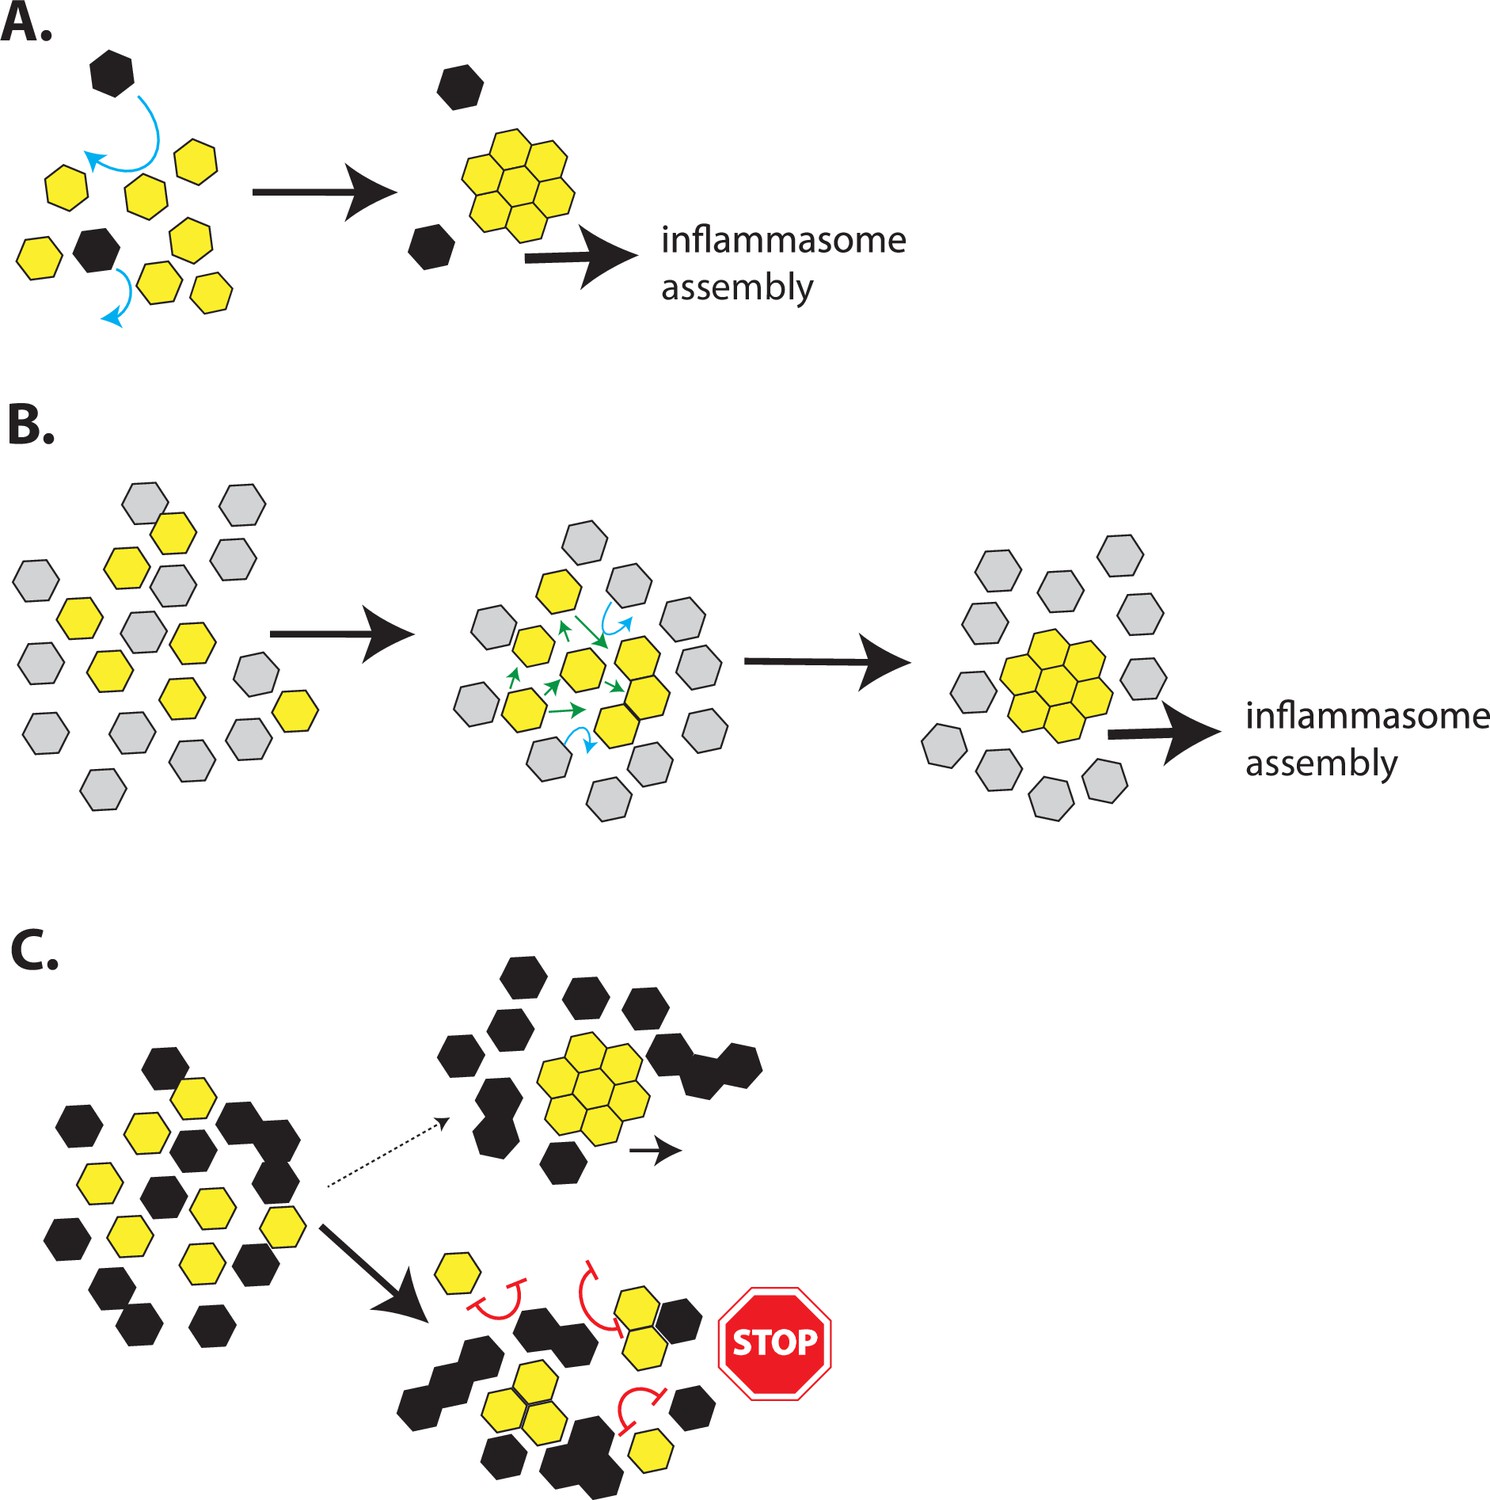
A model for inflammasome assembly by POPs.
(A) A cartoon describing the assembly of inflammasome pyrin-domains (PYDs) in the presence of a basal level of pyrin-only-proteins (POPs). The more favorable homotypic PYD•PYD interactions would readily outcompete any weak/transient interactions between POPs and PYDs (blue arrows). (B) A cartoon describing a possible reason why POP1 cannot inhibit apoptosis-associated speck-forming protein-containing caspase-recruiting domain (ASC). Because POP1 does not have any strong unfavorable (repulsive) interactions with ASC, the weaker POP•PYD interactions would be easily outcompeted by homotypic PYD•PYD interactions (green arrows) without preventing filament assembly. (C) A cartoon describing the inhibition of PYD filament assembly by excess POPs. Favorable ∆Gs between POPs and PYDs would allow them to interact transiently, exposing an array of unfavorable (repulsive) interactions that would impede filament assembly (red double-headed blunt arrows). Consequently, inflammasome PYDs would remain either monomeric or trapped into nonfunctional oligomers. The oligomerization of POP2/3 would also allow multipartite interactions with target PYDs to further enhance their inhibitory effects.
Author response image 1

Author response image 2

The NLRP3PYD filament.
The colored region is thought to mediate dimerization.
Tables
Author response table 1
Rosetta interface energy scores between PYD•PYD and PYD•POP interaction on the putative dimer seen from the crystal structure of NLRP3PYD.
| Self | POP1 | POP2 | POP3 | |
|---|---|---|---|---|
| ASCPYD | -6.6 | -5.6 | -5.2 | -4.4 |
| AIM2PYD | -4.0 | 2.1 | 1.3 | 0.8 |
| IFI16PYD | 46.6 | -5.6 | 2.6 | 10.8 |
| NLRP3PYD | -17.2 | -8.6 | -3.7 | -15.1 |
| NLRP6PYD | -6.6 | 0.1 | -5.6 | -3.3 |
Additional files
Download links
A two-part list of links to download the article, or parts of the article, in various formats.
Downloads (link to download the article as PDF)
Open citations (links to open the citations from this article in various online reference manager services)
Cite this article (links to download the citations from this article in formats compatible with various reference manager tools)
Design principles for inflammasome inhibition by pyrin-only-proteins
eLife 13:e81918.
https://doi.org/10.7554/eLife.81918


