A genetic variant of fatty acid amide hydrolase (FAAH) exacerbates hormone-mediated orexigenic feeding in mice
- Hotchkiss Brain Institute, University of Calgary, Canada
- Neurohomeostasis Research Group, Department of Psychiatry and Psychotherapy, University Hospital Bonn, Germany
- Monell Chemical Senses Center and Department of Neuroscience, University of Pennsylvania, United States
- Department of Psychiatry and Behavioral Sciences, University of Washington, United States
- Weill Cornell Medical College, Cornell University, United States
- Texas Tech University, School of Veterinary Medicine, United States
Figures
Figure 1 with 1 supplement
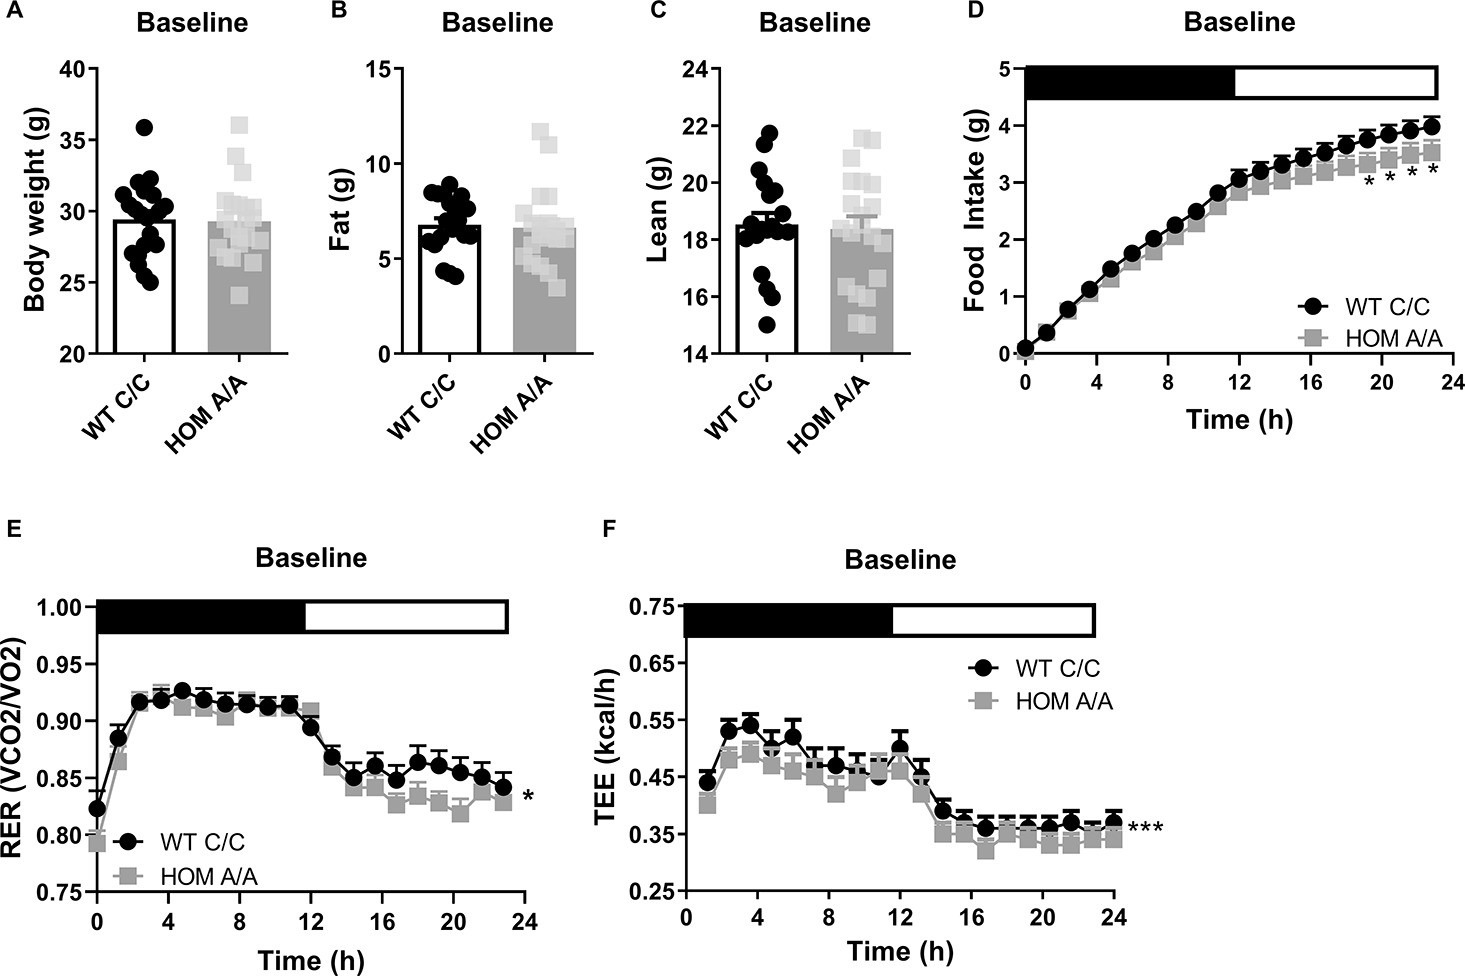
The fatty acid amide hydrolase (FAAH) C385A variant has no effect on baseline body weight or body composition.
(A–C) Under basal conditions, there is no effect of the FAAH C385A variant on body weight (T(39) = 0.1516, p=0.88), fat mass (T(39) = 0.2640, p=0.79), or lean mass (T(39) = 0.4219, p=0.6754). (D–F) By contrast, the C385A variant modifies underlying metabolic parameters, wherein FAAH A/A (HOM) mice present reduced food intake (genotype × time: F(76, 2360.107)=1.238, p=0.082 plus post hoc testing), decreased respiratory exchange ratio (RER) (genotype: F(1,197.189)=6.406, p=0.012), and decreased energy expenditure (genotype: F(1, 387.547)=22.949, p<0.001) compared to FAAH C/C (wild-type [WT]) mice. For panels (A–C), n=20 WT; n=21 HOM. For panels (D–F), n=17 per genotype. Data are presented as means ± SEM, and in Panel (F) estimated means adjusted for body weight are presented. Panels (A–C) were analyzed by unpaired Student’s t-tests. Panels (D–F) were analyzed by linear mixed models with repeated measured. Asterisks denote significant genotype effect. *p<0.05, ***p<0.001.
-
Figure 1—source data 1
Basal Body Weight of FAAH C/C and FAAH A/A mice across ages.
- https://cdn.elifesciences.org/articles/81919/elife-81919-fig1-data1-v2.xlsx
Figure 1—figure supplement 1

Basal Body Weight of FAAH C/C and FAAH A/A mice across ages.
Figure 2 with 2 supplements
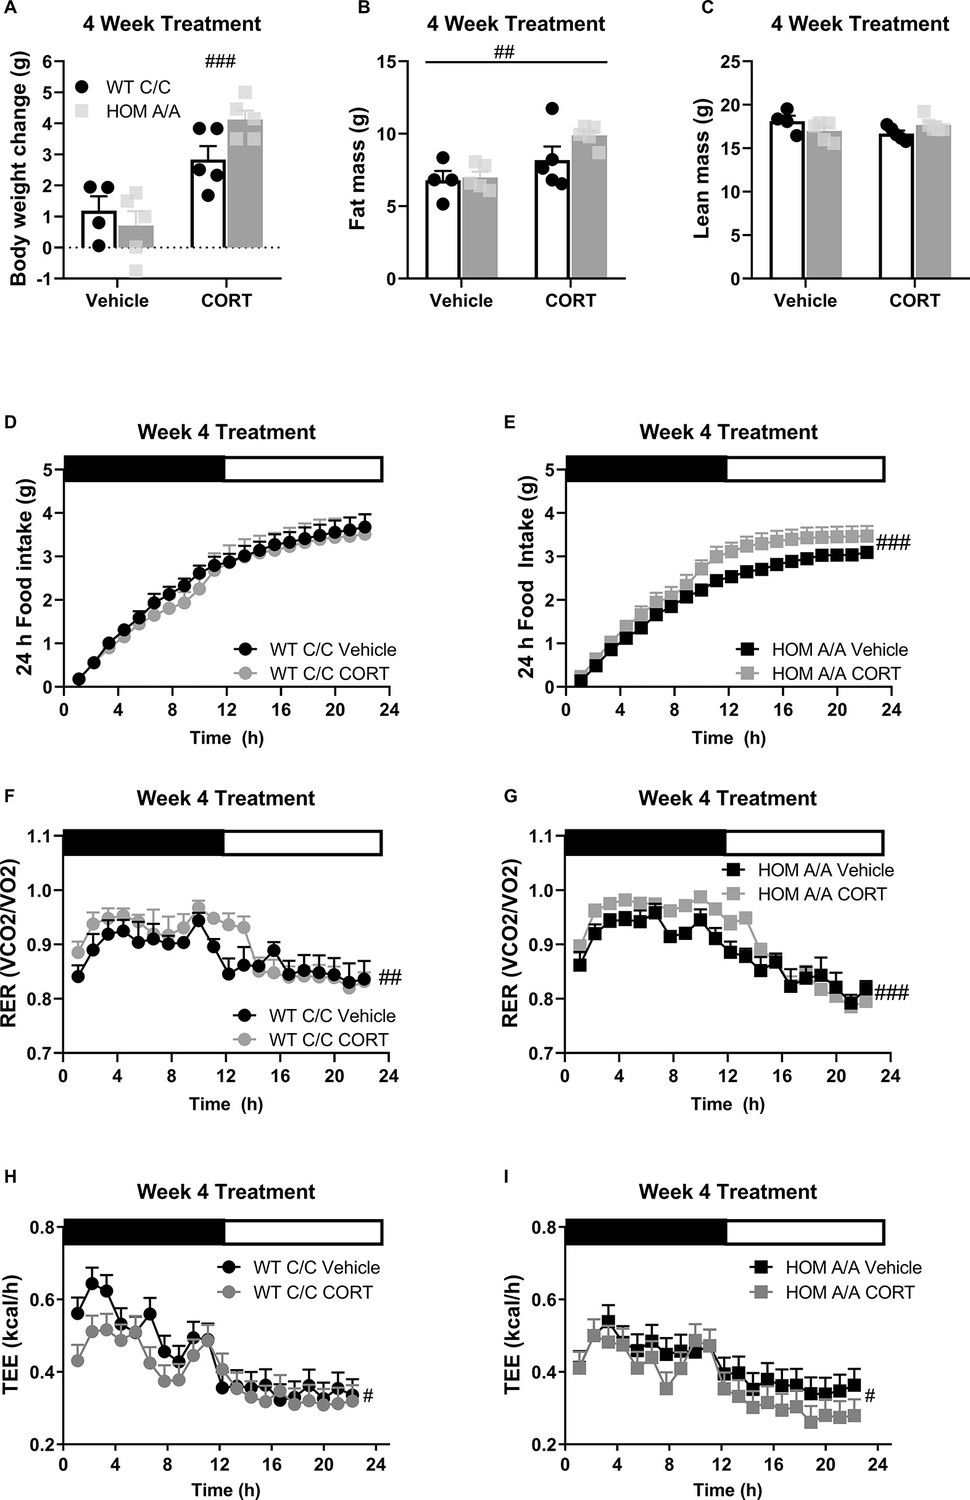
Fatty acid amide hydrolase (FAAH) A/A mice show exaggerated body weight gain and food intake on account of prolonged corticosterone (CORT).
(A) Body weight gain was increased following 4 weeks of CORT treatment (25 µg/ml in drinking water) (treatment F(1,15) = 6.65, p<0.001), where only CORT-treated HOM A/A mice gained significantly more weight than their vehicle-treated counterparts. CORT-treated wild-type (WT) C/C mice did not gain significantly more weight than vehicle-treated WT C/C mice (treatment × genotype = F(1,15)=4.456, p=0.052 plus post hoc testing). (B) Fat mass was increased from 4 weeks of CORT exposure independent of genotype (treatment F(1, 15)=11.66, p=0.004). (C) A significant interaction was detected for lean mass (treatment × genotype: F(1, 15)=5.111, p=0.0391) but Bonferroni’s post hoc testing revealed no effect of either genotype or prolonged CORT exposure. (D–E) Whereas 4 weeks of CORT treatment did not affect cumulative food intake measured over 24 hr in FAAH C/C mice (treatment: F(1, 20.758)=0.820, p=0.320), it significantly increased food intake in FAAH A/A mice (treatment: F(1, 24.770)=24.538, p<0.001). (F–G) Regardless of genotype, 4 weeks of CORT exposure increased respiratory exchange ratio (RER) (treatment: WT (F(1, 47.659)=4.289, p=0.044); HOM F(1, 68.057)=19.493, p<0.001), (H–I) whereas decreased energy expenditure measure over 24 hr (treatment: WT F(1, 47.659)=4.289, p=0.044; HOM F(1, 68.057)=19.493, p<0.001). For panels (A–I), n=4 WT-vehicle; n=5 WT-CORT, n=5 HOM-vehicle; n=5 HOM-CORT. Data are presented as means ± SEM, and in Panels (H and I) estimated means adjusted for body weight are presented. Panels (A–C) were analyzed by two-way ANOVAs. Panels (D–I) were analyzed by linear mixed models with repeated measures. Pound signs denote significant treatment effect. Asterisks denote significant genotype effect. *p<0.05, #p<0.05, ##p<0.01, ###p<0.001.
-
Figure 2—source data 1
Endocrine measures in FAAH C385A mice at baseline and under Vehicle and CORT conditions.
- https://cdn.elifesciences.org/articles/81919/elife-81919-fig2-data1-v2.xlsx
Figure 2—figure supplement 1

Endocrine measures in FAAH C385A mice at baseline and under Vehicle and CORT conditions.
Figure 2—figure supplement 2

Feeding throughout the 4-week treatment regime in FAAH C/C and FAAH A/A mice.
Figure 3 with 4 supplements
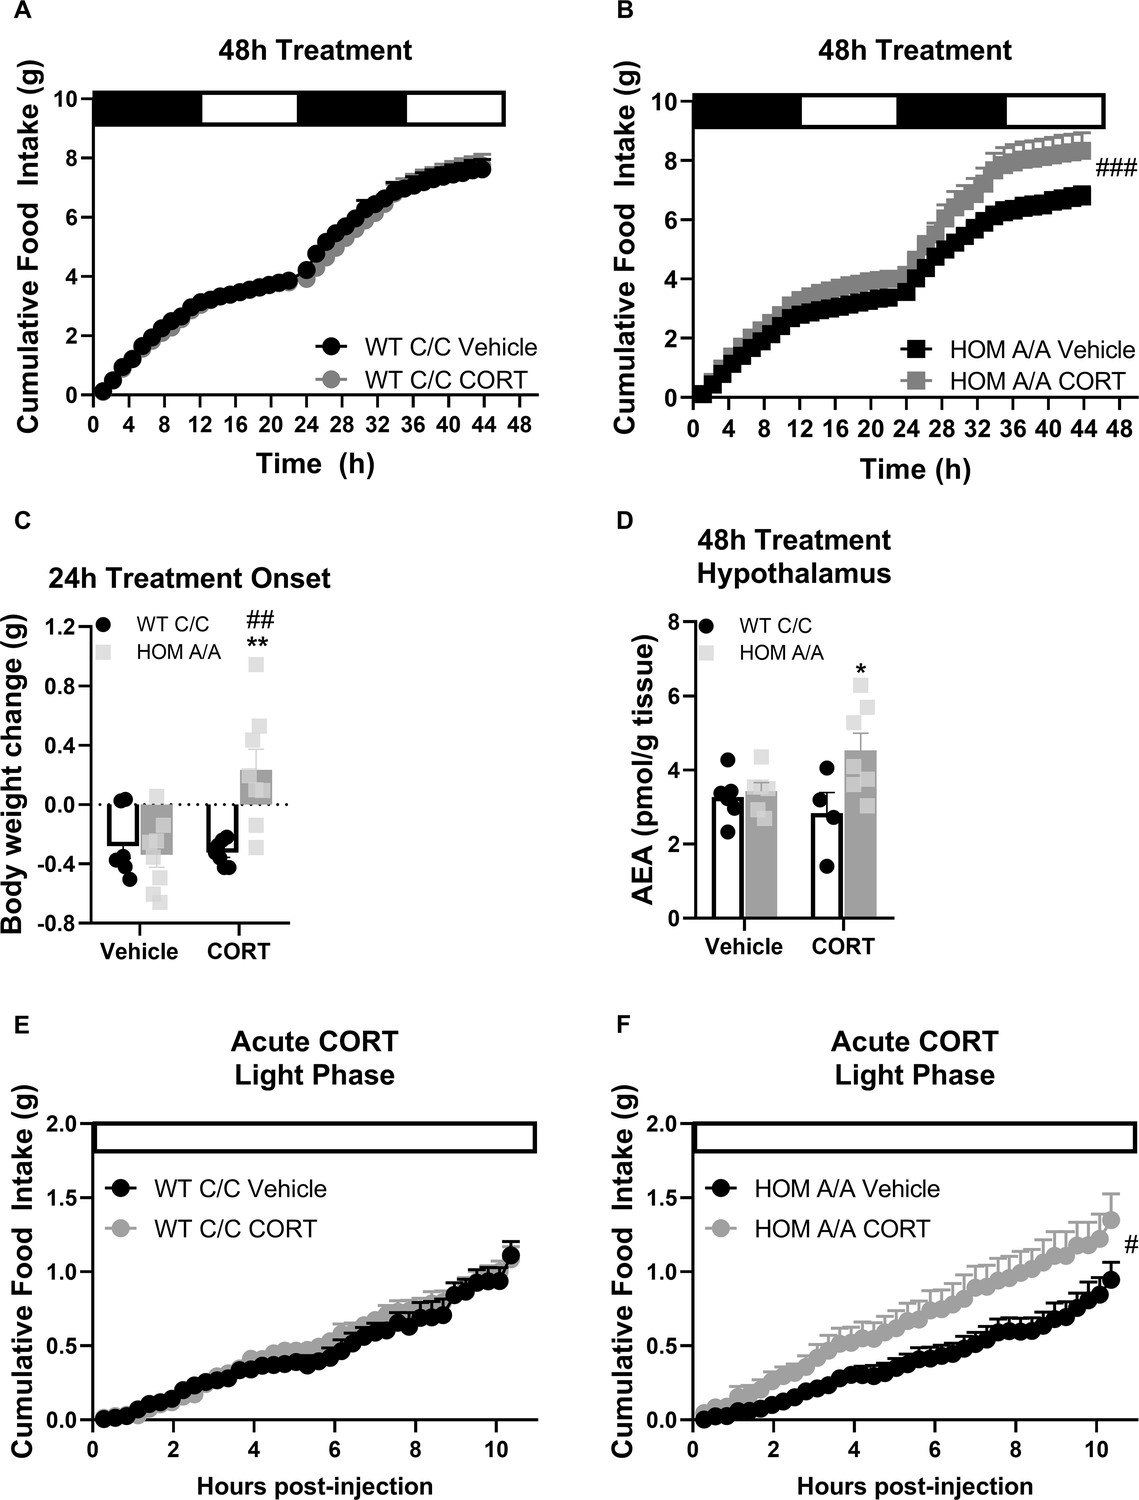
Fatty acid amide hydrolase (FAAH) A/A mice are hyperresponsive to the immediate orexigenic effects of corticosterone (CORT).
(A–B) Within the first 48hr of treatment onset, CORT exposure (25 µg/ml in drinking water) had no effect on cumulative food intake in FAAH C/C (wild-type [WT]) mice (treatment: F(1, 57.970)=0.600, p=0.442) whereas it significantly increased food intake in FAAH A/A (HOM) mice (treatment: F(1, 55.289)=17.202, p<0.001). (C) Within 24 hr of treatment onset, CORT exposure led to weight gain exclusively in FAAH A/A mice (treatment × genotype: F(1, 26)=10.06, p=0.004 plus Bonferroni’s post hoc testing). (D) Likewise, hypothalamic AEA levels were increased from 48 hr CORT treatment exclusively in FAAH A/A mice (treatment × genotype: F(1, 20)=4.177, p=0.054 plus Bonferroni’s post hoc testing). (E–F) Acute CORT (3 mg/kg, single i.p. injection) again had no effect on cumulative food intake in FAAH C/C mice (treatment: F(1, 20.236)=0.482, p=0.495) yet increased light phase food intake in FAAH A/A mice (within the initial 10 hr following CORT injections) (treatment: F(1, 14.720)=4.729, p=0.046). For Panel (A): n=9 per group. For Panel (B), n=10 HOM-vehicle; n=11 HOM-CORT. For Panel (C), n=7 WT-vehicle; n=7 WT-CORT; n=8 HOM-vehicle; n=8 HOM_CORT. For Panel (D), n=7 WT-vehicle; n=4 WT-CORT; n=6 HOM-vehicle; n=7 HOM-CORT. For Panel (E) n=8 per group. For Panel (F): n=8 HOM-vehicle; n=7 HOM-CORT. Data are presented as means ± SEM. Panels (A–B) and (E–F) were analyzed by linear mixed models with repeated measures. Panels (C–D) were analyzed by two-way ANOVAs. Pound signs denote significant treatment effect. Asterisks denote significant genotype effect. *p<0.05, **p<0.01, #p<0.05, ##p<0.01, ###p<0.001.
-
Figure 3—source data 1
Substrate utilization and energy expenditure throughout the 48h treatment regime in FAAH C385A mice.
- https://cdn.elifesciences.org/articles/81919/elife-81919-fig3-data1-v2.xlsx
Figure 3—figure supplement 1

Substrate utilization and energy expenditure throughout the 48h treatment regime in FAAH C385A mice.
Figure 3—figure supplement 2

Home-cage activity at baseline and throughout 24h CORT treatment in FAAH C/C and FAAH A/A mice.
Figure 3—figure supplement 3

Anandamide (AEA) levels measured in distinct brain regions and peripheral tissues of FAAH C385A mice after 48h Vehicle or CORT treatment.
Figure 3—figure supplement 4
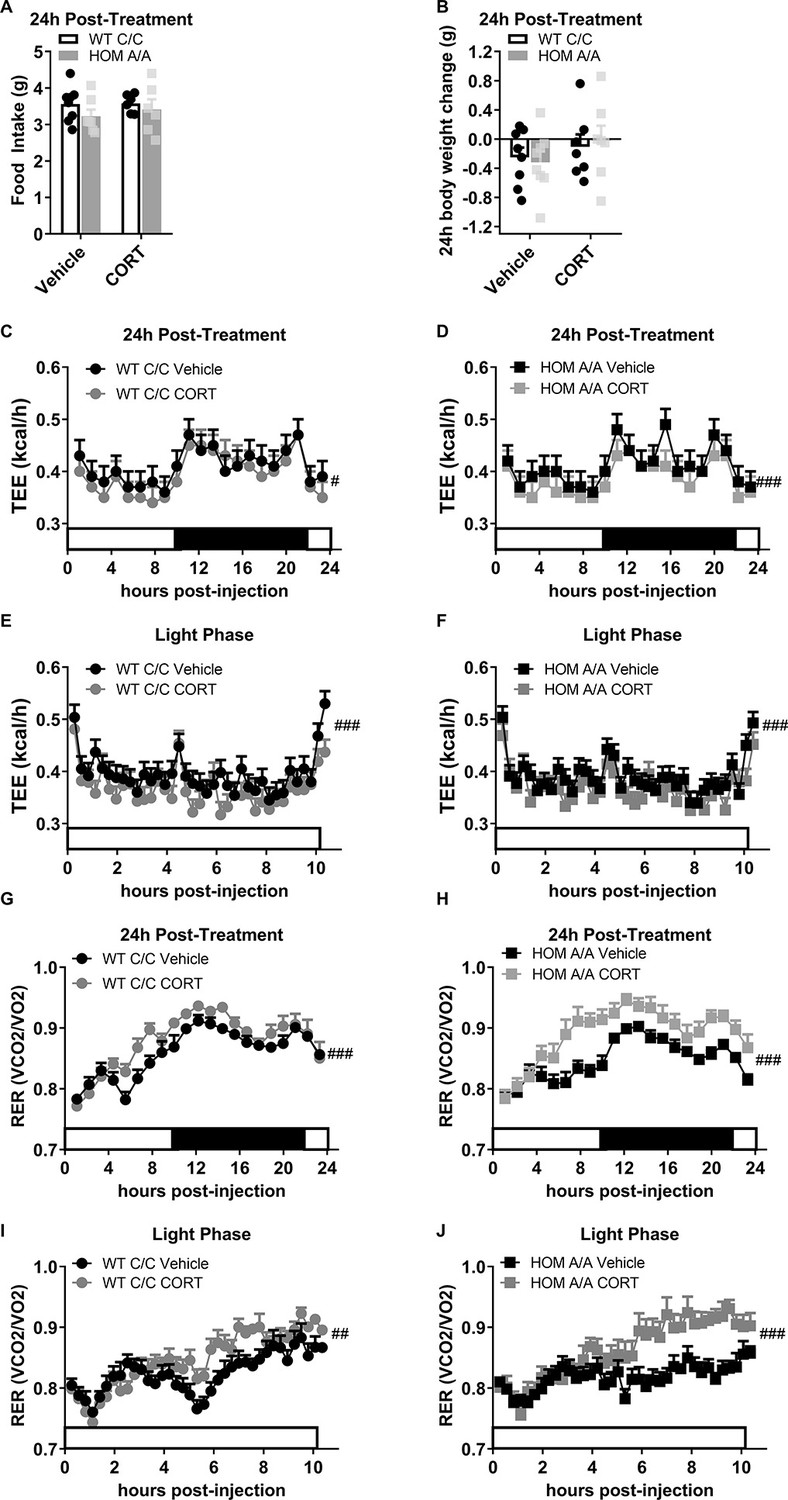
The lasting effects of acute CORT on metabolic outcomes in FAAH C/C and FAAH A/A mice.
Figure 4 with 1 supplement
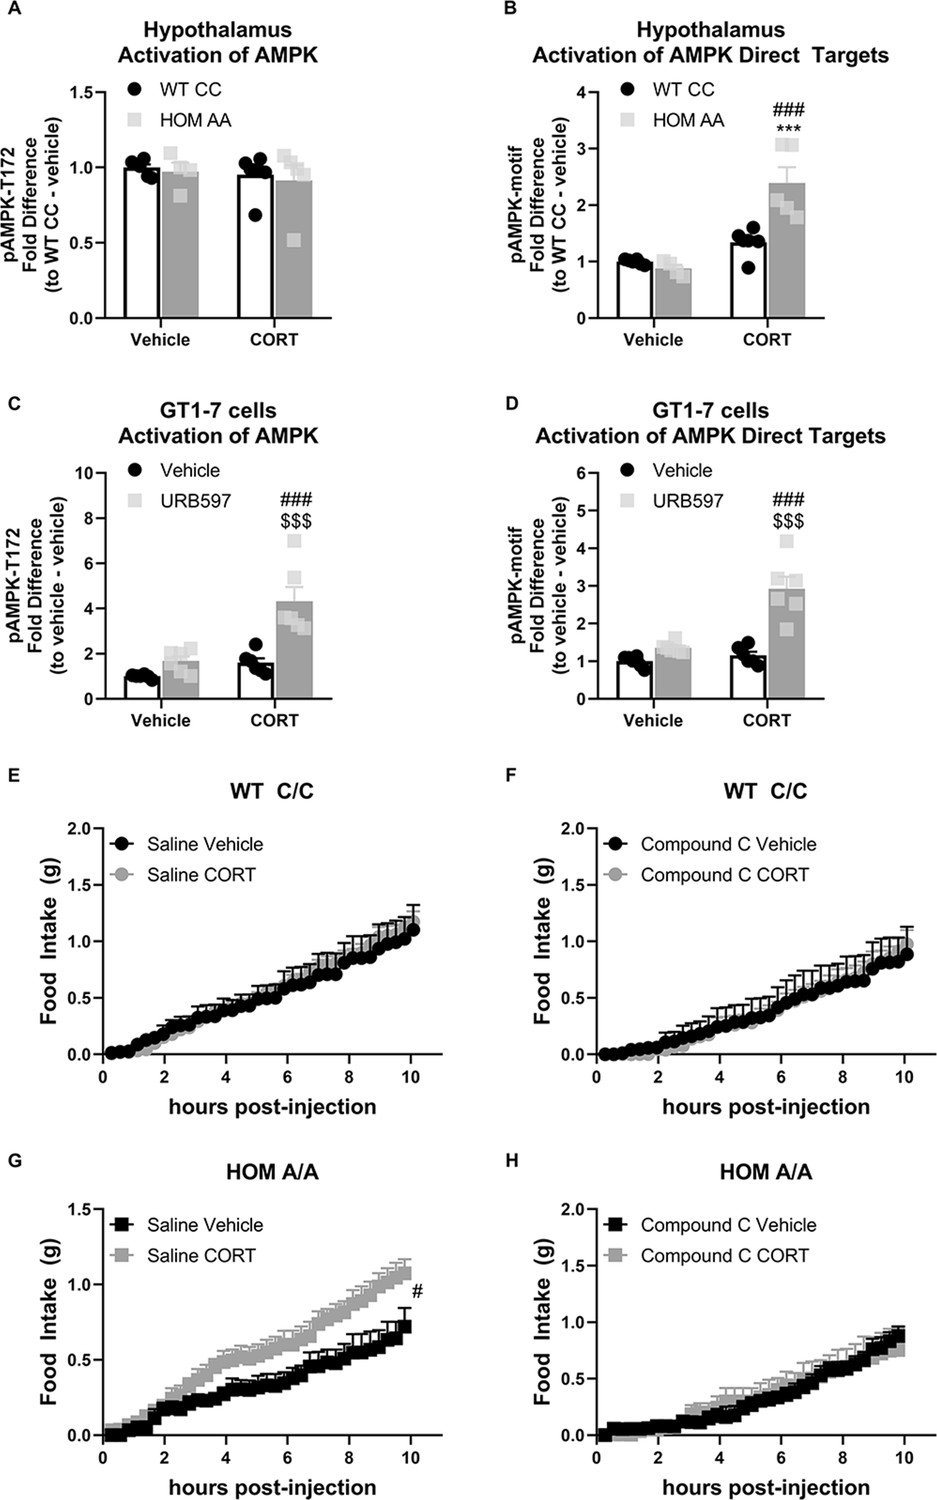
The fatty acid amide hydrolase (FAAH) A/A genotype amplifies the glucocorticoid (GC)-mediated orexigenic effects through an AMP-activated protein kinase (AMPK)-dependent mechanism.
(A) Hypothalamic AMPK activity (as assessed by pAMPK protein expression) was unaffected by genotype (F(1, 17)=0.249, p=0.624) or corticosterone (CORT) (3 mg/kg, i.p.) (F(1, 17)=0.711, p=0.411). (B) However, in the hypothalamus, downstream targets of AMPK were activated from CORT exposure exclusively in FAAH A/A (HOM) mice (F(1, 17)=15.45, p=0.001 plus post hoc testing). (C–D) In GT1-7 hypothalamic cells, AMPK activity was enhanced exclusively in CORT-treated cells pretreated with URB597, assessed by pAMPK (F(1, 20)=8.807, p=0.008 plus post hoc testing) and pAMPK-motif (F (1, 20)=16.74, p<0.001 plus post hoc testing) protein expression. (E–F). Acute CORT treatment had no effect on cumulative light phase food intake in FAAH C/C (wild-type [WT]) mice following administration of either saline (treatment: F(1, 11.155)=0.45, p=0.836) or an AMPK inhibitor (compound C, 5 mg/kg, i.p.) (treatment: F(1, 8.755)=0.001, p=0.982). By contrast, (G–H) AMPK inhibition prevented CORT-mediated orexigenic effects in FAAH A/A mice measured during the light phase (treatment: saline (F(1, 14.344)=6.112, p=0.027); compound C (F(1, 8.793)=0.009, p=0.927)). Panels (A–B): n=6 WT-vehicle biological replicates; n=6 WT-CORT biological replicates; n=4 HOM-vehicle biological replicates; n=5 HOM-CORT biological replicates. Panels (C–D): n=6 biological replicates per group. Panel (E): n=4 WT-vehicle; n=8 WT-CORT. Panel (F): n=4 HOM-vehicle; n=6 HOM-CORT. Panel (G): n=6 WT-vehicle. N=7 WT-CORT. Panel (H): n=5 per group. Protein expression data are expressed as relative fold change compared to control condition ± SEM. Food intake data are presented as means ± SEM. Panels (A–D) were analyzed by two-way ANOVAs. Panels (E–H) were analyzed by linear mixed models with repeated measures. Pound signs denote significant treatment effect. Asterisks denote significant genotype effect. Dollar signs denote significant URB597 treatment effect. ***p<0.001, #p<0.05, ###p<0.001, $$$p<0.001.
-
Figure 4—source data 1
Lasting effects of acute CORT treatment following AMPK inhibition in FAAH C/C and A/A mice on feeding.
- https://cdn.elifesciences.org/articles/81919/elife-81919-fig4-data1-v2.xlsx
Figure 4—figure supplement 1

Lasting effects of acute CORT treatment following AMPK inhibition in FAAH C/C and A/A mice on feeding.
Figure 5 with 1 supplement
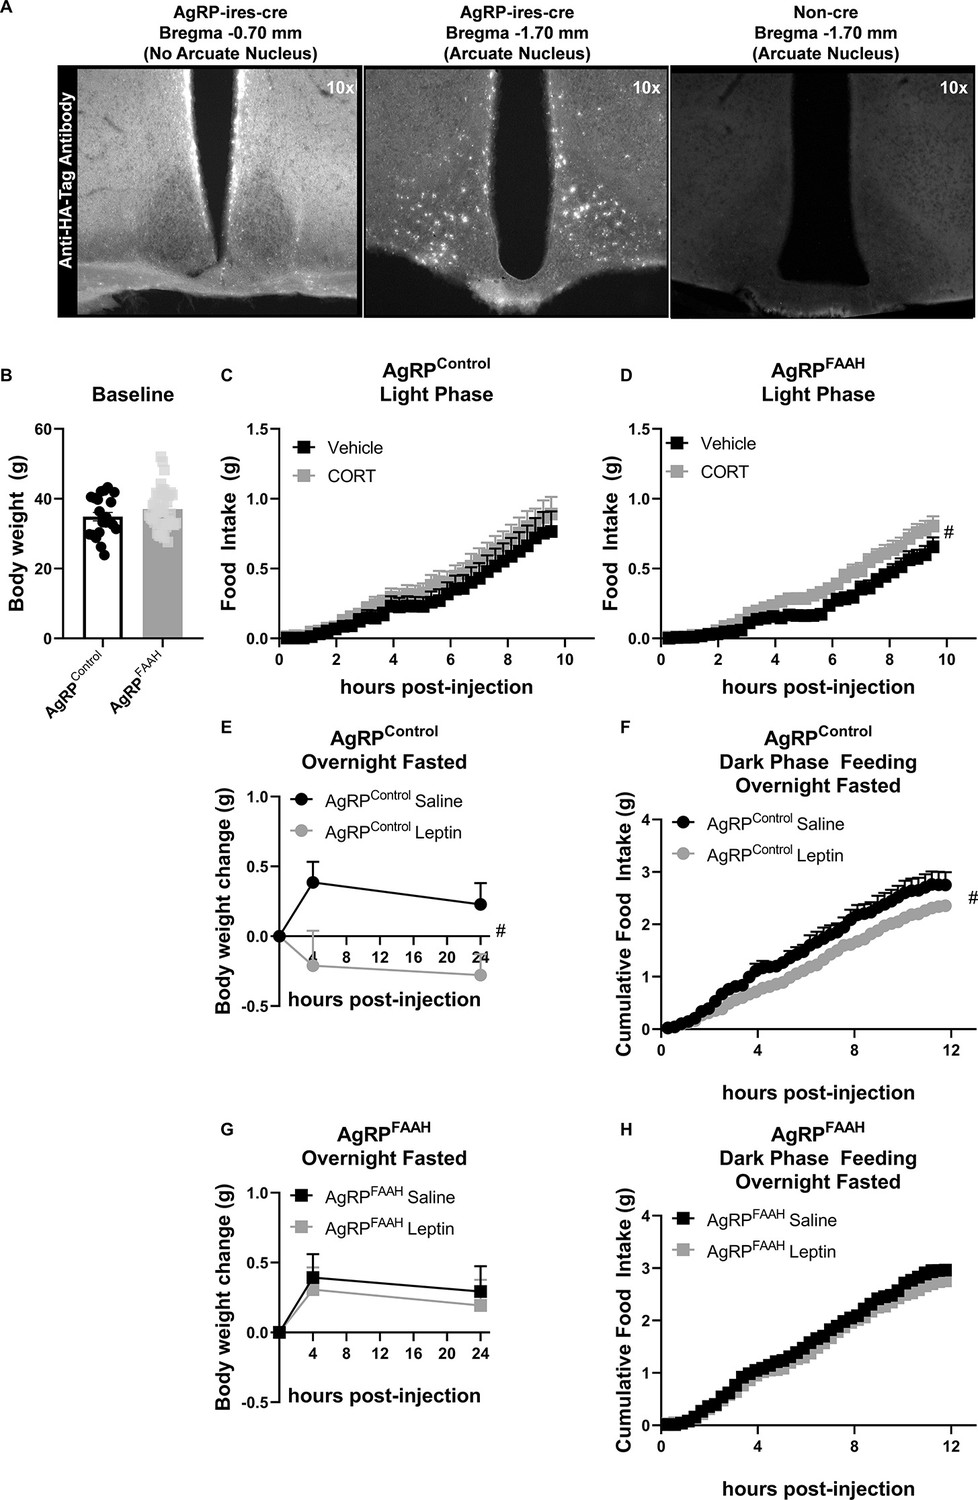
Fatty acid amide hydrolase (FAAH) knockdown in hypothalamic agouti-related protein (AgRP) neurons recapitulates the feeding responses to either acute corticosterone (CORT) or leptin treatment of FAAH A/A mice.
(A) For validation of cre-dependent CRISPR/SaCas9 AAV-based knockdown of FAAH in AgRP neurons, HA-tag fluorescence was detected exclusively in the arcuate nucleus of AgRP-cre mice following bilateral injections of SaCas9-Control or SaCas9-FAAH into the hypothalamus of AgRP-Ires-cre mice. Non-cre mice showed no anti-HA-tag fluorescence in the arcuate nucleus. (B) Under basal conditions, there was no effect of FAAH knockdown in AgRP neurons on body weight (T(61) = 1.406, p=0.1648). (C) A single CORT injection (3 mg/kg) had no effect on cumulative light phase food intake in AgRPcontrol mice (treatment: F(1, 21.045)=0.465, p=0.503). (D) By contrast, acute CORT caused a hyperphagic feeding response in AgRPFAAH mice measured during the light phase (treatment: F(1, 44.286)=4.257, p=0.045). (E–F) In terms of leptin exposure, AgRPcontrol mice were responsive to leptin-mediated reductions in weight gain (treatment: F(1, 22.253)=8.282, p=0.009) and refeeding (treatment: F(1,16.659)=5.635, p=0.030) following an overnight fast. (G–H) However, AgRPFAAH mice were unresponsive to leptin (weight gain: F(1, 32.278=0.181, p=0.673); refeeding: F(1, 30.596)=0.703, p=0.408). For Panel (B), n=21 AgRPcontrol mice; n=42 AgRPFAAH mice. For Panel (C), n=12 AgRPcontrol -vehicle; n=10 AgRPcontrol -CORT. For Panel (D), n=20 AgRPFAAH-vehicle; n=21 AgRPFAAH-CORT. For Panels (E and F), n=7 AgRPcontrol-saline; n=AgRPcontrol-leptin. For Panels (G and H), n=14 AgRPFAAH-saline; n=15 AgRPFAAH-leptin. Body weight and food intake data are presented as means ± SEM. Panel (B) was analyzed by Student’s t-test. Panels (C–H) were analyzed by linear mixed models with repeated measures. Pound signs denote significant treatment effect. #p<0.05.
-
Figure 5—source data 1
FAAH activity following mutagenesis of FAAH using SaCas9-FAAH in CaMKIIa-cre mice.
- https://cdn.elifesciences.org/articles/81919/elife-81919-fig5-data1-v2.xlsx
Figure 5—figure supplement 1

FAAH activity following mutagenesis of FAAH using SaCas9-FAAH in CaMKIIa-cre mice.
Figure 6 with 1 supplement

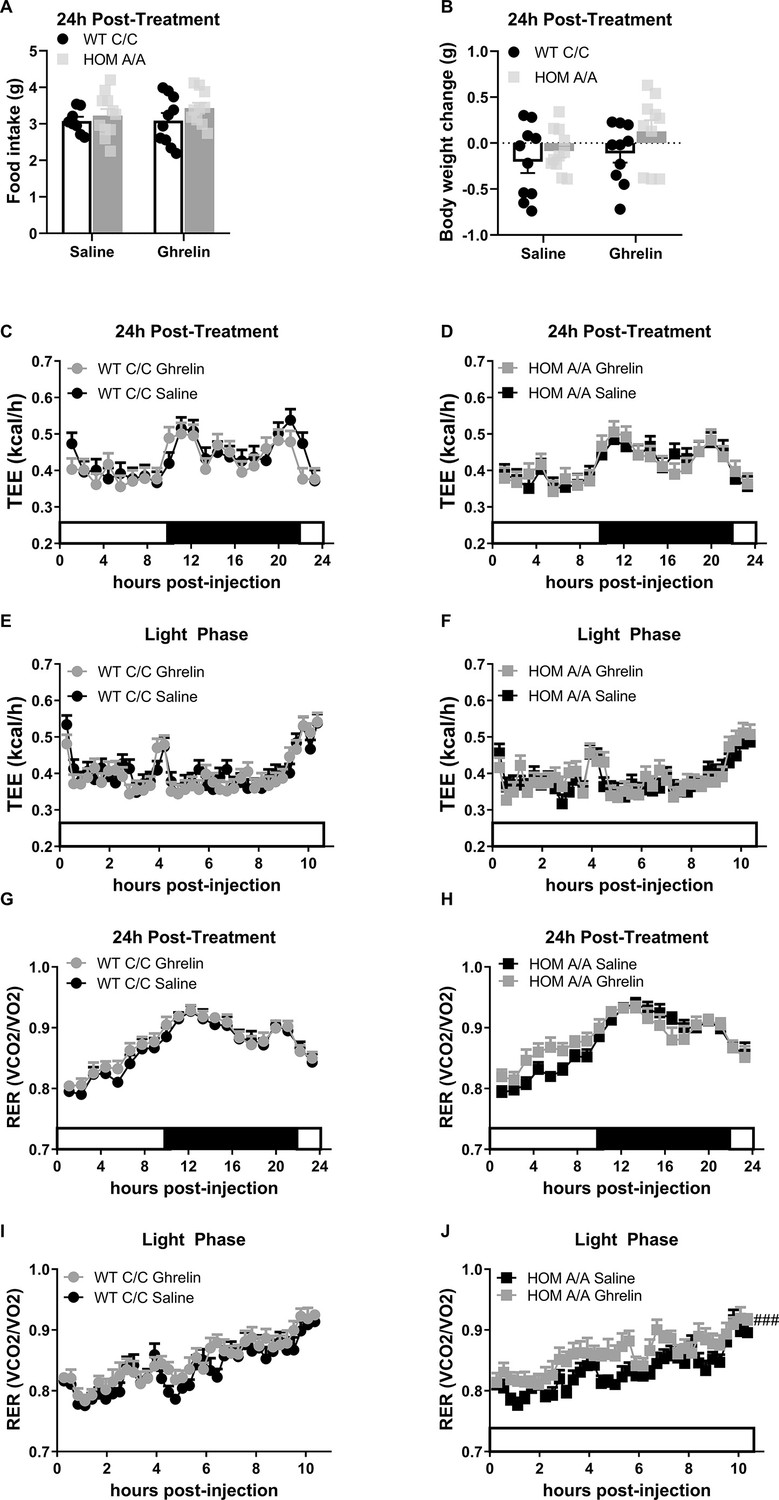
Fatty acid amide hydrolase (FAAH) A/A mice are hyperresponsive to the orexigenic effects of ghrelin.
(A–B) Acute ghrelin (1 mg/kg, single i.p. injection) had no effect on cumulative food intake in FAAH C/C mice (treatment: F(1, 19.753)=0.494, p=0.490) yet increased light phase food intake in FAAH A/A mice (within the initial 10 hr following ghrelin injections) (treatment: F(1, 21.835)=5.406, p=0.030). (C) Hypothalamic AMP-activated protein kinase (AMPK) activity (as assessed by pAMPK protein expression) was significantly increased by ghrelin treatment exclusively in FAAH A/A mice (treatment × genotype: F(1, 18)=8.071, p=0.0108 plus post hoc testing). (D) Similarly, downstream targets of AMPK (with a shared consensus sequence) were activated from ghrelin exposure exclusively in FAAH A/A mice measured 1 hr following injections (treatment × genotype: F(1, 19)=9.597, p=0.0059 plus post hoc testing). For Panel (A), n=8 WT-saline; n=10 WT-ghrelin. For Panel (B), n=11 HOM-saline; n=10 HOM-CORT. For Panel (C), n=6 WT-saline biological replicates; n=6 WT-ghrelin biological replicates; n=5 HOM-saline biological replicates; n=5 HOM = ghrelin biological replicates. For Panel (D), n=6 WT-saline biological replicates; n=6 WT-ghrelin biological replicates; n=5 HOM-saline biological replicates; n=6 HOM-ghrelin biological replicates. Food intake data are presented as means ± SEM. Protein expression data are expressed as relative fold change compared to FAAH C/C-vehicle condition ± SEM. Panels (A–B) were analyzed by linear mixed models with repeated measures. Panels (C–D) were analyzed by two-way ANOVAs. Pound signs denote significant treatment effect. Asterisks denote significant genotype effect. *p<0.05, **p<0.01, #p<0.05, ###p<0.001.
-
Figure 6—source data 1
The lastong effects of acute ghrelin treatment in FAAH C/C and A/A mice on metabolic outcomes.
- https://cdn.elifesciences.org/articles/81919/elife-81919-fig6-data1-v2.xlsx
Figure 6—figure supplement 1
The lastong effects of acute ghrelin treatment in FAAH C/C and A/A mice on metabolic outcomes.
Figure 7
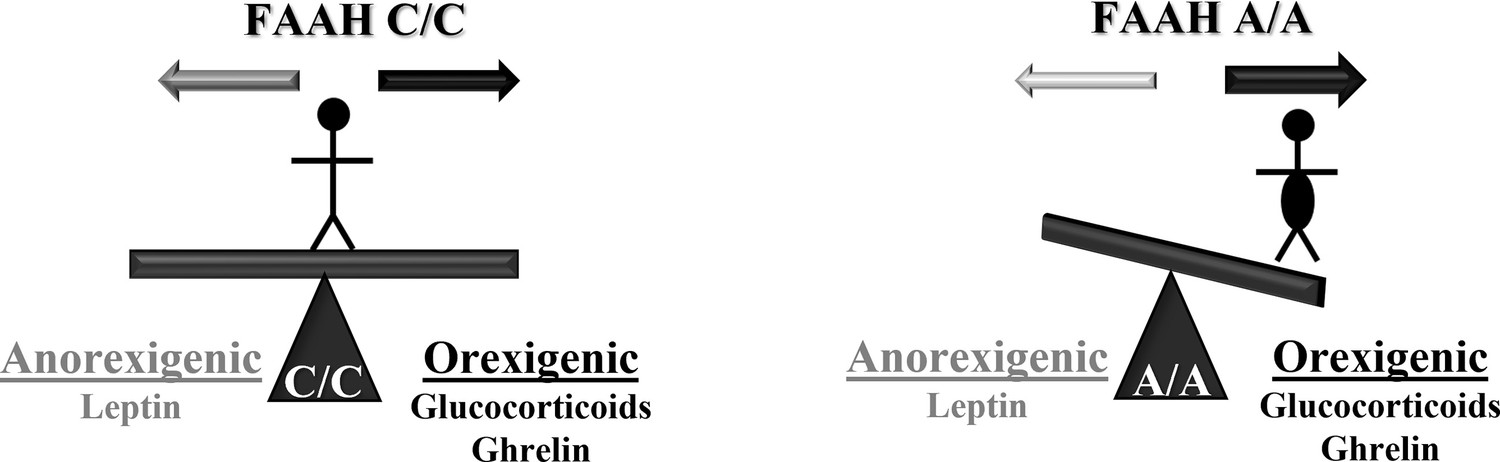
Working model of how the fatty acid amide hydrolase (FAAH) C385 polymorphism influences individual susceptibility to body weight gain.
Individuals with the FAAH C/C genotype are able to respond to anorexigenic and orexigenic signals based on their metabolic needs. However, the FAAH A/A genotype shifts responses to feeding cues, sensitizing individuals to orexigenic signals, favoring weight gain, and desensitizing individuals to weight loss.
Additional files
Download links
A two-part list of links to download the article, or parts of the article, in various formats.
Downloads (link to download the article as PDF)
Open citations (links to open the citations from this article in various online reference manager services)
Cite this article (links to download the citations from this article in formats compatible with various reference manager tools)
A genetic variant of fatty acid amide hydrolase (FAAH) exacerbates hormone-mediated orexigenic feeding in mice
eLife 12:e81919.
https://doi.org/10.7554/eLife.81919


