Optimization of energy and time predicts dynamic speeds for human walking
- Biomedical Engineering Program, University of Calgary, Canada
- Faculty of Kinesiology, University of Calgary, Canada
Figures
Figure 1
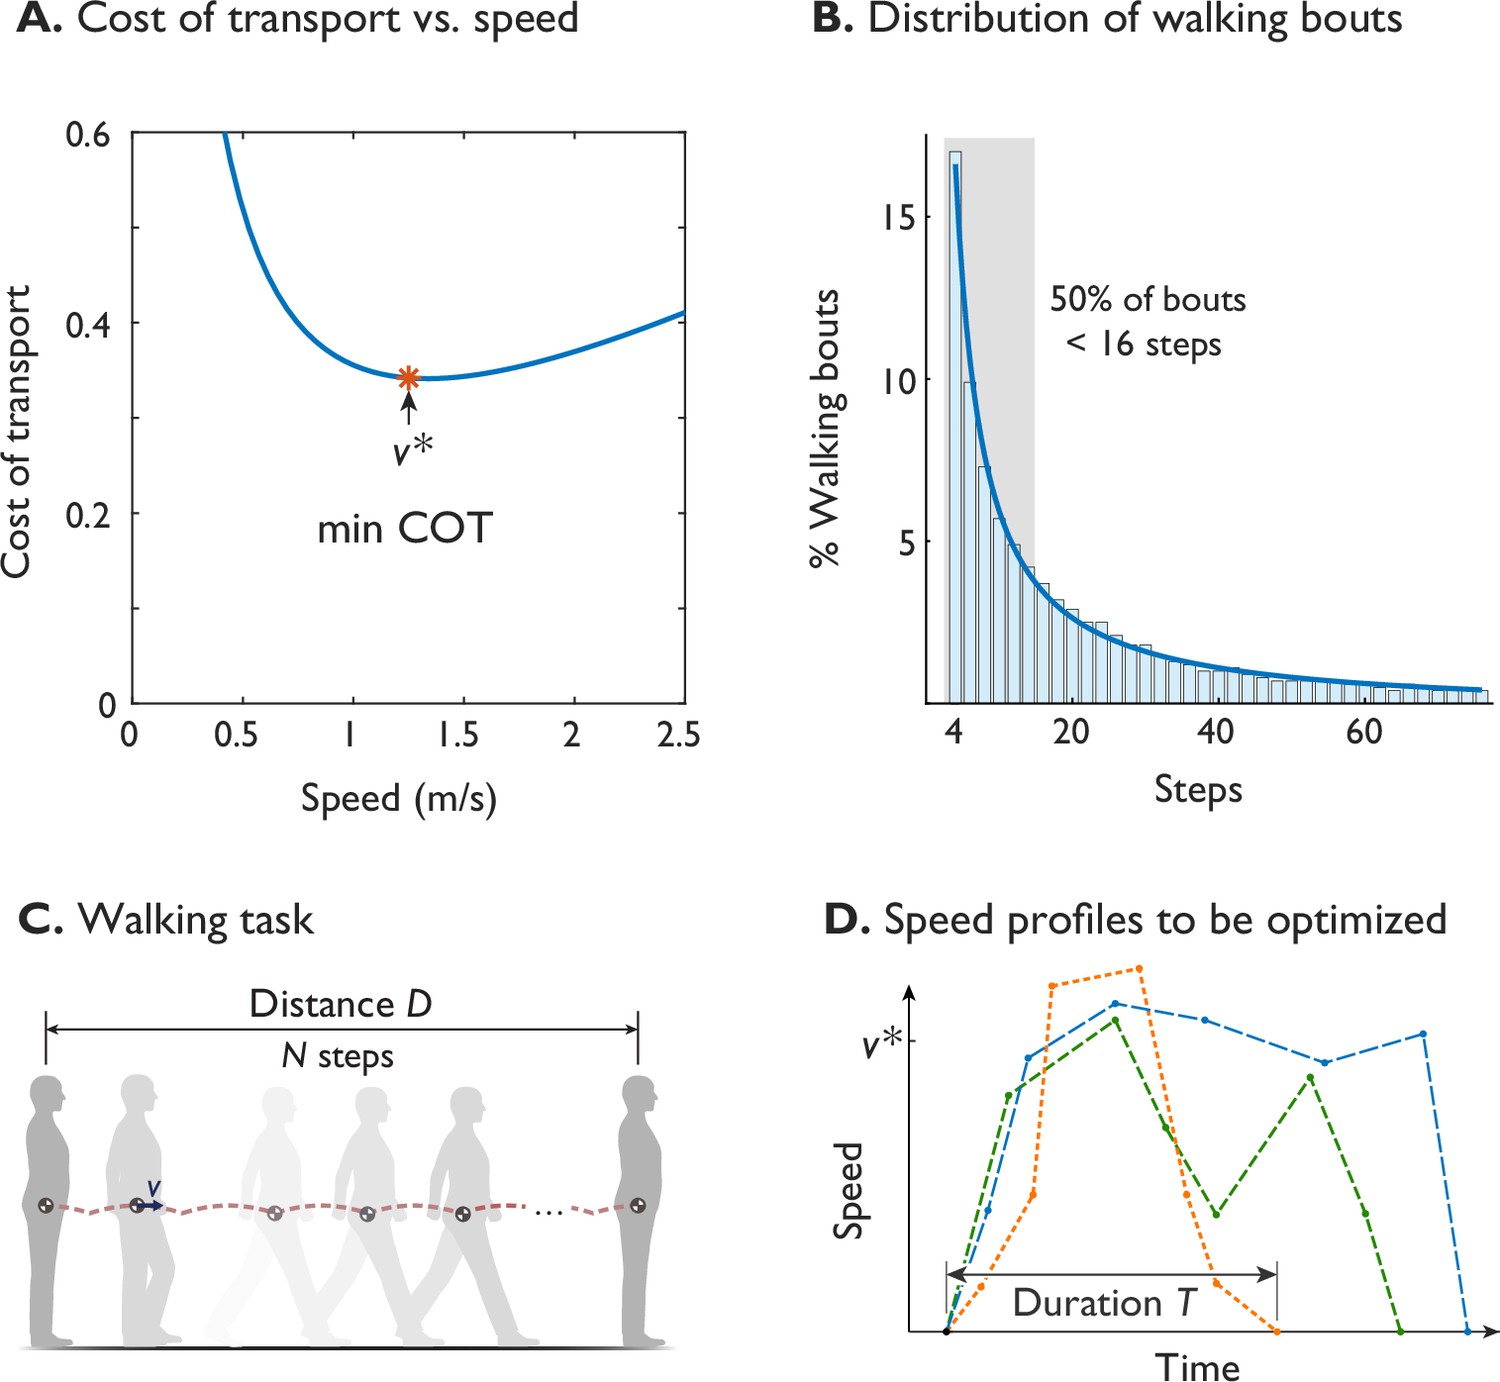
Humans prefer an economical speed for steady walking, but not all walking is steady.
(A) The preferred steady walking speed coincides with minimum metabolic cost of transport (‘min COT’), which has a convex dependence on speed (after Ralston, 1958). (B) The distribution of human walking bouts during daily living, plotted as percentage of observed bouts vs. number of steps (in bins of ±1), as reported by Orendurff et al., 2008. About 50% of bouts were less than 16 steps (shaded area), observed from ten adults over fourteen days. (C) A typical walking task is to walk a given distance , starting and ending at rest. (D) Walking speed is therefore expected to be a trajectory that starts and ends at zero, potentially differs from steady , and has a finite duration . Hypothetical trajectories are shown as dashed lines.
Figure 2
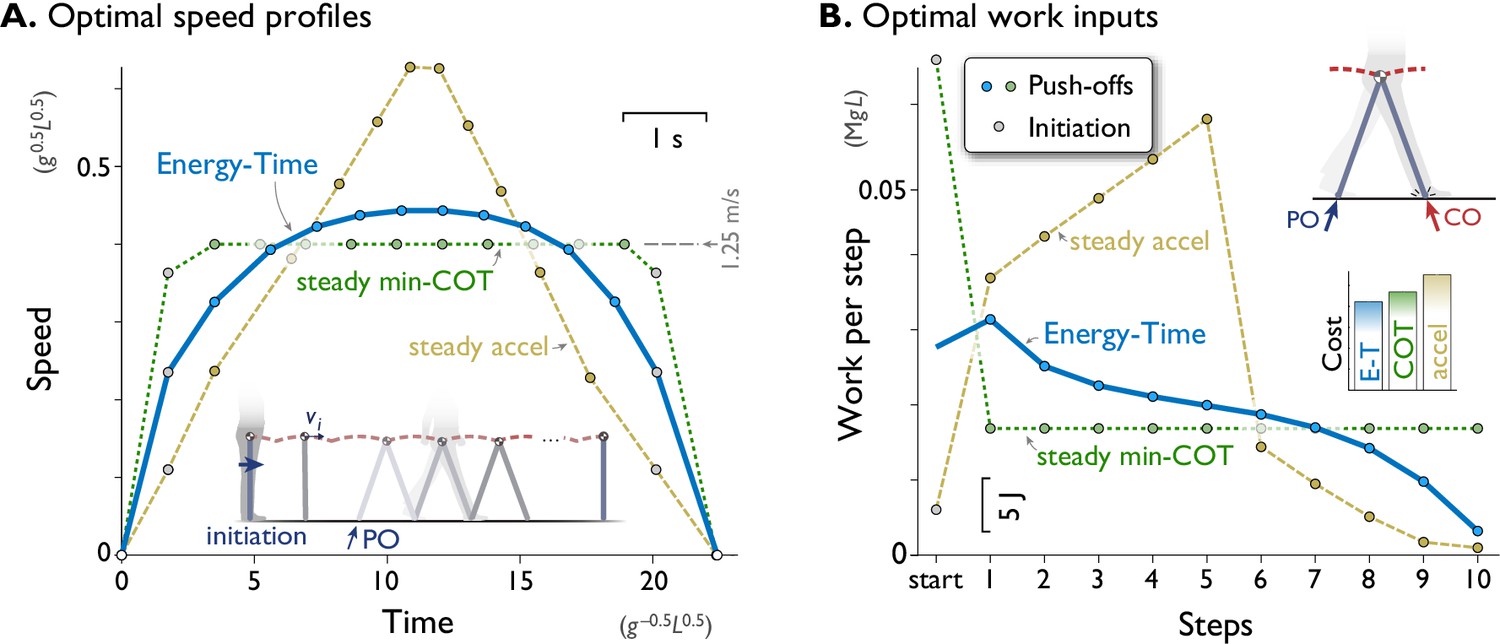
A computational model of walking predicts that a rounded speed profile is most economical for a short walking bout of fixed time and distance.
(A) Predicted speed profiles for a walking bout of ten steps, comparing minimization of Energy and Time (Energy-Time, solid line) against maintaining steady speed (min-COT, dotted line) or steady acceleration and deceleration (steady accel, dashed line). Energy-Time minimizes the total push-off (PO) work plus time expended for a walking bout, for a model with pendulum-like legs (inset). Steady min-COT walks at the steady speed that minimizes cost of transport, by accelerating immediately to that speed. Steady acceleration walks with linearly increasing speed until mid-point, then decelerates linearly back to rest. Energy-Time predicts a gently rounded speed profile, min-COT a trapezoidal profile (always at min-COT speed), and steady acceleration a triangular profile. Speeds are discretely sampled as the average forward speed over each step (filled dots), starting with an initiation impulse to accelerate from standing and a termination impulse to decelerate at the end (gray dots). (B) Positive work inputs for each hypothesis, including initiation work (gray dots) and push-off work (colored dots, one per step). Energy-time hypothesis predicts the least total work (inset bar graph compares Energy-Time "E-T", min-"COT", steady-"accel" costs). Predictions are for a dynamic walking model with pendulum-like legs (inset, see Methods). All predictions are designed for the same duration based on steady min-COT speed as a reference, resulting in cost of Time . Predictions are plotted in terms of normalized units based on body mass , leg length , and gravitational acceleration ; scale for typical human also shown, mass 70 kg, leg length 1 m.
Figure 3
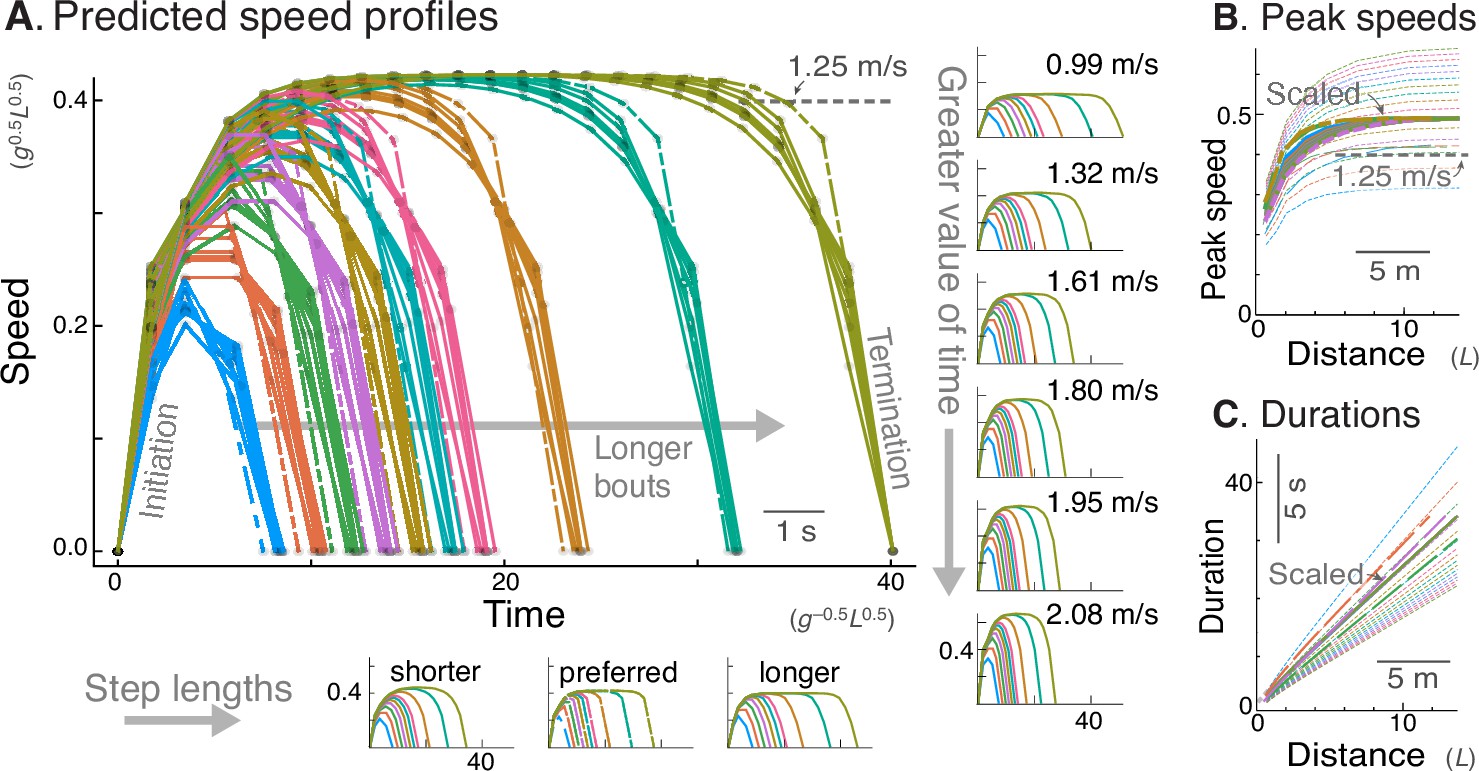
Energy-Time hypothesis predicts a family of speed profiles.
(A) Predicted speed profiles vs. time for a range of walking distances, with longer bouts reaching higher and steadier peak speeds. In the main plot, multiple predictions for different time valuations and step lengths are scaled and superimposed on each other to emphasize self-similarity. Original, unscaled traces are shown in surrounding insets. (Horizontal insets, bottom:) Three different step lengths including shorter and longer steps than nominal, and human preferred step length relationship (dashed lines); main plot also includes nominal step length. (Vertical insets, right:) Varying valuation of time results in two-fold variation in peak speeds (labeled) and walk durations. The time cost and step length therefore affect only how quickly the task is completed, and not the shape of the family of speed profiles. Shown are trajectories of discrete speed, defined as the average forward speed over each step. (B) Peak speeds are predicted to increase sharply with distance, approaching an asymptote for distances of about 12 m or more. Again, despite different peak speeds, the curves are self-similar and can be scaled to a single shape (thick lines). (C) Walking durations increase with distance, with slightly curvilinear relationship (also scaled to a single shape, thick lines). In (A), time cost is varied between 0.006 and 0.06 (in units of ), and distances range from 2 to 20 steps. Model predictions are plotted in dimensionless units, using body mass , leg length , and gravitational acceleration as base units; scale for typical human also shown, mass 70 kg, leg length 1 m.
Figure 4
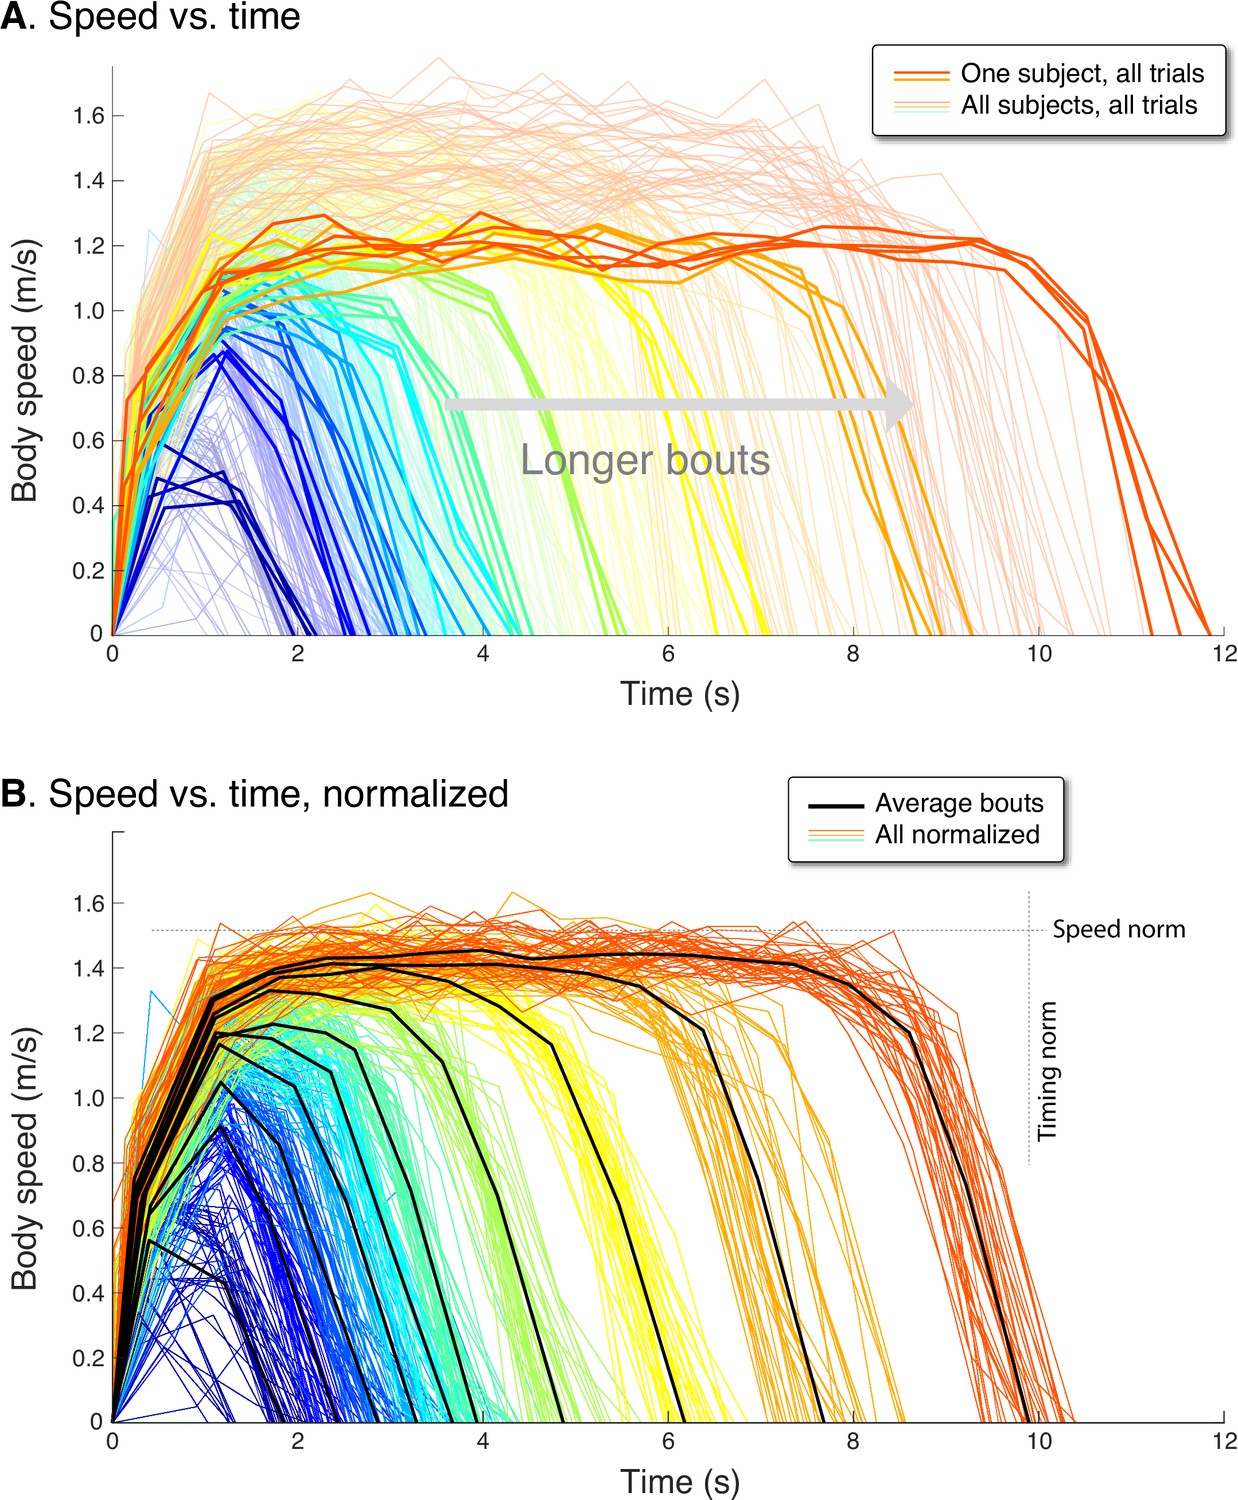
Human speed profiles vs.time for (A) all subjects (), and (B) all subjects normalized to the average.
Body speeds are plotted for all ten walking bout distances (colored lines). In (A), one representative subject is highlighted (thicker lines) to show a typical person’s variability between trials. In (B), all traces for each subject are normalized by that person’s average peak speed (‘Speed norm’) for the longest distance, and by their average time for that bout (‘Timing norm’). Also shown are the mean walking bouts across subjects (thick black lines, ) for each distance, to illustrate how different subjects resemble each other despite varying in how fast they walk. Average bouts were computed by resampling each trial to the most common step count for each distance, averaging across such profiles for each distance, and then rescaling time to reflect the average duration for each distance. Body speed is defined (in Methods) as an average for each step, dividing step length by the time between between mid-stance instances.
Figure 5
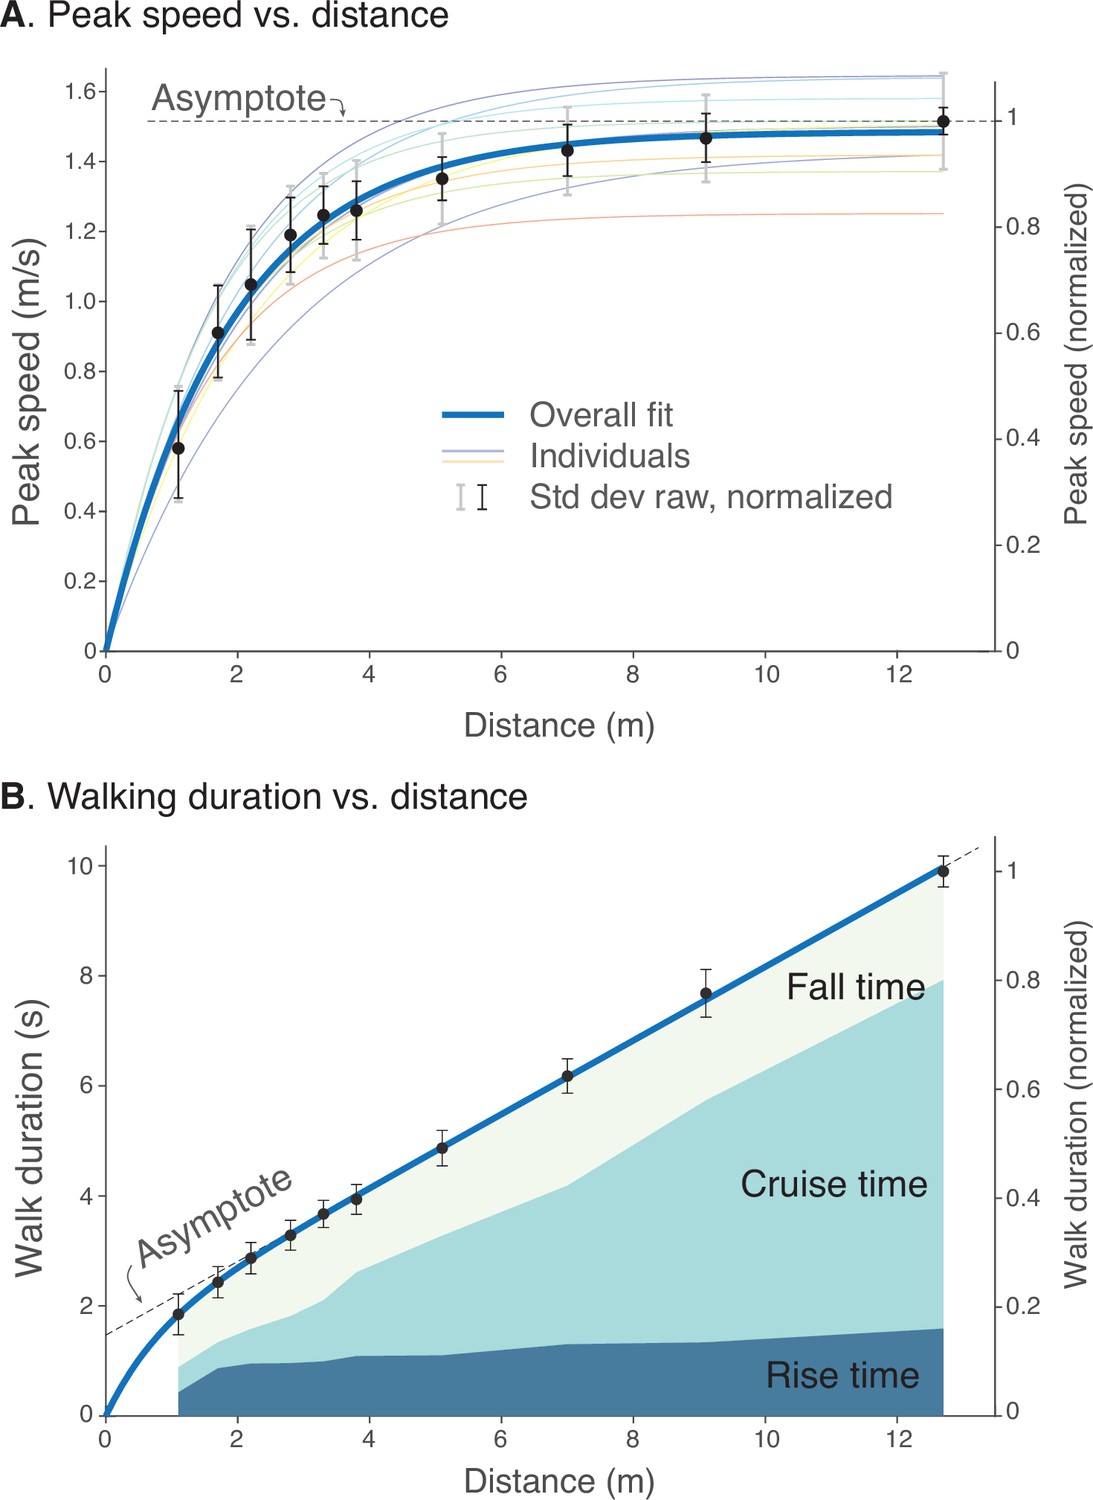
Human walking bouts show increases in (A) peak speed and (B) walking duration vs. distance.
(A) Peak speeds are shown for each walking distance, averaged across subjects’ normalized data (filled symbols, ), along with variability (standard deviation, thin black error bars). These are accompanied by a saturating exponential fit (thick solid line, ). Also shown are fits for each subject’s unnormalized data (thin colored lines; dimensional vertical axis at left), and unnormalized variability between all trials (standard deviation, light gray error bars). (B) Walking durations are shown for each walking distance, averaged across subjects’ normalized data (filled symbols), along with variability (standard deviation, error bars) and a saturating exponential fit (). Shaded areas denote rise time (0%–90% of peak speed), cruise time (90% of peak and greater), and fall time (90%–0%). Rise and fall times appear to dominate shorter walking bouts, and cruise time for longer walking bouts. Filled black dots denote mean data, error bars denote s.d. The entire range of unnormalized peak speeds and durations for all subjects is shown in Figure 4, along with normalization definitions (Speed norm, Time norm). Dimensional vertical axis (left) is based on the average normalization constant relative to normalized data (right vertical axis). Normalization yielded reduced variability in peak speeds and durations.
Figure 6
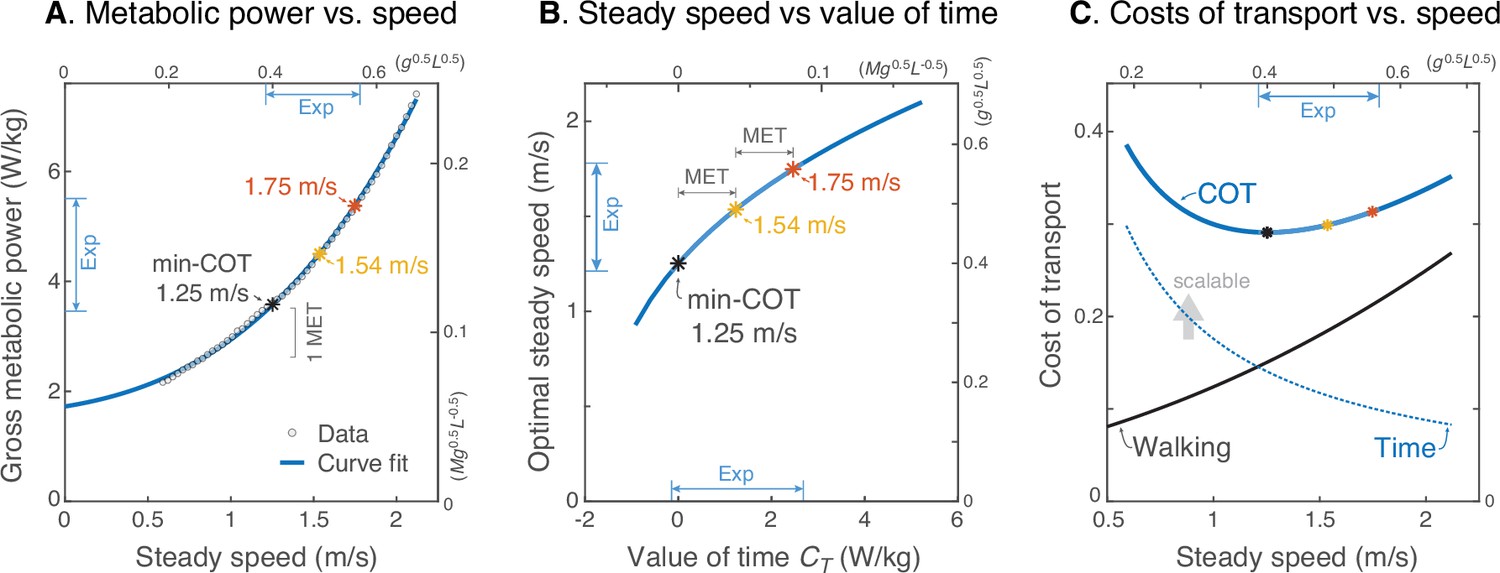
Prediction of steady walking speed emerges from Energy-Time hypothesis.
(A) Human metabolic power vs. speed for steady walking (adapted from Fig. 11 of Elftman, 1966), along with a model-based curve fit (; see Equation 15). Faster walking can be produced by valuing time more, with metabolic yielding 1.54 ms–1 and yielding 1.75 ms–1. (MET is metabolic resting rate, serving as a standard reference value.) (B) Model steady speed vs. value of time increases such that each increment of in model yields a diminishing increase in speed, due to the increasingly high energetic cost of walking faster. Walking speeds observed in present experiment (‘Exp’ range) may be interpreted as human ranging from about 0–2 MET above resting. (C) Model energetic cost of transport (COT) may be regarded as the sum of two competing costs: a net physiological cost for Walking and a scalable cost for the Time expended. Steady walking speed is optimized where the two costs have equal and opposite slope. As the valuation of time increases, preferred steady speed increases. The valuation of time includes the resting metabolic rate plus a subjective component that does not literally cost energy. The valuation of time represents how much metabolic energy an individual is willing to spend to save a unit of time. The three marked speeds (asterisks ‘*’) roughly denote the minimum, mean, and maximum steady speeds observed here; they correspond with a gross valuation of time starting at resting rate, and incremented by one or two MET.
Figure 7
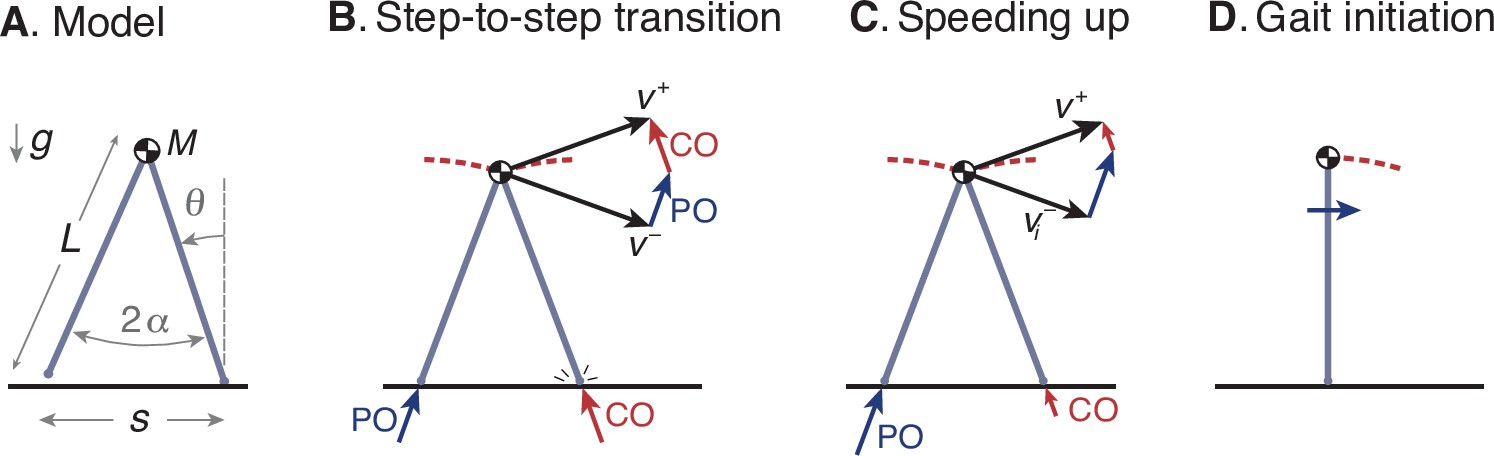
Simple optimization model of walking.
(A) Walking dynamics modeled as a point center-of-mass (COM, mass ), supported by an inverted-pendulum stance leg (length ). (B) The inverted pendulum stance phase is punctuated by a step-to-step transition, modeled with an impulsive push-off (PO) from the trailing leg, followed by impulsive, inelastic collision (CO) with leading leg and ground. The COM velocity is at end of stance, then is redirected by PO and CO to yield velocity at end of step-to-step transition, beginning the next stance phase. (C) For the model to speed up, the magnitude of PO must exceed that of CO, and must have greater magnitude than . (D) The walking bout is initiated by a forward impulse applied at the pelvis, described by positive work u0.
Figure 8
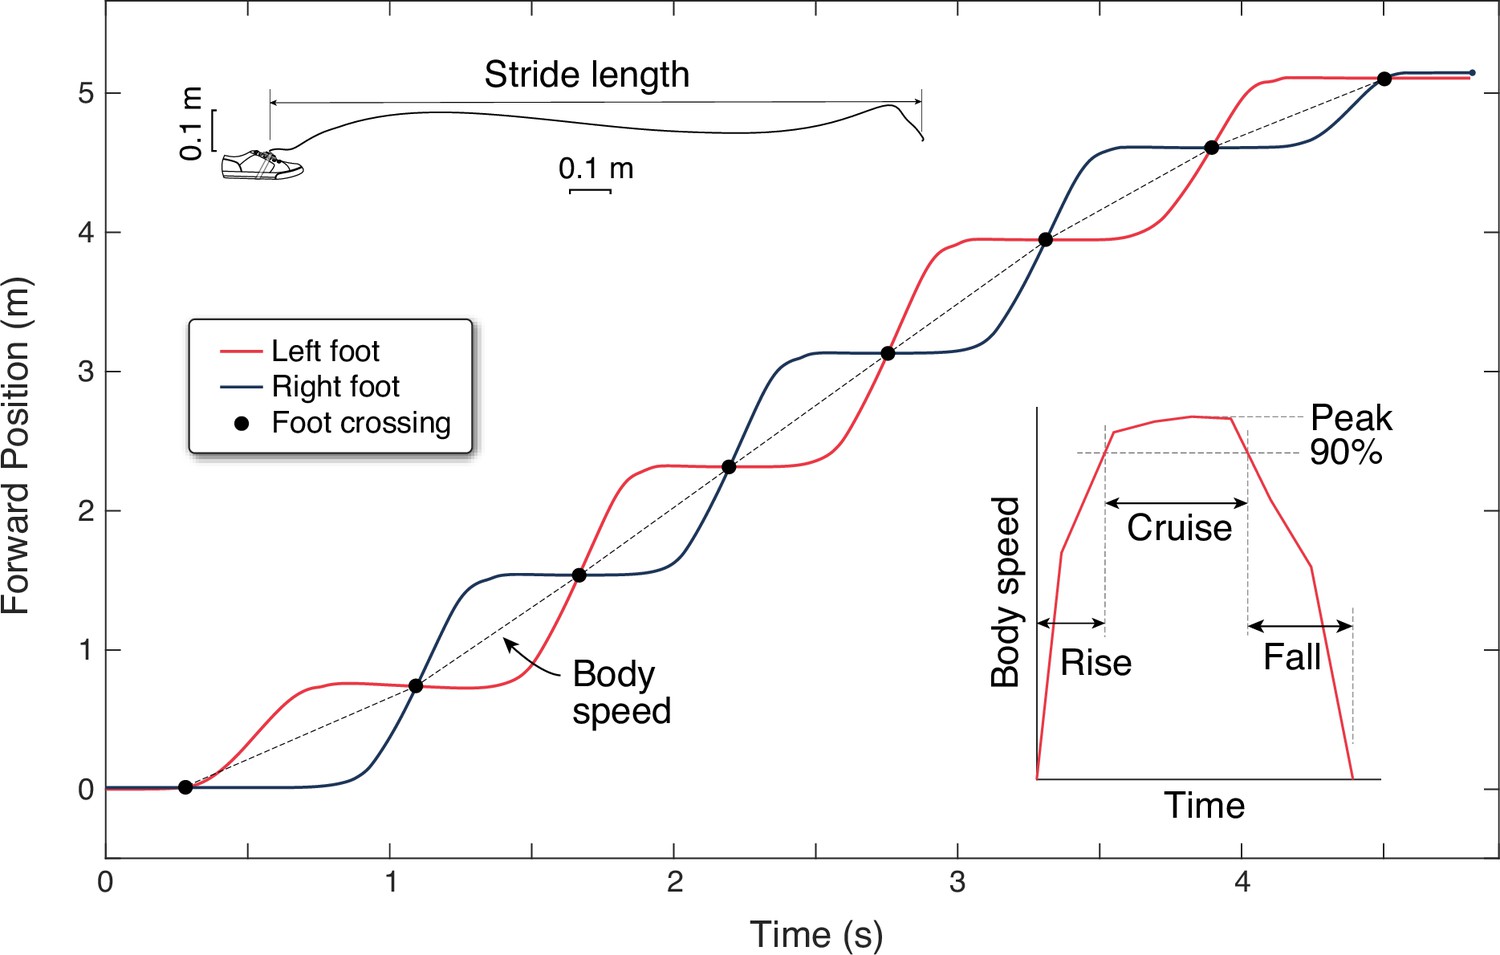
Experimental estimation of walking speed from inertial measurement units (IMUs).
Forward position vs. time are shown for both feet (black and red lines) for a single walking bout of eight steps. Forward position is determined from foot trajectories, computed by integrating gravity-corrected inertial data (top inset). Each foot moves one stride length at a time, and the crossing points of the two feet define mid-stance instances that separate individual steps (black dots). Body speed is defined as the step length divided by step duration (slope of dotted line) for each step. Walking speed trajectories are plotted as discrete body speed vs. time. There are three durations defined within a walking bout (right inset): rise time, cruise time, and fall time. Rise and fall times are to accelerate from rest to 90% of peak speed and the converse. Cruise time is the time spent between 90% and peak speed.
Additional files
Download links
A two-part list of links to download the article, or parts of the article, in various formats.
Downloads (link to download the article as PDF)
Open citations (links to open the citations from this article in various online reference manager services)
Cite this article (links to download the citations from this article in formats compatible with various reference manager tools)
Optimization of energy and time predicts dynamic speeds for human walking
eLife 12:e81939.
https://doi.org/10.7554/eLife.81939


