Constitutively active STING causes neuroinflammation and degeneration of dopaminergic neurons in mice
- Department of Neurology, TU Dresden, Germany
- Departments of Neurology & Pediatrics, TU Dresden, Germany
- Department of Psychiatry, TU Dresden, Germany
- Department of Pediatrics, TU Dresden, Germany
- Deutsches Zentrum für Neurodegenerative Erkrankungen, Germany
Figures
Figure 1 with 1 supplement
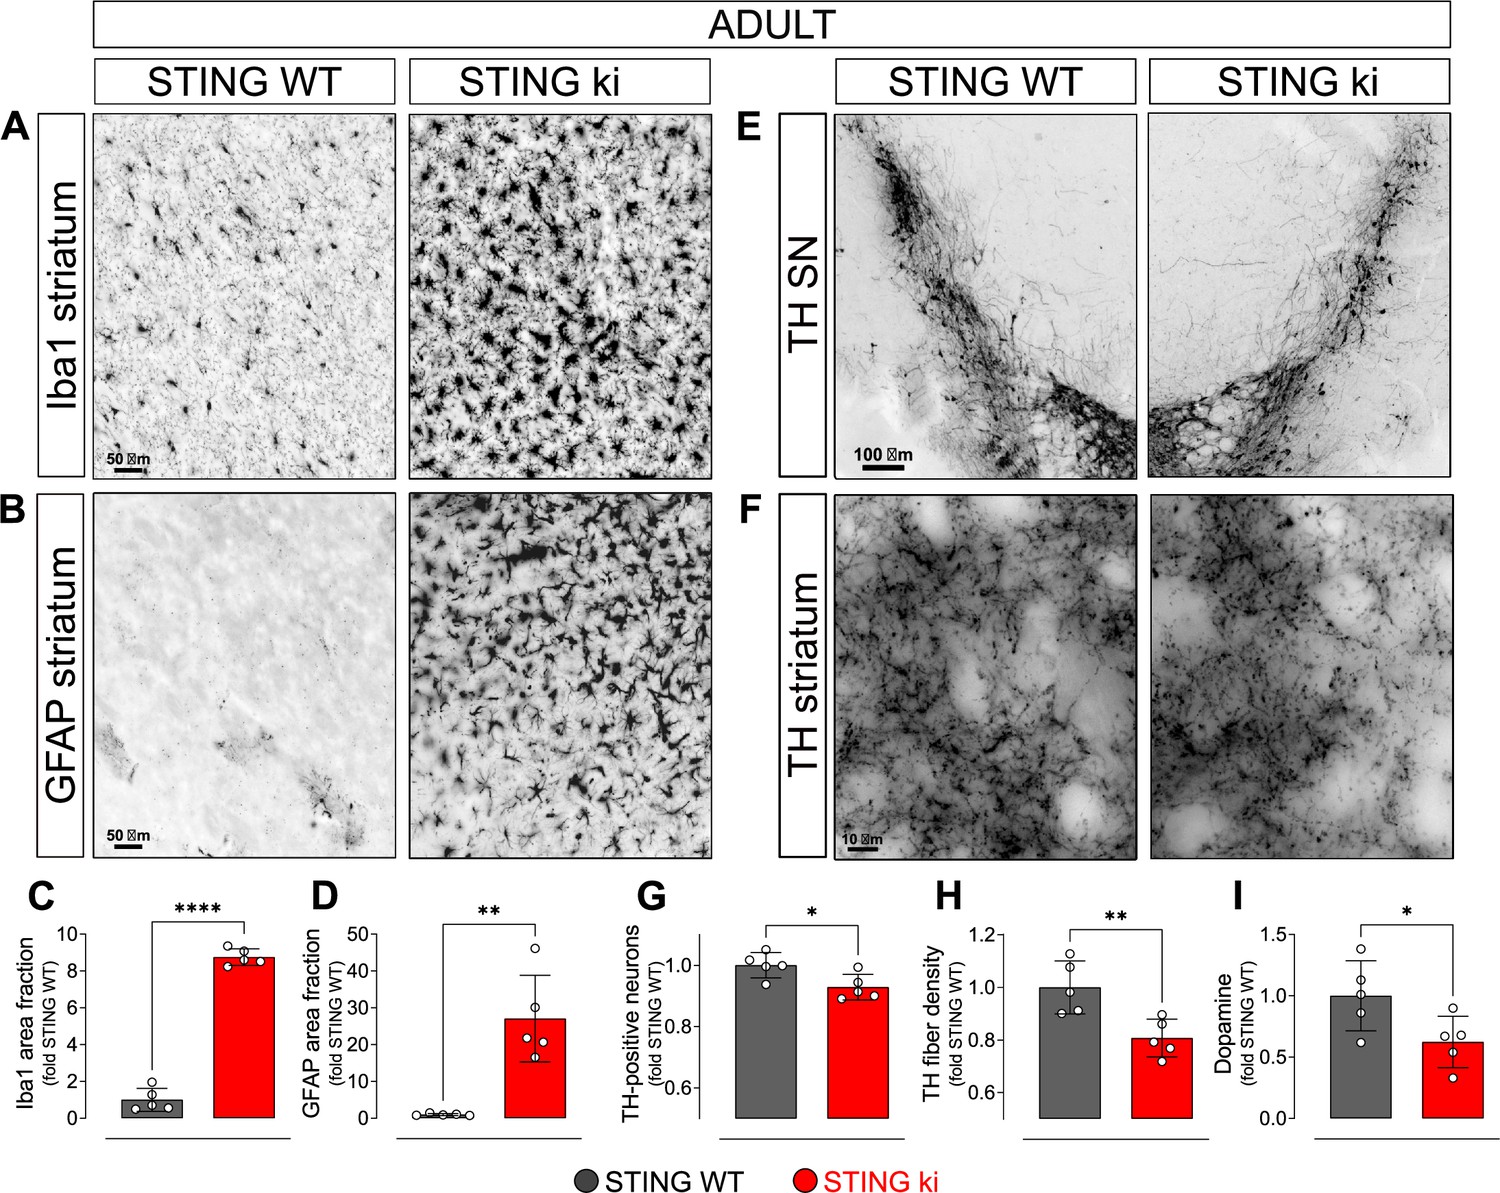
Constitutive STING activation induces neuroinflammation and neurodegeneration in adult mice.
(A) Representative images of striatal sections from STING WT and STING ki mice stained for the microglia marker Iba1. Scale bar: 50 μm. (B) Representative images of striatal sections stained for the astroglia marker GFAP. Scale bar: 50 μm. (C) Representative images of midbrain sections containing the substantia nigra (SN) from STING WT and STING ki mice (stitched from two microscopy fields) stained for tyrosine hydroxylase (TH). Scale bar: 100 μm. (D) Representative images of striatal sections stained for TH from STING WT and STING ki mice. Scale bar: 10 μm. (E) Area fraction positive for Iba1, normalized to the mean of STING WT mice. Markers represent individual animals (black: STING WT animals, red: STING ki animals). Lines represent mean ± SD. Comparison by t-test (***: p=0.0007, n=5). Graph showing the counted numbers of Iba1-positive neurons is on Figure 1—figure supplement 1A. (F) Area fraction positive for GFAP, normalized to the mean of STING WT mice (**: p=0.0011; t-test, n=5). Graph showing the counted numbers of GFAP-positive neurons is on Figure 1—figure supplement 1B. (G) Number of TH-positive neurons (*: p=0.0257; t-test, n=5). Graph showing the counted numbers of dopaminergic neurons is on Figure 1—figure supplement 1D. (H) Area fraction positive for TH (**: p=0.0081; t-test, n=5). (I) Concentration of dopamine (*: p=0.0448; t-test, n=5) in striatal lysates from STING WT and STING ki animals, normalized to the mean concentration in STING WT. Graph showing quantification of the dopamine metabolites is in Figure 1—figure supplement 1E.
Figure 1—figure supplement 1

Neuroinflammation and neurodegeneration in adult mice.
(A) Number of Iba1-positive microglia in the striatum of adult mice (P=0,0000, t-test). (B) Number of GFAP-positive astroglia in the striatum of adult mice (p=0.0029, t-test). (C) Representative images on the ventral midbrain containing the substantia nigra of STING WT and STING ki mice, stained for TH (cyan), Iba1 (magenta) and GFAP (green). Scale bar: 100 µm. Insets show grayscale signal of Iba1 or GFAP staining. (D) Number of TH-positive neurons in the substantia nigra of adult mice (p=0.0257; t-test). (E) Dopamine metabolism (concentration of dopamine metabolites DOPAC +HVA) / dopamine in adult mice (p=0.0179; t-test). (F) Area fraction positive for GFAP signal in the substantia nigra as relative to the mean of STING WT (**: p=0.0078; t-test). (G) Area fraction positive for Iba1 signal in the substantia nigra as relative to the mean of STING WT (**: p=0.0078; t-test). (H) Number of counted GFAP-positive cells in the substantia nigra of adult mice (p=0.0003, t-test). (I) Number of counted Iba1-positive cells in the substantia nigra of adult mice (p=0.0000, t-test). n=5 for all graphs.
Figure 2 with 1 supplement
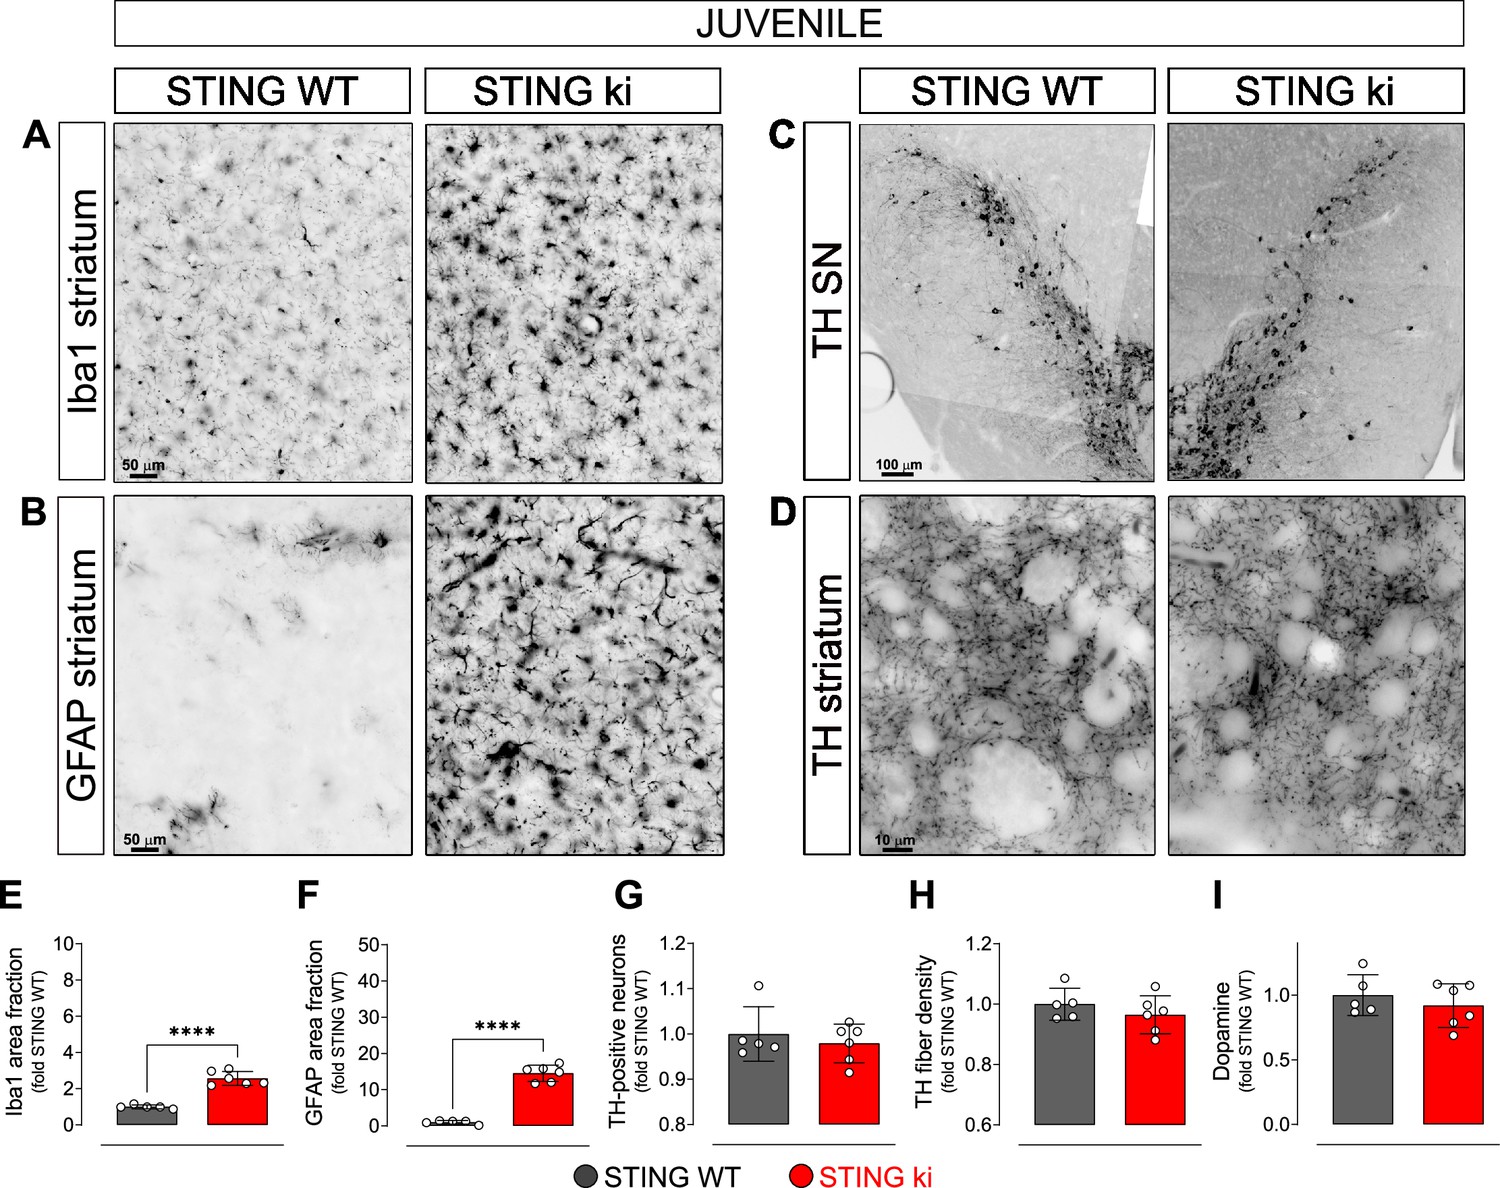
Neuroinflammation without neurodegeneration in juvenile mice with constitutive STING activation.
(A) Representative images of striatal sections stained for the microglia marker Iba1 from 5-week-old STING WT and STING ki mice. Scale bar: 50 μm (B) Representative images of striatal sections stained for the astroglia marker GFAP from 5-week-old STING WT and STING ki mice. Scale bar: 50 μm (C) Representative images of midbrain sections containing the substantia nigra (SN, stitched from two microscopy fields) stained for tyrosine hydroxylase (TH) from 5-week-old STING WT and STING ki mice. Scale bar: 100 μm (D) Representative images of striatal sections stained for TH from 5-week-old STING WT and STING ki mice. Scale bar: 10 μm. (E) Area fraction positive for Iba1, normalized to the mean of STING WT (***: p=0,0009; t-test, n=5–6). (F) Area fraction positive for GFAP, normalized to the mean of STING WT brains (***: p=0.0007; t-test, n=5–6). (G) Number of TH-positive neurons (mean ± SD; t-test). Graph showing the counted numbers of dopaminergic neurons is on Figure 2—figure supplement 1A. (H) Area fraction positive for TH (mean ± SD, t-test, n=5–6). (I) Dopamine concentration in striatal lysates from 5-week-old STING WT and STING ki mice, measured by HPLC and normalized to the mean of STING WT (mean ± SD, t-test, n=5–6). Dopamine metabolites are in Figure 2—figure supplement 1B.
Figure 2—figure supplement 1

Neuroinflammation without neurodegeneration in juvenile mice.
(A) Number of TH-positive neurons in the substantia nigra of juvenile mice (p=0.5188; t-test). (B) Dopamine metabolism in juvenile mice (p=0.9545; t-test). n=5–6.
Figure 3 with 1 supplement
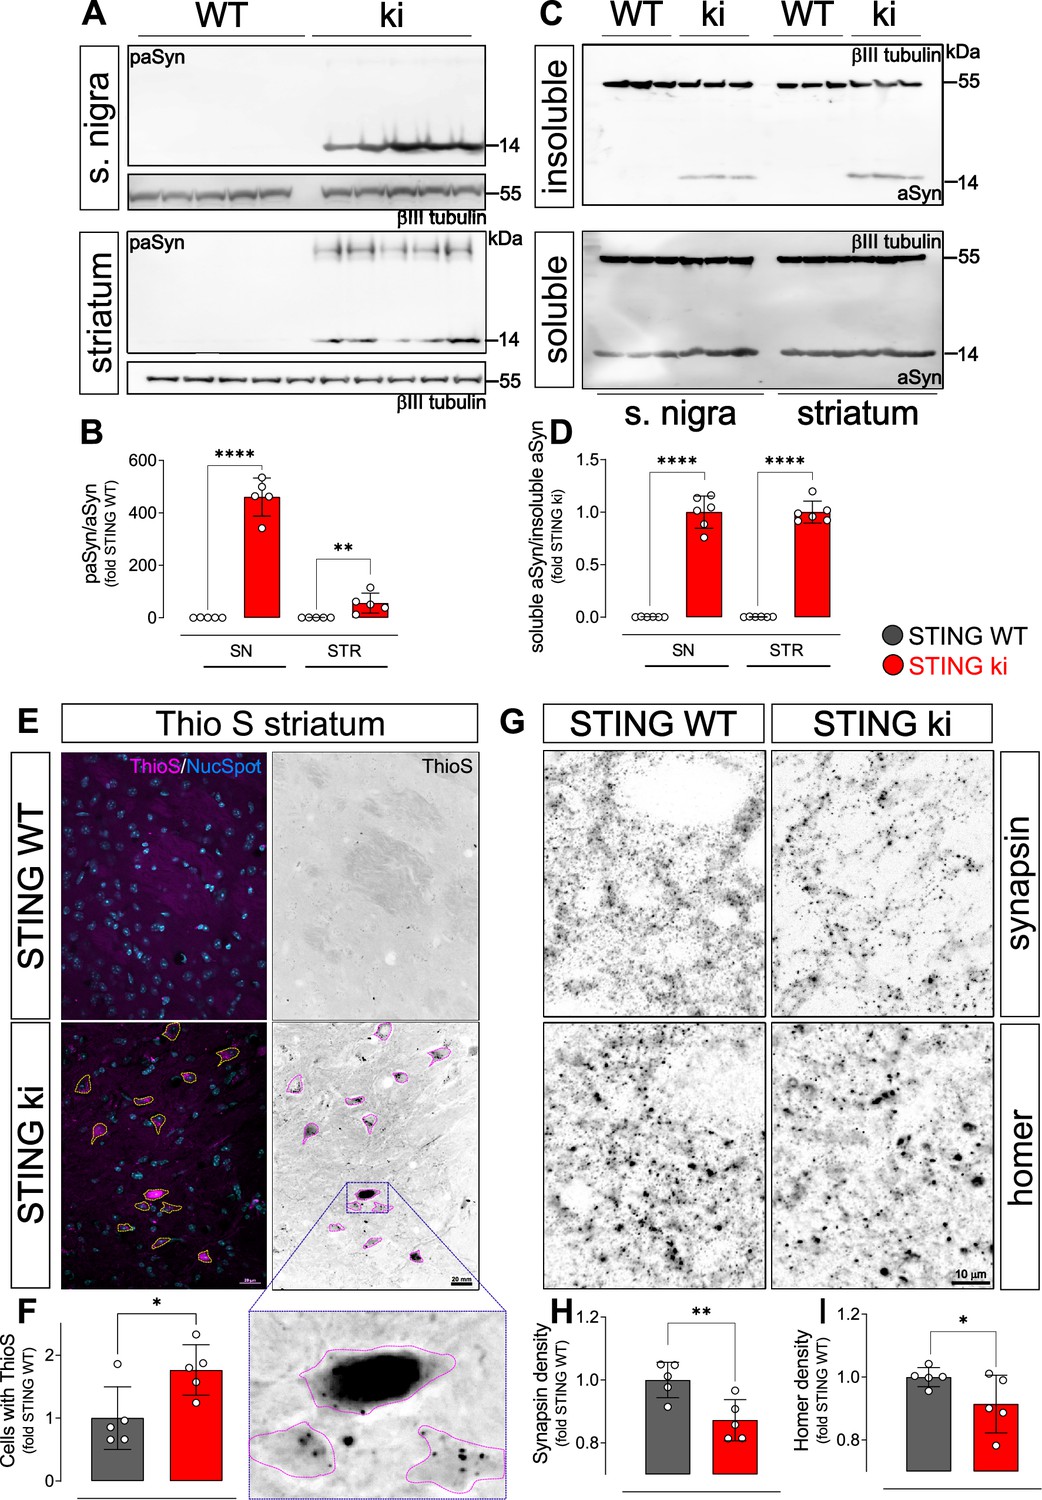
Constitutive STING activation induces alpha-synuclein pathology and synapse loss in adult mice.
(A) Representative western blot images showing phosphorylated alpha-synuclein (S129; paSyn) and the loading control βIII-tubulin detected from the substantia nigra (upper panel) and striatum (lower panel). Total levels of aSyn detected from the same membranes are shown on Figure 3—figure supplement 1A, B. (B) Ratio of paSyn and total aSyn signals, expressed as relative to the mean of STING WT (substantia nigra (SN): p=0.000065; striatum: p=0.019; t-test, n=5). (C) Representative western blot images showing aSyn and βIII-tubulin detected from the Triton X-100 insoluble (upper panel) and soluble (lower panel) fractions prepared from the substantia nigra or from the striatum. (D) Ratio of aSyn signals detected in the Triton X-100 soluble and insoluble fractions, expressed as relative to the mean of STING ki (substantia nigra (SN): p=0.00001; striatum: p<0.00001; t-test, n=6). (E) Representative images of striatal sections from 20-week-old STING WT and STING ki mice stained with Thioflavin S (magenta) and nuclear sdye (blue) on the composite images, and ThioS BW. Scale bar: 20 μm. (F) Number of cells with inclusions positive for Thioflavin S (ThioS) per mm2 (*: p=0.0141; t-test, n=5). (G) Representative images of striatal sections from 20-week-old STING WT and STING ki mice stained for the presynaptic marker synapsin (upper panel) or for the post-synaptic marker homer (lower panel). Scale bar: 10 μm. (H–I) Area fraction positive for synapsin (H, p=0.0053) or homer (I, p=0.0408) (mean ± SD; t-test, n=5).
Figure 3—figure supplement 1
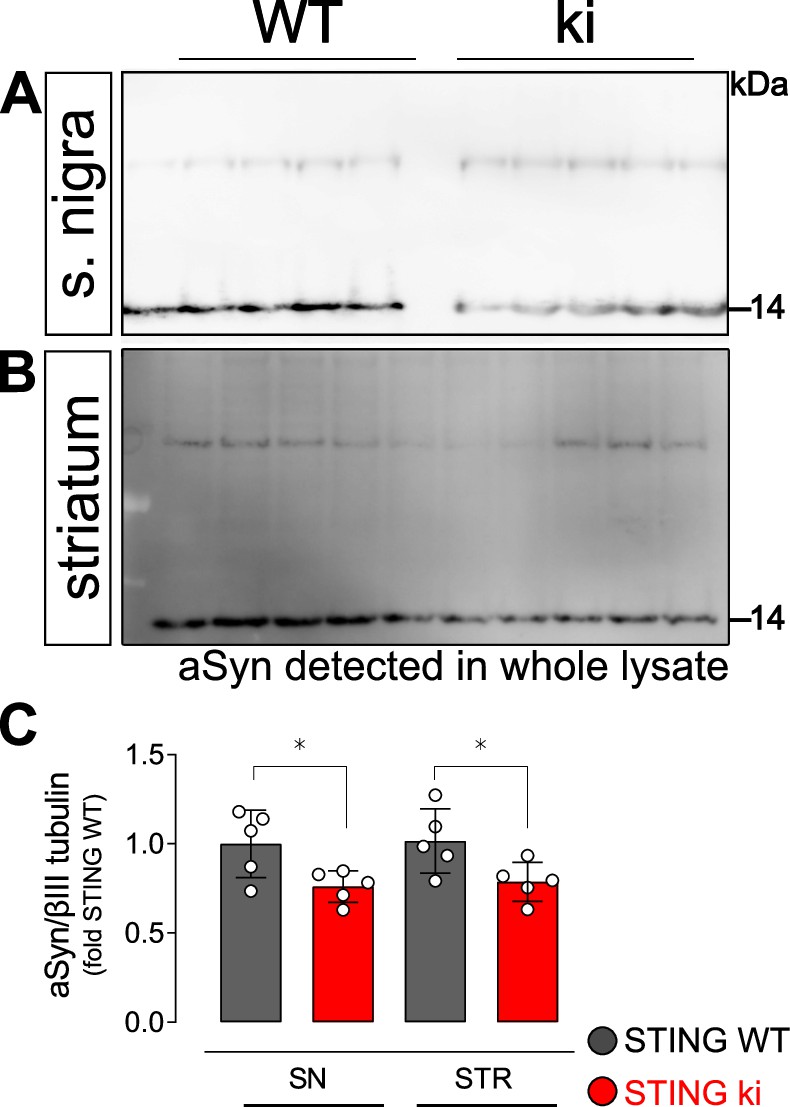
Uncropped membranes showing α-Synuclein signal detected from whole cell lysates of striatum and substantia nigra.
(A) Representative Western blot membrane showing aSyn signal in lysates prepared from the substantia nigra of STING WT and STING ki mice. (B) Representative Western blot membrane showing aSyn signal in lysates prepared from the striatum of STING WT and STING ki mice. (C) Ratio of aSyn and βIII tubulin in lysates prepared from the substantia nigra (SN) or striatum, expressed as relative to the mean of STING WT (SN: *: p=0.0462; STR: *: p=0.0491, t-test, n=5).
-
Figure 3—figure supplement 1—source data 1
Uncropped membranes showing α-Synuclein signal detected from whole cell lysates of striatum and substantia nigra.
- https://cdn.elifesciences.org/articles/81943/elife-81943-fig3-figsupp1-data1-v2.zip
Figure 4 with 1 supplement
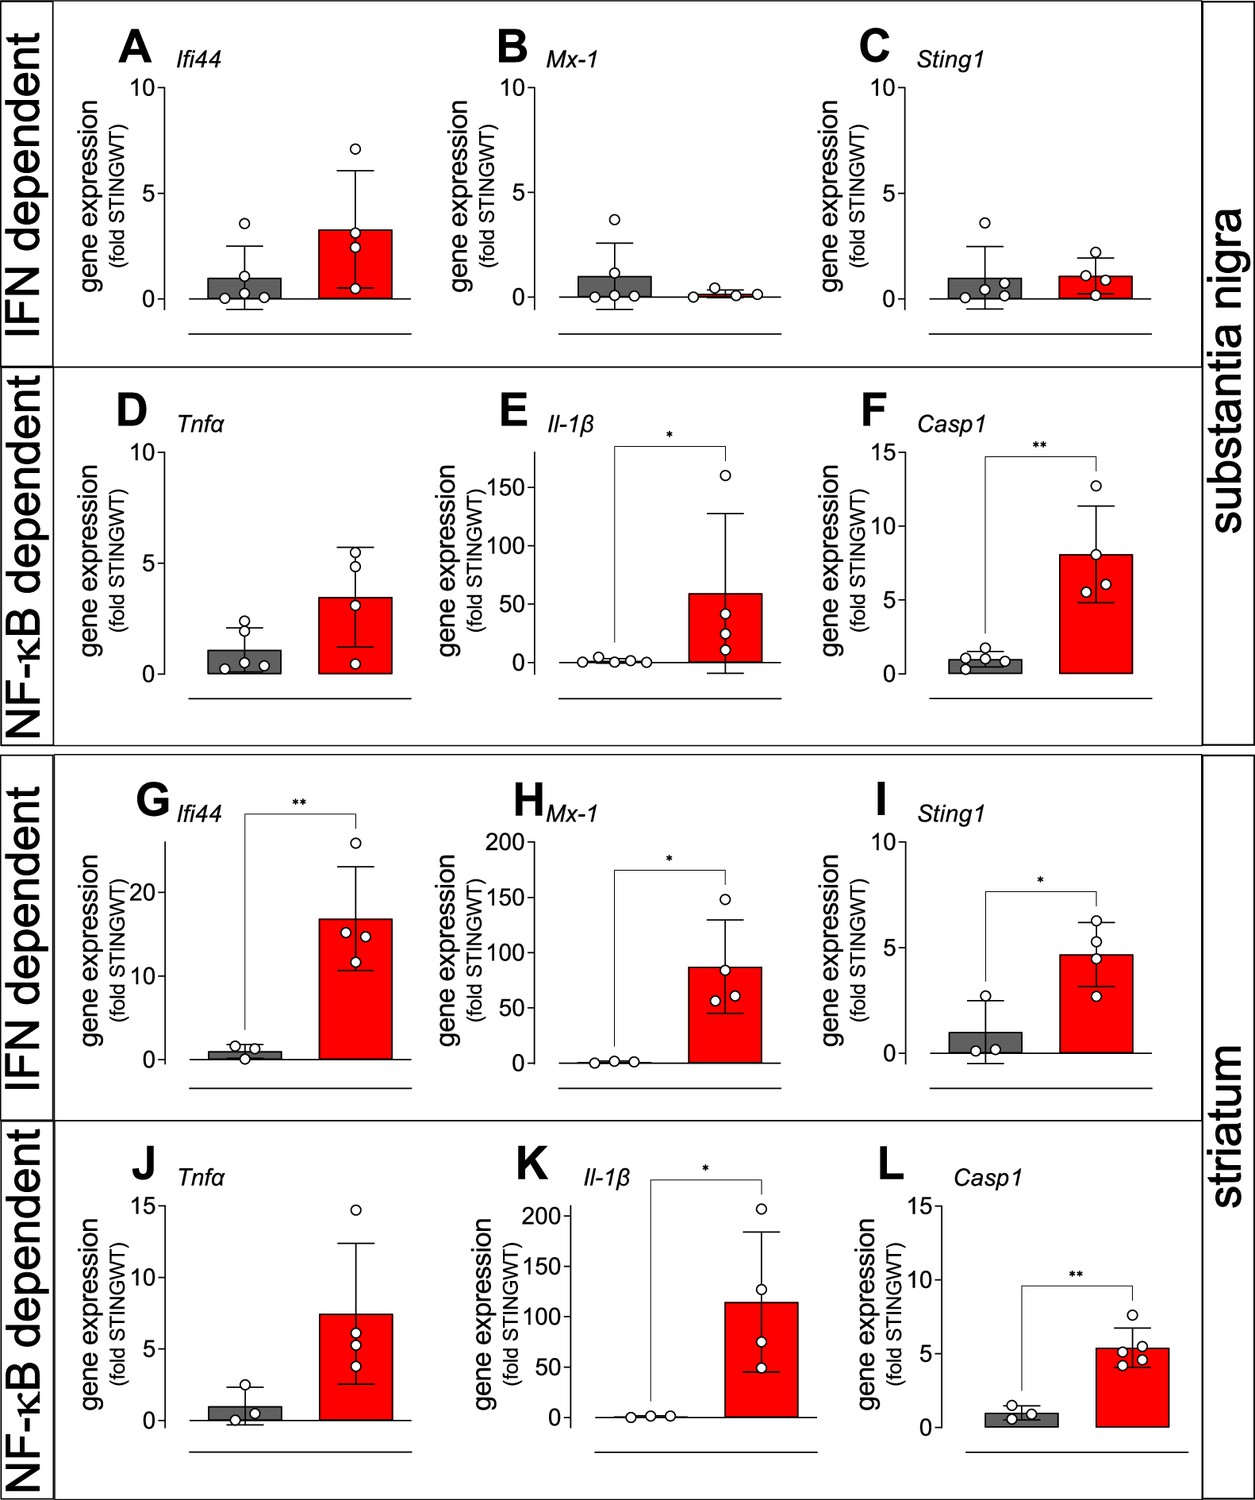
Activation of IFN and NF-κB/inflammasome related genes in the striatum and SN of STING ki mice.
(A–C) Expression of ISGs in the substantia nigra of STING WT and STING ki mice. (A) Ifi44 (p=0.1552, n=4–5), (B) Mx1 (Mann Whitney test, p=0.9048, n=4–5), (C) Sting1 (P=0.9184, n=4–5). (D–F) Expression of NF-κB/inflammasome related genes in the substantia nigra of STING WT and STING ki mice. (D) Tnfa (p=0.0691, n=4–5), (E) Il1b (Mann Whitney test, *: p=0.0159, n=4–5), (F) Casp1 (**: p=0.0018, n=4–5). (G–L) Expression of ISGs in the striatum of STING WT and STING ki mice. (G) Ifi44 (**: p=0.0078, n=3–4), (H) Mx1 (*: p=0.0183, n=3–4), (I) Sting1 (*: p=0.024, n=3–4). (J–L) Expression of NF-κB/inflammasome related genes in the striatum of STING WT and STING ki mice. (J) Tnfa (n=3–4), (K) Il1b (*: p=0.0397, n=3–4), (L) Casp1 (**: p=0.0017, n=3–5). Markers represent individual animals, bars represent mean ± SD. Analysis was t-test, if not indicated otherwise.
Figure 4—figure supplement 1
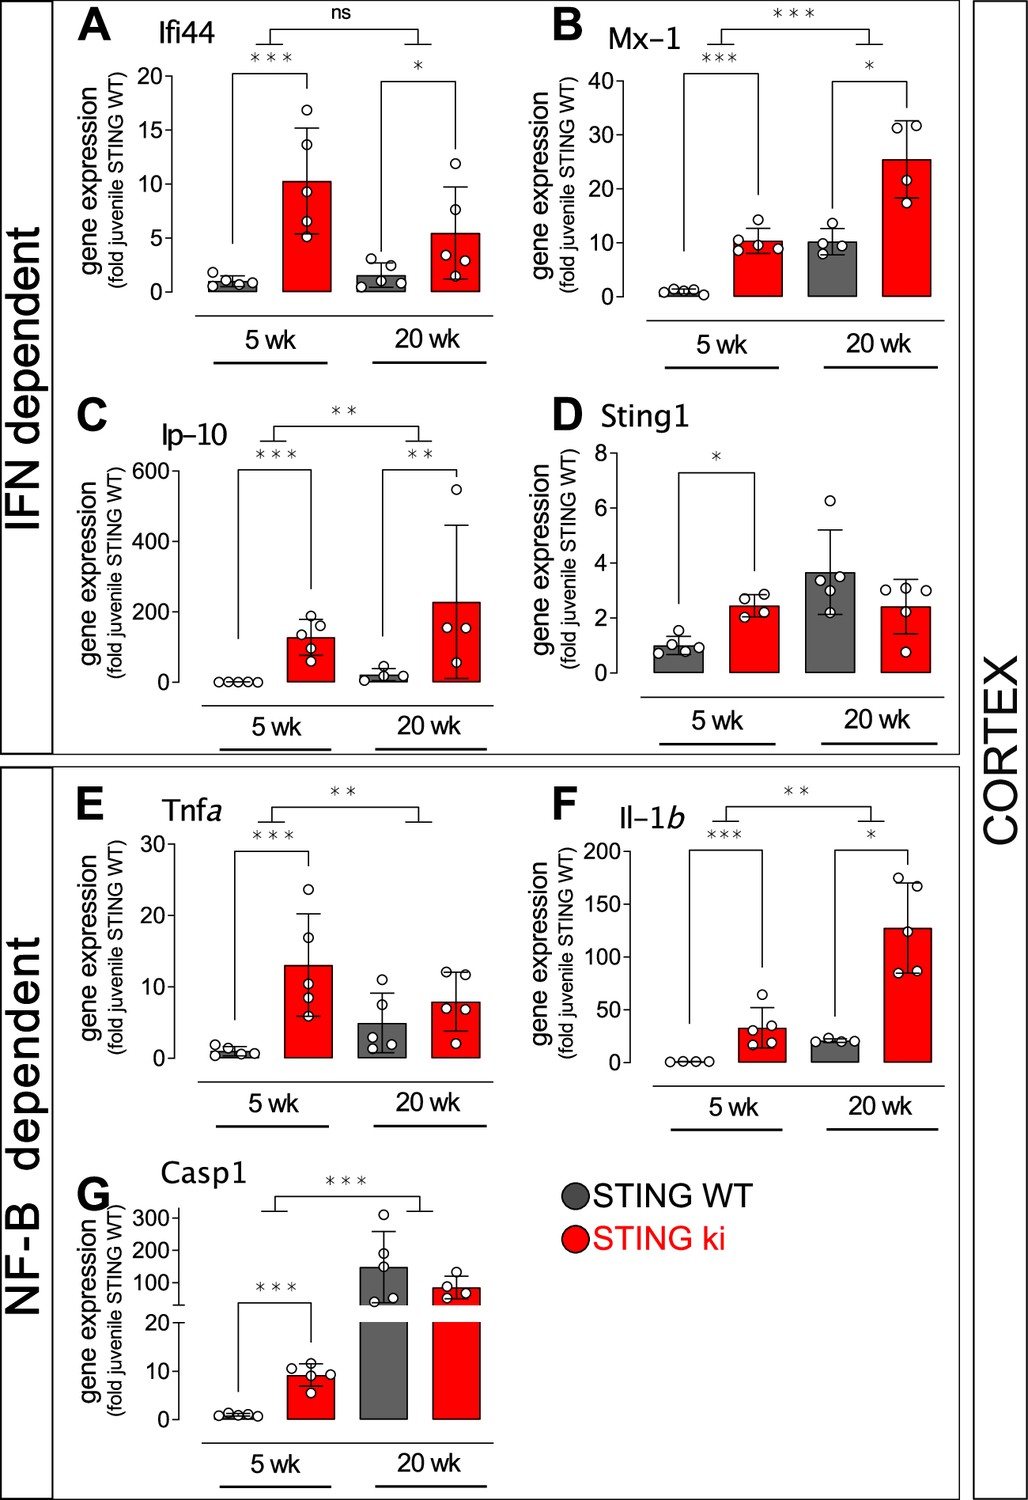
Expression of IFN and NF-κB and inflammasome dependent genes in the cortex of juvenile and adult STING ki mice.
(A–D) Expression of ISGs in the frontal cortex of STING WT and STING ki mice. (A) Ifi44 (***: p=0.0002277; *: p=0.044987, n=5), (B) Mx1 (***: p=0.0000003; *: p=0.016835; for comparison between age groups ***: p=0.000602, n=4–5), (C) Cxcl10 (***: p=0.000001; **: p=0.0017215; for comparison between age groups **: p=0.001483, n=4–5), (D) Sting1 (*: p=0.0184042, n=4–5). (E–G) Expression of NF-κB/inflammasome related genes in the frontal cortex of STING WT and STING ki mice. (E) Tnfa (***: p=0.0001448, for comparison between age groups *: p=0.03952, n=5). (F) Il1b (***: p=0.00005, *: p=0.0389, for comparison between age groups **: p=0.00241, n=4–5). (G) Casp1 (***: p=0.0000369, for comparison between age groups ***: p=0.000064, n=4–5). Markers represent individual animals, bars represent mean ± SD. Analysis was two-way ANOVA with Tukey HSD post-hoc test.
Figure 5 with 1 supplement
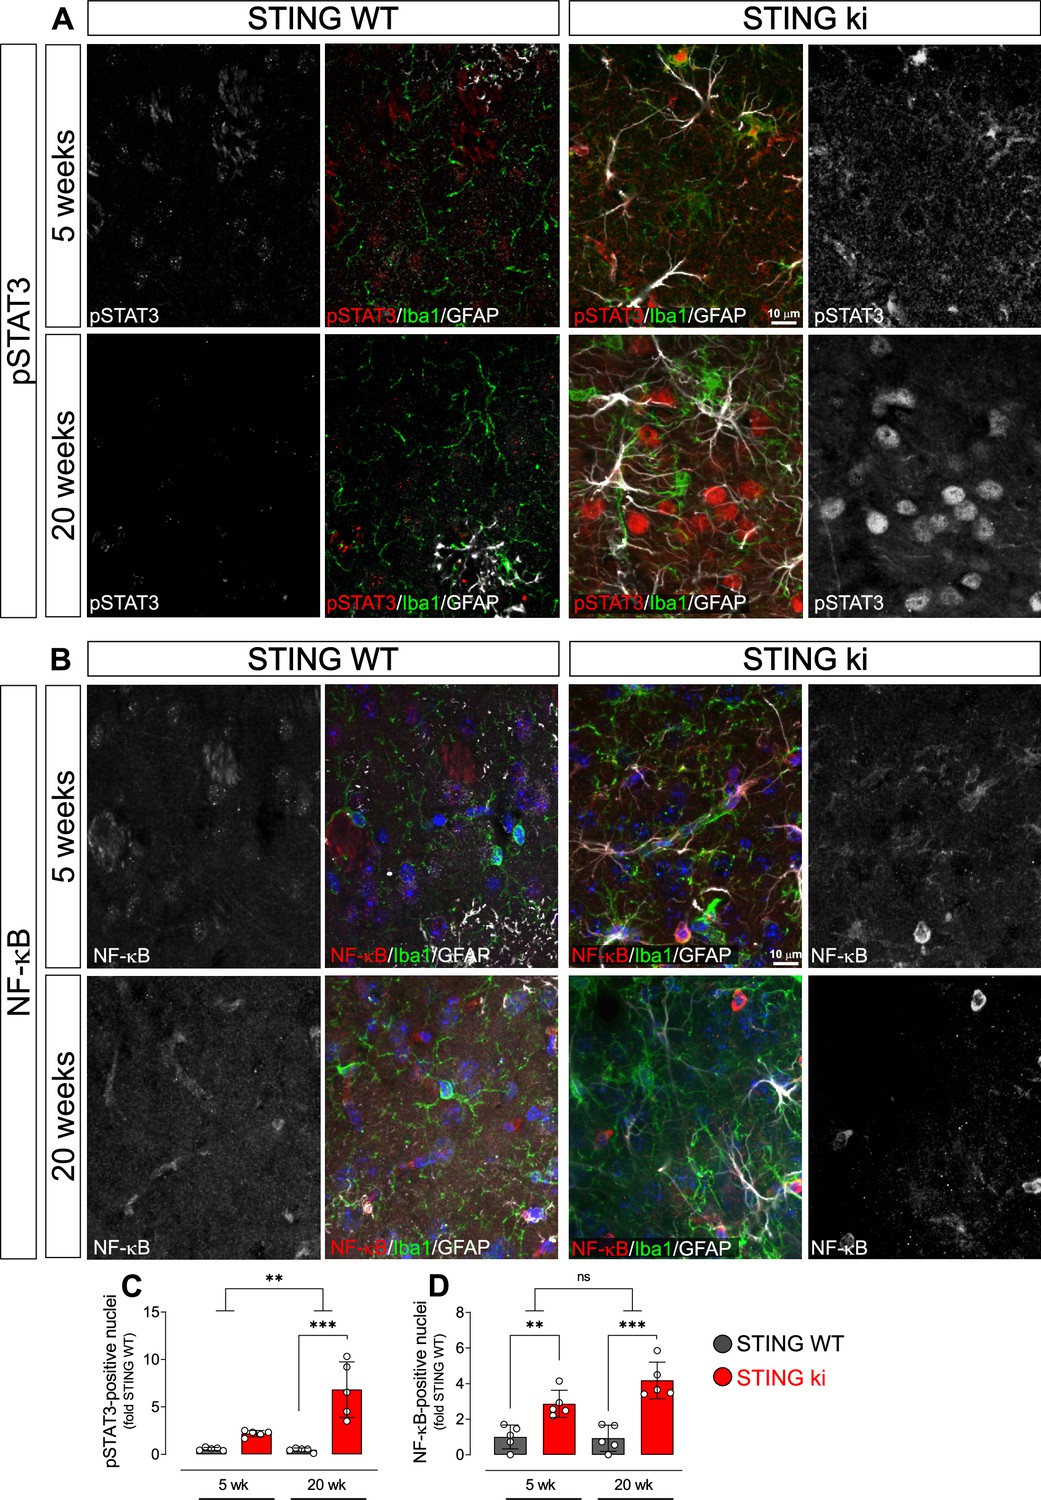
Nuclear translocation of pSTAT3 and NF-κB in the striatum of 5-week-old and 20 week-old STING WT and STING ki mice.
(A) Representative images of striatal sections from 5-week-old (upper images) and 20-week-old (lower images) STING WT and STING ki mice stained for Iba1 (green), GFAP (white) and phosphorylated-STAT3 (pSTAT3; red). Images show color coded merged channels (center) and in addition pSTAT3 staining in grayscale (left and right). Scale bar: 10 μm. (B) Representative images of striatal sections from 5-week-old (upper images) and 20 week-old (lower images) STING WT and STING ki mice stained for Iba1 (green), GFAP (white), and NF-κB (red). NF-kB staining is shown in grey in separate images. Scale bar: 10 μm. (C) Number of pSTAT3-positive nuclei/mm3 (***: p=0.00004; **: p=0.0025 for the interaction; two-way ANOVA, Bonferroni post-hoc test, n=5). (D) Number of NF-kB-positive nuclei/mm3 (**: p=0.009; ***: p=0.0007; mean ± SD; two-way ANOVA, Bonferroni post-hoc test, n=5).
Figure 5—figure supplement 1
Uncropped membranes showing the levels of inflammatory proteins in the striatum.
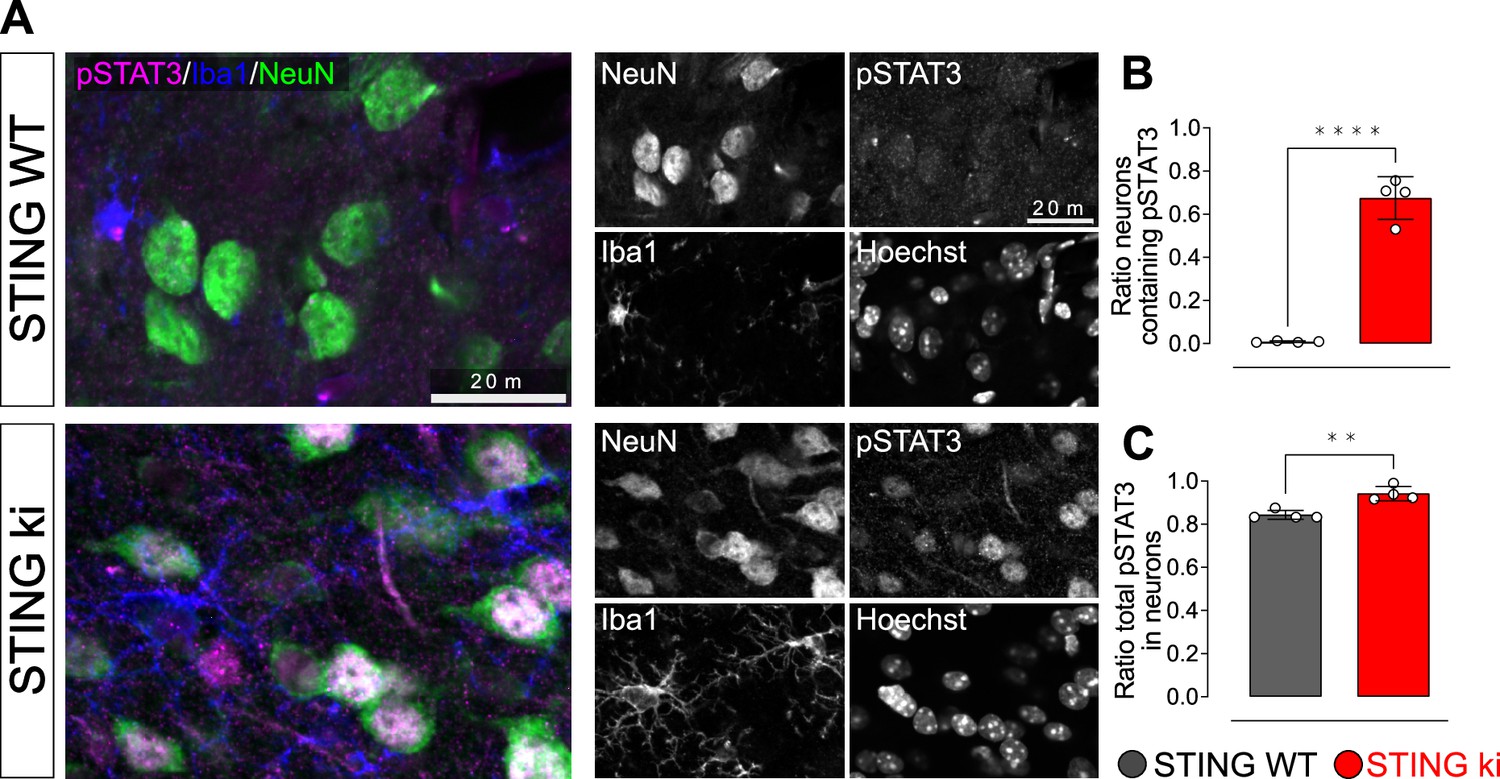
(A) Representative images of striatal sections from 20-week-old STING WT and STING ki mice stained for phosphorylated-STAT3 (pSTAT3, magenta), Iba1 (blue) and NeuN (green). Images show color-coded merged channels (left) and in addition all channels in grayscale (right). Scale bar: 20 μm. (B) Ratio of NeuN-positive cells positive for pSTAT3 as well: (number of pSTAT3- and NeuN-positive cells)/(total number of NeuN-positve cells); (****: p=0.000065; t-test). (C) Ratio of neuronal pSTAT3-positive nuclei: (number of pSTAT3- and NeuN-positive cells)/(total number of pSTAT3-positve cells); **: p=0.0025; t-test. n=4.
Figure 6 with 1 supplement
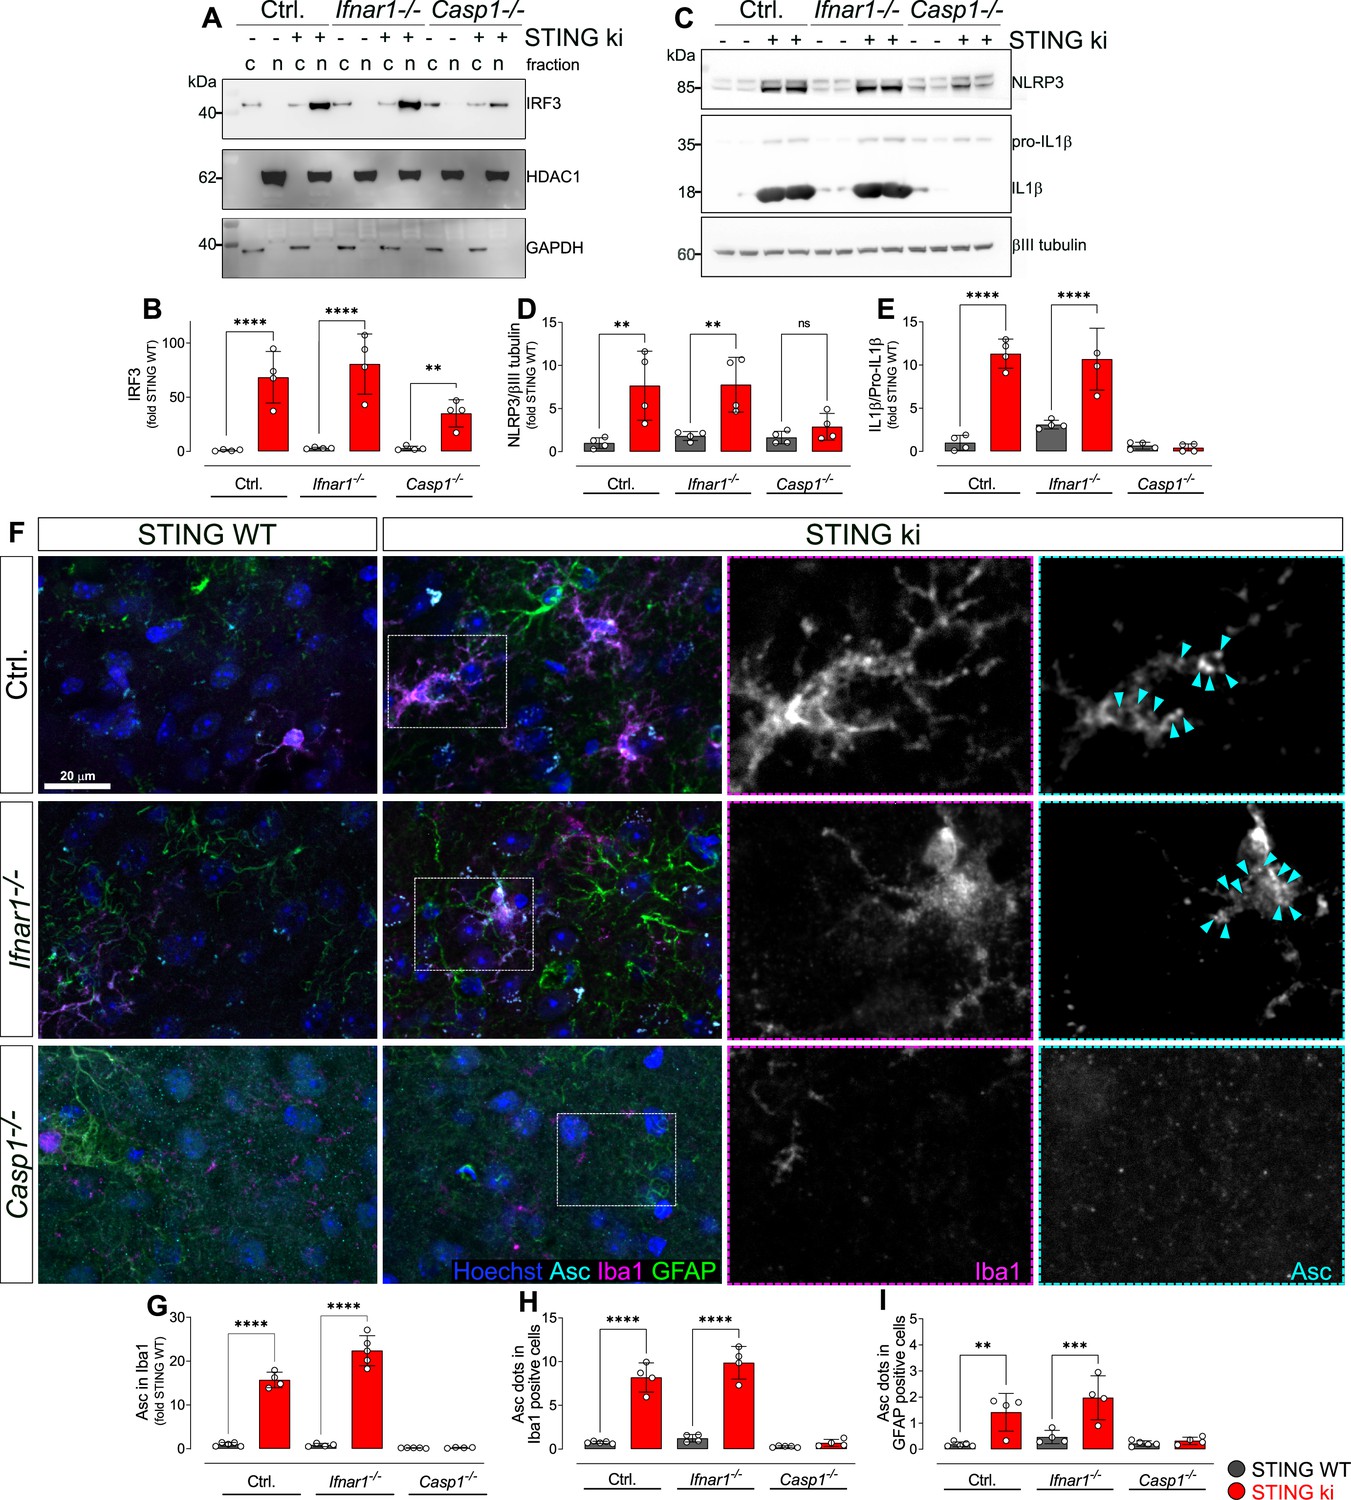
Activation of IRF3 and NF-kB-related signalling pathways in double transgenic mice with STING N153S/WT ki and knock-out for Ifnar1 or Caspase-1.
(A) Representative western blot images showing interferon regulatory factor 3 (IRF3, upper panel), the nuclear marker histone deacetylase 1 (HDAC1, middle panel) and cytoplasmic marker glycerinaldehyd-3-phosphat-dehydrogenase (GAPDH, lower panel) detected from the striatum. Images of the whole membrane stained for the different proteins are shown on Figure 6—figure supplement 1A-C. (B) Ratio of IRF3 and HDAC1, expressed as relative to the mean of STING WT (****: p<0.00001; **: p=0.0043; two-way ANOVA with Tukey post-hoc test, n=4). Ratio of IRF3 and GAPDH expressed as relative to the mean of STING WT is shown on Figure 6—figure supplement 1D. (C) Representative western blot images showing NLR family pyrin domain containing 3 (NLRP3, upper panel), Il1b and pro-Il1b (middle panel) and the loading control βIII tubulin (lower panel) detected from the striatum. Images of the whole membrane stained for the different proteins are shown on Figure 6—figure supplement 1E-H. (D) Ratio of NLRP3 and βIII tubulin, expressed as relative to the mean of STING WT (**: p<0.0057; **: p=0.0029; two-way ANOVA with Tukey post-hoc test, n=4). (E) Ratio of Il1b and pro-Il1b, expressed as relative to the mean of STING WT (****: p<0.00001; two-way ANOVA with Tukey post-hoc test, n=4). (F) Representative images of striatal sections stained for the astroglia marker GFAP (green), microglia marker Iba1 (magenta), apoptosis-associated speck-like protein (ASC, cyan) and Hoechst (blue) from STING WT or STING ki mice on a background of interferon a receptor knockout (Ifnar1-/-), caspase-1 knockout (Casp1-/-) or Ifnar1+/+, Casp1+/+ (Ctrl.). Scale bar: 20 μm. Magnified insets show Iba1 and ASC, cyan arrowheads indicate ASC specks. (G) Area fraction of ASC signal within microglia as relative to the mean of STING WT (****: p<0.00001; two-way ANOVA with Tukey post-hoc test, n=4–5). (H) Number of ASC-positive dots within microglia as relative to the mean of STING WT (****: p<0.00001; two-way ANOVA with Tukey post-hoc test, n=4–5). (I) Number of ASC-positive dots within astroglia as relative to the mean of STING WT (**: p=0.0083; ***: p=0.0006; two-way ANOVA with Tukey post-hoc test, n=4–5). Graph showing area fraction of ASC signal within astroglia is on Figure 6—figure supplement 1I.
Figure 6—figure supplement 1
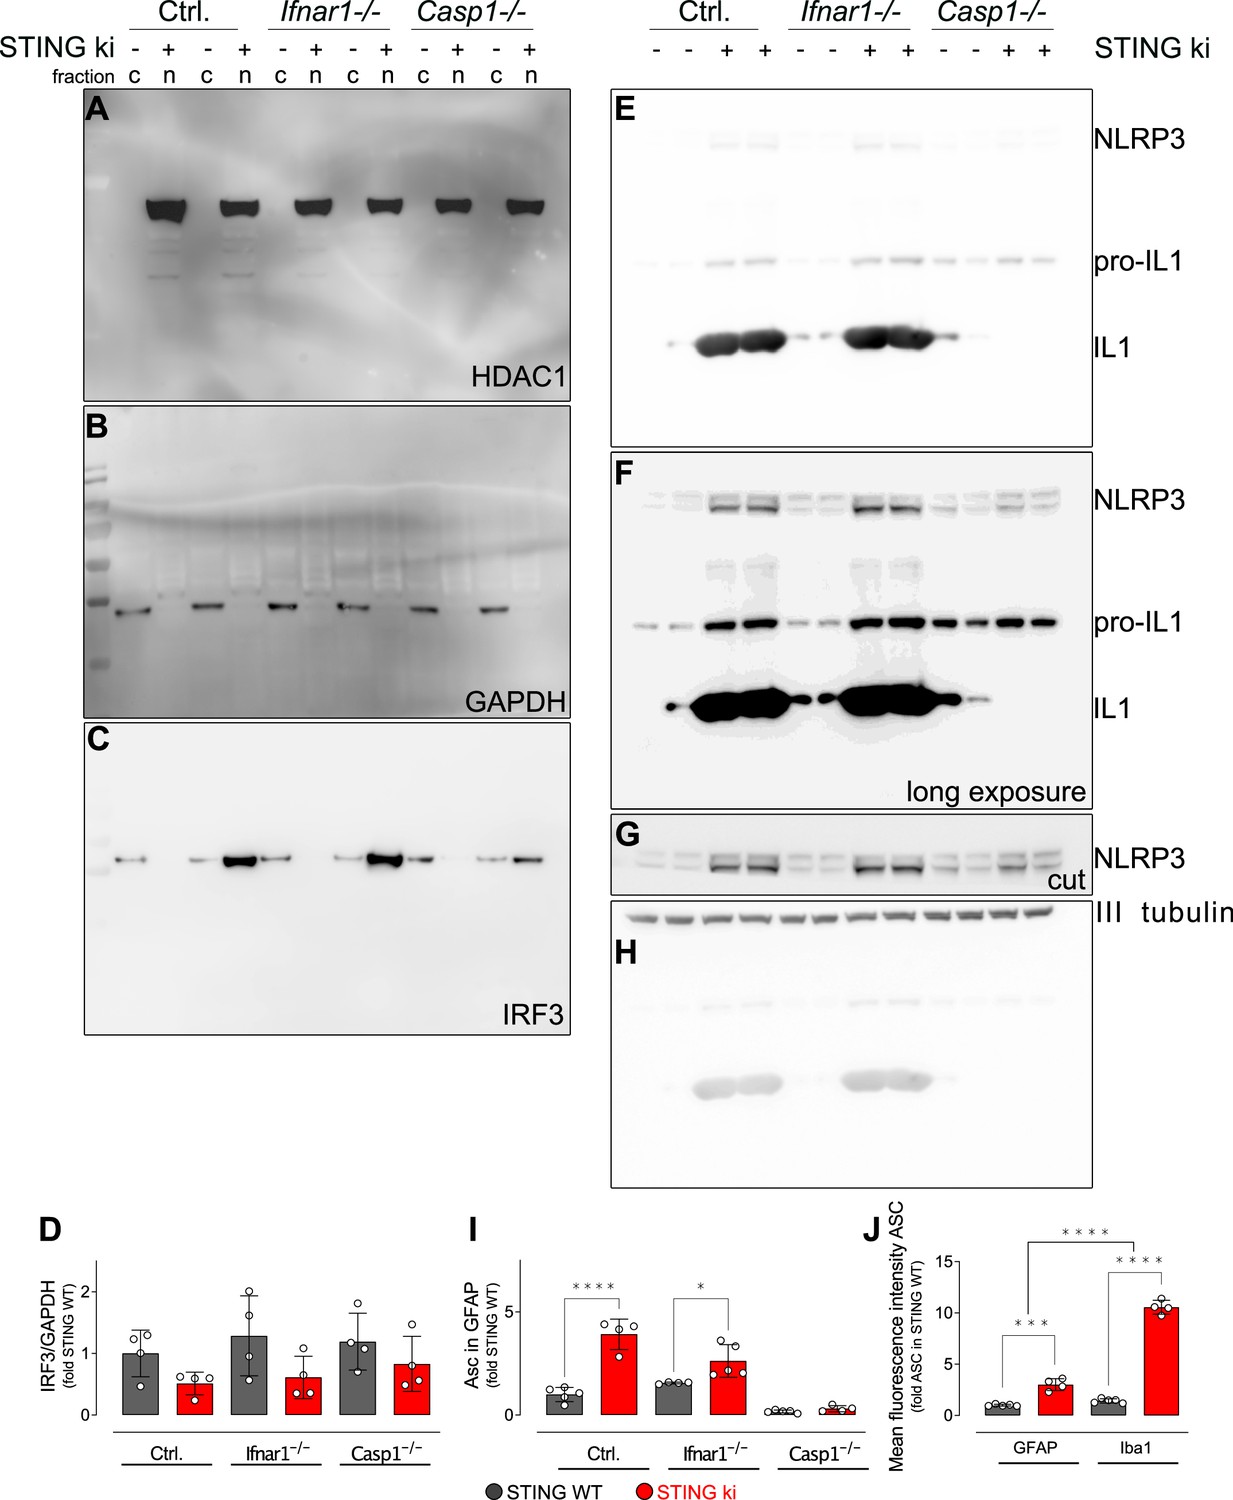
Uncropped membranes showing the levels of inflammatory proteins in the striatum.
(A–C) Images of the whole membrane developed for the HDAC1 (A), GAPDH (B) and IRF3 signals. (D) Ratio of IRF3 and GAPDH signal (‘cytoplasmic IRF3’) as relative to the mean of STING WT (two-way ANOVA with Tukey HSD post-hoc test, n=4). (E–H) Images of the whole membrane developed for the NLRP3 and Il1b with short exposure time (E) or longer exposure time (F); and for βIII tubulin (H). Membrane was cut between the NLRP3 and tubulin signals. (I) Area fraction positive for ASC signal within GFAP-positive astroglia, as relative to the mean of STING WT (****: p<0.00001; *: p=0.038, two-way ANOVA with Tukey HSD post-hoc test, n=4–5). (J) Mean intensity of ASC signal in GFAP-positive or in Iba1-positive cells, expressed as relative to astroglial ASC signal in STING WT animals (***: p=0.0001; ****: p=0.000054; interaction: ****: p=0.000078, n=4–5).
-
Figure 6—figure supplement 1—source data 1
Individual, uncropped membranes.
- https://cdn.elifesciences.org/articles/81943/elife-81943-fig6-figsupp1-data1-v2.zip
Figure 7 with 2 supplements
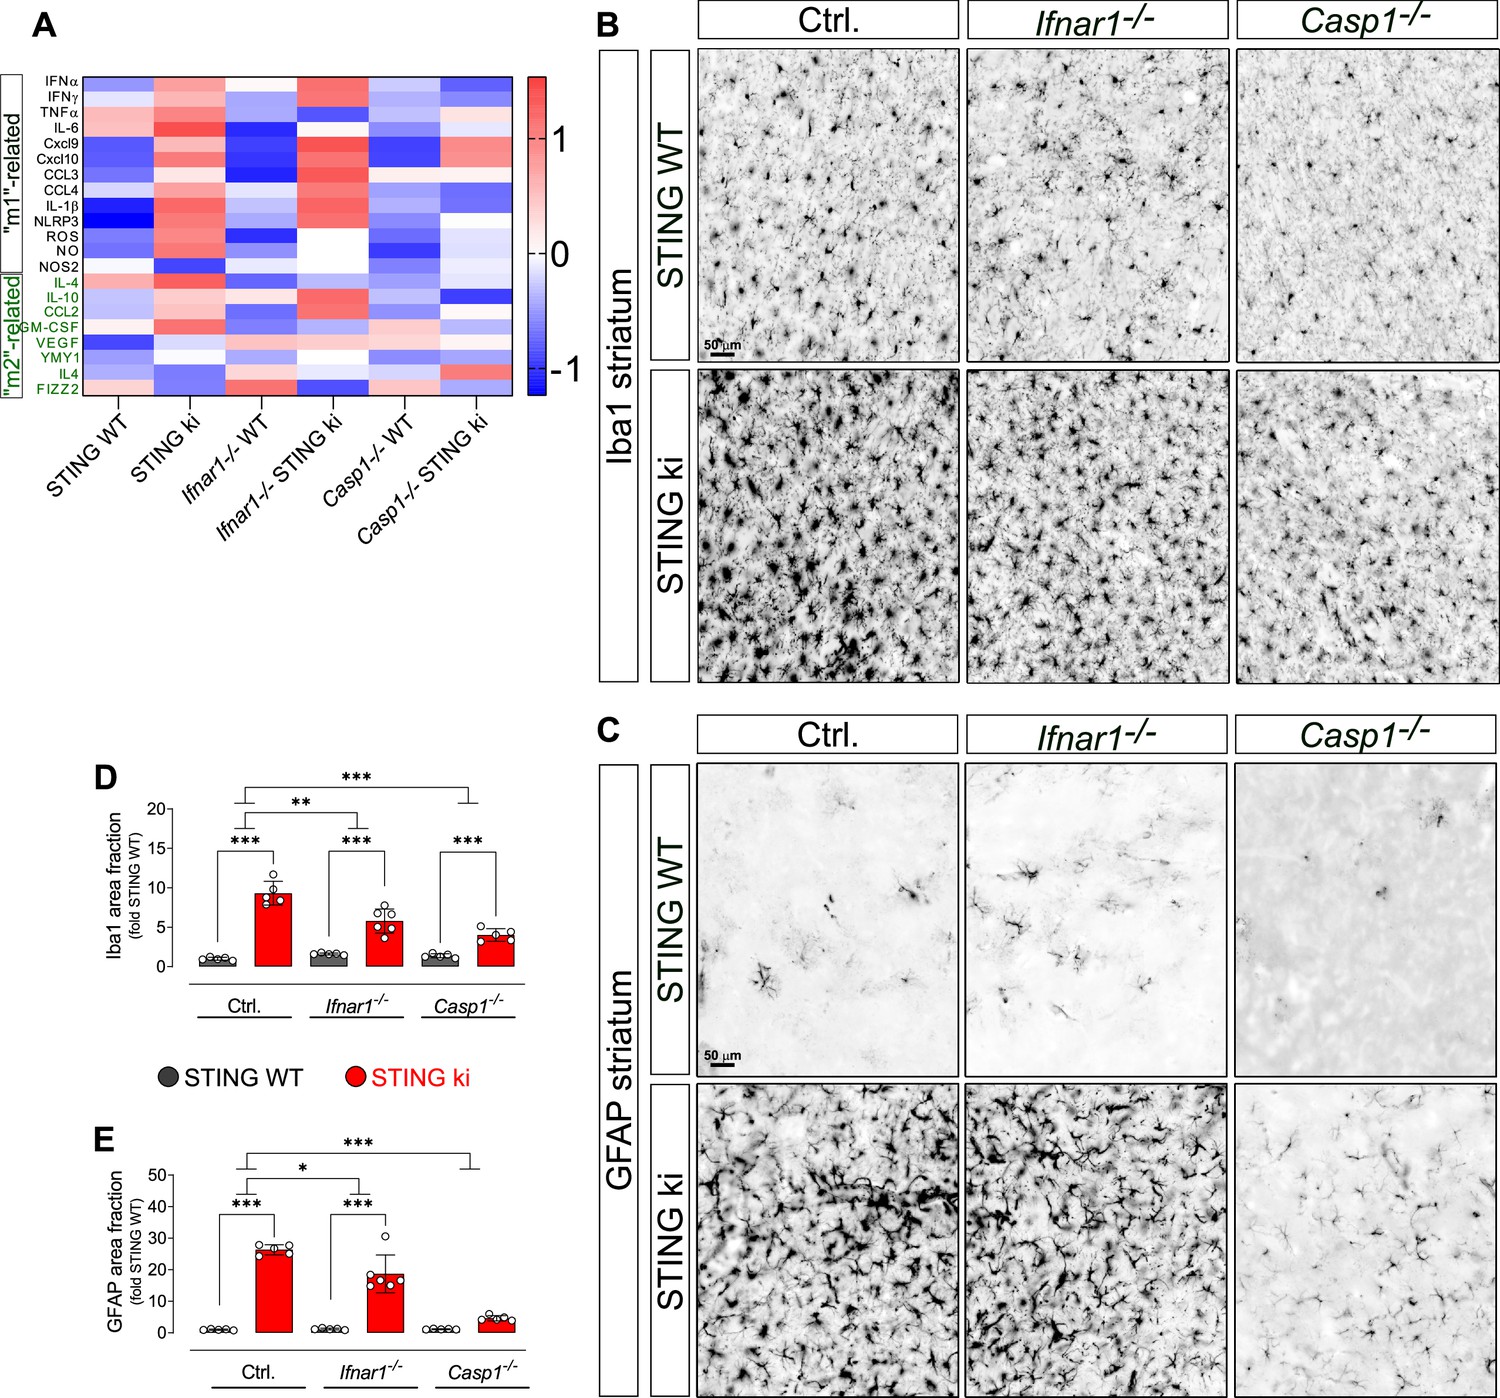
Neuroinflammation in adult double transgenic mice with STING ki and knock-out for Ifnar1 or Caspase-1.
(A) Heatmap showing z-scores of different inflammatory markers in double transgenic mice with STING N153S/WT ki and knock-out for Ifnar1 or Caspase-1. Graphs with data for each mediator individually are on (Figure 7—figure supplement 2). (B) Representative images of striatal sections stained for the microglia marker Iba1. Sections were obtained from adult STING WT (upper images) or STING ki (lower images) mice on a background of interferon a receptor knockout (Ifnar1-/-), caspase-1 knockout (Casp1-/-) or Ifnar1+/+, Casp1+/+ (Ctrl.). Scale bar: 50 μm. (C) Representative images of striatal sections stained for the astroglia marker GFAP from STING WT (upper images) or STING ki (lower images) mice on a background of interferon a receptor knockout (Ifnar1-/-), caspase-1 knockout (Casp1-/-) or Ifnar1+/+, Casp1+/+ (Ctrl.). Scale bar: 50 μm. (D) Area fraction positive for Iba1, normalized to the mean of STING WT brains (differences in +/+ mice ***: p=0.0000001; for Ifnar1-/- ***: p=0.000003; for Casp1-/- ***: p=0.0029374; two-way ANOVA with Bonferroni post-hoc test, n=5–6). (E) Area fraction positive for GFAP, normalized to STING WT on Ctrl. Background (***: p=0.0000 for STING WT vs STING ki on Ctrl.; ***: p=0.0000 on Ifnar1-/-; background, ***: p=0.0006 on Casp1-/- background; two-way ANOVA with Bonferroni post-hoc test, n=5–6).
Figure 7—figure supplement 1
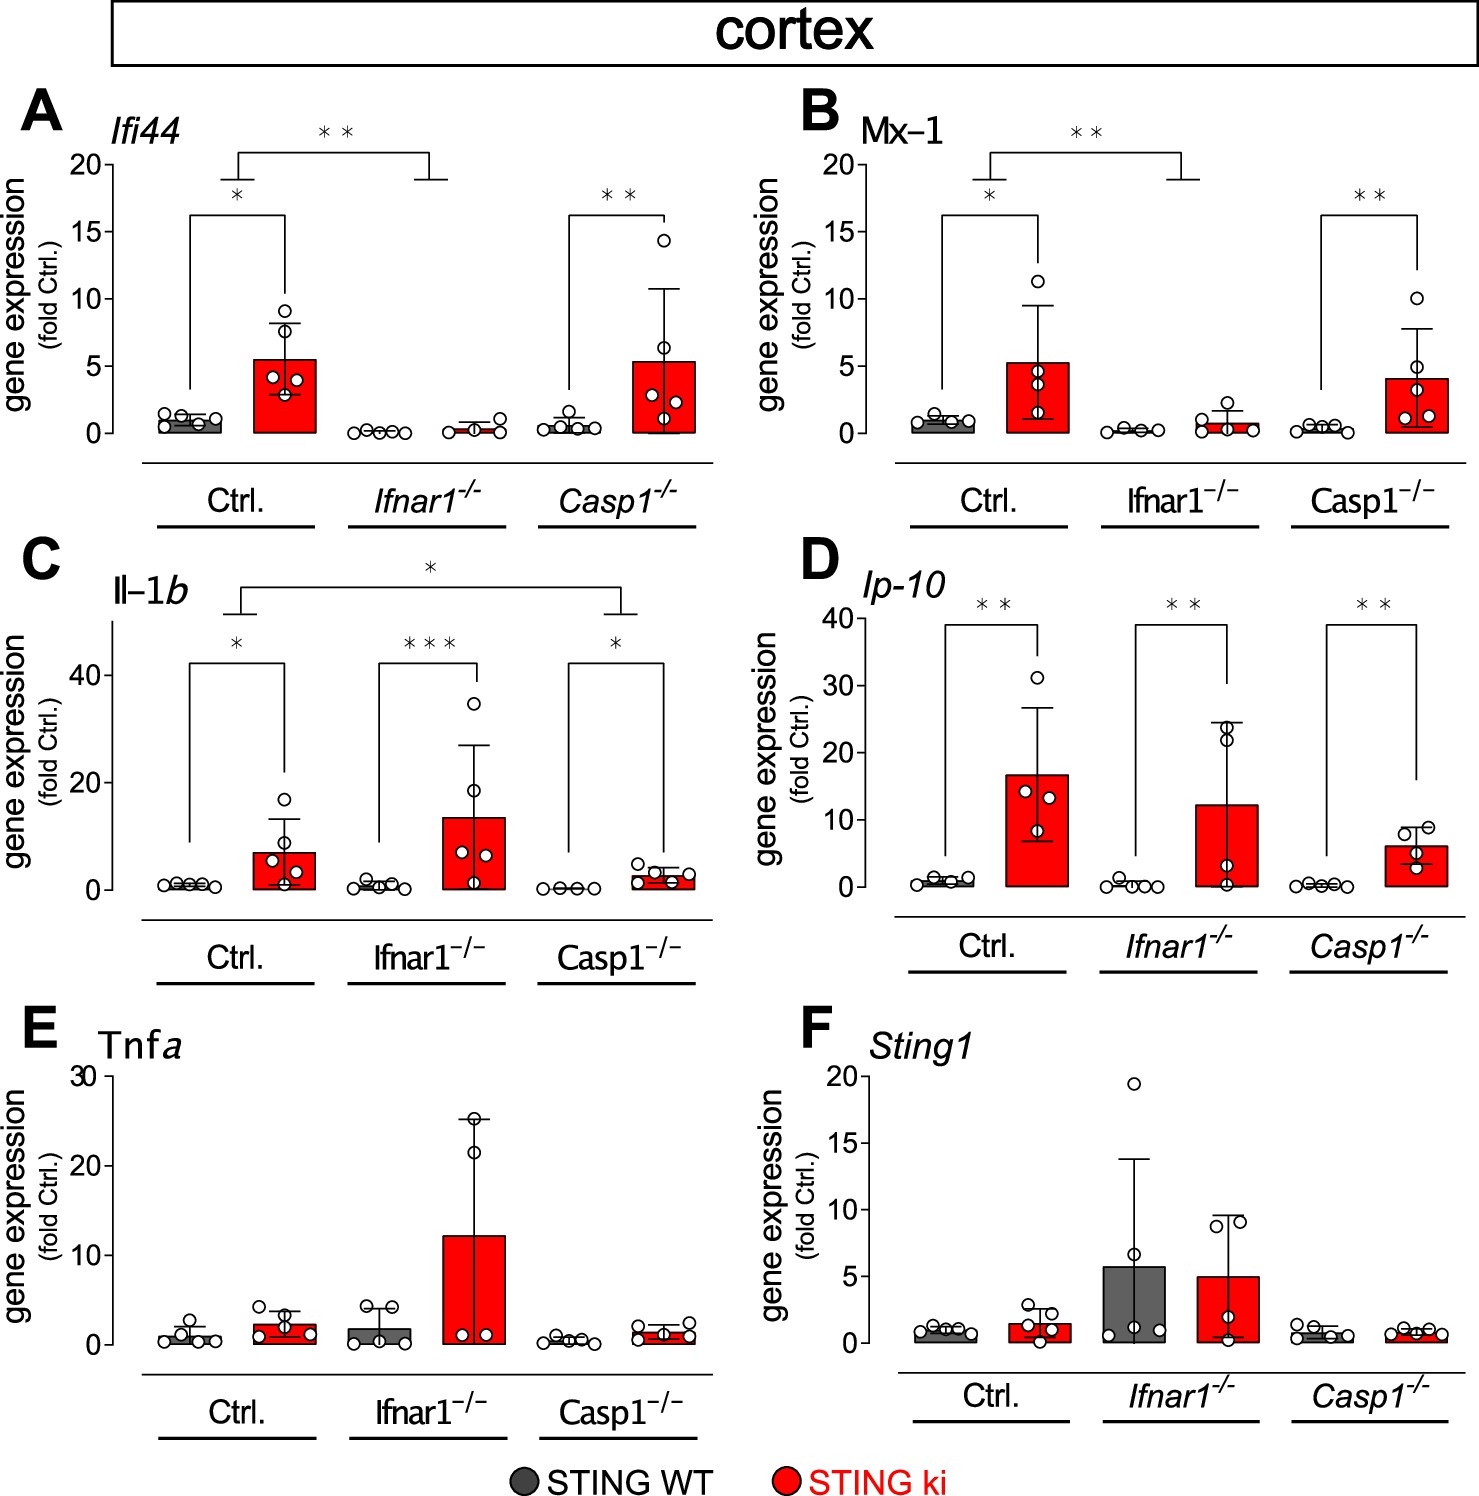
Expression of IFN- and NF-κB/inflammasome related genes in the cortex of double transgenic mice with STING N153S/WT ki and knock-out for Ifnar1 or Caspase-1.
Gene expression in the cortex (two-way ANOVA with Tukey HSD post-hoc test). (A) Ifi44 (*: p=0.01414; **: p=0.0037655; for interaction between Ctrl. and Ifnar1-/-, **: p=0.005101, n=4–5). (B) Mx1 (*: p=0.02823; **: p=0.00573, n=4–5). (C) Il1b (Ctrl. background *: p=0.04534; **: p=0.005405; Casp1-/- background *: p=0.0107096; for interaction between Ctrl. and Casp1-/-, *: p=0.01298, n=4–5). (D) Cxcl10 (Ctrl. background **: p=0.0030844; Ifnar1-/- background: p=0.025893; Casp1-/- background **: p=0.0041598, n=4–5). (E) Tnfa (all differences n.s., n=4–5). (F) Sting1 (all differences n.s., n=4–5).
Figure 7—figure supplement 2
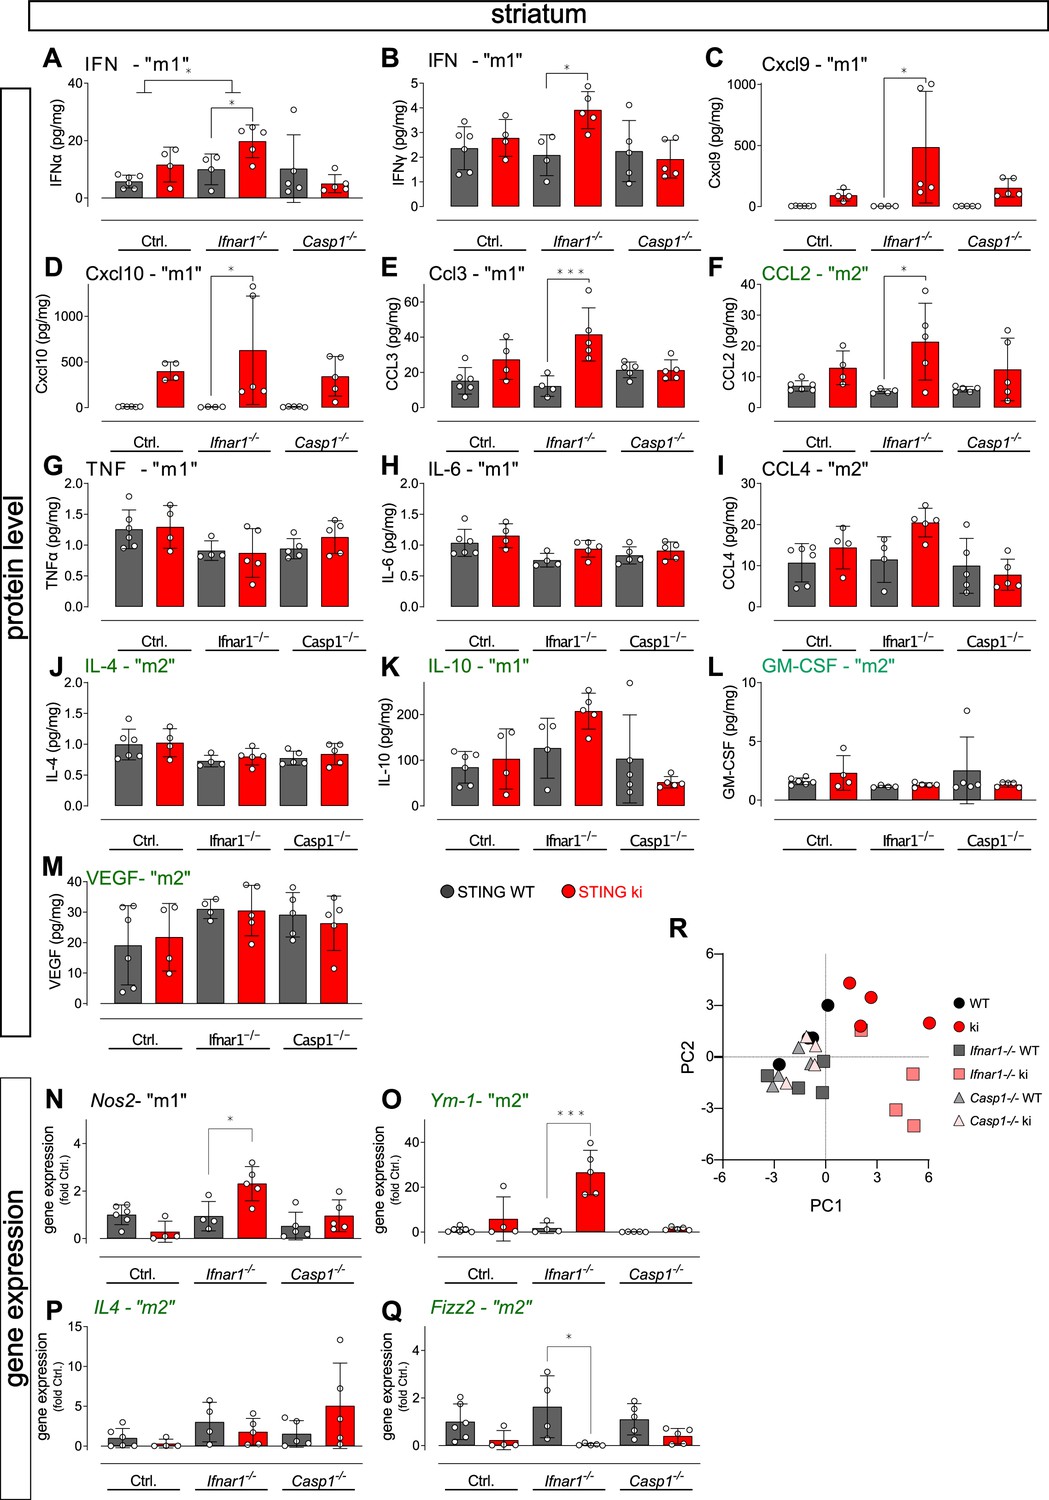
Levels of inflammatory mediators and gene expression in the striatum of double transgenic mice with STING N153S/WT ki and knock-out for Ifnar1 or Caspase-1.
(A–M) Tissue levels of different ‘M1’ and ‘M2’ mediators in the striatum as measured by LegendPlex Immunoassay (ANOVA with Tukey HSD post-hoc test). (A) IFNα (*: p=0.0394; for interaction: *: p=0.0465); (B) IFNγ (*: p=0.0194); (C) Cxcl9 (*: p=0.0129); (D) Cxcl10 (*: p=0.0223); (E) CCL3 (***: p=0.0009); (F) CCL2 (*: p=0.0264); (G) TNFα; (H) IL-6; (I) CCL4; (J) Il4; (K) IL-10; (L) GM-CSF; (M) VEGF; (N–Q) Gene expression in the striatum (two-way ANOVA with Tukey HSD post-hoc test). (N) Nos2 (*: p=0.0214). (O) Ym-1 (***: p=0.0004). (P) Il4. (Q) Retnla, b or g (p=0.021). (R) Principal component analysis (PCA) of immune mediators shows segregation of STING ki animals on the Ifnar1+/+, Casp1+/+ (ki) and on the Ifnar1-/- (Ifnar1-/- ki) from all other groups. n=4–6.
Figure 8
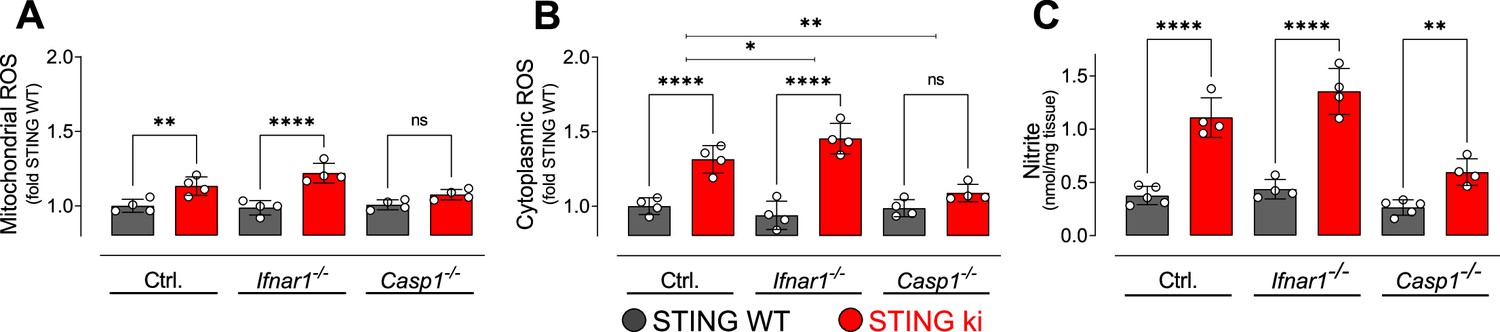
Oxidative stress in the striatum of double transgenic mice with STING N153S/WT ki and knock-out for Ifnar1 or Caspase-1.
(A) Mitochondrial reactive oxygen species (ROS) of striatal lysates determined using MitoSOX and expressed relative to the mean of STING WT (**: p=0.0072; ****: p<0.00001; two-way ANOVA with Tukey post-hoc test, n=4). (B) Cytoplasmic ROS of striatal lysates determined using DCFH-DA and expressed relative to the mean of STING WT (****: p<0.00001; *: p=0,034; **: p=0.0069; two-way ANOVA with Tukey post-hoc test, n=4). (C) Nitrite levels as markers of nitric oxide activity measured in striatal lysates (****: p<0.00001; **: p=0.0052; two-way ANOVA with Tukey post-hoc test, n=4–5).
Figure 9 with 1 supplement
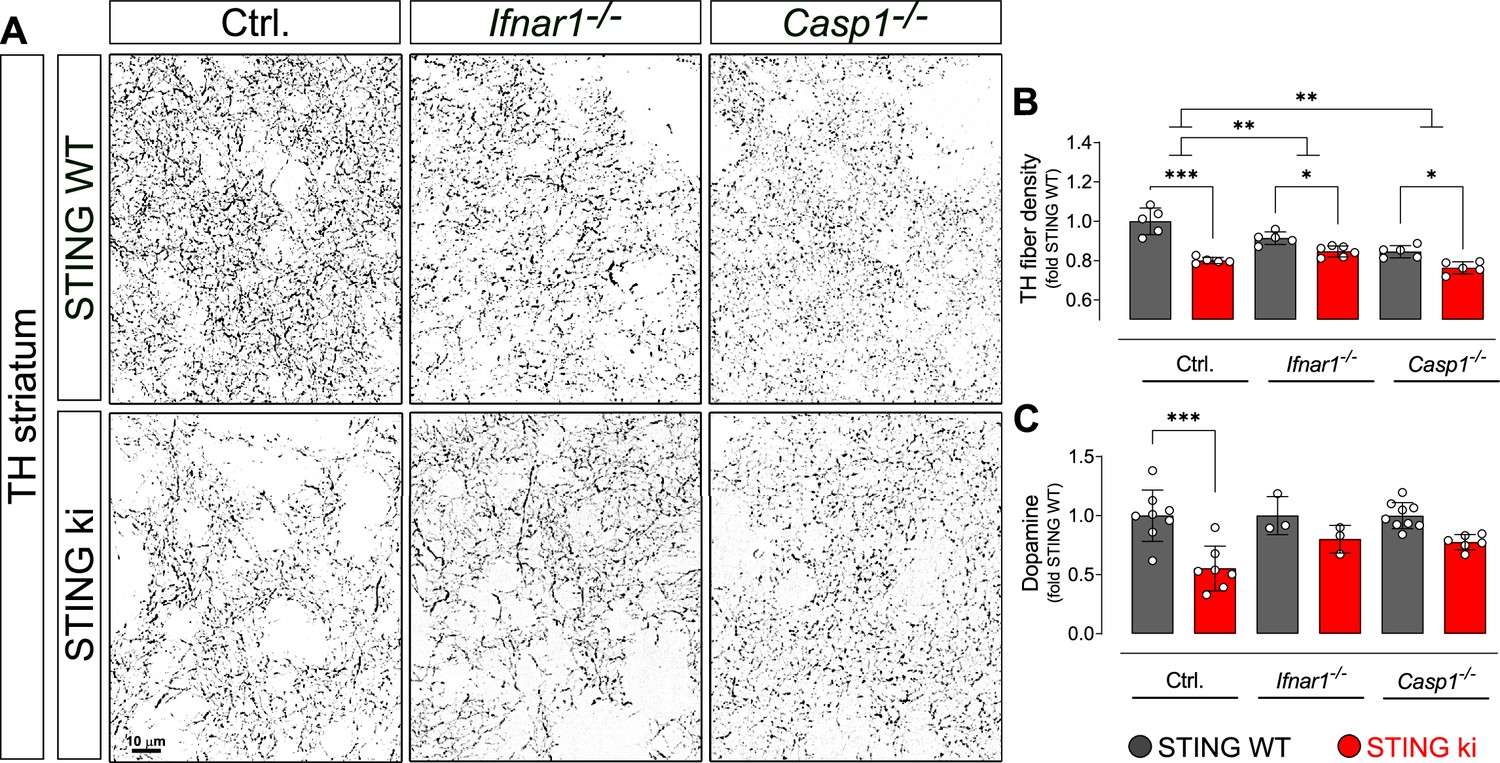
Degeneration of dopaminergic neurons in double transgenic mice with STING N153S/WT ki and knock-out for Ifnar1 or Caspase-1.
(A) Representative images of striatal sections stained for tyrosine hydroxylase (TH) from STING WT (upper images) or STING ki (lower images) mice on a background of interferon a receptor knockout (Ifnar1-/-), caspase-1 knockout (Casp1-/-) or Ifnar1+/+, Casp1+/+ (Ctrl.). Scale bar: 10 μm. (B) Area fraction positive for TH, normalized to STING WT on Ctrl. background (***: p=0.0000 for Ctrl. background; *: p=0.043 for Ifnar1-/-; **: p=0.0126845 for Casp1-/-; for interaction between Ctrl. background and Ifnar1-/-: p=0.00157; between Ctrl. and Casp1-/-: p=0.007326; two-way ANOVA with Bonferroni post-hoc test, n=5–6). (C) Concentration of dopamine in striatal lysates of STING WT and STING ki mice, normalized to STING WT on Ctrl. background. (***: p=0.0005; t-test, n=5–6). Dopamine metabolism is shown on Figure 9—figure supplement 1.
Figure 9—figure supplement 1
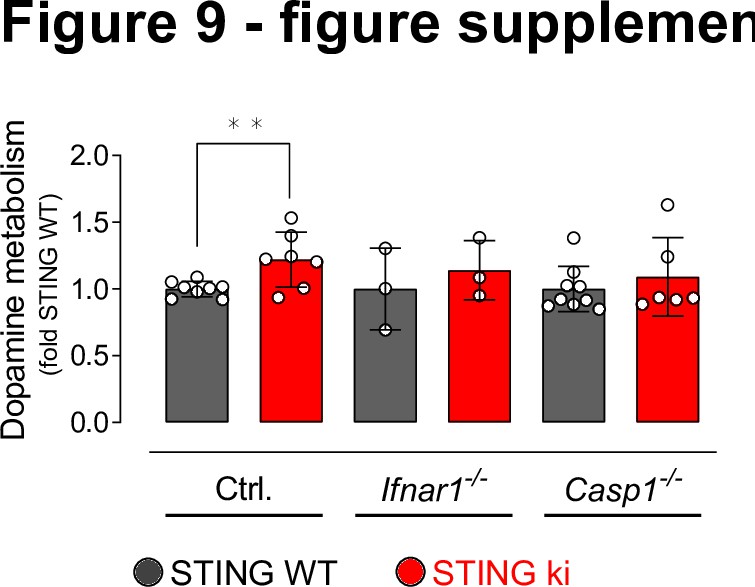
Dopamine metabolism in the striatum of double transgenic mice with STING N153S/WT ki and knock-out for Ifnar1 or Caspase-1.
Dopamine metabolism in the striatum (**: p=0.0073; two-way ANOVA, Tukey HSD post-hoc test, n=3–8).
Author response image 1
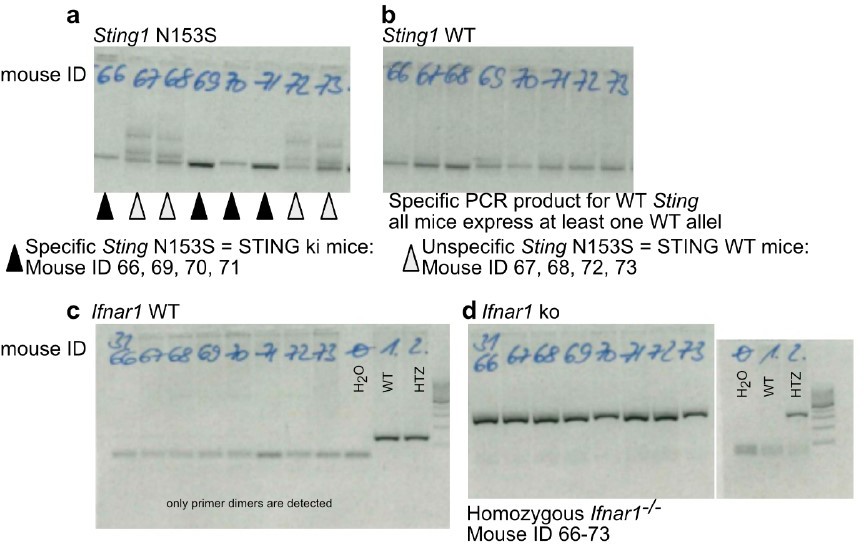
Example for correct genotyping of animals used in the experiments.
(a) PCR product by using primers specifically detecting the N153S variant of STING. (b) PCR product by using primers specifically detecting the WT (mouse) variant of STING. Mice with ID 66, 69, 70 and 71 are STING ki expressing both the mutant Sting1 and the WT Sting1. Mice with ID 67, 68, 72, 73 are STING WT. (c) PCR product by using primers specifically detecting the mouse Ifnar. (d) PCR product by using primers specifically detecting the lack of mouse Ifnar. All mice are Ifnar-/-.
Author response image 2
Tables
Appendix 1—key resources table
| Reagent type (species) or resource | Designation | Source or reference | Identifiers | Additional information |
|---|---|---|---|---|
| Strain (Mus musculus) | STING ki (STING N153S knock-in mice) | Luksch et al., 2019 | C57BL/6 N background, not the same mouse line as Warner et al., 2017 | |
| Strain (Mus musculus) | Ifnar1-/- | Siedel et al., 2020 | backcrossed 20 times to C57BL/6 | |
| Strain (Mus musculus) | Casp1-/- | Reinke et al., 2020 | C57BL/6 background | |
| Antibody | Anti-Iba1, rabbit polyclonal | Fujifilm Wako Chemicals | Cat# 019–19741 | 1:1000 |
| Antibody | Anti-GFAP, chicken polyclonal | Abcam | Cat# ab4674 | 1:2000 |
| Antibody | Anti- NFκB p65 (D14E12), rabbit polyclonal | Cell Signaling Technology | Cat# 8242 | 1:500 |
| Antibody | Anti- Tubulin βIII, rabbit polyclonal | Covance | Cat# PRB-435P | 1:5000 |
| Antibody | Anti-phospho-a-synuclein, rabbit monoclonal | Abcam | Cat# ab51253 | 1:1000 |
| Antibody | Anti-a-synuclein, mouse monoclonal | BD Bioscience | Cat# 610787 | 1:2000 |
| Antibody | Anti- TH, sheep, polyclonal | Pel-Freeze | Cat# P40101 | 1:2000 |
| Antibody | Anti-synapsin, chicken monoclonal | Synaptic Systems | Cat# 160002 | 1:1000 |
| Antibody | Anti-homer, rabbit monoclonal | Synaptic Systems | Cat# 106006 | 1:1000 |
| Antibody | Anti-ASC, rabbit monoclonal | Adipogen | Cat# AG-25B-0006-C100 | 1:700 |
| Antibody | Anti-IL1b, rabbit monoclonal | Cell Signaling Technology | Cat# 2022 | 1:300 |
| Antibody | Anti- NLRP3, mouse monoclonal | Adipogen | Cat# AG-20B-00060006 | 1:1000 |
| Antibody | Anti- NeuN, chicken polyclonal | Synaptic Systems | Cat# 266006 | 1:1500 |
| Antibody | Anti- HDAC1, mouse, monoclonal | Thermo Fisher | Cat# MA5-1807 | 1:1000 |
| Antibody | Anti- IRF3, rabbit polyclonal | Santa Cruz | Cat# sc-9082 | 1:1000 |
| Antibody | Anti- GAPDH, mouse, monoclonal | Millipore | Cat# MAB374 | 1:5000 |
| Antibody | HRP conjugated donkey anti-mouse polyclonal | Jackson ImmunoResearch | Cat# 715-035-150 | 1:5000 |
| Antibody | HRP conjugated donkey anti-rabbit polyclonal | Jackson ImmunoResearch | Cat# 711-035-152 | 1:5000 |
| Antibody | Alexa 555 conjugated donkey anti-rabbit polyclonal | Invitrogen | Cat# A31572 | 1:2000 |
| Antibody | Alexa 647 conjugated donkey anti-chicken polyclonal | Jackson ImmunoResearch | Cat# 703-605-155 | 1:2000 |
| Antibody | Alexa 488 conjugated donkey anti-sheep polyclonal | Invitrogen | Cat# A11015 | 1:2000 |
| Antibody | Alexa 488 conjugated donkey anti-rabbit polyclonal | Invitrogen | Cat# A21206 | 1:2000 |
| Sequence-based reagent | Ifi44 fw primer | This paper | PCR primer | AACTGACTGCTC GCAATAATGT |
| Sequence-based reagent | Ifi44 rev primer | This paper | PCR primer | GTAACACAGCA ATGCCTCTTGT |
| Sequence-based reagent | Mx1 fw primer | This paper | PCR primer | AACCCTGCTACCTTTCAA |
| Sequence-based reagent | Mx1 rev primer | This paper | PCR primer | AAGCATCGTTT TCTCTATTTC |
| Sequence-based reagent | Sting1 fw primer | This paper | PCR primer | CTGCTGACATAT ACCTCAGTTG |
| Sequence-based reagent | Sting1 rev primer | This paper | PCR primer | GAGCATGTTGT TATGTAGCTG |
| Sequence-based reagent | Cxcl10 fw primer | This paper | PCR primer | CCAAGTGCTGC CGTCATTTTC |
| Sequence-based reagent | Cxcl10 rev primer | This paper | PCR primer | GGCTCGCAGG GATGATTTCAA |
| Sequence-based reagent | Tnfa fw primer | This paper | PCR primer | CCTGTAGCCC ACGTCGTAG |
| Sequence-based reagent | Tnfa rev primer | This paper | PCR primer | GGGAGTAGACA AGGTACAACCC |
| Sequence-based reagent | Casp1 fw primer | This paper | PCR primer | GCTGCCTGCCC AGAGCACAAG |
| Sequence-based reagent | Casp1 rev primer | This paper | PCR primer | CTCTTCAGAGTCTCTTACTG |
| Sequence-based reagent | Il1b fw primer | This paper | PCR primer | GAAATGCCACC TTTTGACAGTG |
| Sequence-based reagent | Il1b rev primer | This paper | PCR primer | TGGATGCTCTCA TCAGGACAG |
| Sequence-based reagent | Hprt1 fw primer | This paper | PCR primer | TCAGTCAACGGG GGACATAAA |
| Sequence-based reagent | Hprt1 rev primer | This paper | PCR primer | GGGGCTGTACT GCTTAACCAG |
| Sequence-based reagent | Rpl13 fw primer | This paper | PCR primer | AGCCTACCAGAA AGTTTGCTTAC |
| Sequence-based reagent | Rpl13 rev primer | This paper | PCR primer | GCTTCTTCTTCC GATAGTGCATC |
| Sequence-based reagent | Eef2 fw primer | This paper | PCR primer | CCGACTCCC TTGTGTGCAA |
| Sequence-based reagent | Eef2 rev primer | This paper | PCR primer | AGTTCAGGTCG TTCTCAGAGAG |
| Sequence-based reagent | Ym1 fw primer | This paper | PCR primer | CATTCAGTCAG TTATCAGATTCC |
| Sequence-based reagent | Ym1 rev primer | This paper | PCR primer | AGTGAGTAGCAGCCTTGG |
| Sequence-based reagent | Il4 fw primer | This paper | PCR primer | AGATGGATGTGCC AAACGTCCTCA |
| Sequence-based reagent | Il4 rev primer | This paper | PCR primer | AATATGCGAAGCA CCTTGGAAGCC |
| Sequence-based reagent | Nos2 fw primer | This paper | PCR primer | CTGCTGGTGGTGAC AAGCACATTT |
| Sequence-based reagent | Nos2 rev primer | This paper | PCR primer | ATGTCATGAGCAAA GGCGCAGAAC |
| Sequence-based reagent | Retnl1 fw primer | This paper | PCR primer | TGGAGAATAAGGTCAAGGAAC |
| Sequence-based reagent | Retnlb rev primer | This paper | PCR primer | GTCAACGAGTAAGCACAGG |
| Commercial assay or kit | Pierce Micro BCA Protein-Assay-Kit | Thermo Fisher Scientific Inc | Cat# 23235 | |
| Commercial assay or kit | WesternBright Chemilumineszenz Substrat Sirius | Biozym Scientific GmbH | Cat# 541019 | |
| Commercial assay or kit | M-MLV Reverse Transriptase Kit | Promega | Cat# M1701 | |
| Commercial assay or kit | SV Total RNA Isolation System | Promega | Cat# Z3101 | |
| Commercial assay or kit | GoTaq qPCR Master Mix | Promega | Cat# A6002 | |
| Chemical compound, drug | PhosSTOP phosphatase inhibitor | Sigma-Aldrich | Cat# 4906845001 | |
| Chemical compound, drug | Precision Plus Protein WesternC Protein Standards | BioRad | Cat# 1610376 | |
| Chemical compound, drug | RNasin Ribonuclease Inhibitor | Promega | Cat# N2511 | |
| Chemical compound, drug | Deoxynucleotide Triphosphates (dNTPs) | Promega | Cat# U1205 | |
| Chemical compound, drug | M-MLV 5 x Reaction Buffer | Promega | Cat# M1701 | |
| Chemical compound, drug | Fluoromount-G | Southern Biotech | Cat# 0100–01 | |
| Chemical compound, drug | NucSpot Live 650 Nuclear Stain | Biotium | Cat# 40082 | |
| Chemical compound, drug | Thioflavin S | Sigma-Aldrich | Cat# T1892 | |
| Chemical compound, drug | Mitosox | Thermo Fisher | Cat# M36008 | |
| Chemical compound, drug | Di(Acetoxymethyl Ester) (6-Carboxy-2',7'- Dichlorodihydrofluorescein Diacetate) (DCFH-DA) | Thermo Fisher | Cat# C2938 | |
| Software, algorithm | GraphPad Prism 5. 01 and 9.0.0 | GraphPad Software | ||
| Software, algorithm | ImageJ Fiji | Wayne Rasband (NIH) | ||
| Software, algorithm | QuantStudio5 qPCR Data Analysis Software | Thermo Fisher Scientific Inc | ||
| Other | QuantStudio 5 Real-Time PCR System | Thermo Fisher Scientific Inc | ||
| Other | Zeiss Axio Observer Z1 | Carl Zeiss | ||
| Other | Zeiss Spinning Disc | Carl Zeiss | ||
| Other | Infinite 200 M Multimode- Plate-Reader | Tecan Group |
Additional files
-
MDAR checklist
- https://cdn.elifesciences.org/articles/81943/elife-81943-mdarchecklist1-v2.docx
-
Source data 1
Data used to generate graphs.
- https://cdn.elifesciences.org/articles/81943/elife-81943-data1-v2.xlsx
Download links
A two-part list of links to download the article, or parts of the article, in various formats.
Downloads (link to download the article as PDF)
Open citations (links to open the citations from this article in various online reference manager services)
Cite this article (links to download the citations from this article in formats compatible with various reference manager tools)
Constitutively active STING causes neuroinflammation and degeneration of dopaminergic neurons in mice
eLife 11:e81943.
https://doi.org/10.7554/eLife.81943


