T cell receptor convergence is an indicator of antigen-specific T cell response in cancer immunotherapies
- Lyda Hill Department of Bioinformatics, The University of Texas Southwestern Medical Center, United States
Figures
Figure 1 with 1 supplement
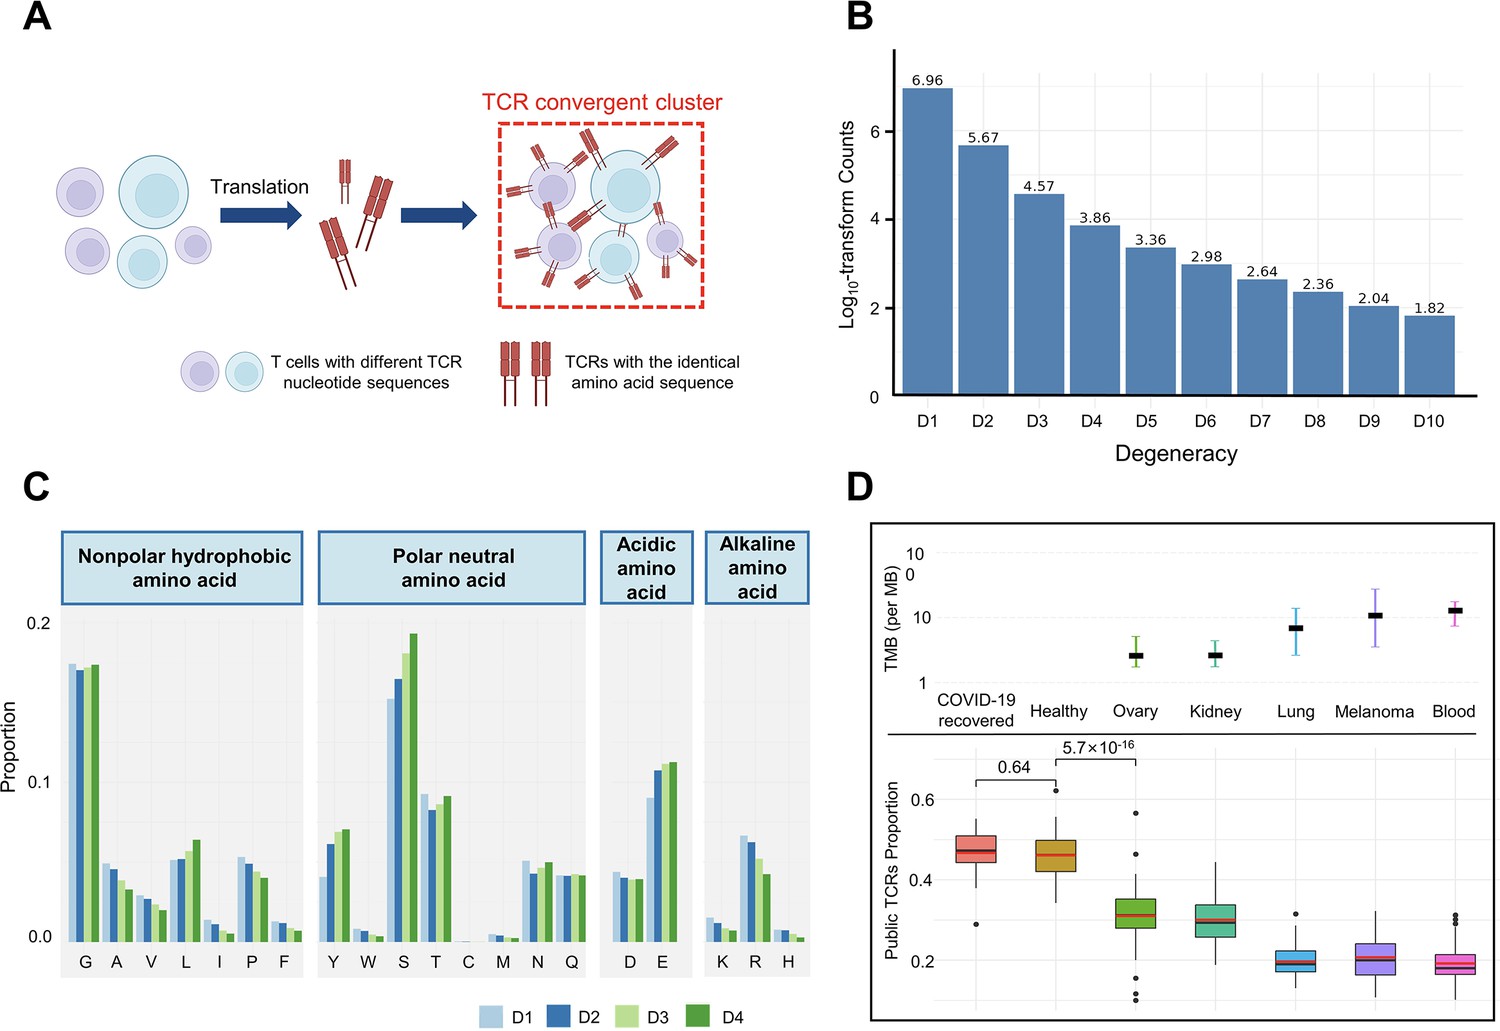
T cell receptor (TCR) convergence is different from publicity.
(A) Cartoon illustration of TCR convergence, created with BioRender.com. T cells with different DNA sequences encode the same TCR due to codon degeneracy. (B) Log10-transformed counts of TCRs with different degrees of degeneracies. The x-axis indicates the number of distinct DNA sequences corresponding to the same TCR, or, the ‘degree of degeneracy’. ‘D1’ refers to the sequences without any degeneracy. (C) The proportion of 20 amino acids in TCRs with degeneracies from one to four. Each of the 20 natural amino acids is represented on the x-axis by a one-letter abbreviation. (D) Tumor mutation burden (TMB) and the proportion of public TCRs in convergent TCRs among different cancer types. The upper panel shows the TMB of ovary, kidney, lung, melanoma, and blood cancer types. Cancer types are ordered from the lowest median TMB (left) to the highest median TMB (right). Lower panel shows the ratio of public TCRs among convergent TCRs in the respective cancer types. The sample size of each group: recovered COVID-19 patients (n=38), healthy control (n=50), ovary (n=45), kidney (n=19), lung (n=50), melanomas (n=29), blood (n=53). The statistical significance was calculated by Welch’s t-test.
Figure 1—figure supplement 1
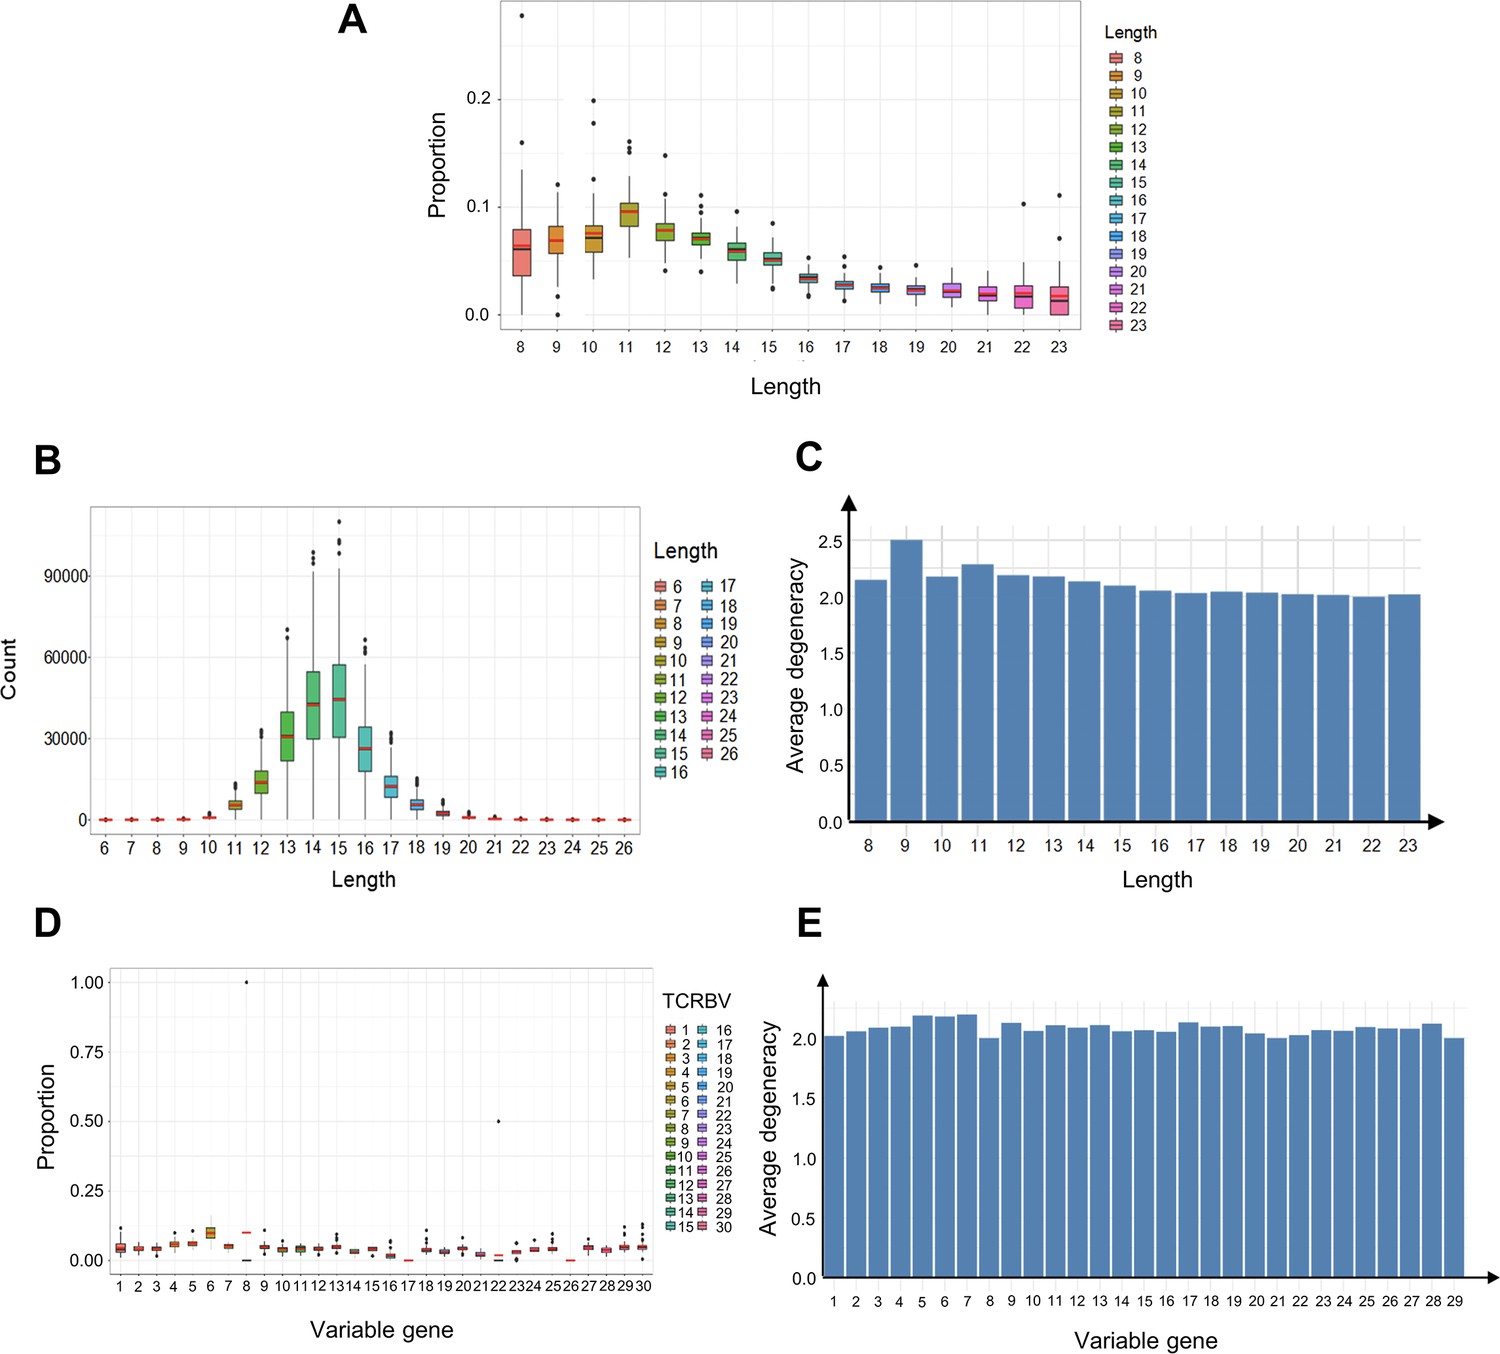
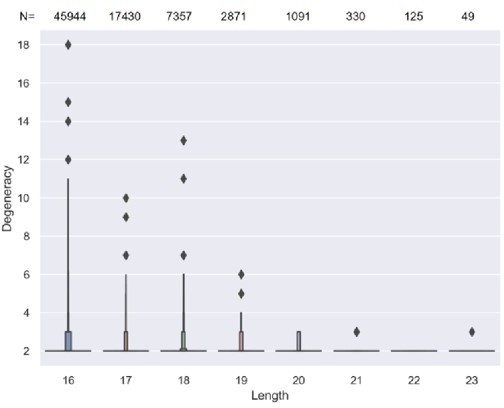
The length and variable gene usage of convergent T cell receptors (TCRs).
(A) The proportion of convergent TCRs among TCRs of a certain length. The x-axis represents the amino acid length of TCR CDR3. Each dot indicates one sample. (B) The length distribution of all unique TCR CDR3 reads. (C) The average degeneracy of convergent TCRs with different CDR3 lengths. (D) The proportion of convergent TCRs among TCRs with a certain variable gene. The x-axis refers to the TCRβ chain variable gene (TCRBV) superfamily. (E) The average degeneracy of convergent TCRs with different variable gene usages.
Figure 2
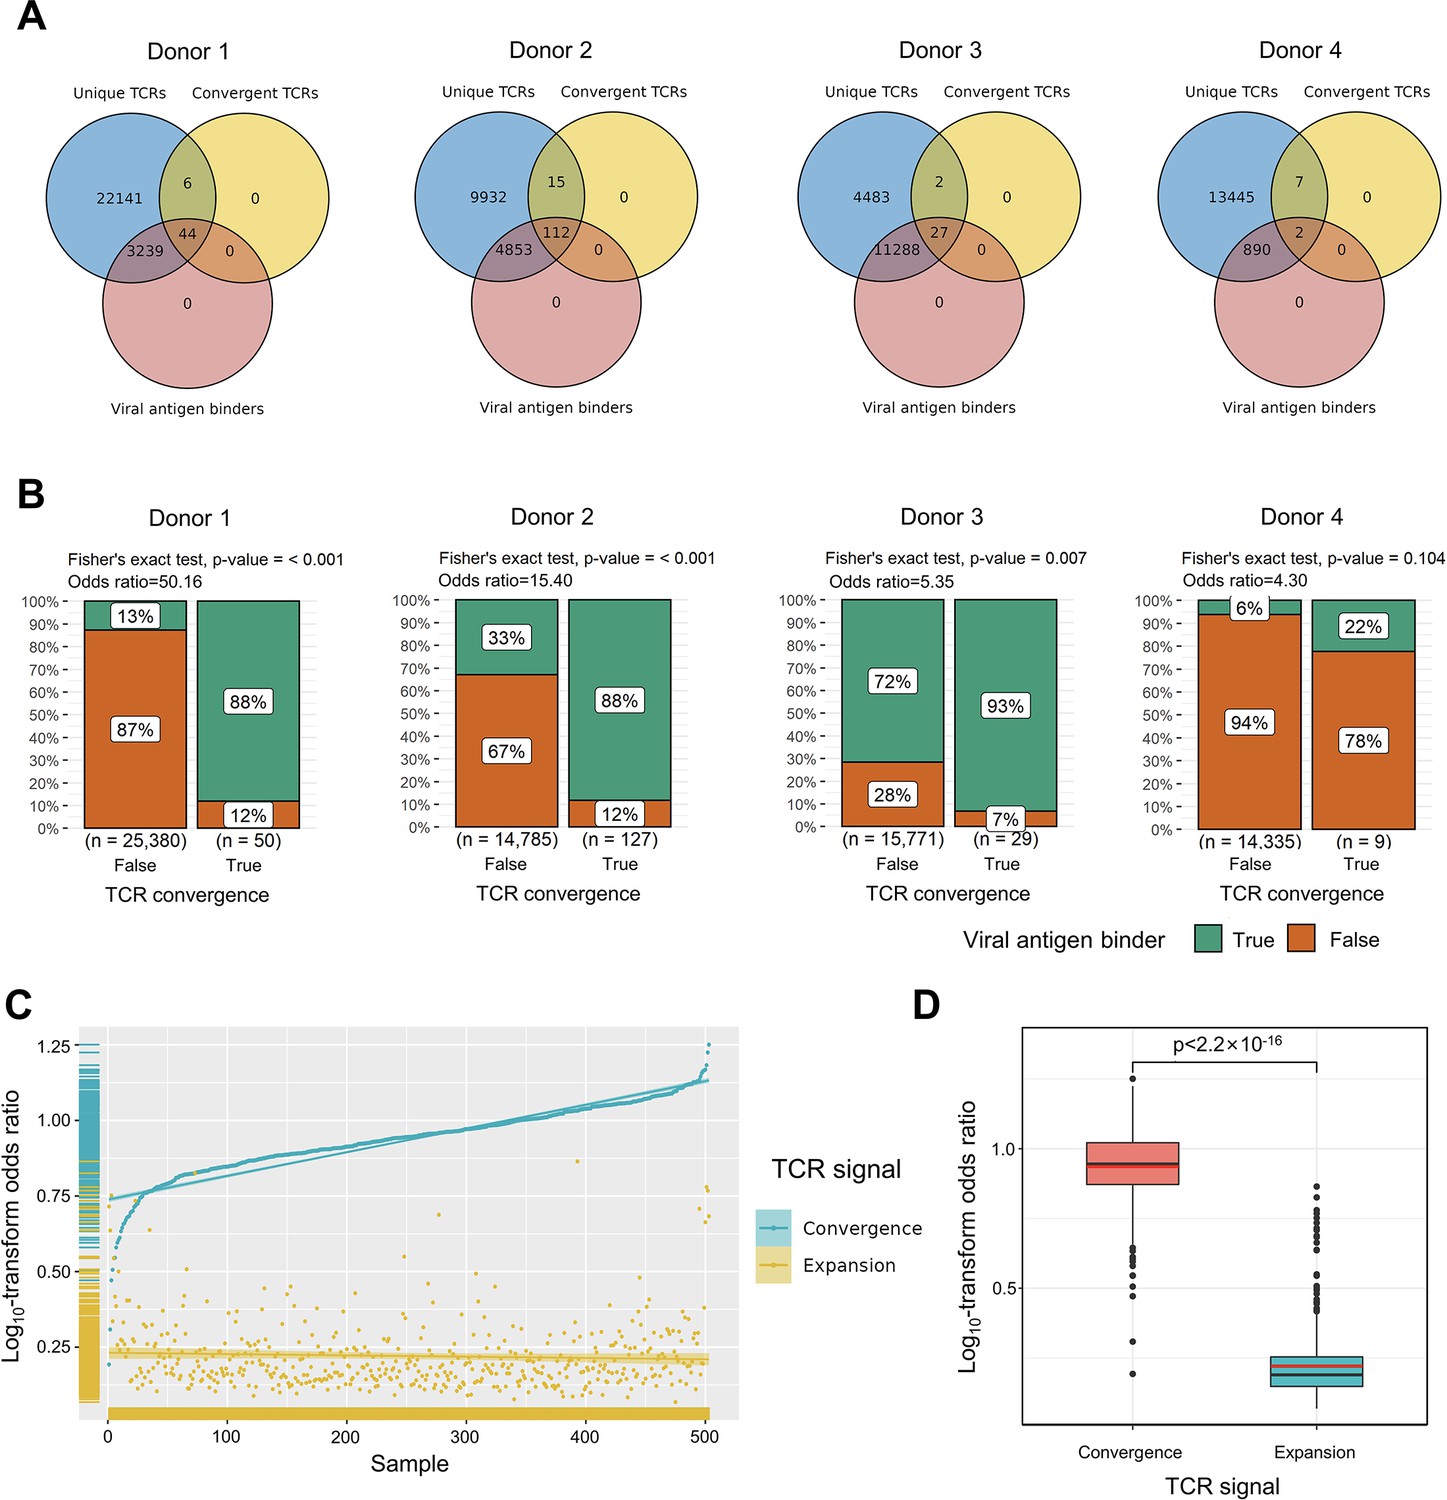
Convergent T cell receptors (TCRs) are more likely to be antigen-specific.
(A) The overlaps between all unique TCRs, viral antigen-specific TCRs, and convergent TCRs of four donors, respectively. (B) The results of Fisher’s exact tests regarding the association of convergent TCRs and viral antigen-specific TCRs of four donors. (C) Log10-scaled odds ratio of TCR convergence and expansion with respect to antigen-specificity of each sample. The samples were sorted in order of TCR convergence odds ratio from small to large. The horizontal stripes on the left represent the density of samples, colored by the TCR signal. (D) The difference of log10-transformed odds ratio between TCR convergence and TCR expansion. The statistical significance was calculated by Welch’s t-test.
Figure 3 with 2 supplements
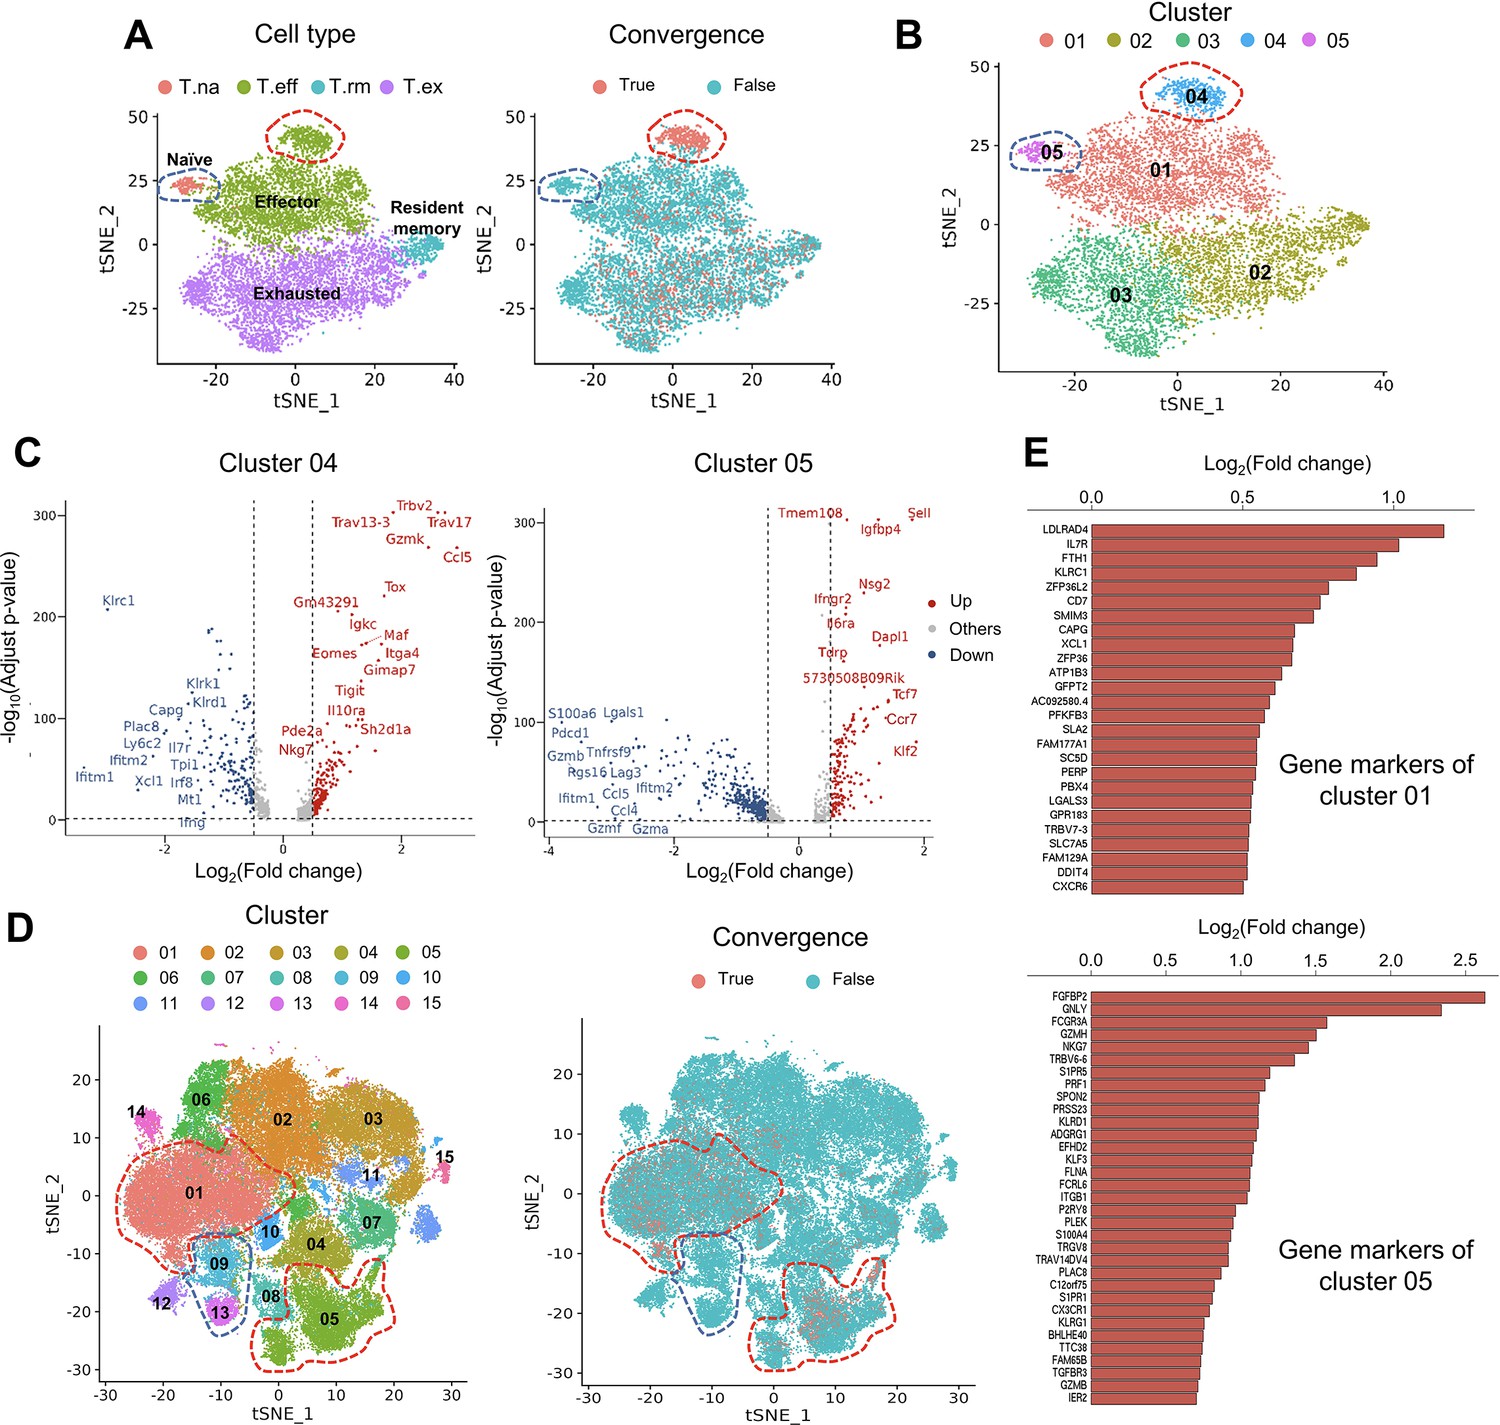
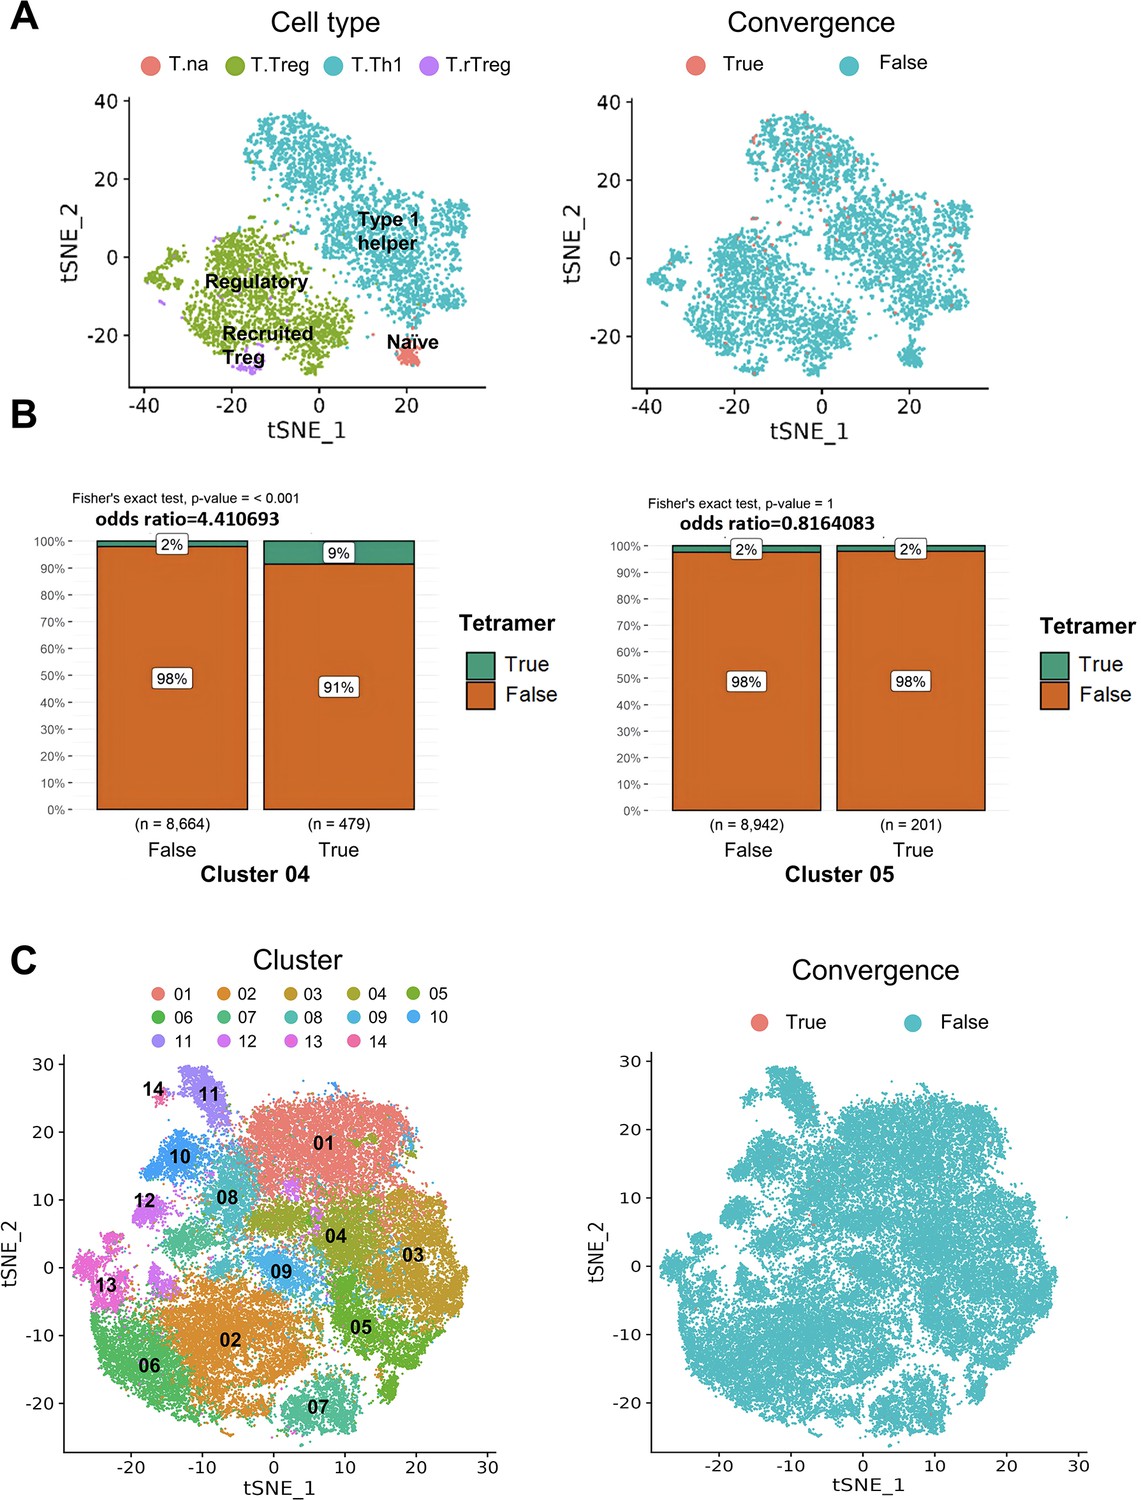
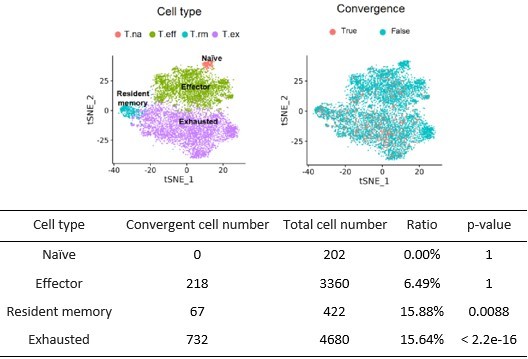
Convergent T cells exhibit a CD8+ cytotoxic gene signature.
(A) t-Distributed stochastic neighbor embedding (t-SNE) plots showing cell type annotations and convergent T cell distribution of CD8+ T cells collected from mouse tumor tissues. (Each cell type corresponds to the following clusters in the original paper: T.na: CD8-04-Ccr7; T.eff: CD8-05-Fasl; T.rm: CD8-06-Xcl1; T.ex: CD8-08-Lag3; Liu et al., 2022) Each dot represents a T cell. The area within the red dashed line indicates enrichment of convergent T cells, and cells within the blue dashed line were naive T cells. (B) t-SNE displaying the re-cluster result of CD8+ T cells. The red dashed line and blue dashed line highlighted the same groups of cells as in A. (C) Volcano plots showing the differentially expressed genes of cluster 04 and cluster 05. The p-value was calculated by the Wilcoxon test. (D) t-SNE plots showing the cell clusters and convergent T cell distribution of CD8+ T cells collected from human tumors and normal adjacent tissues. An area within the red dashed line was enriched with convergent T cells, and the T cells within the blue dashed line were naive T cells. (E) The gene markers of cluster CD8-01-XCL1 and cluster CD8-05-FGFBP2 of human pan-cancer data. (Only the up-regulated genes of each cluster are shown).
Figure 3—figure supplement 1
T cell receptor convergence in CD4+ T cells.
(A) Cell type annotations and convergent T cell distribution of CD4+ T cells collected from mouse tumor tissues. (Each cell type corresponds to the following clusters in the original paper: T.na: CD4-04-S1pr1; T.Treg: CD4-05-Ctla4; T.Th1: CD4-06-Bhlhe40; T.rTreg: CD4-07-Ccr5; Liu et al., 2022). (B) The results of Fisher’s exact tests regarding the association of tetramer+ T cells with T cells from cluster 04 or cluster 05. (C) Cell clusters and convergent T cell distribution of CD4+ T cells collected from human tumors and normal adjacent tissues.
Figure 3—figure supplement 2
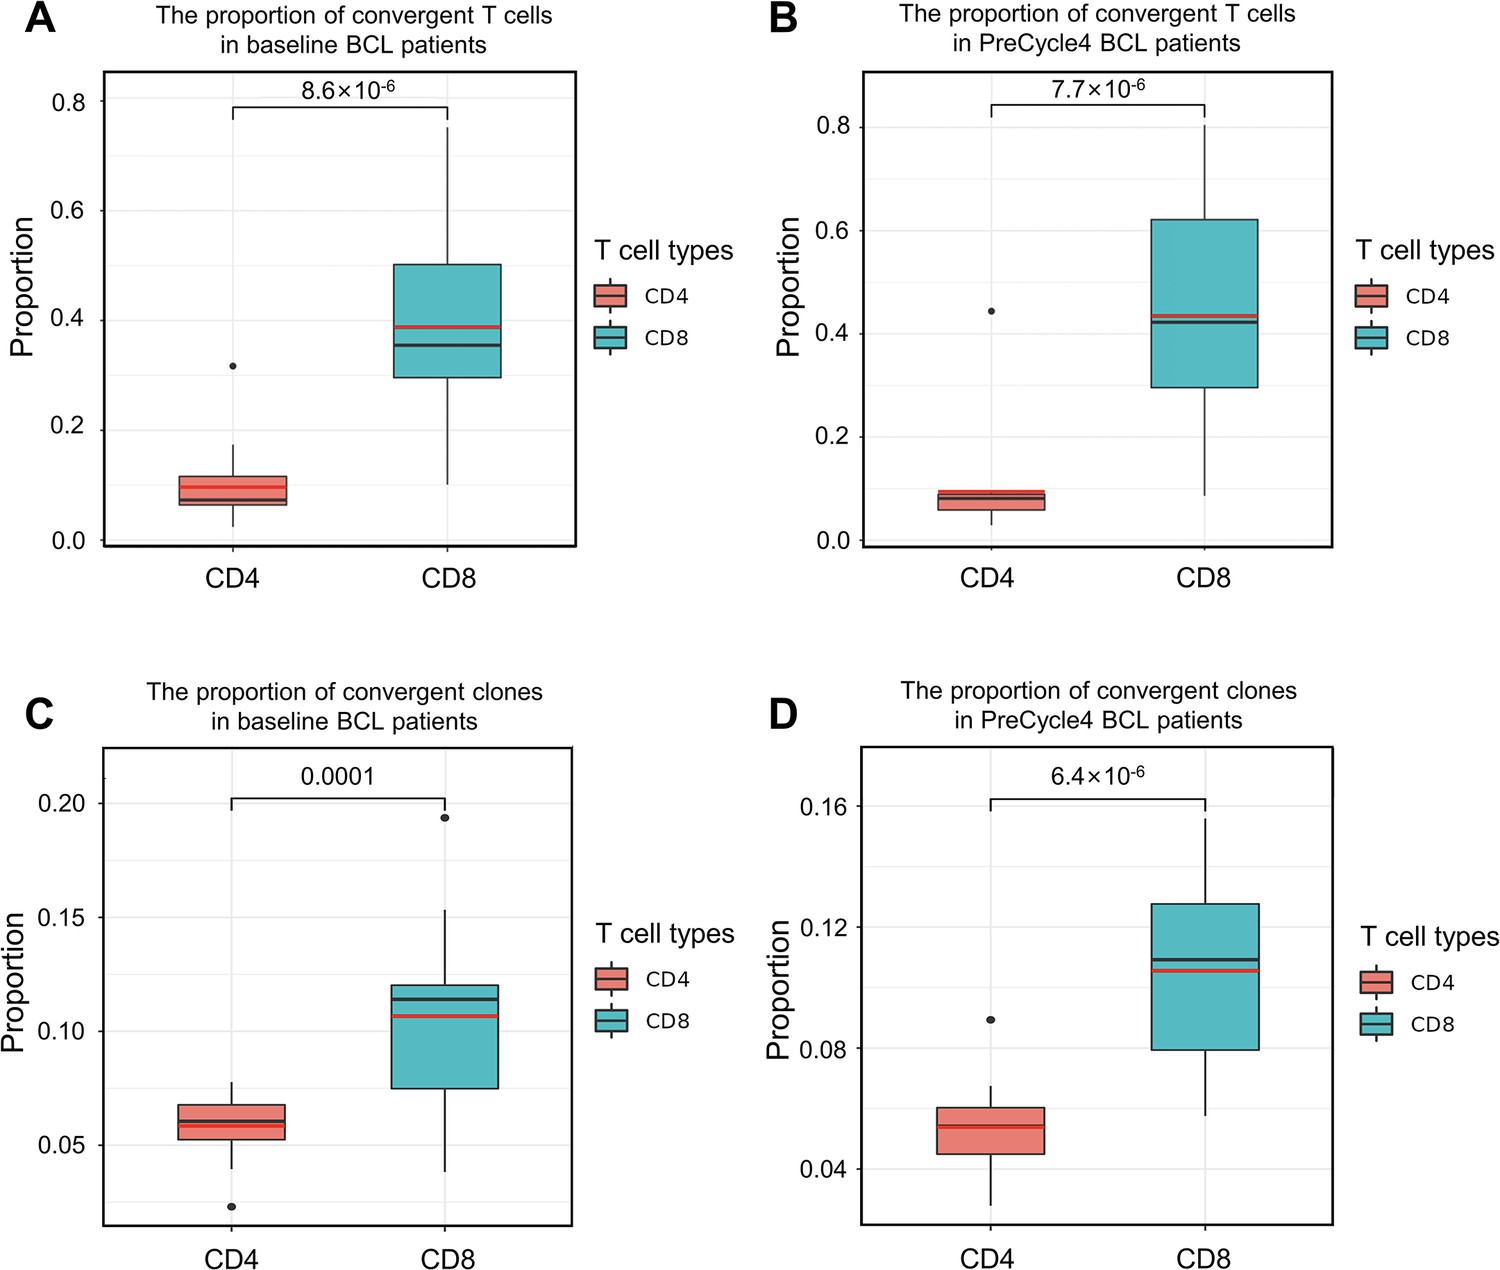
The convergent T cell levels in CD4+ and CD8+ T cells.
(A) The different levels of convergent T cells in CD4+ and CD8+ T cells. The samples (n=17) were collected from baseline cHL patients. Each dot represents one sample. The statistical significance is calculated by Welch’s t-test. (B) The different levels of convergent T cells in CD4+ and CD8+ T cells. The samples (n=16) were collected from cHL patients on day 1 of anti-PD1 treatment cycle 4. Each dot represents one sample. The statistical significance is calculated by Welch’s t-test. (C) The proportion of convergent T cell clones among all CD4+ and CD8+ T cell clones of baseline cHL patients. Each dot represents one sample. The statistical significance is calculated by Welch’s t-test. (D) The proportion of convergent T cell clones among all CD4+ and CD8+ T cell clones of anti-PD1 PreCycle4 cHL patients. Each dot represents one sample. The statistical significance is calculated by Welch’s t-test.
Figure 4 with 1 supplement
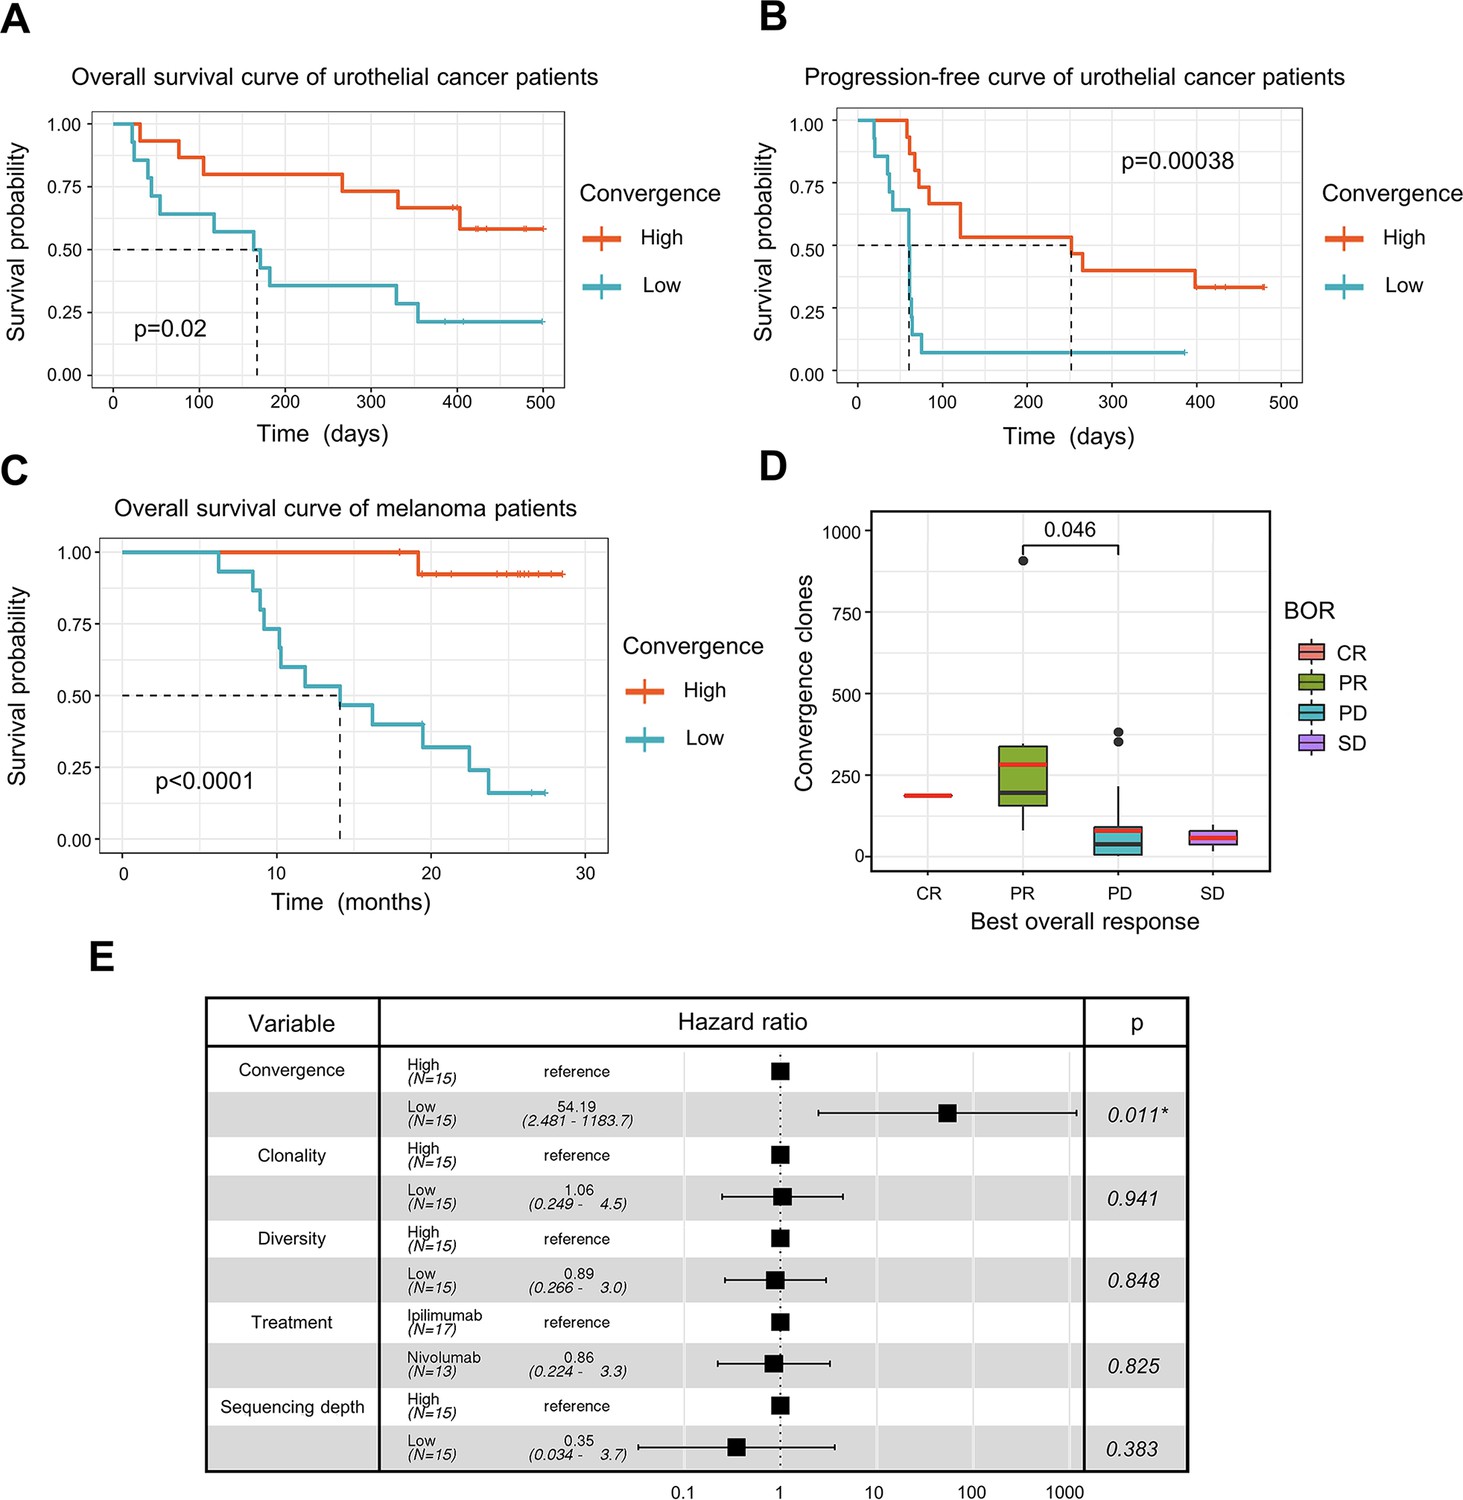
T cell receptor (TCR) convergence is associated with the clinical outcome of immune checkpoint blockade treatment.
(A) Kaplan-Meier overall survival curves of urothelial cancer patients (n=29) with different levels of convergent T cells. The convergence levels were defined by the number of convergent T cell clones within each sample. High, above median; low, below the median. For TCR convergence, all the survival analyses in this study followed this definition. The p-values of all the Kaplan-Meier curves in this study were calculated by log-rank test. (B) Progression-free survival curve of urothelial cancer patients (n=29) with different levels of convergent T cells. The progression of the tumor was determined by mRECIST 1.1 test. (C) Overall survival curves of melanoma patients (n=30) with different levels of convergent T cells. (D) The differences in the TCR convergence levels among patients with the distinct best overall response toward anti-PD1 immunotherapy. The number of patients with each best overall response (BOR) is as follows: complete response = CR (n=1), partial response = PR (n=9), progressive disease = PD (n=18), stable disease = SD (n=2). The statistical significance was calculated by Welch’s t-test. (E) Cox model multivariate analysis for the overall survival of melanomas cohort with covariate adjustments for other four variables: TCR clonality, TCR diversity, treatment method, and sequencing depth. The sequencing depth was determined by the total number of detected TCR clonotypes.
Figure 4—figure supplement 1
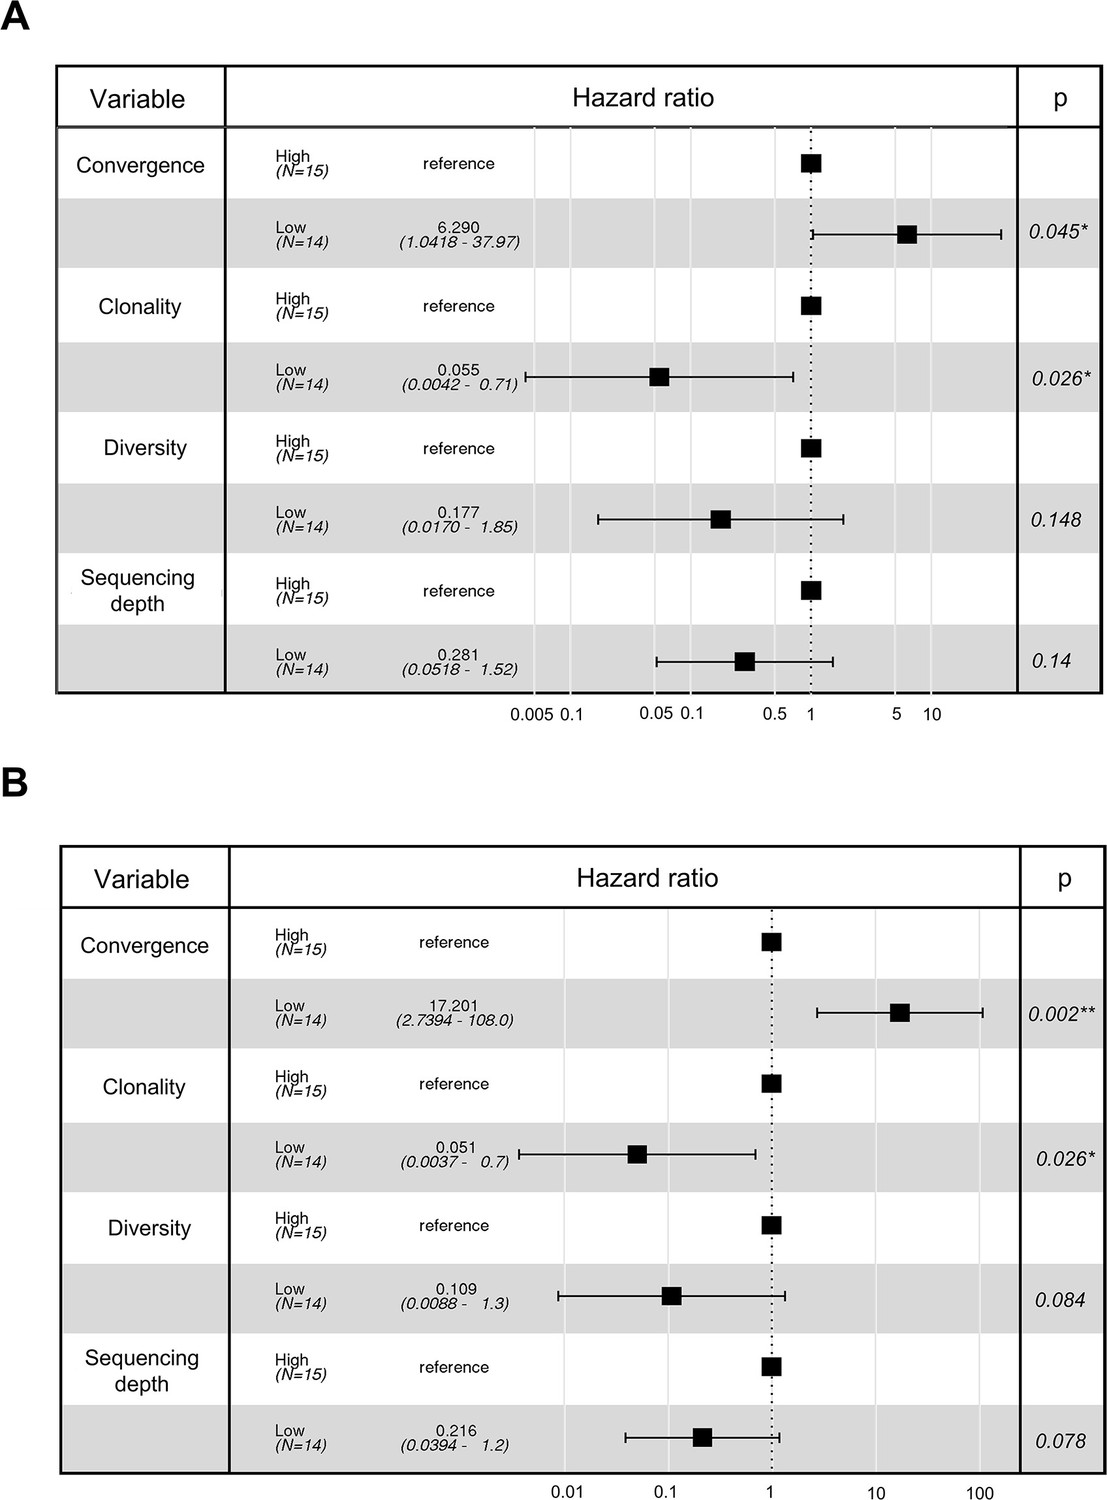
Multivariate cox regression analysis for urothelial cancer cohort.
(A) Cox model multivariate analysis for the overall survival with covariate adjustments for other three variables: T cell receptor (TCR) clonality, TCR diversity, and sequencing depth. The sequencing depth was determined by the total number of detected TCR clonotypes. (B) Cox model multivariate analysis for the progression-free survival with covariate adjustments for other three variables: TCR clonality, TCR diversity, and sequencing depth. The sequencing depth was determined by the total number of detected TCR clonotypes.
Author response image 1
Author response image 2
Author response image 3
Tables
Table 1
The Fisher’s exact test result of CD8+ clusters.
| Clusters | Normal adjacent tissues | Tumor tissues | ||||
|---|---|---|---|---|---|---|
| Convergence ratio | Odds ratio | p-Value | Convergence ratio | Odds ratio | p-Value | |
| CD8-01-XCL1 | 22.95% | 5.07 | <2.2e−16 | 15.03% | 5.66 | <2.2e−16 |
| CD8-02-GZMK | 2.59% | 0.24 | 1 | 3.48% | 0.85 | 0.9949 |
| CD8-03-TIGIT | 3.69% | 0.37 | 1 | 2.12% | 0.49 | 1 |
| CD8-04-ZNF683 | 7.43% | 0.79 | 0.9984 | 3.72% | 1.62 | <2.2e−16 |
| CD8-05-FGFBP2 | 32.44% | 6.19 | <2.2e−16 | 26.69% | 12.25 | <2.2e−16 |
| CD8-06-IFNG | 5.80% | 0.59 | 1 | 8.71% | 2.34 | 9.725E−15 |
| CD8-07-IHSPA6 | 22.75% | 3.93 | <2.2e−16 | 4.99% | 1.27 | 0.004411 |
| CD8-08-PRF1 | 4.84% | 0.5 | 1 | 3.11% | 0.77 | 0.9404 |
| CD8-09-IL7R | 1.02% | 0.1 | 1 | 1.44% | 0.35 | 1 |
| CD8-10-IFI6 | 11.11% | 1.23 | 0.2523 | 5.54% | 1.42 | 0.0003609 |
| CD8-11-STMN1 | 6.07% | 0.64 | 0.9603 | 3.93% | 0.98 | 0.5834 |
| CD8-12-KLRB1 | 0.48% | 0.03 | 1 | 0.13% | 0.03 | 1 |
| CD8-13-CCR7 | 0.00% | 0 | 1 | 0.00% | 0 | 1 |
| CD8-14-CXCR6 | 0.45% | 0.01 | 1 | 5.00% | 1.26 | 0.4325 |
| CD8-15-CTLA4 | 0.00% | 0 | 1 | 1.68% | 0.41 | 0.2 |
Author response table 1
The number of convergent TCRs and neoantigen-specific TCRs in each biospecimen.
| Biospecimen | Total cells | Convergent T cells | Convergence TCRs | Neoantigen-specific TCRs |
|---|---|---|---|---|
| 4261 | 1864 | 0 | 0 | 2 |
| 4283 | 1083 | 10 | 1 | 11 |
| 4298 | 12594 | 75 | 14 | 11 |
| 4317 | 3558 | 76 | 6 | 5 |
| 4322 | 1401 | 9 | 3 | 5 |
| 4323 | 2004 | 8 | 2 | 19 |
| 4324 | 2593 | 9 | 2 | 7 |
| 4325 | 1124 | 4 | 1 | 0 |
| 4342 | 6814 | 37 | 11 | 7 |
| 4385 | 2696 | 26 | 2 | 2 |
| 4393 | 497 | 0 | 0 | 8 |
| 4394 | 1999 | 12 | 4 | 4 |
| 4397 | 2032 | 0 | 0 | 2 |
| 4400 | 1533 | 2 | 1 | 10 |
| 4421 | 7308 | 45 | 12 | 7 |
Additional files
-
MDAR checklist
- https://cdn.elifesciences.org/articles/81952/elife-81952-mdarchecklist1-v2.pdf
-
Supplementary file 1
Details of datasets used in this study.
Public datasets used in this study are summarized in this table. A total of 3 single-cell immune profiling datasets and 11 bulk TCR-seq datasets are involved in this study. The table lists the original project information and accession numbers for each dataset.
- https://cdn.elifesciences.org/articles/81952/elife-81952-supp1-v2.xlsx
-
Supplementary file 2
The clusters annotation in human pan-cancer data.
The T cell cluster characteristics were summarized based on the gene expression signature of each cluster. This study only included the samples sequenced in the original study (Zheng et al., 2021), additional datasets used in the original publication that were sourced from other cohorts were not included in this study.
- https://cdn.elifesciences.org/articles/81952/elife-81952-supp2-v2.xlsx
Download links
A two-part list of links to download the article, or parts of the article, in various formats.
Downloads (link to download the article as PDF)
Open citations (links to open the citations from this article in various online reference manager services)
Cite this article (links to download the citations from this article in formats compatible with various reference manager tools)
T cell receptor convergence is an indicator of antigen-specific T cell response in cancer immunotherapies
eLife 11:e81952.
https://doi.org/10.7554/eLife.81952


