Spinal premotor interneurons controlling antagonistic muscles are spatially intermingled
- Department of Neuromuscular Diseases, University College London, United Kingdom
- Max Delbruck Center for Molecular Medicine, Germany
- Gene Expression Laboratory, Salk Institute for Biological Studies, United States
- Biological Sciences Graduate Program, University of California, San Diego, United States
- Institute of Neuroscience and Psychology, College of Medical, Veterinary and Life Sciences, University of Glasgow, United Kingdom
- Department of Neuroscience Physiology and Pharmacology, University College London, United Kingdom
- Howard Hughes Medical Institute and Department of Molecular and Cellular Biology, Center for Brain Science, Harvard University, United States
- Sainsbury Wellcome Centre for Neural Circuits and Behaviour, University College London, United Kingdom
Figures
Figure 1
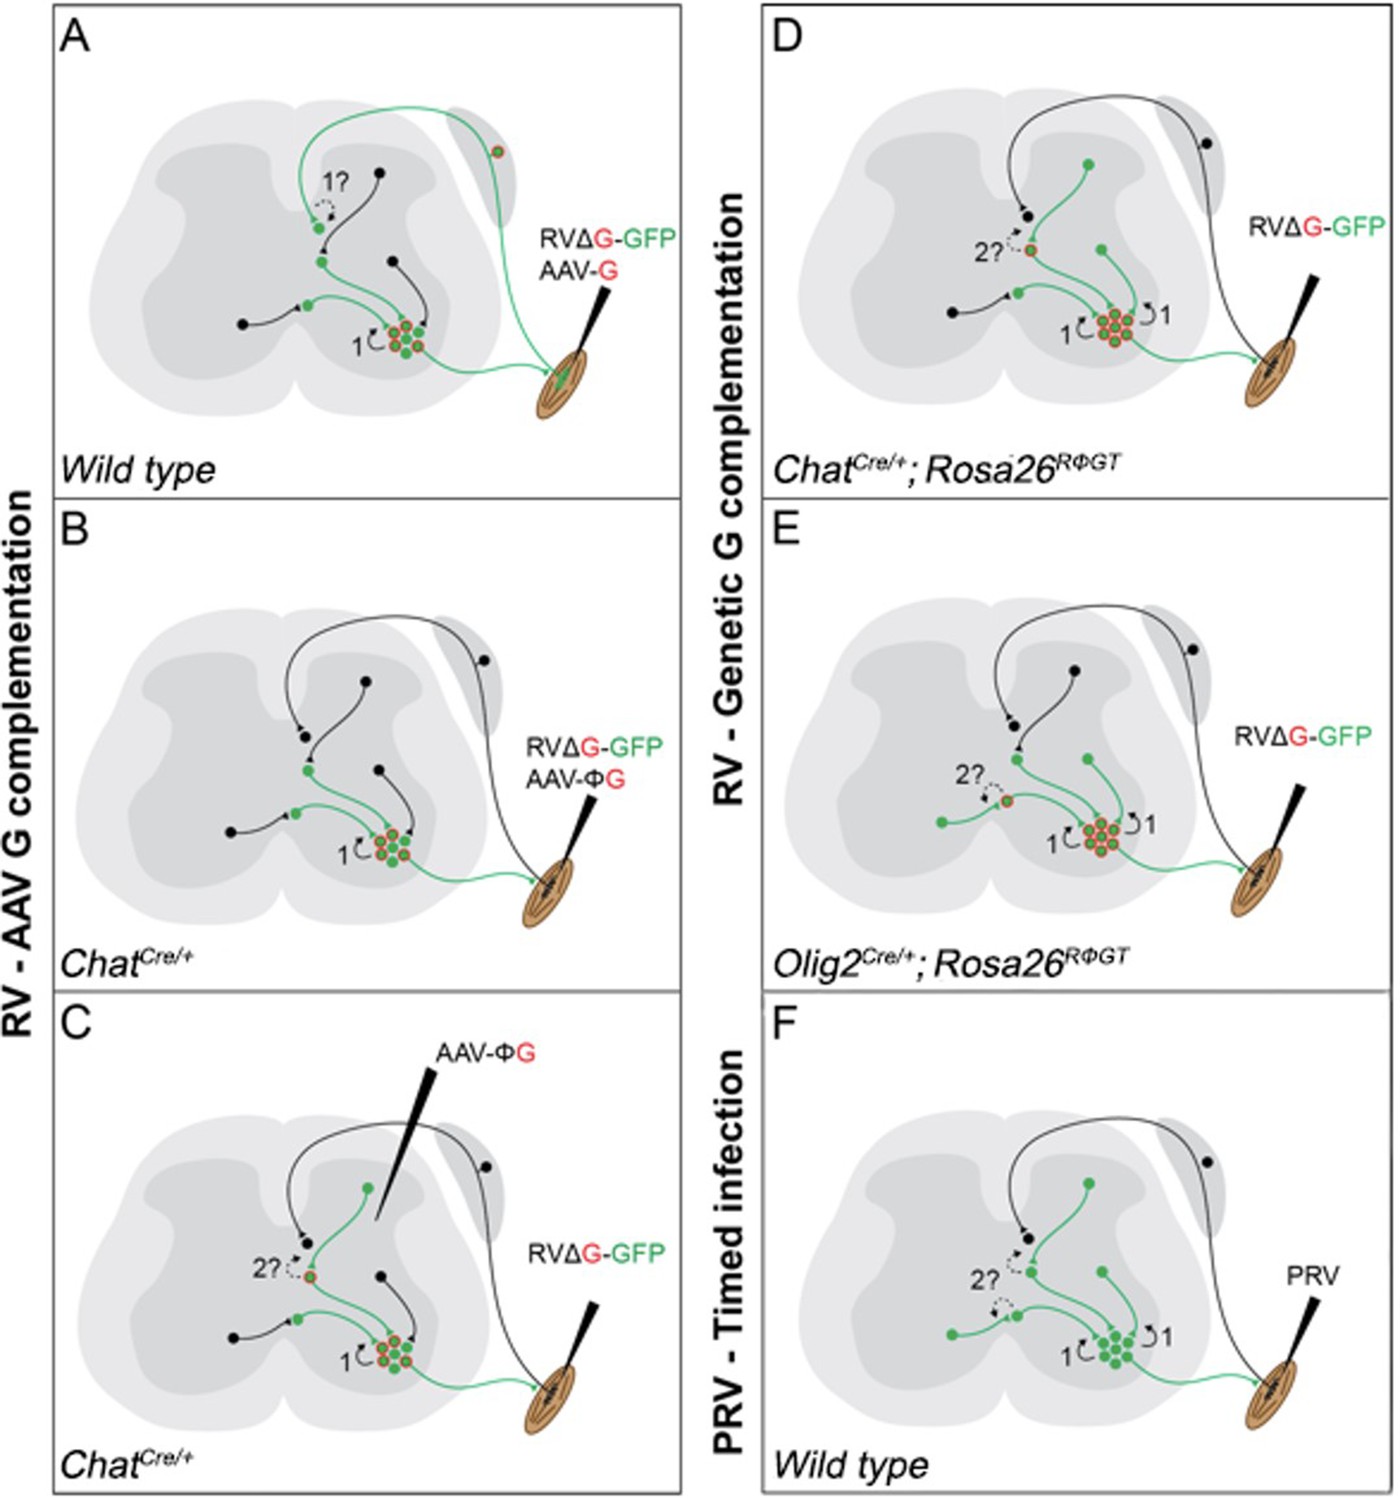
Schematic diagram of the currently available techniques for labelling premotor interneurons.
(A) Simultaneous injection of RabV and AAV-G into muscles. Rabies transfer pathways that could potentially contaminate the distribution of premotor interneurons are labelled by a question mark and indicated by dashed lines. A: Afferent labelling could lead to anterograde labelling of sensory related interneurons. (B) Simultaneous muscle injection of RabV and a Cre-dependent AAV-G into mice expressing Cre in motor neurons eliminates the risk of anterograde transfer from afferents. (C) Intraspinal injection of a flexed AAV-G in mice expressing Cre in motor neurons is followed by intramuscular rabies injection. (D and E) RabV muscle injection is performed on mice selectively expressing the rabies glycoprotein in cholinergic neurons (D) or neuron expressing the Olig2 transcription factor (E). (F) PRV Bartha is injected in muscles and retrogradely spreads through synapses. Restriction to first order interneurons can be achieved by extracting the tissue early (~48 hr) after injection.
Figure 2
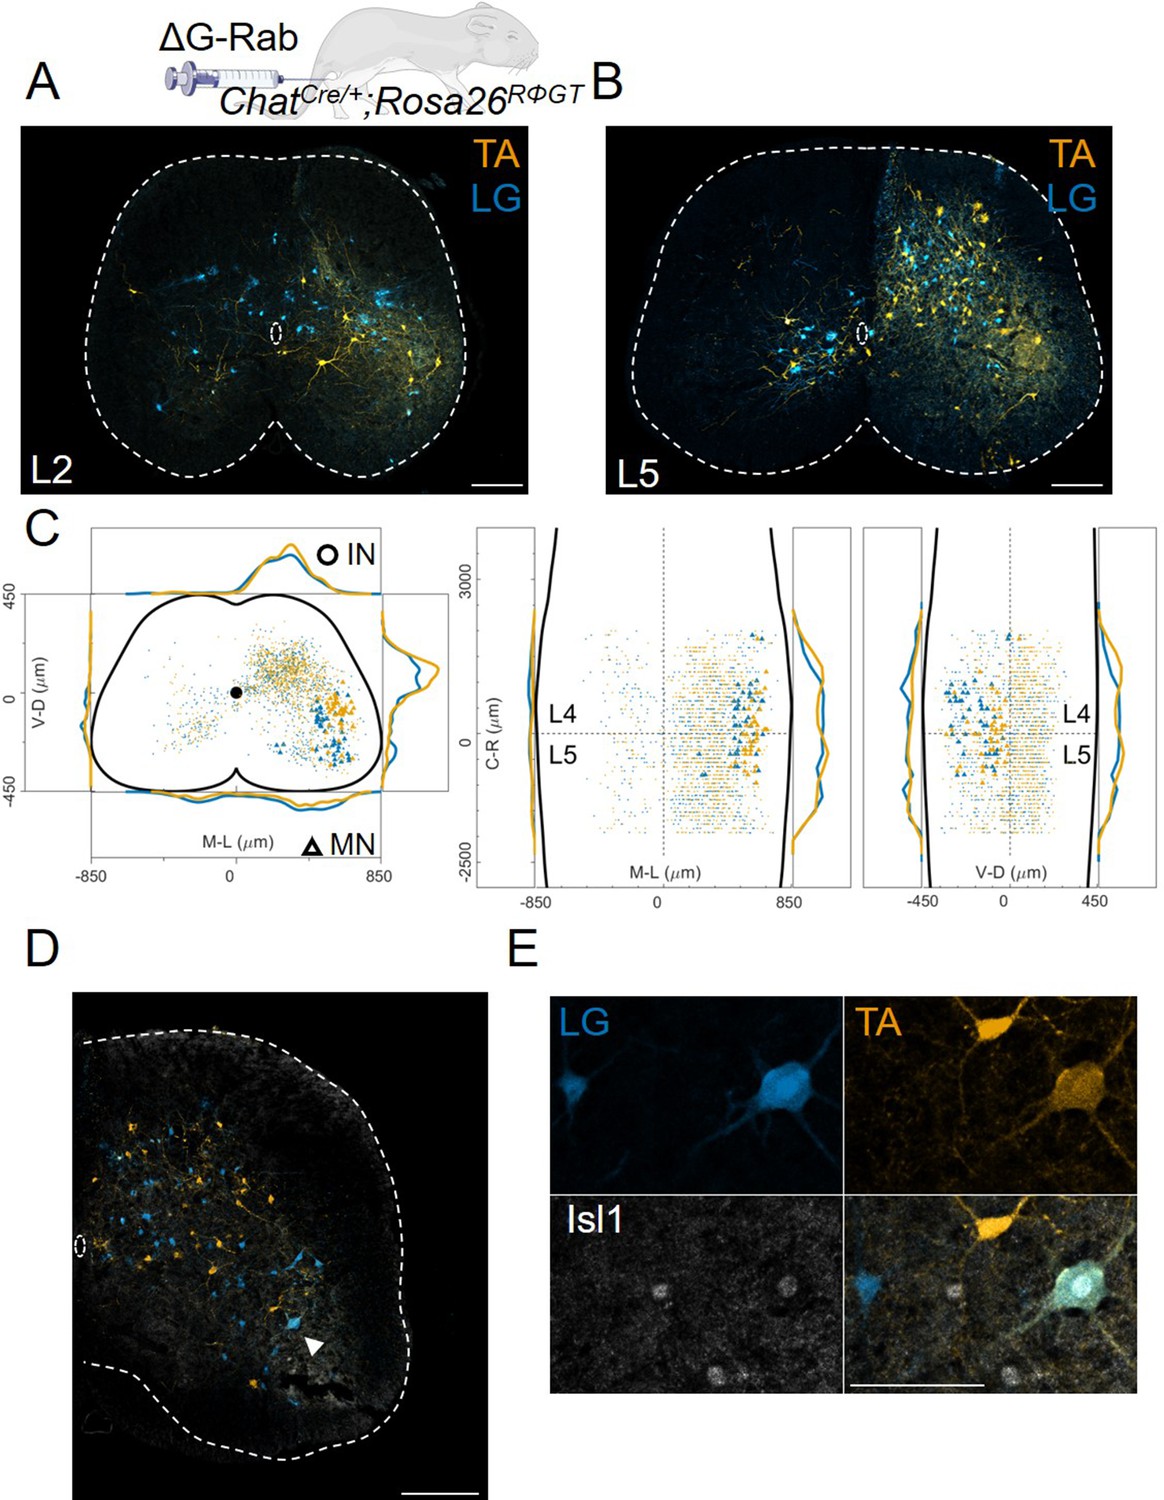
Double injections of flexor and extensor muscles shows no segregation of premotor interneurons.
(A) Maximum intensity projection of a single 30 μm section taken from the L2 segment of a P10 cord infected with ΔG-Rab-mCherry in the LG and ΔG-Rab-EGFP in the TA in ChatCre/+; Rosa26RΦGT mice. (B) Same sample as A, showing a L5 section (scale bars: 200 μm). (C) Projections along the transverse (left), horizontal (middle) and sagittal (right) plane throughout the lumbar region of the sample showed in A and B (170427 n2, UCL). Dots denote individual premotor interneurons, triangles denote infected motor neurons. Convolved density along each axe are shown to the sides of the raw data (top-bottom and left-right distributions in all panels sum to 1). For each section the data are scaled to the reference points indicated in the methods in order to account for size differences along the segments. (D) Half section of a cord on the side of a double injection of LG and TA in the L4 segment. Some isl1 +motor neurons are labelled in the dorsal nuclei and one (indicated by arrowhead and enlarged in (E)) is labelled by both fluorescent proteins, indicating a potential transsynaptic jump between antagonist motor neurons (scale bars, 250 μm and 50 μm in D and E respectively).
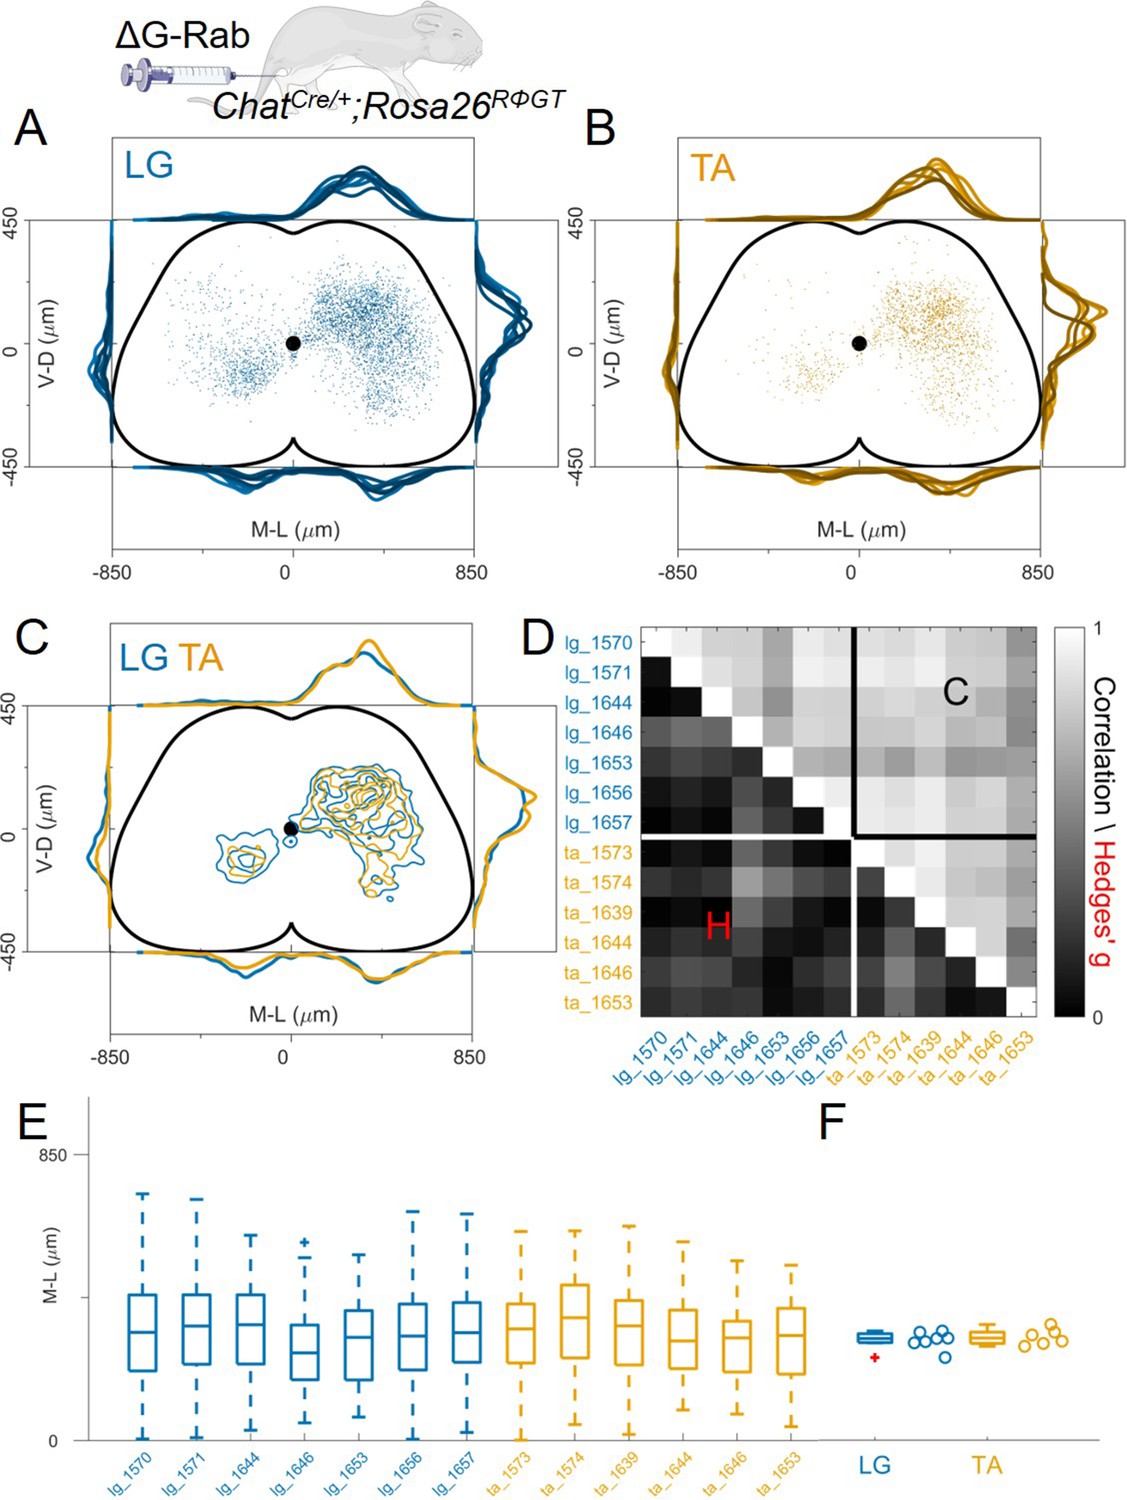
Figure 3 with 3 supplements
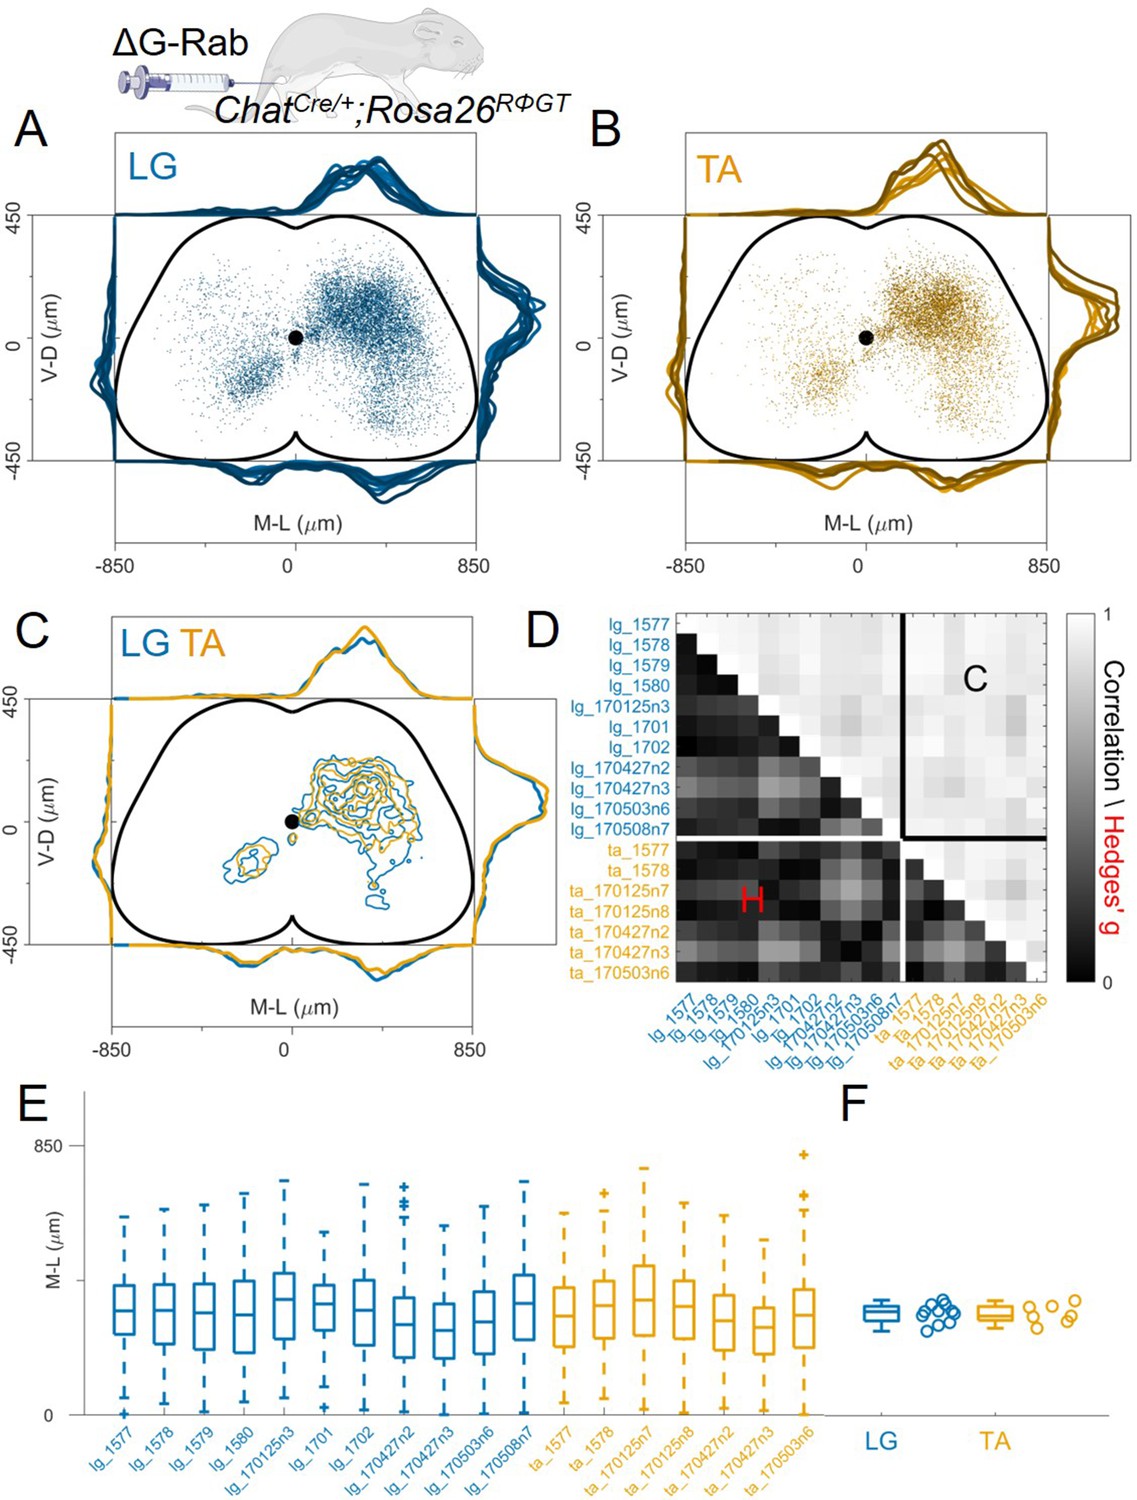
Consistent distribution of flexor and extensor premotor interneurons across all individual experiments.
(A, B) Distribution of premotor interneurons of LG (A) and TA (B) for all the injections. Distributions for each individual experiment are represented with different shades of blue and orange. (C) All experiments (single or double ΔG-RabV injections) pooled, showing an overlap of the flexor and extensor related distribution in all quadrants of the spinal cord, with individual dots replaced by contours. For each section the data are scaled to the reference points indicated in the methods in order to account for size differences along the segments. (D) Correlation (top right) and absolute value of Hedges’ G coefficient (bottom left) across all pairs of experiments, indicating a high degree of consistency and small effect sizes across all experiments, independent of the muscle injected. (E) Box and whisker plot of the mediolateral position of dorsal ipsilateral premotor interneurons in each experiment. (F) Values of the dorsal ipsilateral interneuron distribution median for each LG and TA experiment. Pooled distributions split into lumbar segments are shown in Figure 3—figure supplement 1, normalized and 2, raw data before normalization.
-
Figure 3—source data 1
Hedges’G and correlation across experiments in the lower and upper triangular matrix respectively shown in panel D.
- https://cdn.elifesciences.org/articles/81976/elife-81976-fig3-data1-v3.xlsx
-
Figure 3—source data 2
Median of mediolateral coordinates in the ipsilateral dorsal quadrant for each experiment shown in panel F, LG (n=11 experiments) and TA (n=7 experiments).
For each section the data are scaled to the reference points indicated in the methods in order to account for size differences along the segments.
- https://cdn.elifesciences.org/articles/81976/elife-81976-fig3-data2-v3.xlsx
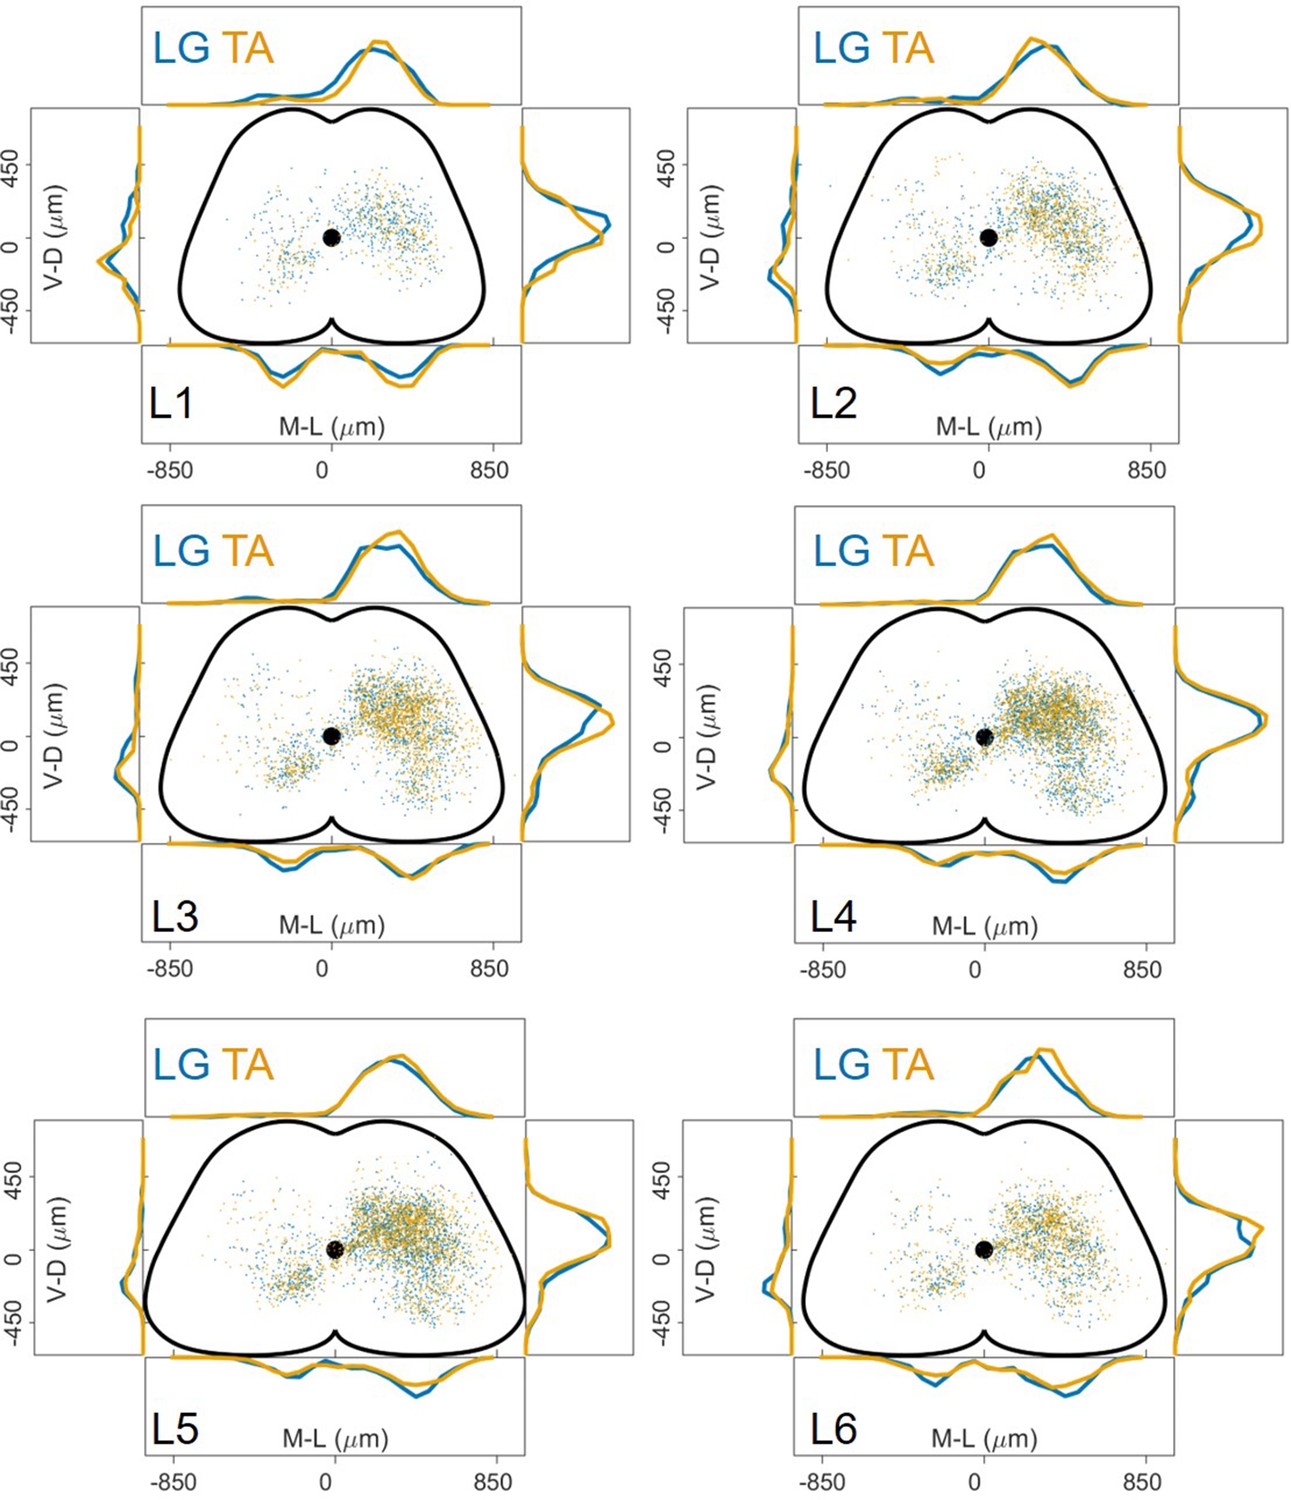
Figure 3—figure supplement 1
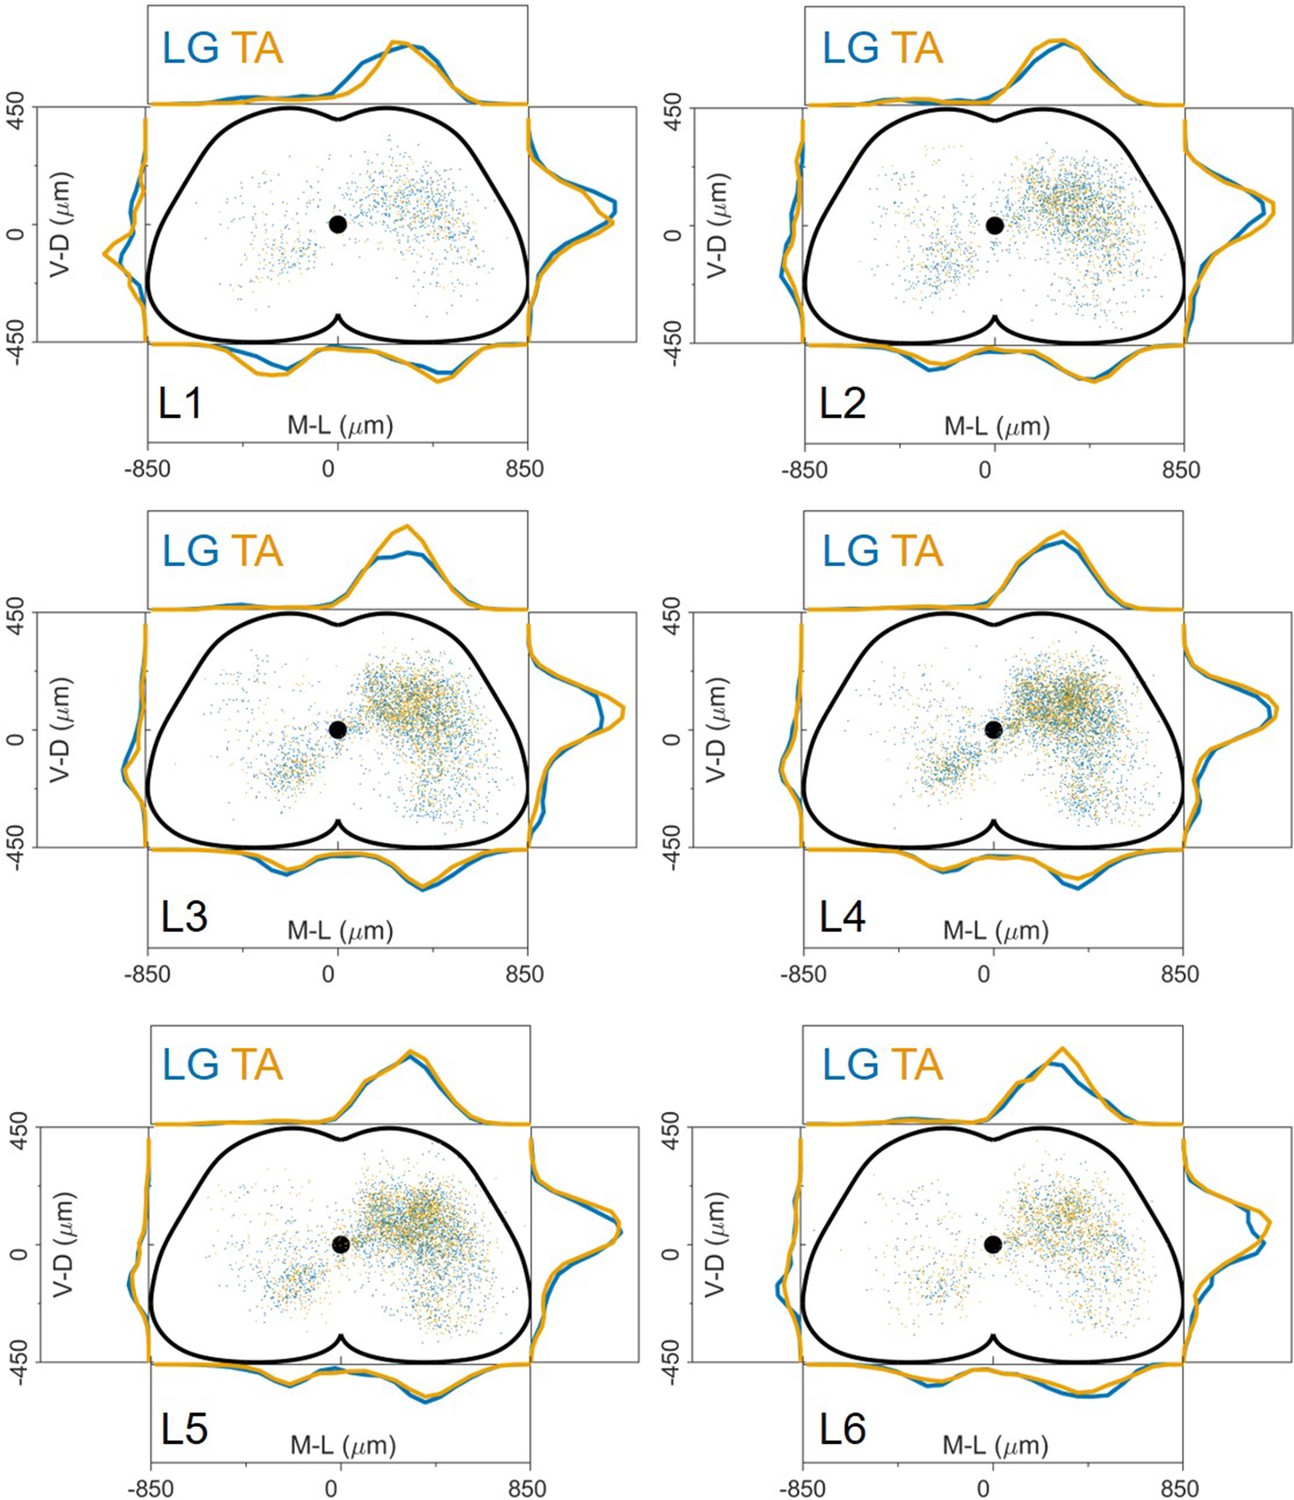
The distribution of premotor interneurons is similar throughout the lumbar spinal cord.
Data pooled from 18 experiments (11 LG and 7 TA injections) show that within each lumbar segment, from L1 to L6, the distributions of LG and TA premotor interneurons are overlapping.
-
Figure 3—figure supplement 1—source data 1
Cartesian x-y-z coordinates pooled within lumbar segments L1 to L6 for LG (source data 1–6, n=11 experiments) and TA (source data 7–12, n=7 experiments).
The x-y coordinates are normalized (between –0.5 and 0.5) while z coordinates are in micron, with the axis origin taken at the border between L4 and L5 and negative values in the rostral direction.
- https://cdn.elifesciences.org/articles/81976/elife-81976-fig3-figsupp1-data1-v3.xlsx
-
Figure 3—figure supplement 1—source data 2
Cartesian x-y-z coordinates pooled within lumbar segment L2 for LG.
- https://cdn.elifesciences.org/articles/81976/elife-81976-fig3-figsupp1-data2-v3.xlsx
-
Figure 3—figure supplement 1—source data 3
Cartesian x-y-z coordinates pooled within lumbar segment L3 for LG.
- https://cdn.elifesciences.org/articles/81976/elife-81976-fig3-figsupp1-data3-v3.xlsx
-
Figure 3—figure supplement 1—source data 4
Cartesian x-y-z coordinates pooled within lumbar segment L4 for LG.
- https://cdn.elifesciences.org/articles/81976/elife-81976-fig3-figsupp1-data4-v3.xlsx
-
Figure 3—figure supplement 1—source data 5
Cartesian x-y-z coordinates pooled within lumbar segment L5 for LG.
- https://cdn.elifesciences.org/articles/81976/elife-81976-fig3-figsupp1-data5-v3.xlsx
-
Figure 3—figure supplement 1—source data 6
Cartesian x-y-z coordinates pooled within lumbar segment L6 for LG.
- https://cdn.elifesciences.org/articles/81976/elife-81976-fig3-figsupp1-data6-v3.xlsx
-
Figure 3—figure supplement 1—source data 7
Cartesian x-y-z coordinates pooled within lumbar segment L1 for TA.
- https://cdn.elifesciences.org/articles/81976/elife-81976-fig3-figsupp1-data7-v3.xlsx
-
Figure 3—figure supplement 1—source data 8
Cartesian x-y-z coordinates pooled within lumbar segment L2 for TA.
- https://cdn.elifesciences.org/articles/81976/elife-81976-fig3-figsupp1-data8-v3.xlsx
-
Figure 3—figure supplement 1—source data 9
Cartesian x-y-z coordinates pooled within lumbar segment L3 for TA.
- https://cdn.elifesciences.org/articles/81976/elife-81976-fig3-figsupp1-data9-v3.xlsx
-
Figure 3—figure supplement 1—source data 10
Cartesian x-y-z coordinates pooled within lumbar segment L4 for TA.
- https://cdn.elifesciences.org/articles/81976/elife-81976-fig3-figsupp1-data10-v3.xlsx
-
Figure 3—figure supplement 1—source data 11
Cartesian x-y-z coordinates pooled within lumbar segment L5 for TA.
- https://cdn.elifesciences.org/articles/81976/elife-81976-fig3-figsupp1-data11-v3.xlsx
-
Figure 3—figure supplement 1—source data 12
Cartesian x-y-z coordinates pooled within lumbar segment L6 for TA.
- https://cdn.elifesciences.org/articles/81976/elife-81976-fig3-figsupp1-data12-v3.xlsx
Figure 3—figure supplement 2
Same data as in Figure 3—figure supplement 1 shown before normalization procedures, with idealized spinal cord section scaled to the average size of each segment.
Using the raw coordinates, the distribution of LG and TA premotor interneurons are consistently overlapping throughout the lumbar segments.
-
Figure 3—figure supplement 2—source data 1
Cartesian x-y-z raw coordinates pooled within lumbar segments L1 to L6 for LG (source data 1–6, n=11 experiments) and TA (source data 7–12, n=7 experiments).
The x-y coordinates are the raw coordinates before normalization while z coordinates have been shifted so that the axis origin is at the border between L4 and L5. Negative values are in the rostral direction.
- https://cdn.elifesciences.org/articles/81976/elife-81976-fig3-figsupp2-data1-v3.xlsx
-
Figure 3—figure supplement 2—source data 2
Cartesian x-y-z raw coordinates pooled within lumbar segment L2 for LG.
- https://cdn.elifesciences.org/articles/81976/elife-81976-fig3-figsupp2-data2-v3.xlsx
-
Figure 3—figure supplement 2—source data 3
Cartesian x-y-z raw coordinates pooled within lumbar segment L3 for LG.
- https://cdn.elifesciences.org/articles/81976/elife-81976-fig3-figsupp2-data3-v3.xlsx
-
Figure 3—figure supplement 2—source data 4
Cartesian x-y-z raw coordinates pooled within lumbar segment L4 for LG.
- https://cdn.elifesciences.org/articles/81976/elife-81976-fig3-figsupp2-data4-v3.xlsx
-
Figure 3—figure supplement 2—source data 5
Cartesian x-y-z raw coordinates pooled within lumbar segment L5 for LG.
- https://cdn.elifesciences.org/articles/81976/elife-81976-fig3-figsupp2-data5-v3.xlsx
-
Figure 3—figure supplement 2—source data 6
Cartesian x-y-z raw coordinates pooled within lumbar segment L6 for LG.
- https://cdn.elifesciences.org/articles/81976/elife-81976-fig3-figsupp2-data6-v3.xlsx
-
Figure 3—figure supplement 2—source data 7
Cartesian x-y-z raw coordinates pooled within lumbar segment L1 for TA.
- https://cdn.elifesciences.org/articles/81976/elife-81976-fig3-figsupp2-data7-v3.xlsx
-
Figure 3—figure supplement 2—source data 8
Cartesian x-y-z raw coordinates pooled within lumbar segment L2 for TA.
- https://cdn.elifesciences.org/articles/81976/elife-81976-fig3-figsupp2-data8-v3.xlsx
-
Figure 3—figure supplement 2—source data 9
Cartesian x-y-z raw coordinates pooled within lumbar segment L3 for TA.
- https://cdn.elifesciences.org/articles/81976/elife-81976-fig3-figsupp2-data9-v3.xlsx
-
Figure 3—figure supplement 2—source data 10
Cartesian x-y-z raw coordinates pooled within lumbar segment L4 for TA.
- https://cdn.elifesciences.org/articles/81976/elife-81976-fig3-figsupp2-data10-v3.xlsx
-
Figure 3—figure supplement 2—source data 11
Cartesian x-y-z raw coordinates pooled within lumbar segment L5 for TA.
- https://cdn.elifesciences.org/articles/81976/elife-81976-fig3-figsupp2-data11-v3.xlsx
-
Figure 3—figure supplement 2—source data 12
Cartesian x-y-z raw coordinates pooled within lumbar segment L6 for TA.
- https://cdn.elifesciences.org/articles/81976/elife-81976-fig3-figsupp2-data12-v3.xlsx
Figure 3—figure supplement 3
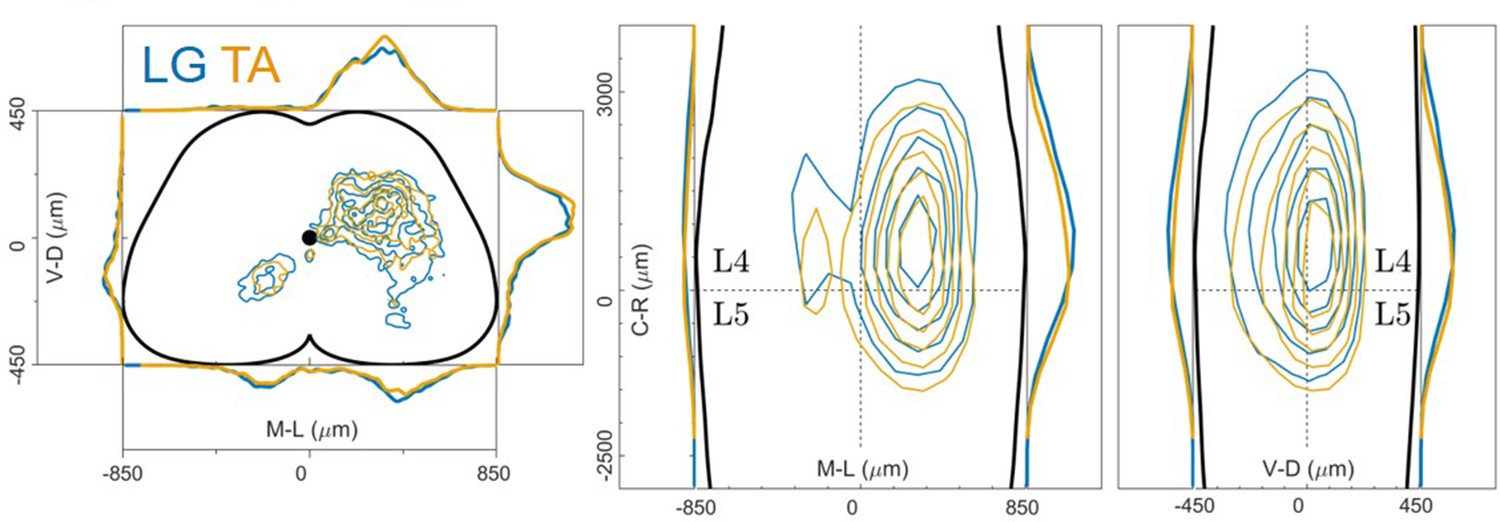
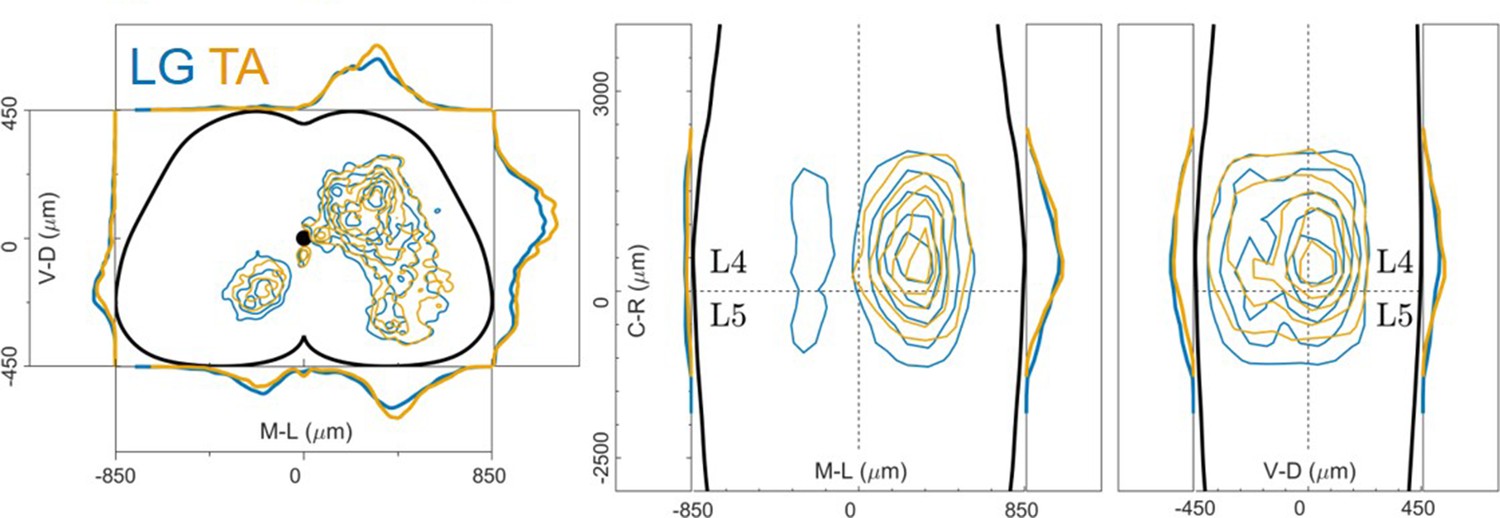
distribution of flexor and extensor premotor interneurons pooled across all LG and TA injections shown in the transverse plane (left) and as front (middle) and lateral (right) view along the rostrocaudal axis.
Figure 4 with 3 supplements
Injection with diluted RabV do not reveal any segregation between flexor and extensor premotor interneurons.
(A and B) show the distribution of LG and TA premotor interneurons on the transverse plane for individual experiments, represented with different colour shades. For each section the data are scaled to the reference points indicated in the methods in order to account for size differences along the segments. (C) LG and TA distributions overlap and the premotor interneuron distributions are highly correlated across experiments and absolute value of Hedges’ G coefficients are small (D). (E) Box and whisker plot of the mediolateral position of dorsal ipsilateral premotor interneurons in each experiment. (F) Values of the dorsal ipsilateral median for each LG and TA experiment.
-
Figure 4—source data 1
Hedges’G and correlation across experiments in the lower and upper triangular matrix respectively shown in panel D.
- https://cdn.elifesciences.org/articles/81976/elife-81976-fig4-data1-v3.xlsx
-
Figure 4—source data 2
Median of mediolateral coordinates in the ipsilateral dorsal quadrant for each experiment shown in panel F, LG (n=7 experiments) and TA (n=6 experiments).
- https://cdn.elifesciences.org/articles/81976/elife-81976-fig4-data2-v3.xlsx
Figure 4—figure supplement 1
distribution of flexor and extensor premotor interneurons pooled across all LG and TA for low titre injections shown in the transverse plane (left) and as front (middle) and lateral (right) view along the rostrocaudal axis.
Figure 4—figure supplement 2
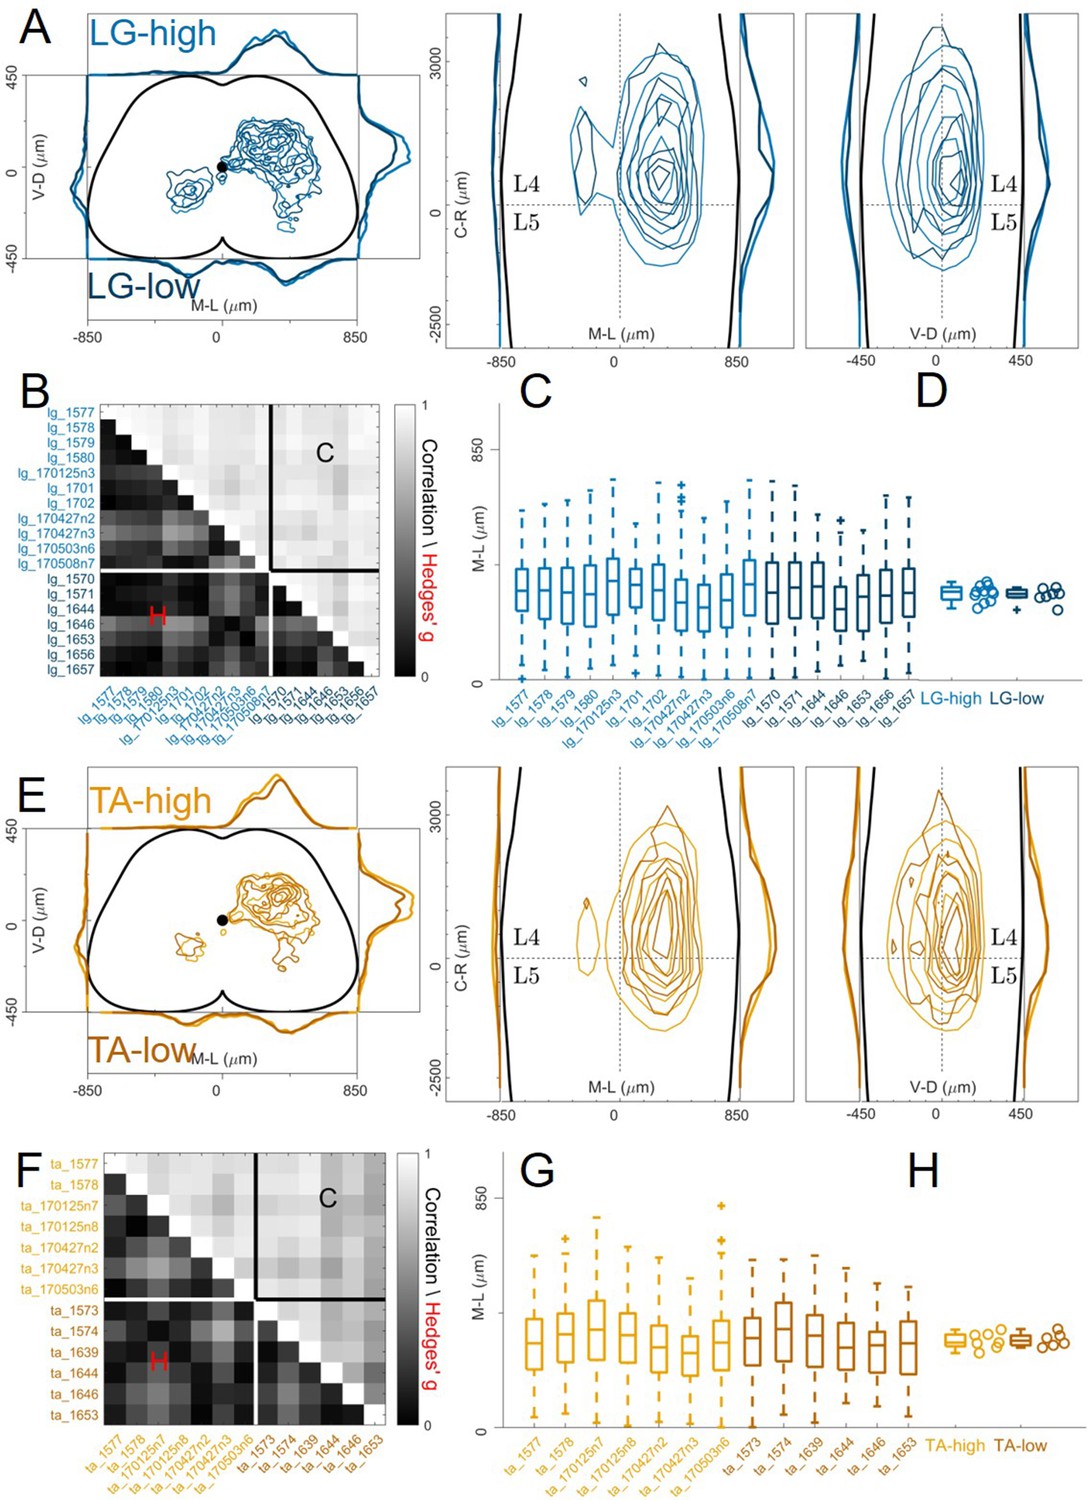
High and low efficiency infections give rise to the same premotor interneurons distributions.
Comparison of high and low titre injections are shown in A and E for LG and TA, respectively. For each section the data are scaled to the reference points indicated in the methods in order to account for size differences along the segments. Correlations between high and low titre experiments are high and effect sizes are low for both LG and TA muscles (B and F) The distributions are similar across experiments for both muscles (B and E) and the median values of the distributions in the ipsilateral dorsal quadrant are not different for high and low efficiency of infection (C and F).
-
Figure 4—figure supplement 2—source data 1
Hedges’G and correlation across experiments in the lower and upper triangular matrix respectively for LG high and low titre injections shown in panel B.
- https://cdn.elifesciences.org/articles/81976/elife-81976-fig4-figsupp2-data1-v3.xlsx
-
Figure 4—figure supplement 2—source data 2
Median of mediolateral coordinates in the ipsilateral dorsal quadrant for each experiment shown in panel D, high titre LG (n=11 experiments) and low titre LG (n=7 experiments).
- https://cdn.elifesciences.org/articles/81976/elife-81976-fig4-figsupp2-data2-v3.xlsx
-
Figure 4—figure supplement 2—source data 3
Hedges’G and correlation across experiments in the lower and upper triangular matrix respectively for TA high and low titre injections shown in panel F.
- https://cdn.elifesciences.org/articles/81976/elife-81976-fig4-figsupp2-data3-v3.xlsx
-
Figure 4—figure supplement 2—source data 4
Median of mediolateral coordinates in the ipsilateral dorsal quadrant for each experiment shown in panel H, high titre TA (n=7 experiments) and low titre TA (n=6 experiments).
- https://cdn.elifesciences.org/articles/81976/elife-81976-fig4-figsupp2-data4-v3.xlsx
Figure 4—figure supplement 3
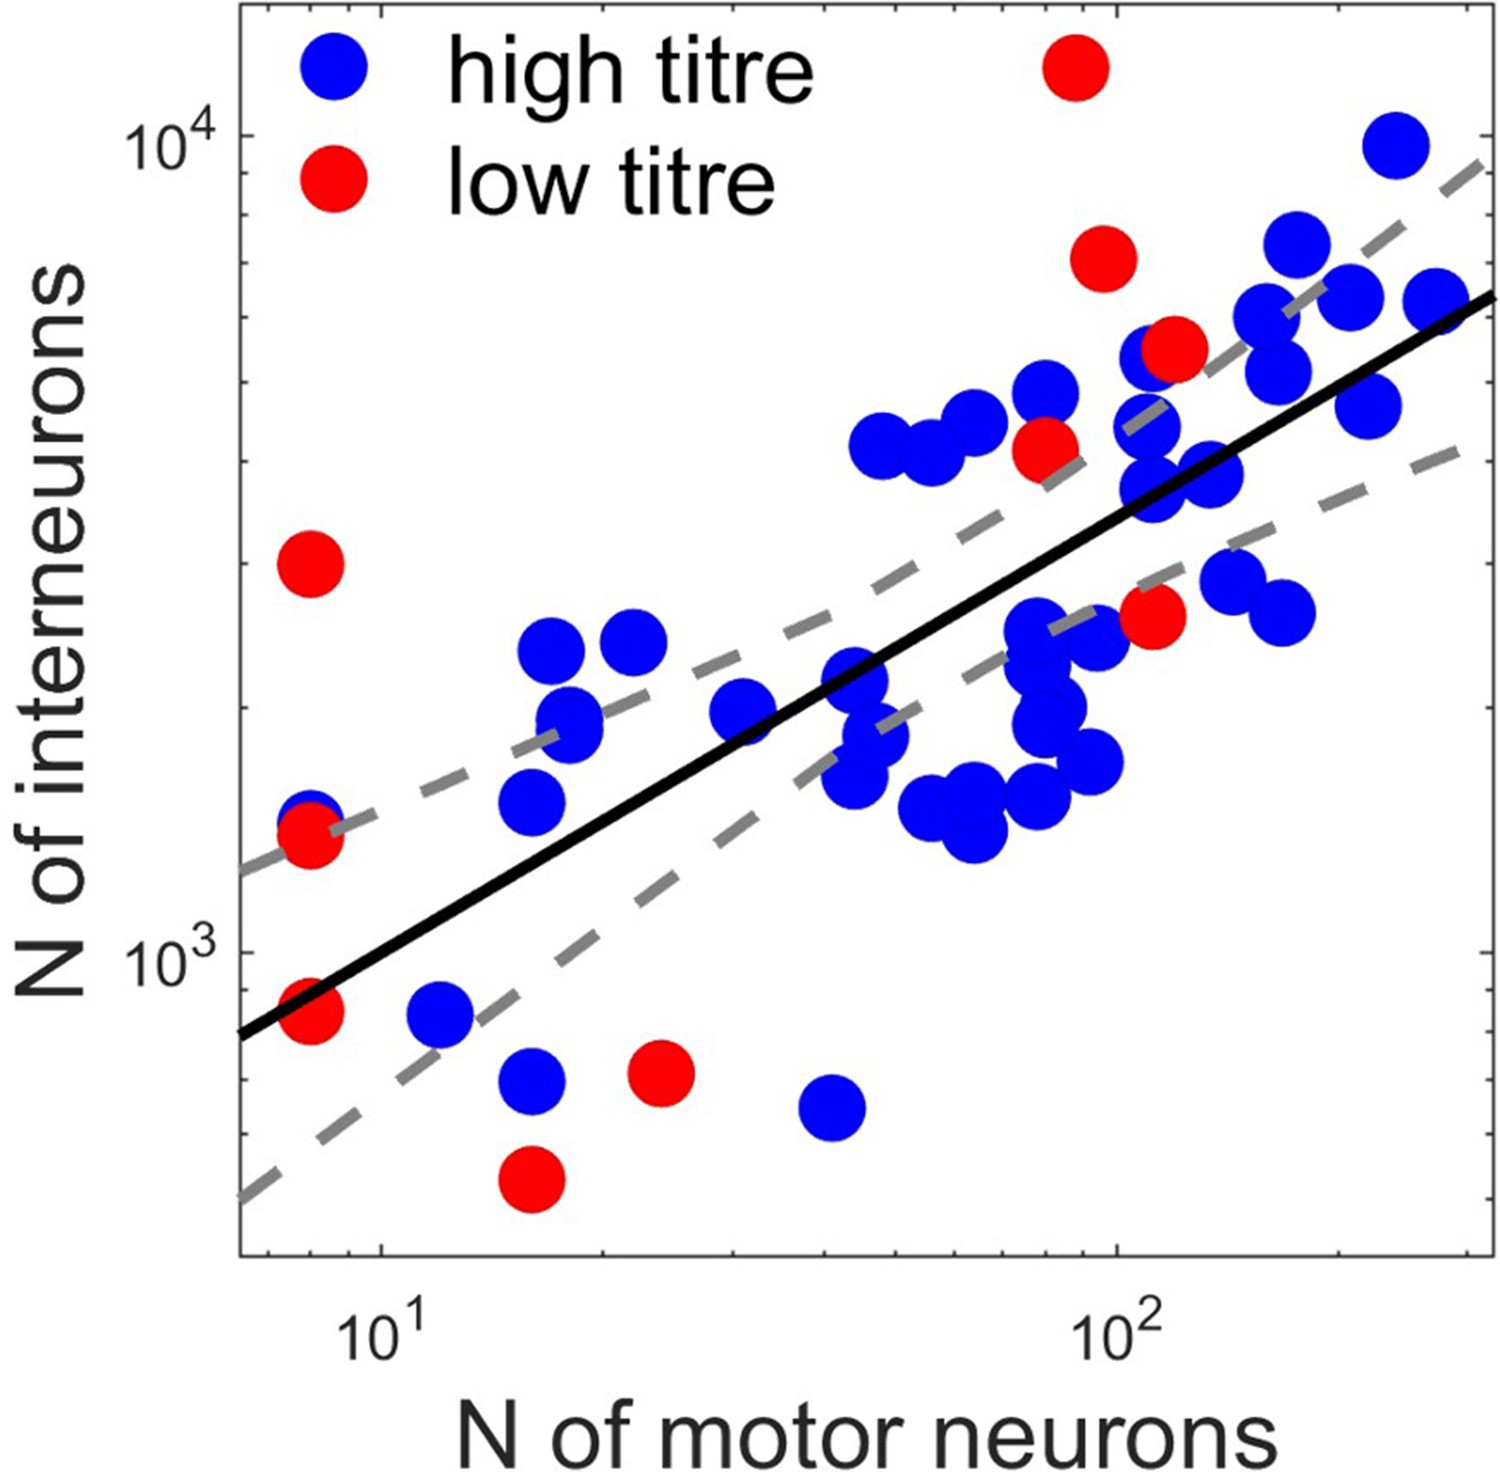
the relation between the number of primary infected motor neurons and premotor interneurons follow a power law y=axb with a=295 (155, 561 confidence intervals) and b=0.53 (0.37, 0.69 confidence intervals), R2=0.48.
Motor neuron and interneuron numbers in each experiment are shown for high (red) and low (black) titre experiments. The fitted line represents a power law.
-
Figure 4—figure supplement 3—source data 1
Number of labelled motor neurons and interneurons taken from Table 1 and scaled according to the sampling intervals of the sections.
- https://cdn.elifesciences.org/articles/81976/elife-81976-fig4-figsupp3-data1-v3.xlsx
Figure 5

Pairs of flexor or extensor muscles show similar distributions of premotor interneurons.
(A) Comparison of pooled data from extensor muscles LG and MG injections. (B) Correlation and absolute value of Hedges’ G coefficients across all experiments. (C) Box and whisker plots of the mediolateral position of dorsal ipsilateral premotor interneurons for each experiment and distribution of median values (D). (E) Similar plot as A, showing the distribution of premotor interneurons following injections of the flexor muscles TA and PL. Correlations and absolute value of Hedges’ G coefficients across each experiment are shown in (F). (G and H) shows the mediolateral distribution and the position of the median for each experiment, respectively. For each section, the data are scaled to the reference points indicated in the methods in order to account for size differences along the segments.
-
Figure 5—source data 1
Hedges’G and correlation across experiments with LG and MG injections in the lower and upper triangular matrix respectively shown in panel B.
- https://cdn.elifesciences.org/articles/81976/elife-81976-fig5-data1-v3.xlsx
-
Figure 5—source data 2
Median of mediolateral coordinates in the ipsilateral dorsal quadrant for each experiment shown in panel D, LG (n=18 experiments) and MG (n=10 experiments).
- https://cdn.elifesciences.org/articles/81976/elife-81976-fig5-data2-v3.xlsx
-
Figure 5—source data 3
Hedges’G and correlation across experiments with TA and PL injections in the lower and upper triangular matrix respectively shown in panel F.
- https://cdn.elifesciences.org/articles/81976/elife-81976-fig5-data3-v3.xlsx
-
Figure 5—source data 4
Median of mediolateral coordinates in the ipsilateral dorsal quadrant for each experiment shown in panel H, TA (n=13 experiments) and PL (n=5 experiments).
- https://cdn.elifesciences.org/articles/81976/elife-81976-fig5-data4-v3.xlsx
Figure 6
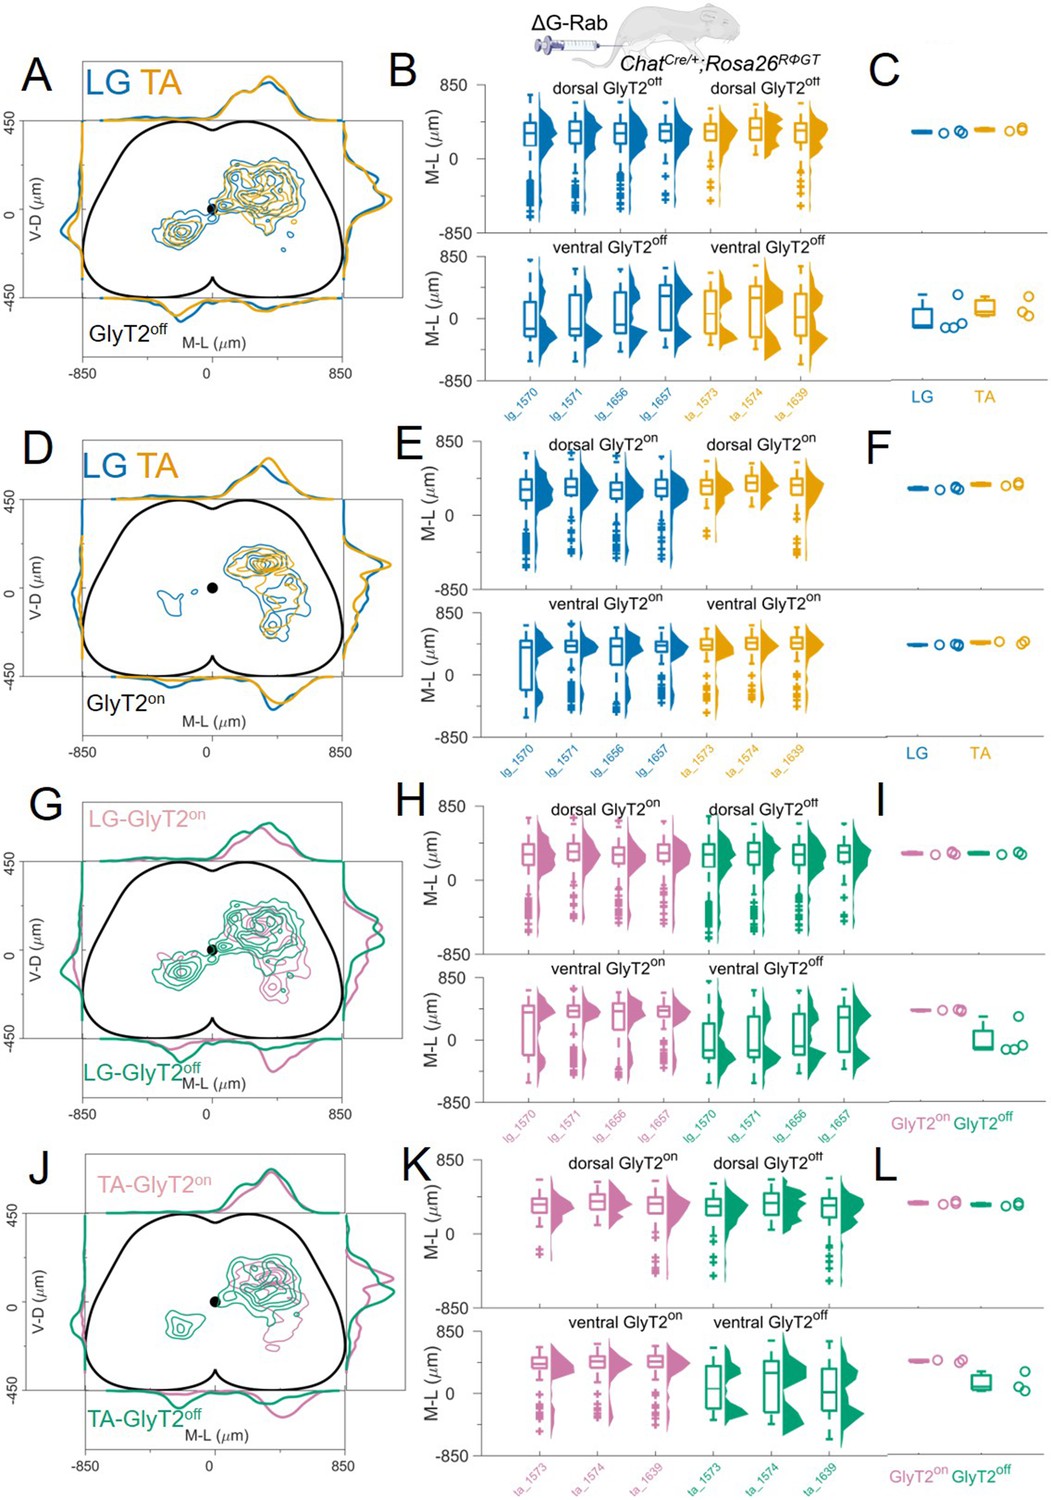
GlyT2on and GlyT2off premotor interneurons are distributed similarly for TA and LG.
(A, D) Distribution of GlyT2off (A) and GlyT2on (D) premotor interneurons following LG and TA injections pooled from 4 LG and 3 TA experiments in GlyT2-eGFP; ChatCre/+ mice crossed with Rosa26RΦGT mice, indicating that neither class of premotor interneurons is segregated across muscles. Boxplots and violin plots (B for GlyT2off and (E) for GlyT2on) show uniformity of distribution across experiments in both the dorsal (top) and ventral (bottom) halves of the cord. (C) (GlyT2off) and (F) (GlyT2on) show boxplots and individual values for the medians of the mediolateral distributions restricted to dorsal (top) or ventral (bottom) part of the cord. Ventral premotor GlyT2off and GlyT2on interneurons are differentially distributed. Comparison of excitatory and inhibitory premotor interneurons in LG (G) and TA (J) muscles are similar in the dorsal cord, but differ in the ventral cord, where most ipsilateral premotor interneurons are GlyT2on, and the majority of contralateral premotor interneurons are GlyT2off. Boxplots and violin plots of individual experiments are shown in H for LG and K for TA, highlighting the mediolateral differences in the ventral cord. The medians of the ventral and dorsal distributions are shown in I for LG and L for TA. For each section, the data are scaled to the reference points indicated in the methods in order to account for size differences along the segments.
-
Figure 6—source data 1
Median of mediolateral coordinates for Glyt2off ventral premotor interneurons from LG (n=4) and TA (n=3) experiments shown in panel C.
- https://cdn.elifesciences.org/articles/81976/elife-81976-fig6-data1-v3.xlsx
-
Figure 6—source data 2
Median of mediolateral coordinates for Glyt2off dorsal premotor interneurons from LG (n=4) and TA (n=3) experiments shown in panel C.
- https://cdn.elifesciences.org/articles/81976/elife-81976-fig6-data2-v3.xlsx
-
Figure 6—source data 3
Median of mediolateral coordinates for Glyt2on ventral premotor interneurons from LG (n=4) and TA (n=3) experiments shown in panel F.
- https://cdn.elifesciences.org/articles/81976/elife-81976-fig6-data3-v3.xlsx
-
Figure 6—source data 4
Median of mediolateral coordinates for Glyt2on dorsal premotor interneurons from LG (n=4) and TA (n=3) experiments shown in panel F.
- https://cdn.elifesciences.org/articles/81976/elife-81976-fig6-data4-v3.xlsx
Figure 7 with 1 supplement
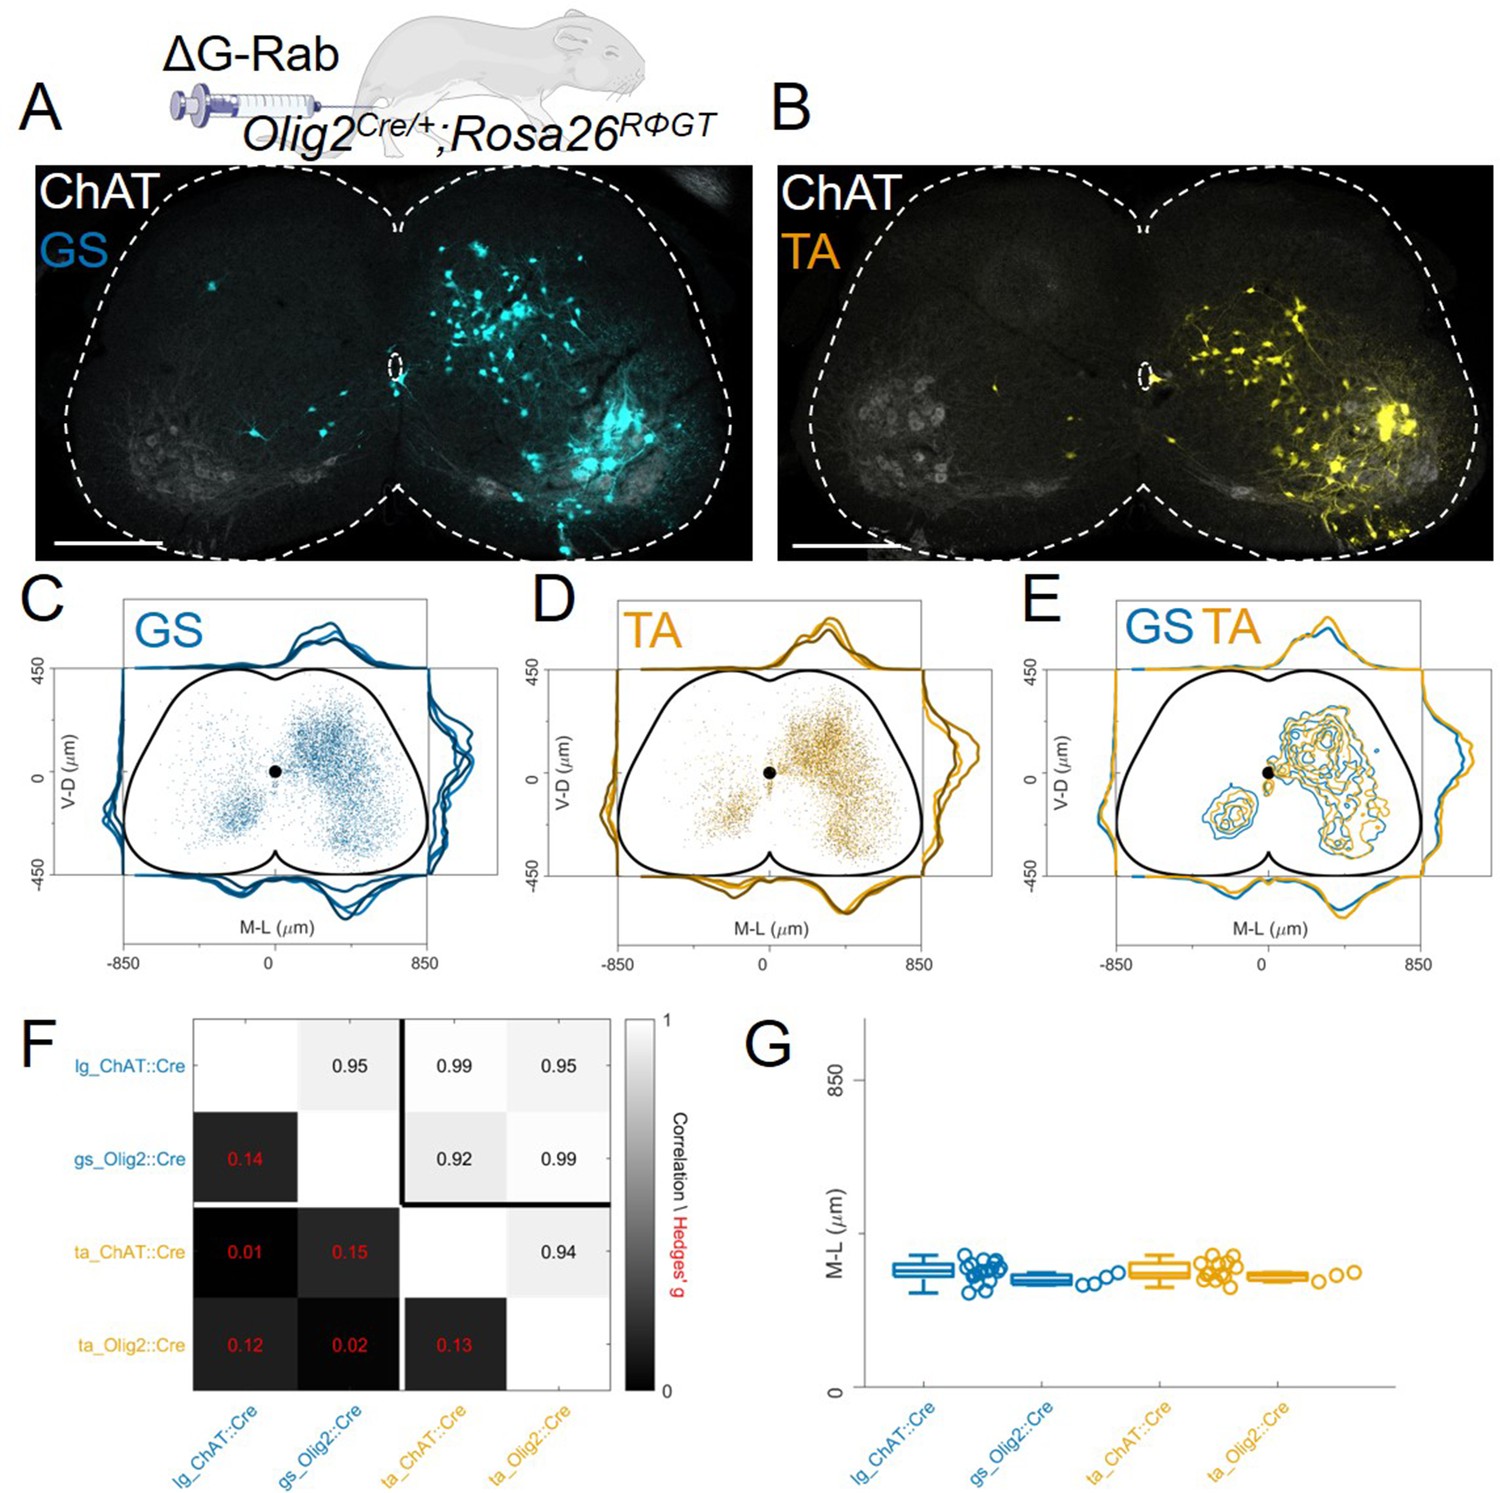
The distribution of flexor and extensor premotor INs is similar in Olig2Cre/+; Rosa26RΦGT.
(A, B) Single lumbar sections form animals injected in the GS (A) or TA (B) muscles (scale bars 300 μm). (C-E) Overlay of individual GS (C) and TA (D) experiments and pooled experiments (E). For each section, the data are scaled to the reference points indicated in the methods in order to account for size differences along the segments. (F) Correlation coefficients and absolute value of hierarchical bootstrapped Hedges’ G effect sizes between injections of different muscles and using a different driver for Cre expression. (G) Box and whisker plots of median values of all the medio-lateral distributions in the dorsal ipsilateral quadrant.
-
Figure 7—source data 1
Median of mediolateral coordinates in the ipsilateral dorsal quadrant shown in panel G comparing flexor and extensor injections in ChatCre/+ and Olig2Cre/+ mice.
- https://cdn.elifesciences.org/articles/81976/elife-81976-fig7-data1-v3.xlsx
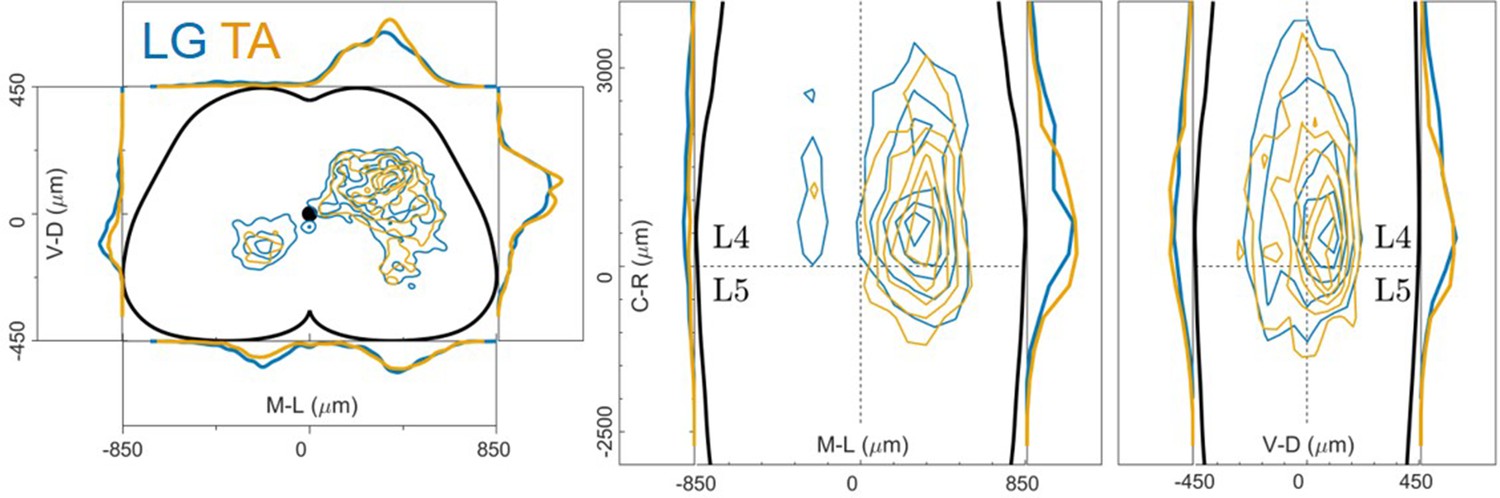
Figure 7—figure supplement 1
distribution of flexor and extensor premotor interneurons pooled across GS and TA injections performed in Olig2Cre/+; Rosa26RΦGT mice.
Distributions are shown in the transverse plane (left) and as front (middle) and lateral (right) view along the rostrocaudal axis.
Figure 8
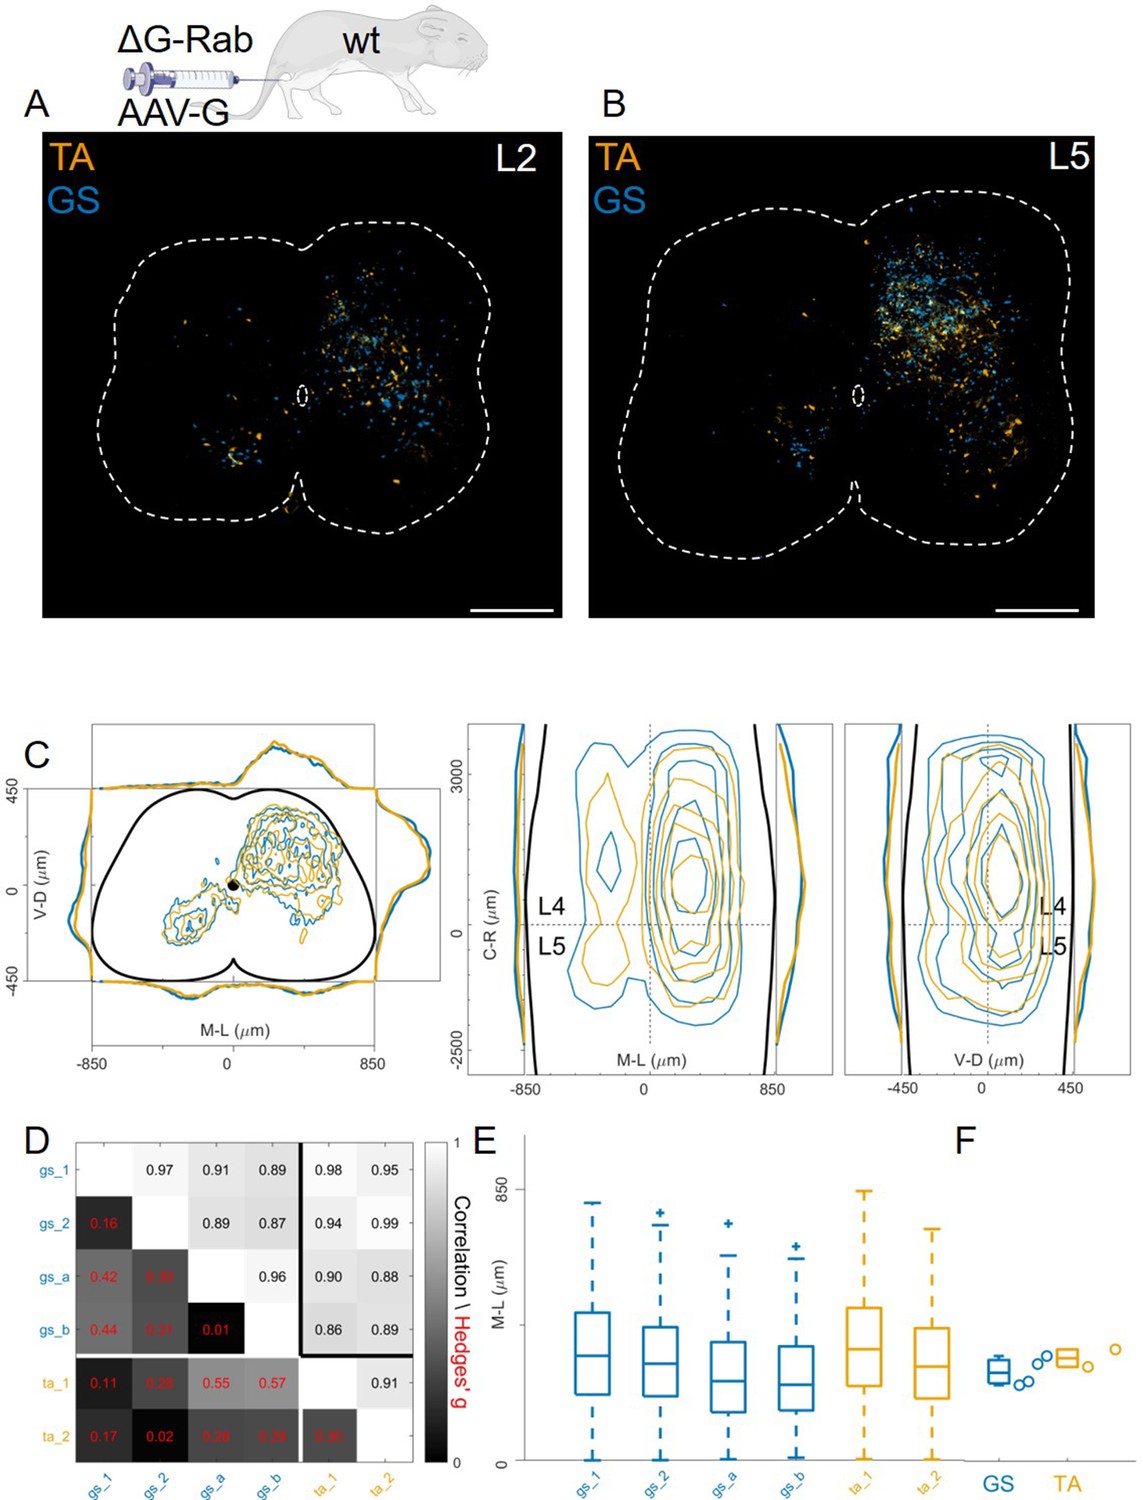
Injection of AAV-G and RabV into GS and TA muscles does not reveal segregation of premotor interneurons.
Example of double infected upper (A) and lower (B) lumbar sections. Transverse and longitudinal pooled distributions of premotor interneurons from two experiments are overlapping in all quadrants (C). For each section, the data are scaled to the reference points indicated in the methods in order to account for size differences along the segments. Individual experiments are highly correlated and have low absolute value of Hedges’ G effect sizes (D) and with similar distributions and medians in the ipsilateral dorsal quadrant (E, F). Scale bars 300 μm.
-
Figure 8—source data 1
Median of mediolateral coordinates in the ipsilateral dorsal quadrant for each experiment shown in panel F, GS (n=4) and TA (n=2).
- https://cdn.elifesciences.org/articles/81976/elife-81976-fig8-data1-v3.xlsx
Figure 9
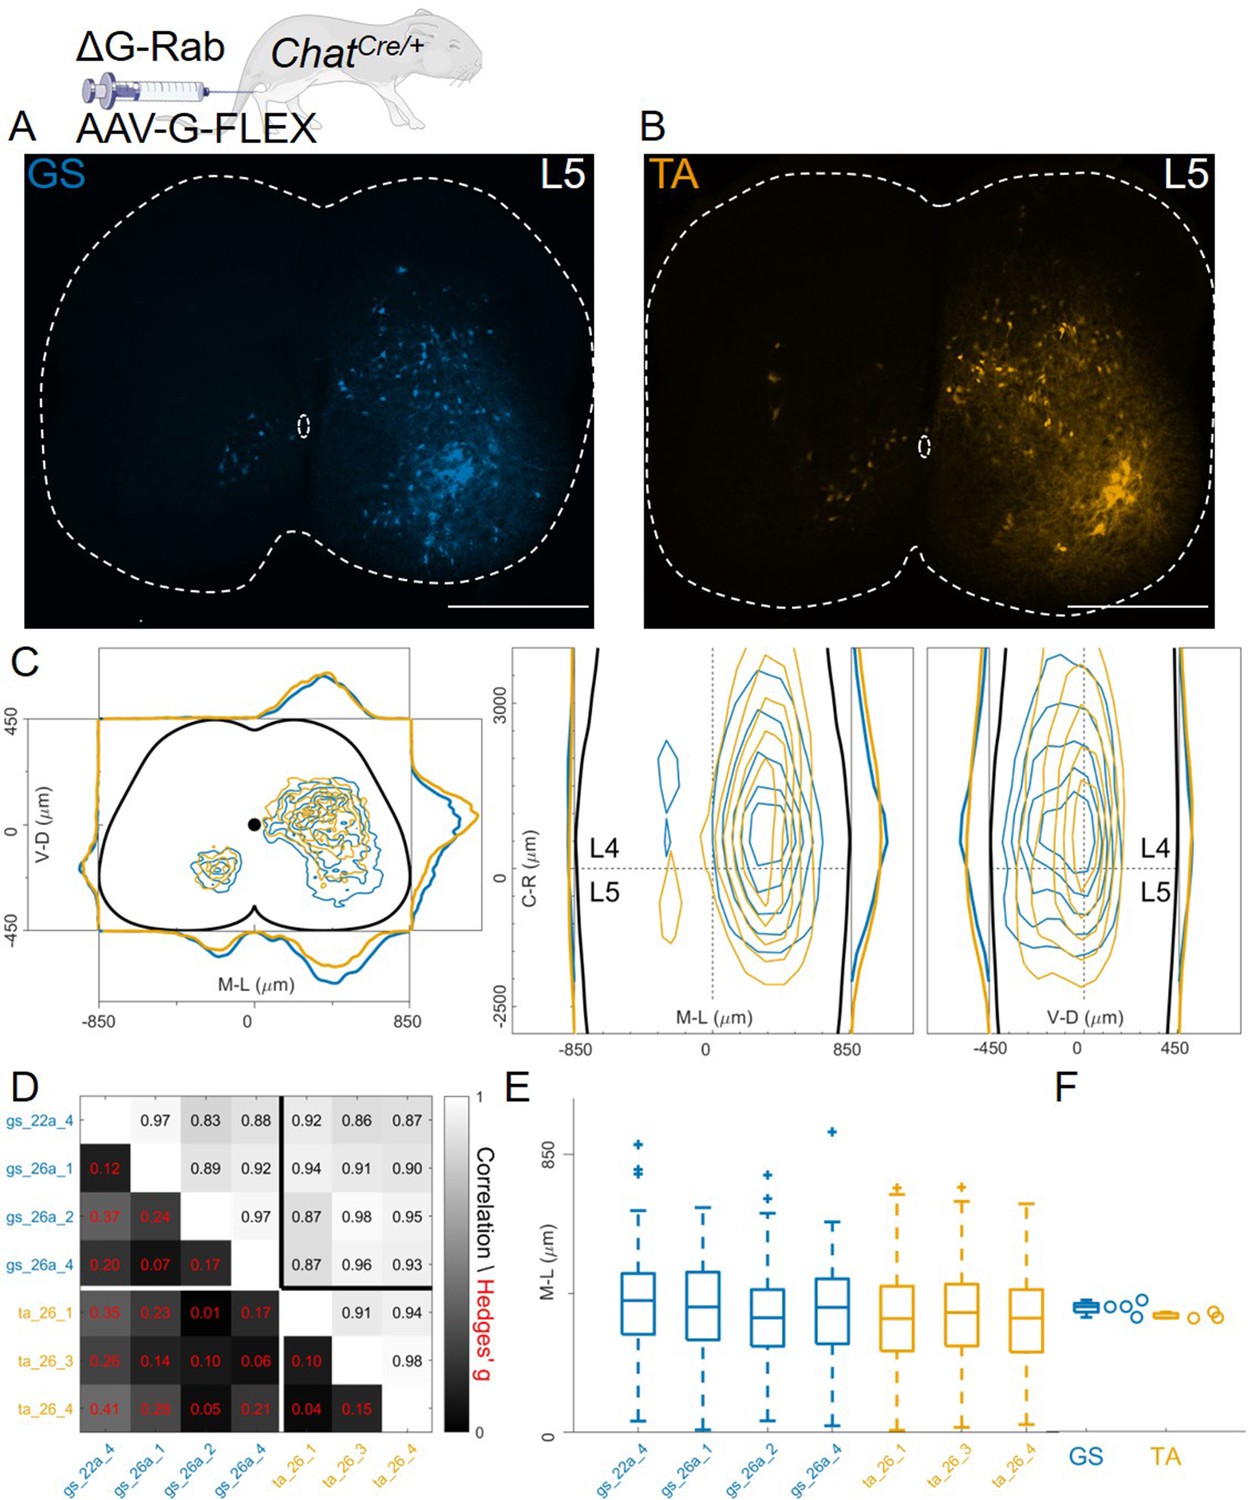
Injection of AAV-FLEX-G in ChatCre/+ mice gives rise to overlapping distributions of flexor and extensor related premotor interneurons.
Extensive labelling is observed in two lower lumbar sections of two GS (A) and TA (B) injected mice. The pooled distributions of flexor and extensor related infected neurons are similar on the transverse and longitudinal planes (C). For each section, the data are scaled to the reference points indicated in the methods in order to account for size differences along the segments. There is strong correlation and low effect sizes across individual experiments (D) and distributions and medians in the ipsilateral dorsal quadrant are not different (E, F). Scale bars 400 μm.
-
Figure 9—source data 1
Median of mediolateral coordinates in the ipsilateral dorsal quadrant for each experiment shown in panel F, GS (n=4) and TA (n=3).
- https://cdn.elifesciences.org/articles/81976/elife-81976-fig9-data1-v3.xlsx
Figure 10
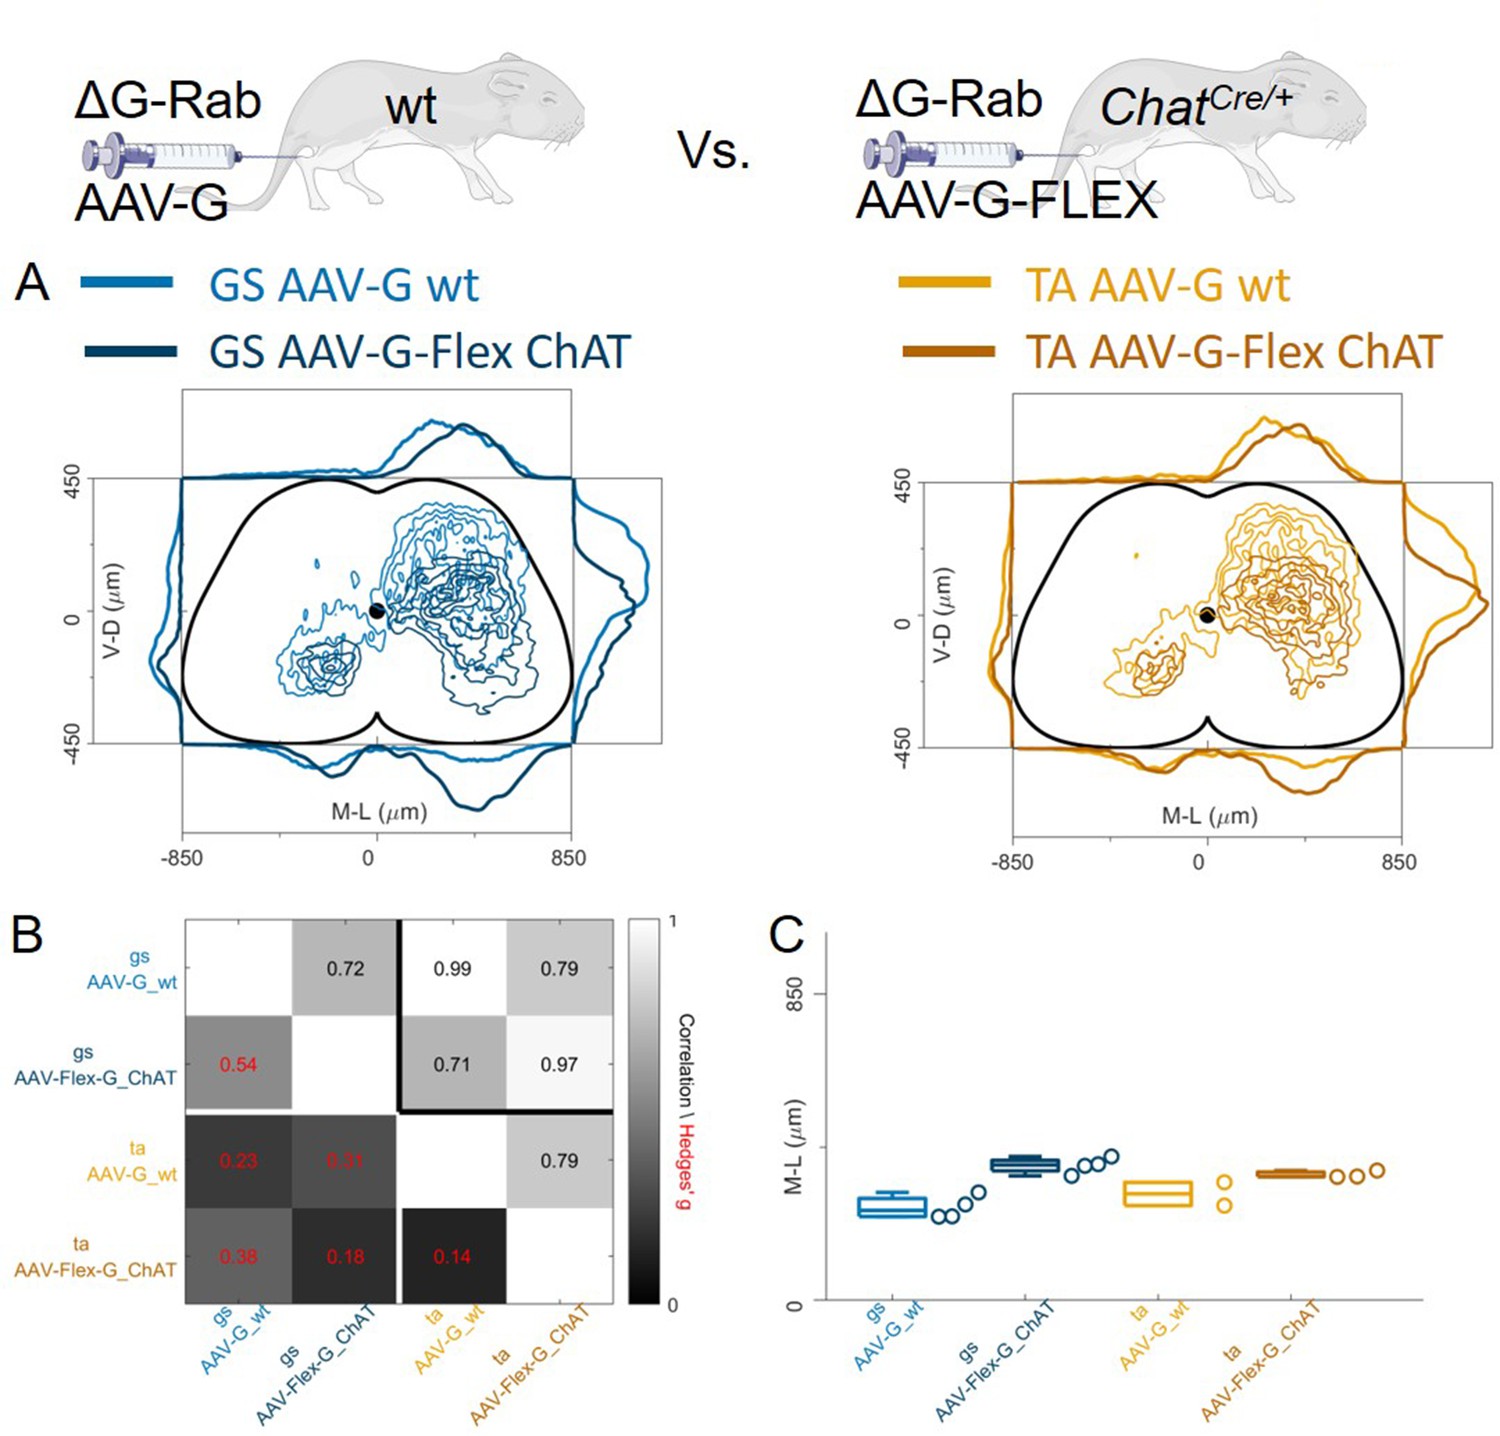
Injection of AAV-FLEX-G prevents anterograde spreading of RabV from afferent terminals.
(A) Side by side comparison of pooled transverse distribution of infected interneurons from GS (left) and TA (right) with AAV-G or AAV-FLEX-G and RabV. The distributions obtained with AAV-G show a marked mediolateral shift and extensive labelling of superficial dorsal horn neurons, a feature that is absent when anterograde transfer is prevented by restricting the expression of the G protein to motor neurons only. The distributions obtained are very similar across the different muscles, but the mediolateral shift is reflected in the lower correlation values and high hierarchical bootstrapped effect size (B) and difference in medians (C) between AAV-G and AAV-FLEX-G injections.
-
Figure 10—source data 1
Panel C showing the comparison of median of mediolateral coordinates in the ipsilateral dorsal quadrant for injections of AAV-G in wild type and AAV-Flex-G in ChatCre/+ mice for all GS and TA injections.
- https://cdn.elifesciences.org/articles/81976/elife-81976-fig10-data1-v3.xlsx
Figure 11
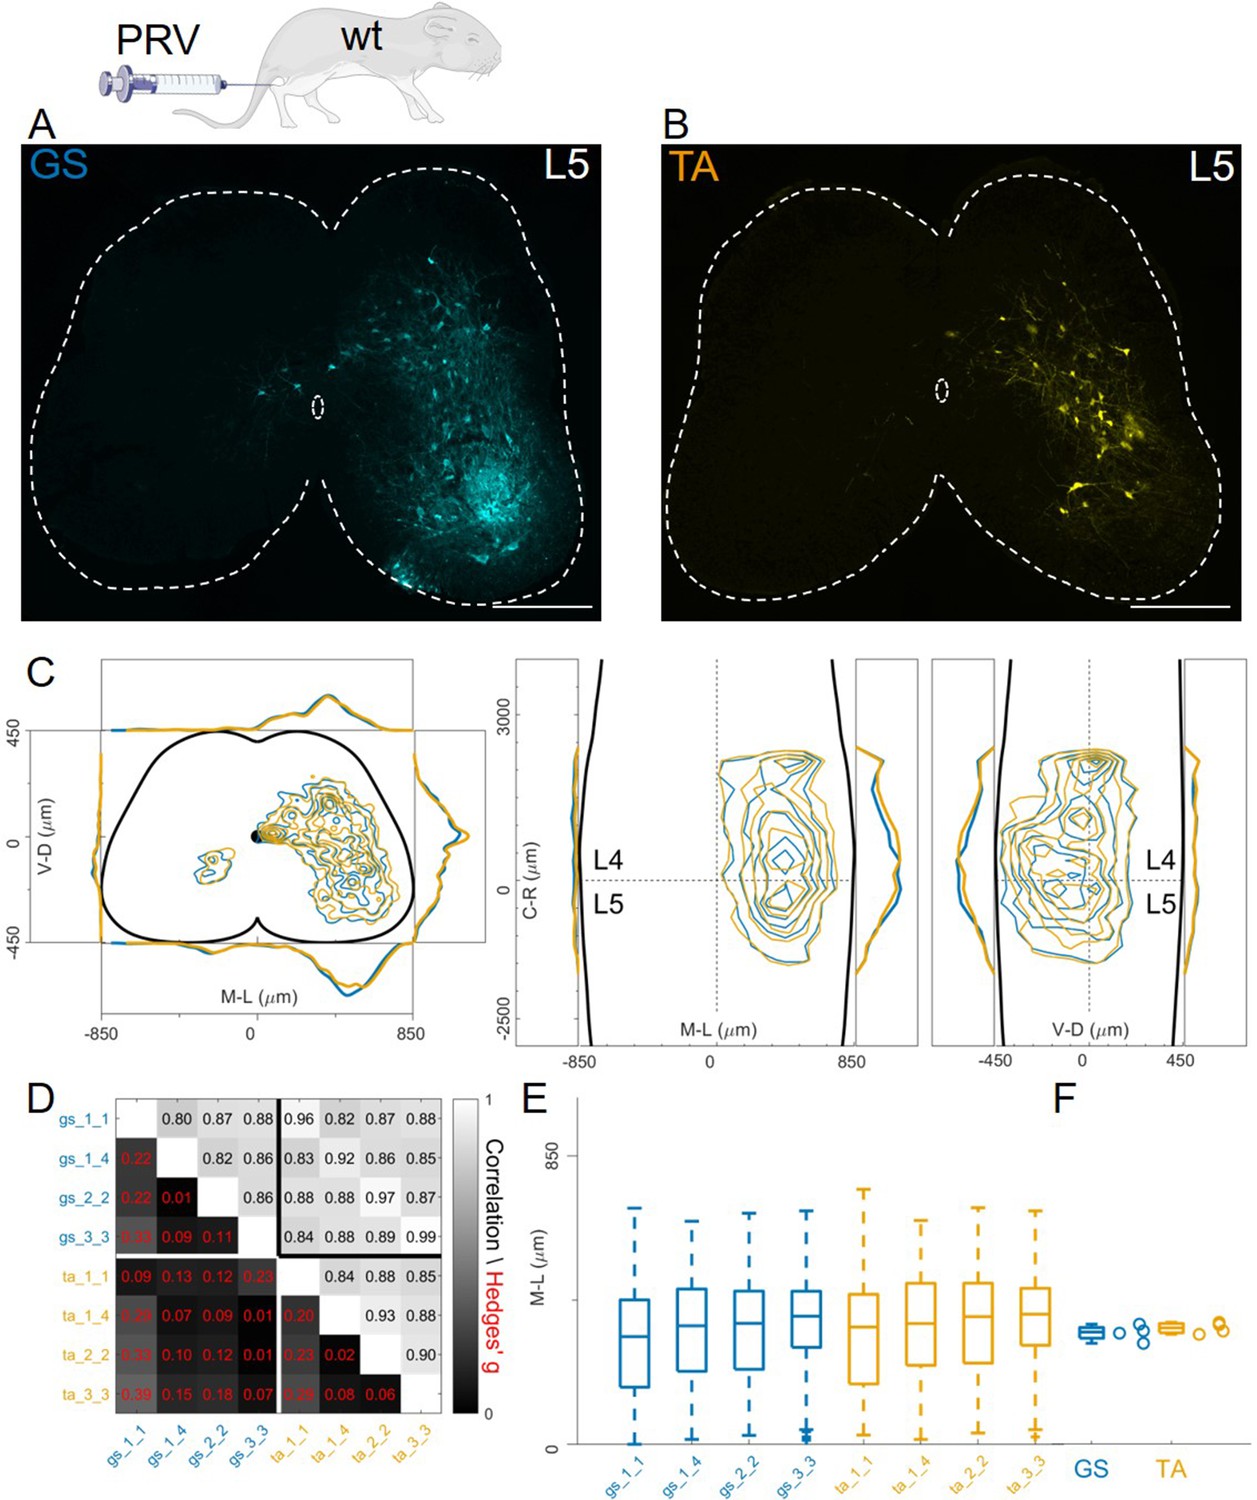
Injections of PRV-Bartha in GS and TA muscles give rise to similar distribution of premotor interneurons.
Example of a lower lumbar section of an animal injected in GS(A) and TA (B). The distribution of premotor interneurons are similar along all axis (C). For each section, the data are scaled to the reference points indicated in the methods in order to account for size differences along the segments. Individual experiments are highly correlated, with small effect size (D) and their median values along the mediolateral axis of the dorsal ipsilateral quadrant are identical for flexor and extensor injections (E, F). Scale bars 300 μm.
-
Figure 11—source data 1
Median of mediolateral coordinates in the ipsilateral dorsal quadrant for each experiment shown in panel F, GS (n=4) and TA (n=4).
- https://cdn.elifesciences.org/articles/81976/elife-81976-fig11-data1-v3.xlsx
Figure 12 with 16 supplements
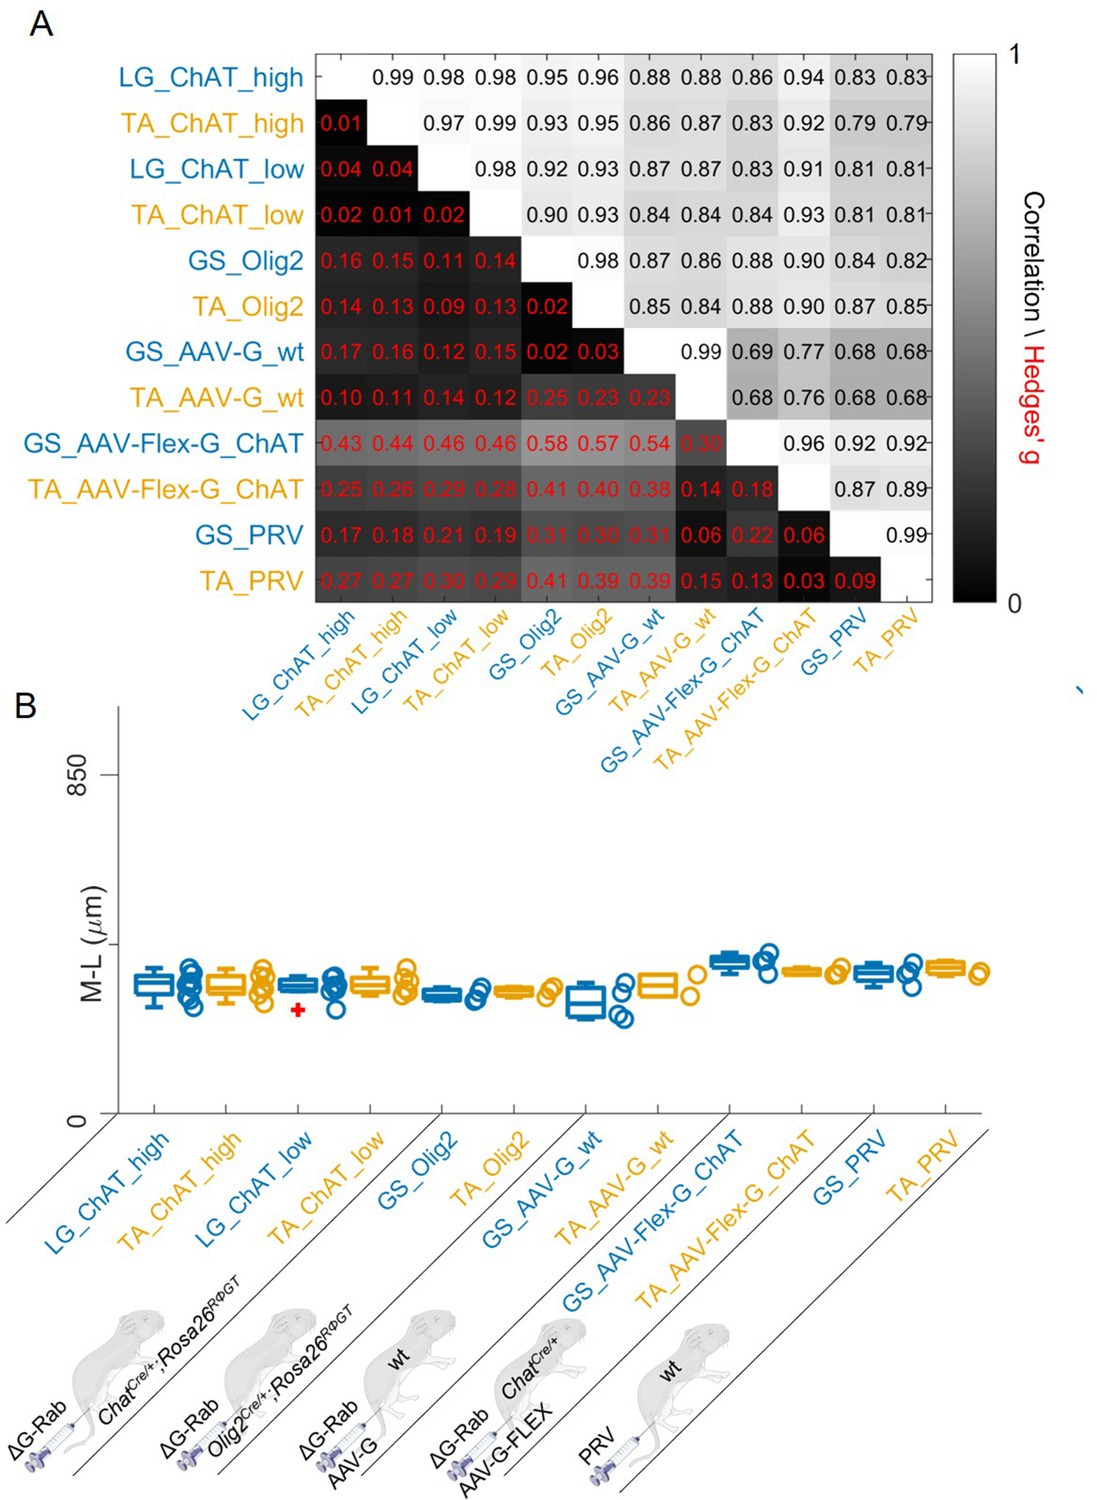
Regardless of the tracing methods, flexor and extensor related premotor interneurons distributions are always overlapping.
The correlation and absolute value of hierarchical bootstrapped Hedges’ G coefficient matrix across pooled experiments obtained with different injection strategies exhibits high values of correlation and low effect sizes across different techniques and across the two different muscles (A). The median values of the mediolateral position of premotor interneurons in the dorsal ipsilateral quadrant are similar for all conditions (B).
-
Figure 12—source data 1
Panel B showing the comparison of median of mediolateral coordinates of extensor (LG or GS) and flexor (TA) in the ipsilateral dorsal quadrant for all the viral tracing techniques used in this paper.
- https://cdn.elifesciences.org/articles/81976/elife-81976-fig12-data1-v3.xlsx
Figure 12—figure supplement 1
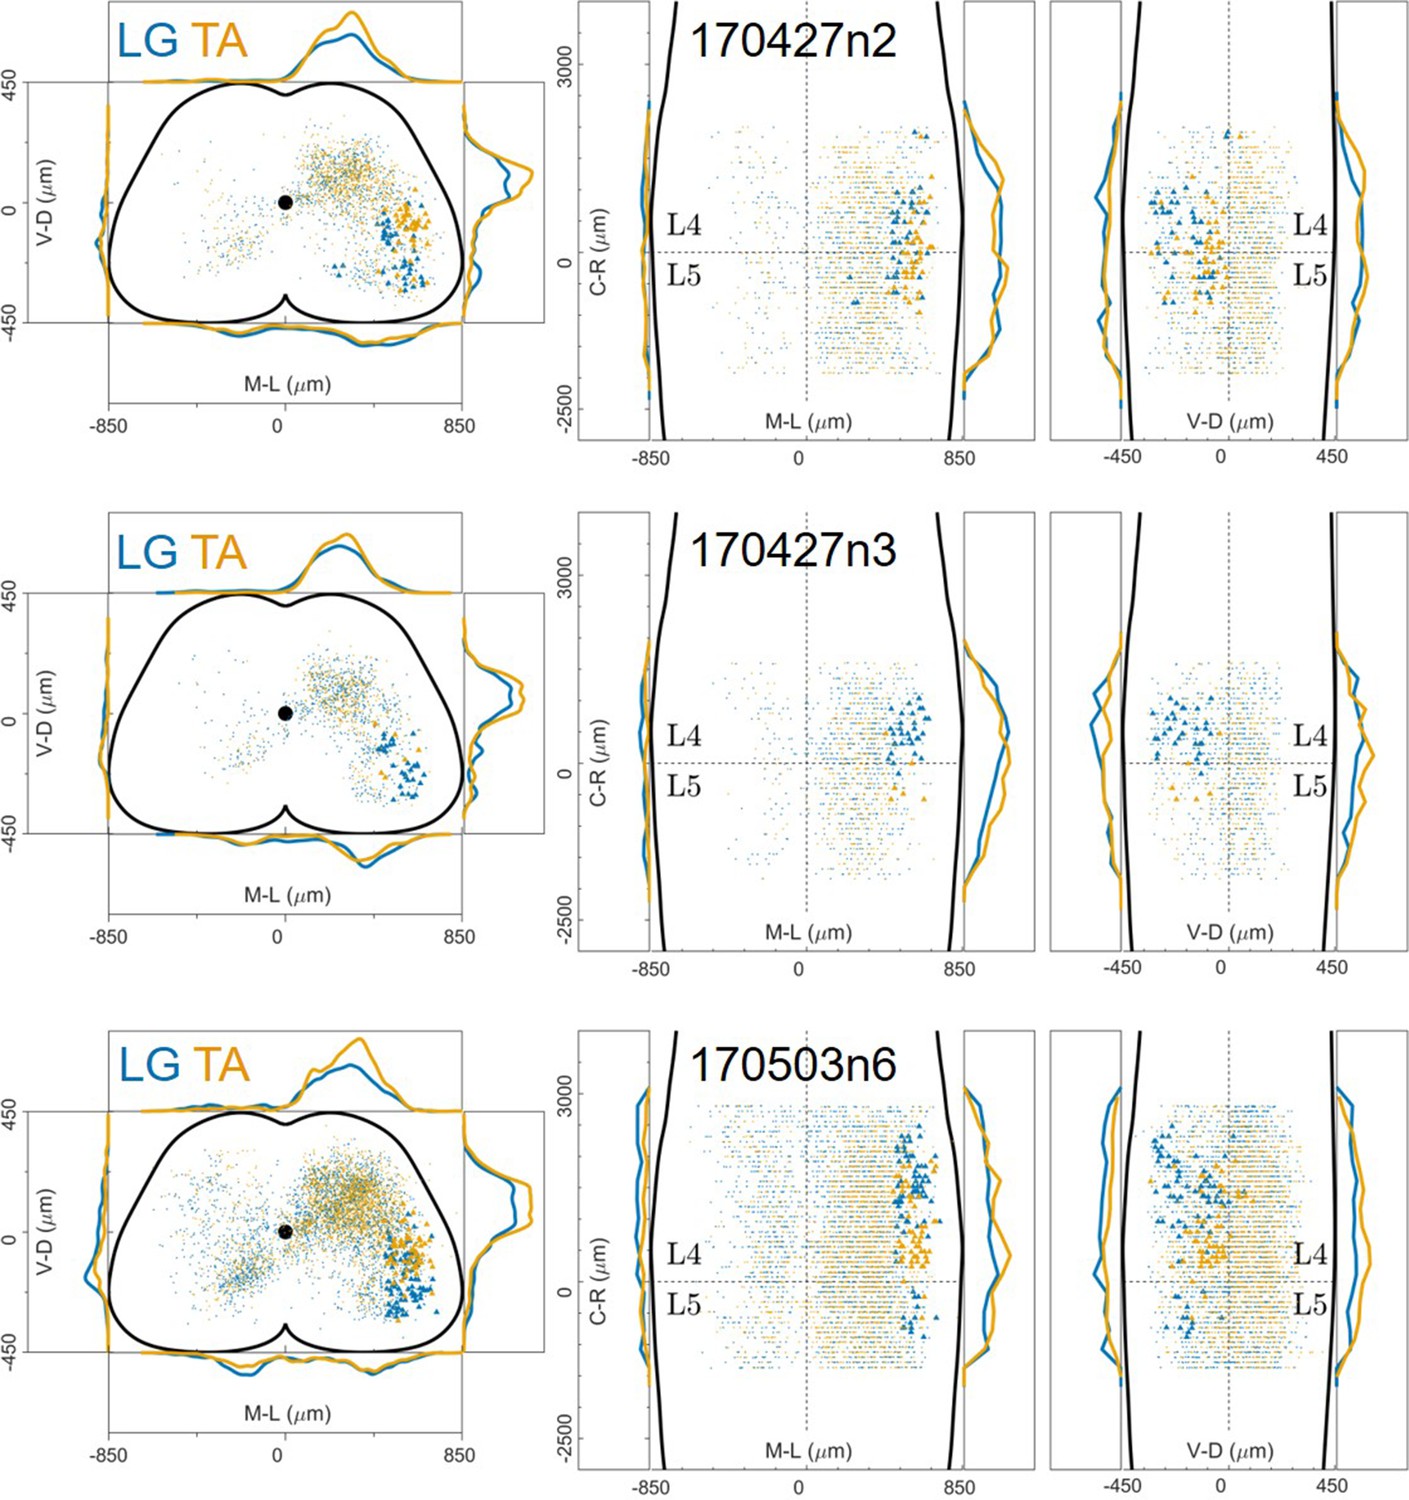
Distribution of motor neurons (triangles) and premotor interneurons (dots) of 3 LG (blue) and TA (yellow) double injections (UCL) of rabies virus in ChatCre/+; Rosa26RΦGT mice.
-
Figure 12—figure supplement 1—source data 1
Cartesian x-y-z coordinates of interneurons (sheet 1) and motor neurons (sheet 2) from LG injection 170427n2(UCL).
The x-y coordinates are normalized (between –0.5 and 0.5) and scaled to an idealized spinal cord of dimensions 1700 μm and 900 μm in the mediolateral and dorsoventral directions respectively, while z coordinates are in micron, with the axis origin taken at the border between L4 and L5 and negative values in the rostral direction.
- https://cdn.elifesciences.org/articles/81976/elife-81976-fig12-figsupp1-data1-v3.xlsx
-
Figure 12—figure supplement 1—source data 2
Cartesian x-y-z coordinates of interneurons (sheet 1) and motor neurons (sheet 2) from LG injection 170427n3 (UCL).
- https://cdn.elifesciences.org/articles/81976/elife-81976-fig12-figsupp1-data2-v3.xlsx
-
Figure 12—figure supplement 1—source data 3
Cartesian x-y-z coordinates of interneurons (sheet 1) and motor neurons (sheet 2) from LG injection 170503n6 (UCL).
- https://cdn.elifesciences.org/articles/81976/elife-81976-fig12-figsupp1-data3-v3.xlsx
-
Figure 12—figure supplement 1—source data 4
Cartesian x-y-z coordinates of interneurons (sheet 1) and motor neurons (sheet 2) from TA injection 170427n2 (UCL).
- https://cdn.elifesciences.org/articles/81976/elife-81976-fig12-figsupp1-data4-v3.xlsx
-
Figure 12—figure supplement 1—source data 5
Cartesian x-y-z coordinates of interneurons (sheet 1) and motor neurons (sheet 2) from TA injection 170427n3 (UCL).
- https://cdn.elifesciences.org/articles/81976/elife-81976-fig12-figsupp1-data5-v3.xlsx
-
Figure 12—figure supplement 1—source data 6
Cartesian x-y-z coordinates of interneurons (sheet 1) and motor neurons (sheet 2) from TA injection 170503n6 (UCL).
- https://cdn.elifesciences.org/articles/81976/elife-81976-fig12-figsupp1-data6-v3.xlsx
Figure 12—figure supplement 2
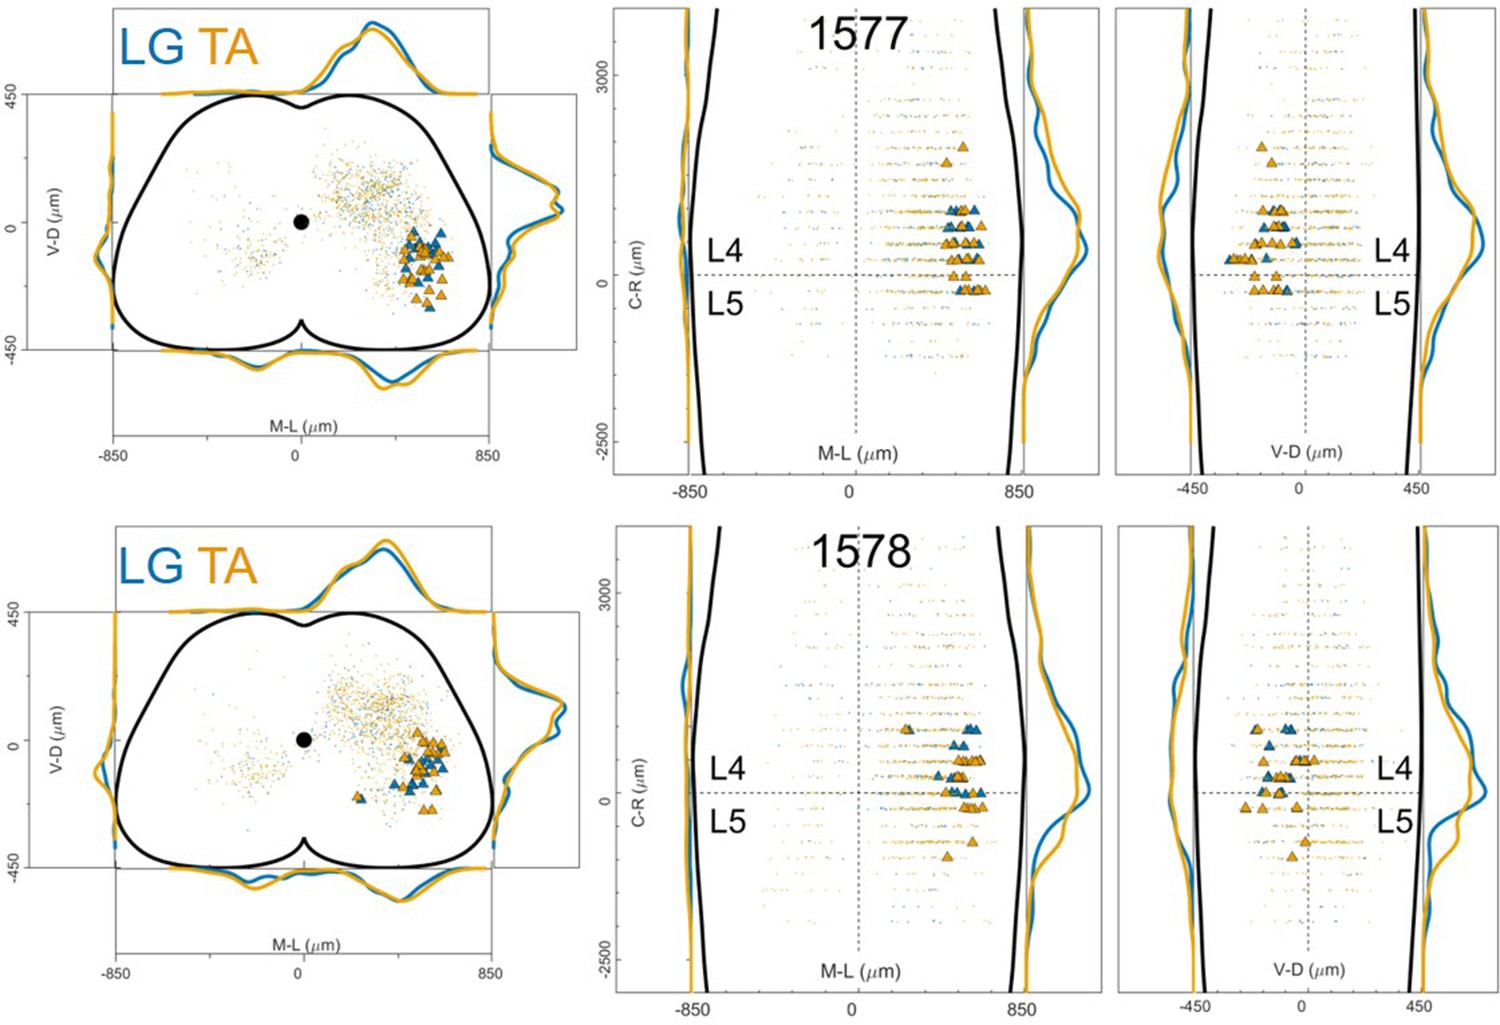
Distribution of motor neurons (triangles) and premotor interneurons (dots) of 2 LG (blue) and TA (yellow) double injections (UoG) of rabies virus in ChatCre/+; Rosa26RΦGT mice.
-
Figure 12—figure supplement 2—source data 1
Cartesian x-y-z coordinates of interneurons (sheet 1) and motor neurons (sheet 2) from LG injection 1577 (UoG).
The x-y coordinates are normalized (between –0.5 and 0.5) and scaled to an idealized spinal cord of dimensions 1700 μm and 900 μm in the mediolateral and dorsoventral directions respectively, while z coordinates are in micron, with the axis origin taken at the border between L4 and L5 and negative values in the rostral direction.
- https://cdn.elifesciences.org/articles/81976/elife-81976-fig12-figsupp2-data1-v3.xlsx
-
Figure 12—figure supplement 2—source data 2
Cartesian x-y-z coordinates of interneurons (sheet 1) and motor neurons (sheet 2) from LG injection 1578 (UoG).
- https://cdn.elifesciences.org/articles/81976/elife-81976-fig12-figsupp2-data2-v3.xlsx
-
Figure 12—figure supplement 2—source data 3
Cartesian x-y-z coordinates of interneurons (sheet 1) and motor neurons (sheet 2) from TA injection 1577 (UoG).
- https://cdn.elifesciences.org/articles/81976/elife-81976-fig12-figsupp2-data3-v3.xlsx
-
Figure 12—figure supplement 2—source data 4
Cartesian x-y-z coordinates of interneurons (sheet 1) and motor neurons (sheet 2) from TA injection 1578 (UoG).
- https://cdn.elifesciences.org/articles/81976/elife-81976-fig12-figsupp2-data4-v3.xlsx
Figure 12—figure supplement 3
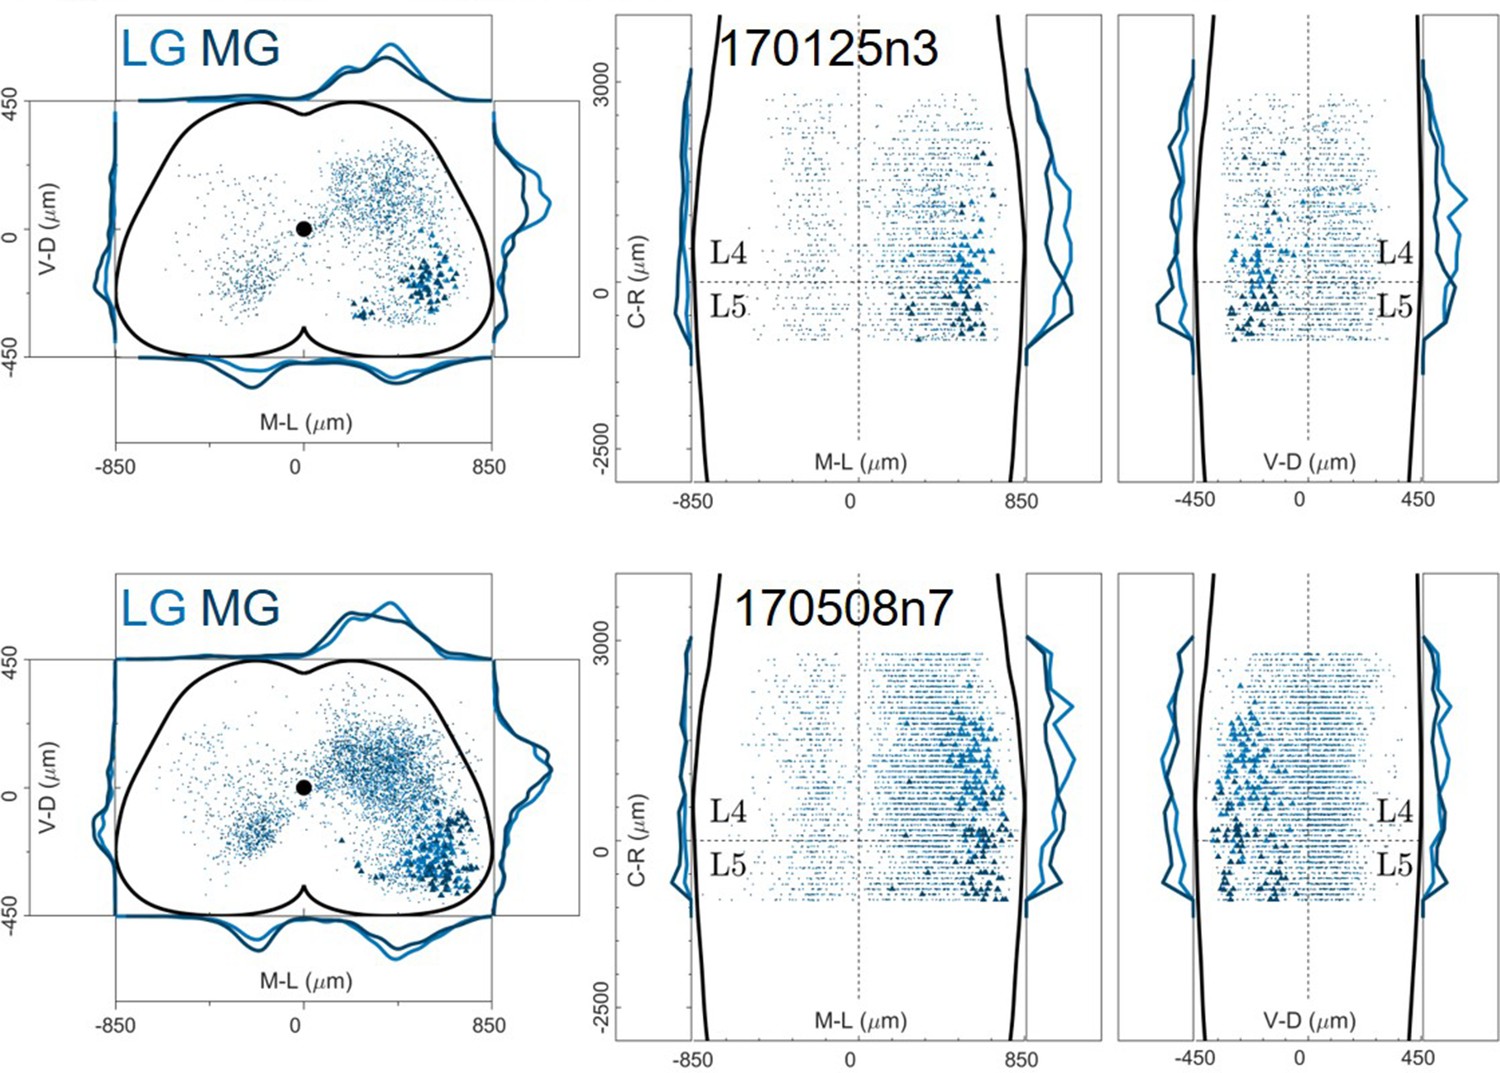
Distribution of motor neurons (triangles) and premotor interneurons (dots) of 2 LG (blue) and MG (dark blue) double injections (UCL) of rabies virus in ChatCre/+; Rosa26RΦGT mice.
-
Figure 12—figure supplement 3—source data 1
Cartesian x-y-z coordinates of interneurons (sheet 1) and motor neurons (sheet 2) from LG injection 170125n3 (UCL).
The x-y coordinates are normalized (between –0.5 and 0.5) and scaled to an idealized spinal cord of dimensions 1700 μm and 900 μm in the mediolateral and dorsoventral directions respectively, while z coordinates are in micron, with the axis origin taken at the border between L4 and L5 and negative values in the rostral direction.
- https://cdn.elifesciences.org/articles/81976/elife-81976-fig12-figsupp3-data1-v3.xlsx
-
Figure 12—figure supplement 3—source data 2
Cartesian x-y-z coordinates of interneurons (sheet 1) and motor neurons (sheet 2) from LG injection 170508n7 (UCL).
- https://cdn.elifesciences.org/articles/81976/elife-81976-fig12-figsupp3-data2-v3.xlsx
-
Figure 12—figure supplement 3—source data 3
Cartesian x-y-z coordinates of interneurons (sheet 1) and motor neurons (sheet 2) from MG injection 170125n3 (UCL).
- https://cdn.elifesciences.org/articles/81976/elife-81976-fig12-figsupp3-data3-v3.xlsx
-
Figure 12—figure supplement 3—source data 4
Cartesian x-y-z coordinates of interneurons (sheet 1) and motor neurons (sheet 2) from MG injection 170508n7 (UCL).
- https://cdn.elifesciences.org/articles/81976/elife-81976-fig12-figsupp3-data4-v3.xlsx
Figure 12—figure supplement 4
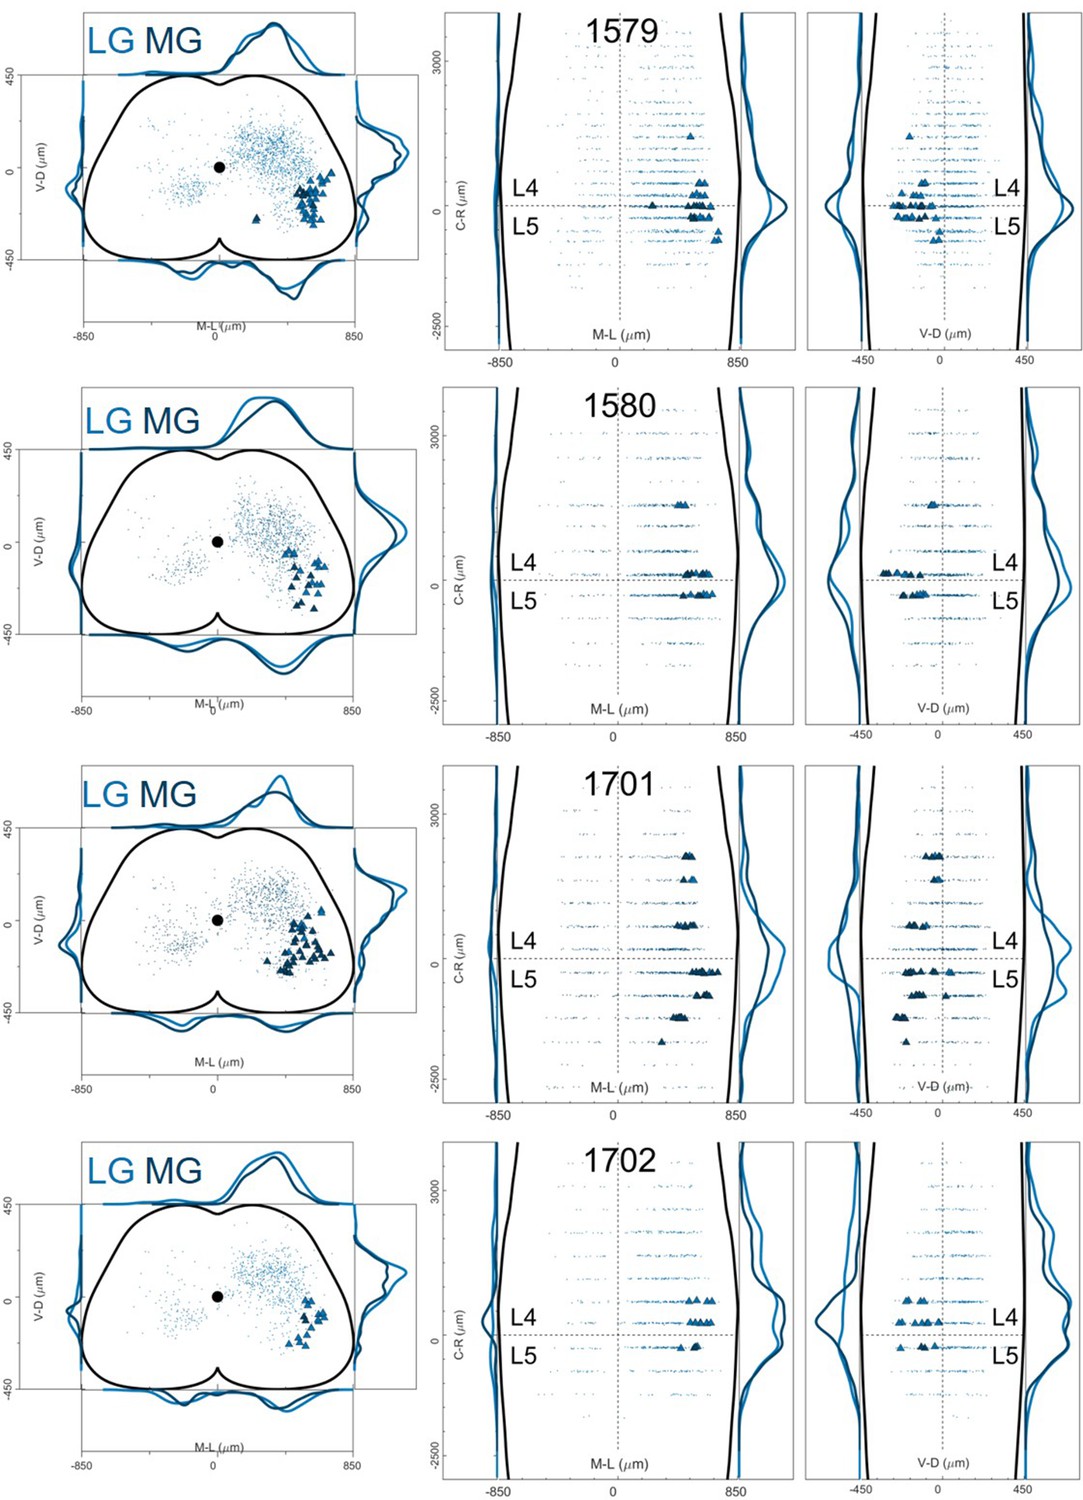
Distribution of motor neurons (triangles) and premotor interneurons (dots) of 4 LG (blue) and MG (yellow) double injections (UoG) of rabies virus in ChatCre/+; Rosa26RΦGT mice.
-
Figure 12—figure supplement 4—source data 1
Cartesian x-y-z coordinates of interneurons (sheet 1) and motor neurons (sheet 2) from LG injection 1579 (UoG).
The x-y coordinates are normalized (between –0.5 and 0.5) and scaled to an idealized spinal cord of dimensions 1700 μm and 900 μm in the mediolateral and dorsoventral directions respectively, while z coordinates are in micron, with the axis origin taken at the border between L4 and L5 and negative values in the rostral direction.
- https://cdn.elifesciences.org/articles/81976/elife-81976-fig12-figsupp4-data1-v3.xlsx
-
Figure 12—figure supplement 4—source data 2
Cartesian x-y-z coordinates of interneurons (sheet 1) and motor neurons (sheet 2) from LG injection 1580 (UoG).
- https://cdn.elifesciences.org/articles/81976/elife-81976-fig12-figsupp4-data2-v3.xlsx
-
Figure 12—figure supplement 4—source data 3
Cartesian x-y-z coordinates of interneurons (sheet 1) and motor neurons (sheet 2) from LG injection 1701(UoG).
- https://cdn.elifesciences.org/articles/81976/elife-81976-fig12-figsupp4-data3-v3.xlsx
-
Figure 12—figure supplement 4—source data 4
Cartesian x-y-z coordinates of interneurons (sheet 1) and motor neurons (sheet 2) from LG injection 1702 (UoG).
- https://cdn.elifesciences.org/articles/81976/elife-81976-fig12-figsupp4-data4-v3.xlsx
-
Figure 12—figure supplement 4—source data 5
Cartesian x-y-z coordinates of interneurons (sheet 1) and motor neurons (sheet 2) from MG injection 1579 (UoG).
- https://cdn.elifesciences.org/articles/81976/elife-81976-fig12-figsupp4-data5-v3.xlsx
-
Figure 12—figure supplement 4—source data 6
Cartesian x-y-z coordinates of interneurons (sheet 1) and motor neurons (sheet 2) from MG injection 1580 (UoG).
- https://cdn.elifesciences.org/articles/81976/elife-81976-fig12-figsupp4-data6-v3.xlsx
-
Figure 12—figure supplement 4—source data 7
Cartesian x-y-z coordinates of interneurons (sheet 1) and motor neurons (sheet 2) from MG injection 1701 (UoG).
- https://cdn.elifesciences.org/articles/81976/elife-81976-fig12-figsupp4-data7-v3.xlsx
-
Figure 12—figure supplement 4—source data 8
Cartesian x-y-z coordinates of interneurons (sheet 1) and motor neurons (sheet 2) from MG injection 1702 (UoG).
- https://cdn.elifesciences.org/articles/81976/elife-81976-fig12-figsupp4-data8-v3.xlsx
Figure 12—figure supplement 5
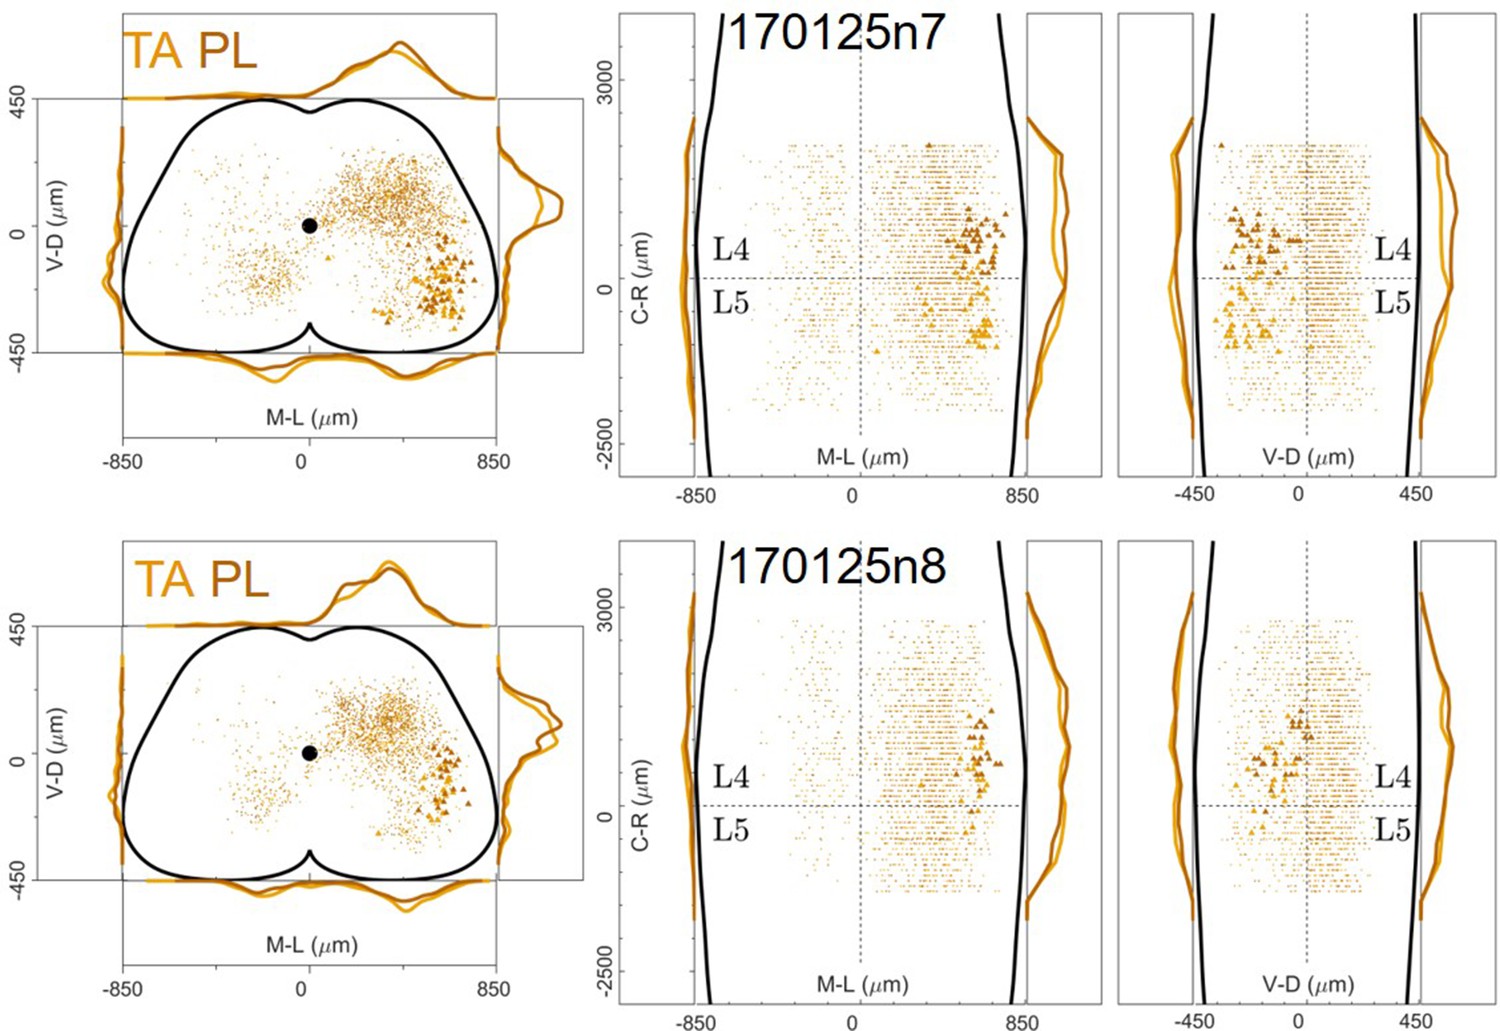
Distribution of motor neurons (triangles) and premotor interneurons (dots) of 2 TA (yellow) and PL (dark orange) double injections (UCL) of rabies virus in ChatCre/+; Rosa26RΦGT mice.
-
Figure 12—figure supplement 5—source data 1
Cartesian x-y-z coordinates of interneurons (sheet 1) and motor neurons (sheet 2) from PL injection 170125n7 (UCL).
The x-y coordinates are normalized (between –0.5 and 0.5) and scaled to an idealized spinal cord of dimensions 1700 μm and 900 μm in the mediolateral and dorsoventral directions respectively, while z coordinates are in micron, with the axis origin taken at the border between L4 and L5 and negative values in the rostral direction.
- https://cdn.elifesciences.org/articles/81976/elife-81976-fig12-figsupp5-data1-v3.xlsx
-
Figure 12—figure supplement 5—source data 2
Cartesian x-y-z coordinates of interneurons (sheet 1) and motor neurons (sheet 2) from PL injection 170125n8 (UCL).
- https://cdn.elifesciences.org/articles/81976/elife-81976-fig12-figsupp5-data2-v3.xlsx
-
Figure 12—figure supplement 5—source data 3
Cartesian x-y-z coordinates of interneurons (sheet 1) and motor neurons (sheet 2) from TA injection 170125n7 (UCL).
- https://cdn.elifesciences.org/articles/81976/elife-81976-fig12-figsupp5-data3-v3.xlsx
-
Figure 12—figure supplement 5—source data 4
Cartesian x-y-z coordinates of interneurons (sheet 1) and motor neurons (sheet 2) from TA injection 170125n8 (UCL).
- https://cdn.elifesciences.org/articles/81976/elife-81976-fig12-figsupp5-data4-v3.xlsx
Figure 12—figure supplement 6
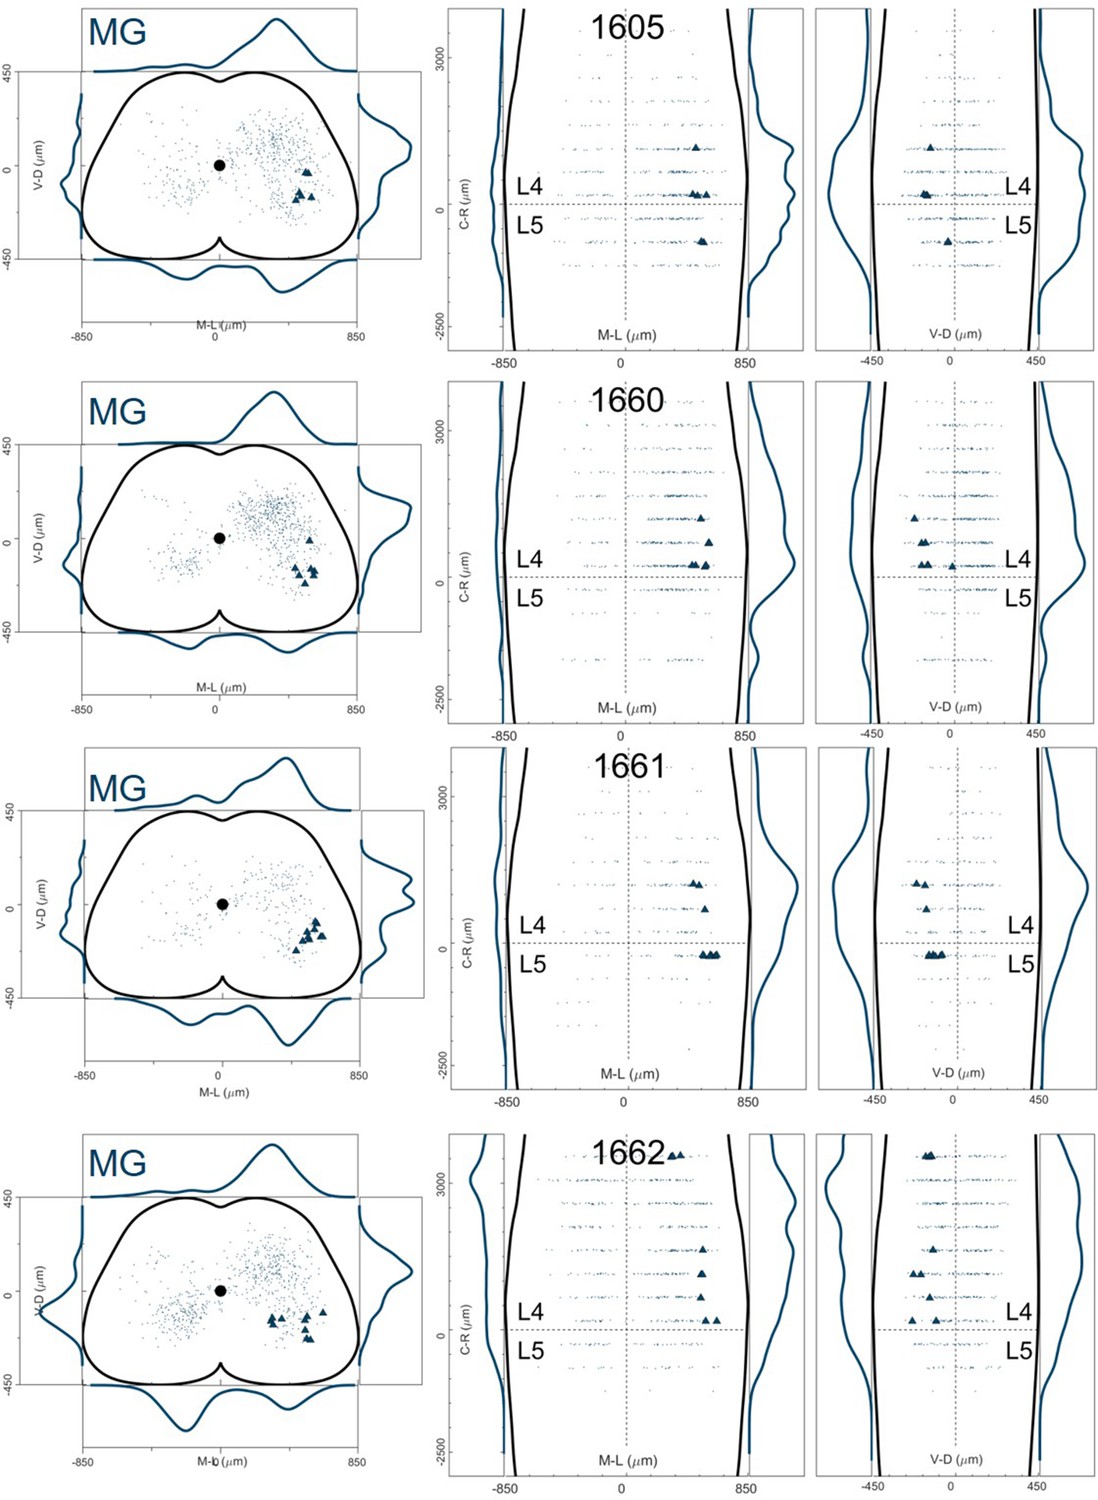
Distribution of motor neurons (triangles) and premotor interneurons (dots) of 4 MG (dark blue) single injections (UoG) of rabies virus in ChatCre/+; Rosa26RΦGT mice.
-
Figure 12—figure supplement 6—source data 1
Cartesian x-y-z coordinates of interneurons (sheet 1) and motor neurons (sheet 2) from MG injection 1605 (UoG).
The x-y coordinates are normalized (between –0.5 and 0.5) and scaled to an idealized spinal cord of dimensions 1700 μm and 900 μm in the mediolateral and dorsoventral directions respectively, while z coordinates are in micron, with the axis origin taken at the border between L4 and L5 and negative values in the rostral direction.
- https://cdn.elifesciences.org/articles/81976/elife-81976-fig12-figsupp6-data1-v3.xlsx
-
Figure 12—figure supplement 6—source data 2
Cartesian x-y-z coordinates of interneurons (sheet 1) and motor neurons (sheet 2) from MG injection 1660 (UoG).
- https://cdn.elifesciences.org/articles/81976/elife-81976-fig12-figsupp6-data2-v3.xlsx
-
Figure 12—figure supplement 6—source data 3
Cartesian x-y-z coordinates of interneurons (sheet 1) and motor neurons (sheet 2) from MG injection 1661 (UoG).
- https://cdn.elifesciences.org/articles/81976/elife-81976-fig12-figsupp6-data3-v3.xlsx
-
Figure 12—figure supplement 6—source data 4
Cartesian x-y-z coordinates of interneurons (sheet 1) and motor neurons (sheet 2) from MG injection 1662 (UoG).
- https://cdn.elifesciences.org/articles/81976/elife-81976-fig12-figsupp6-data4-v3.xlsx
Figure 12—figure supplement 7
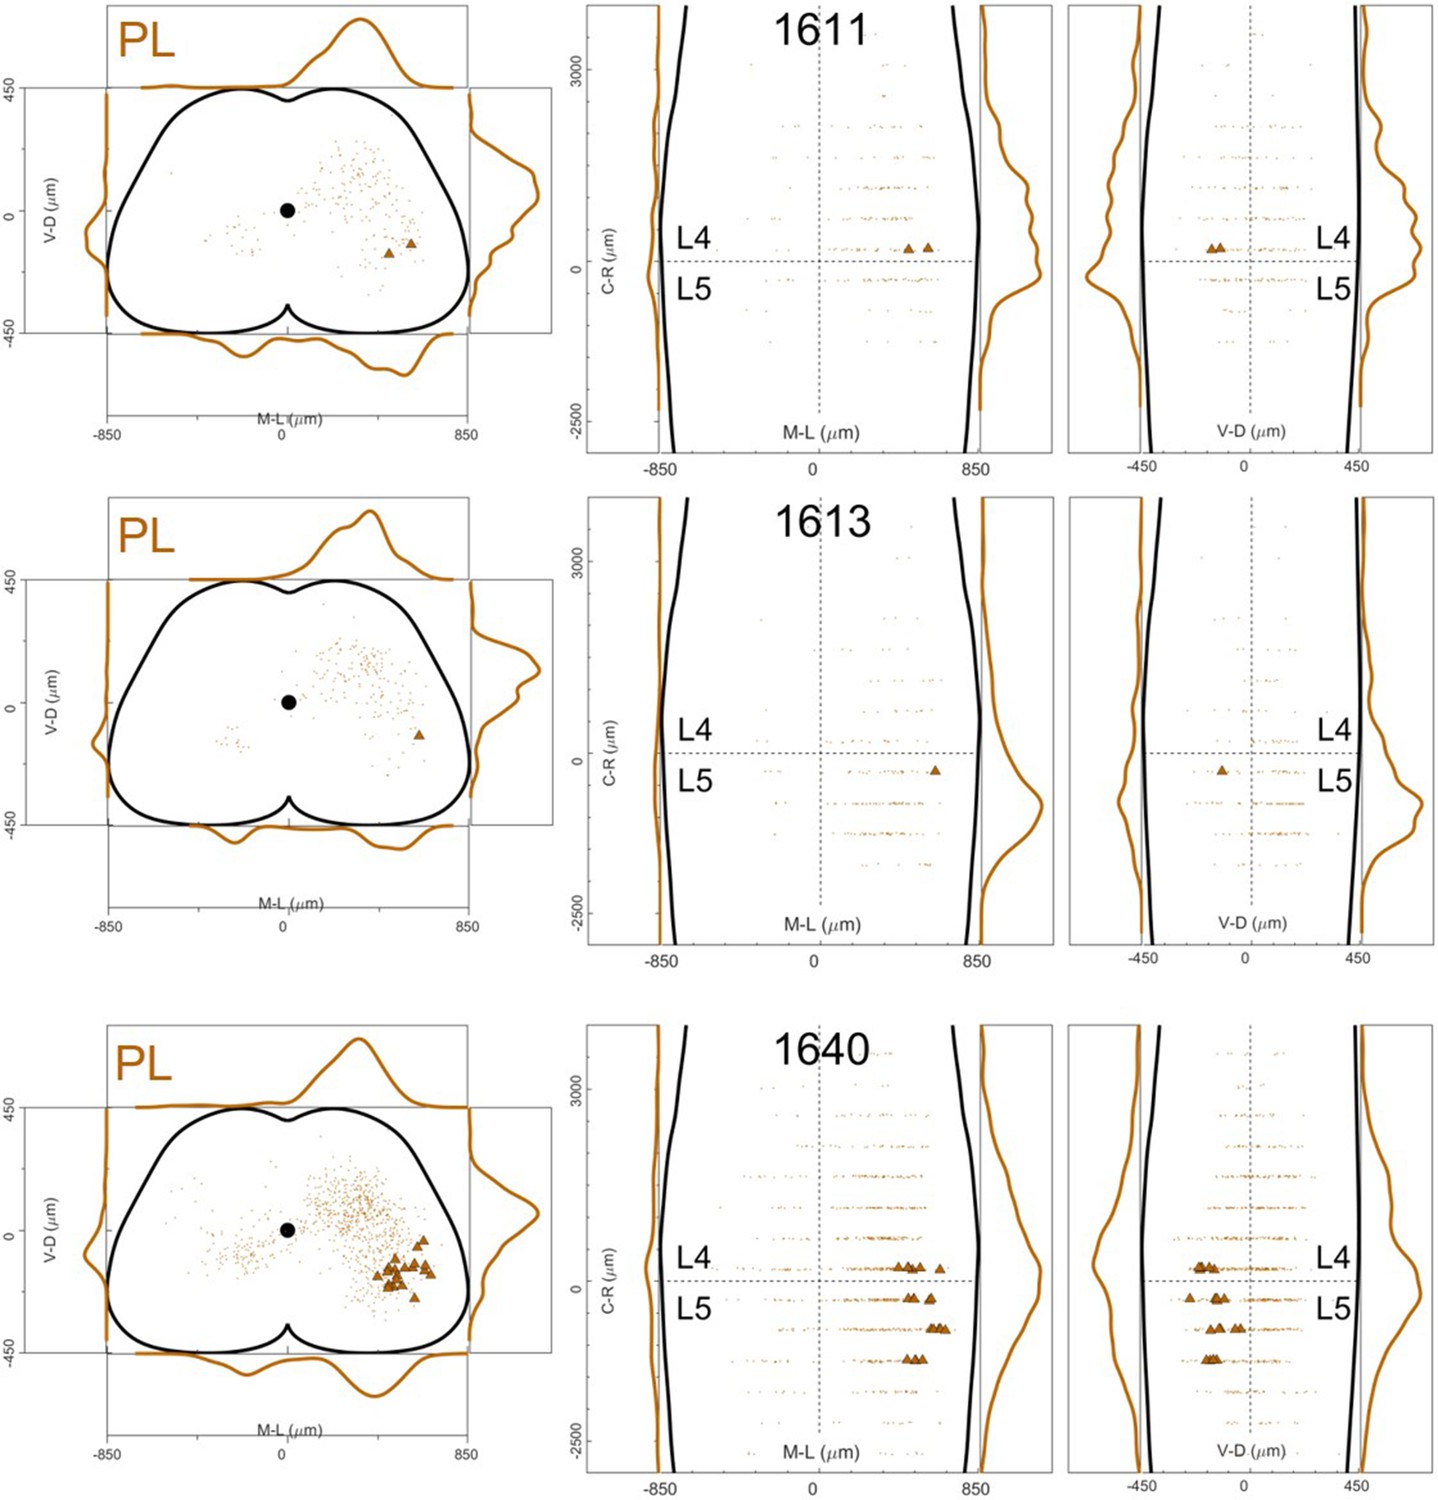
Distribution of motor neurons (triangles) and premotor interneurons (dots) of 3 PL (dark orange) single injections (UoG) of rabies virus in ChatCre/+; Rosa26RΦGT mice.
-
Figure 12—figure supplement 7—source data 1
Cartesian x-y-z coordinates of interneurons (sheet 1) and motor neurons (sheet 2) from PL injection 1611 (UoG).
The x-y coordinates are normalized (between –0.5 and 0.5) and scaled to an idealized spinal cord of dimensions 1700 μm and 900 μm in the mediolateral and dorsoventral directions respectively, while z coordinates are in micron, with the axis origin taken at the border between L4 and L5 and negative values in the rostral direction.
- https://cdn.elifesciences.org/articles/81976/elife-81976-fig12-figsupp7-data1-v3.xlsx
-
Figure 12—figure supplement 7—source data 2
Cartesian x-y-z coordinates of interneurons (sheet 1) and motor neurons (sheet 2) from PL injection 1613 (UoG).
- https://cdn.elifesciences.org/articles/81976/elife-81976-fig12-figsupp7-data2-v3.xlsx
-
Figure 12—figure supplement 7—source data 3
Cartesian x-y-z coordinates of interneurons (sheet 1) and motor neurons (sheet 2) from PL injection 1640 (UoG).
- https://cdn.elifesciences.org/articles/81976/elife-81976-fig12-figsupp7-data3-v3.xlsx
Figure 12—figure supplement 8
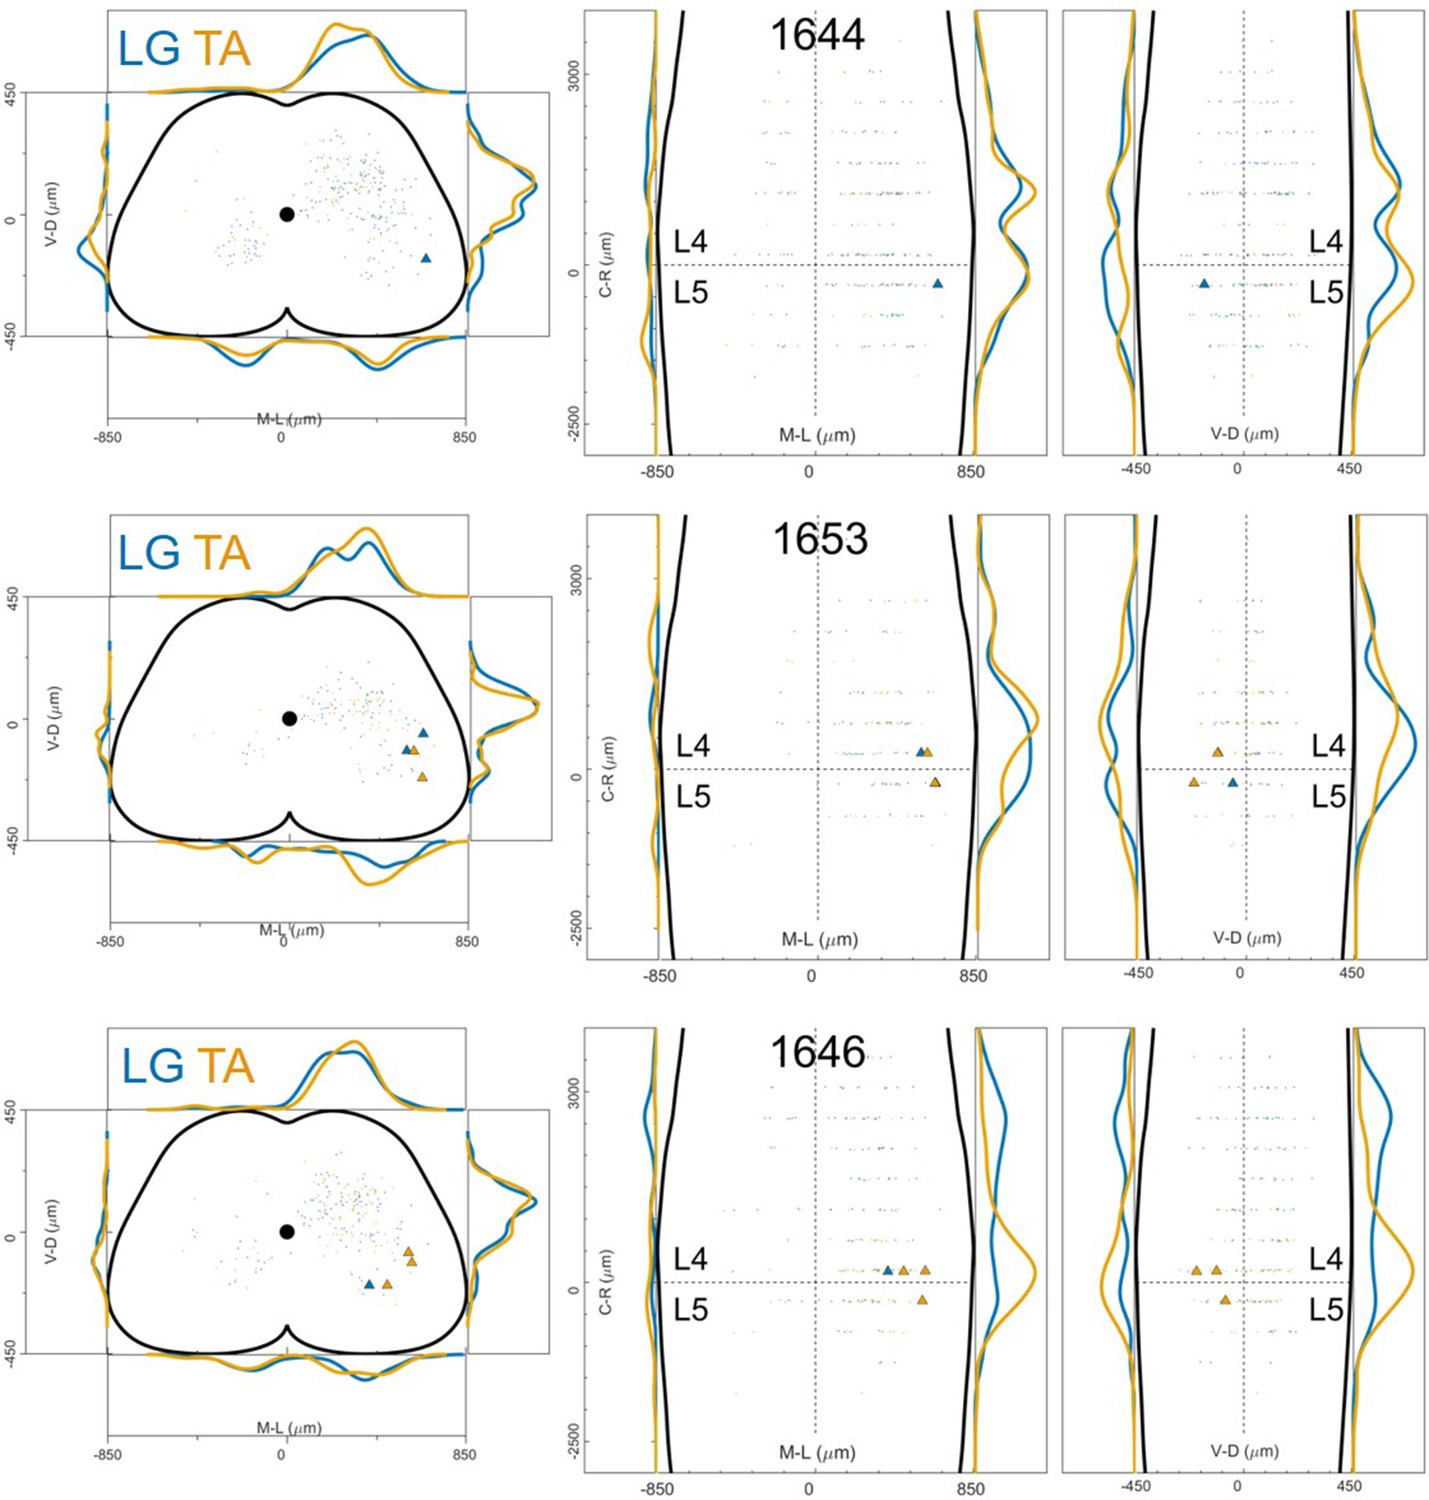
Distribution of motor neurons (triangles) and premotor interneurons (dots) of 3 LG (blue) and TA (yellow) double injections with low titre rabies virus in ChatCre/+; Rosa26RΦGT mice (UoG).
-
Figure 12—figure supplement 8—source data 1
Cartesian x-y-z coordinates of interneurons (sheet 1) and motor neurons (sheet 2) from LG injection 1644 (UoG).
The x-y coordinates are normalized (between –0.5 and 0.5) and scaled to an idealized spinal cord of dimensions 1700 μm and 900 μm in the mediolateral and dorsoventral directions respectively, while z coordinates are in micron, with the axis origin taken at the border between L4 and L5 and negative values in the rostral direction.
- https://cdn.elifesciences.org/articles/81976/elife-81976-fig12-figsupp8-data1-v3.xlsx
-
Figure 12—figure supplement 8—source data 2
Cartesian x-y-z coordinates of interneurons (sheet 1) and motor neurons (sheet 2) from LG injection 1646 (UoG).
- https://cdn.elifesciences.org/articles/81976/elife-81976-fig12-figsupp8-data2-v3.xlsx
-
Figure 12—figure supplement 8—source data 3
Cartesian x-y-z coordinates of interneurons (sheet 1) and motor neurons (sheet 2) from LG injection 1653 (UoG).
- https://cdn.elifesciences.org/articles/81976/elife-81976-fig12-figsupp8-data3-v3.xlsx
-
Figure 12—figure supplement 8—source data 4
Cartesian x-y-z coordinates of interneurons (sheet 1) and motor neurons (sheet 2) from TA injection 1644 (UoG).
- https://cdn.elifesciences.org/articles/81976/elife-81976-fig12-figsupp8-data4-v3.xlsx
-
Figure 12—figure supplement 8—source data 5
Cartesian x-y-z coordinates of interneurons (sheet 1) and motor neurons (sheet 2) from TA injection 1646 (UoG).
- https://cdn.elifesciences.org/articles/81976/elife-81976-fig12-figsupp8-data5-v3.xlsx
-
Figure 12—figure supplement 8—source data 6
Cartesian x-y-z coordinates of interneurons (sheet 1) and motor neurons (sheet 2) from TA injection 1653 (UoG).
- https://cdn.elifesciences.org/articles/81976/elife-81976-fig12-figsupp8-data6-v3.xlsx
Figure 12—figure supplement 9
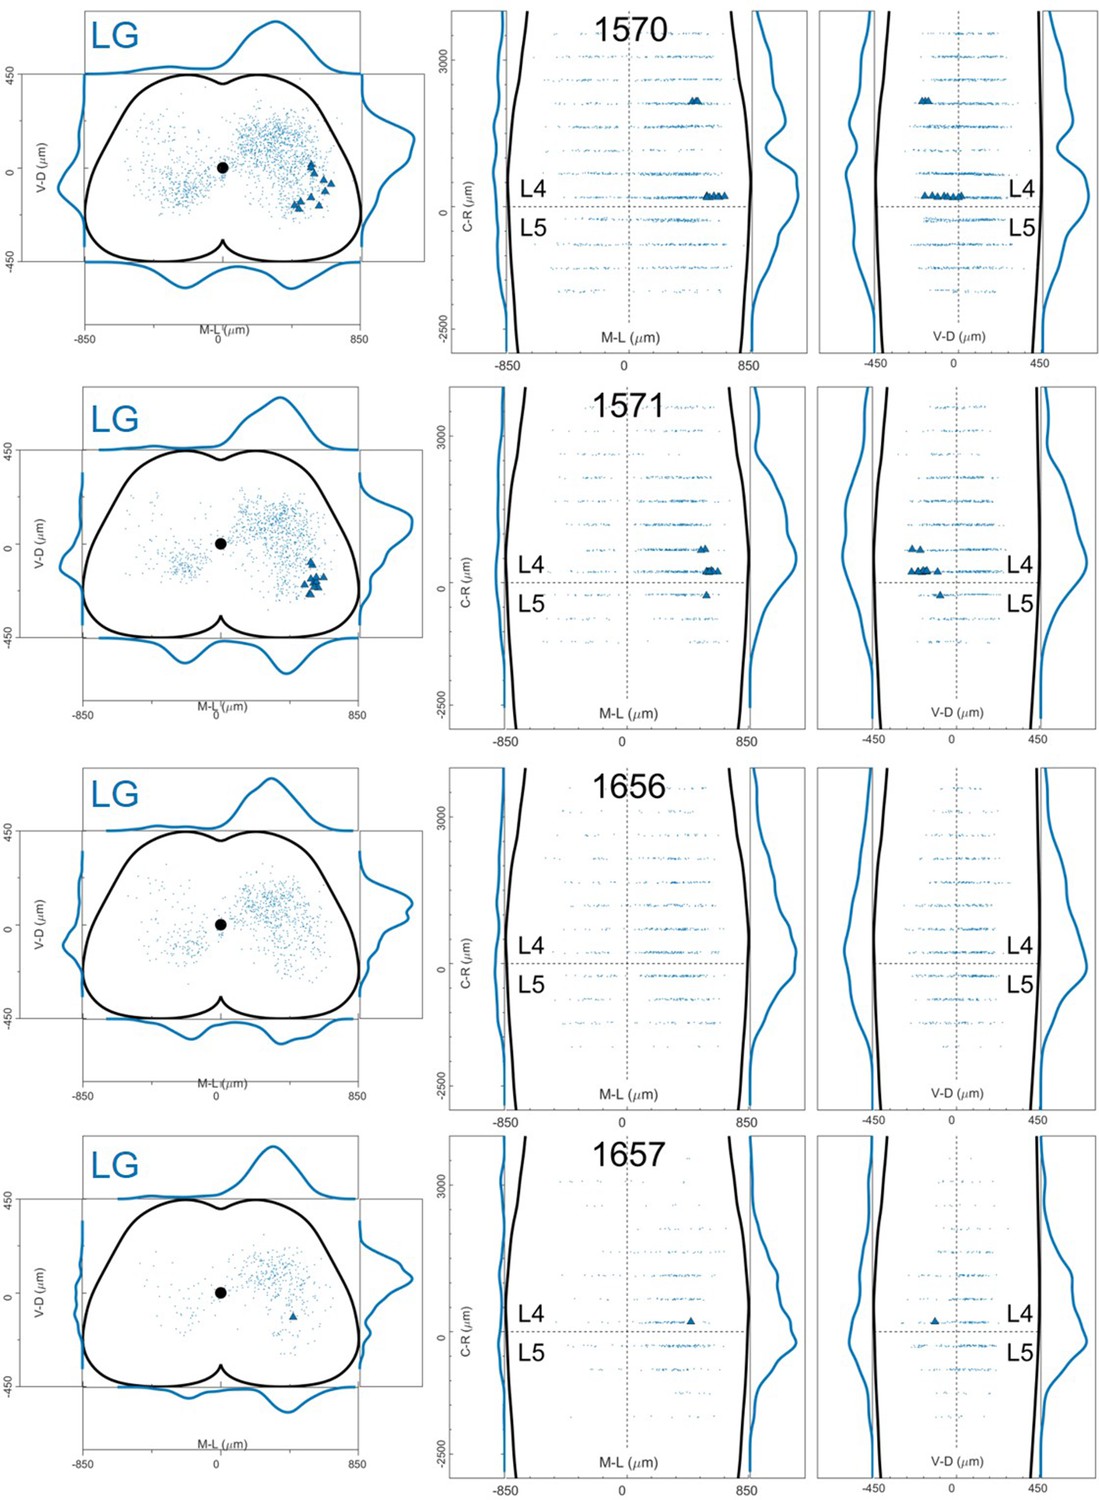
Distribution of motor neurons (triangles) and premotor interneurons (dots) of 4 LG (blue) single injections with low titre rabies virus in ChatCre/+; Rosa26RΦGT mice (UoG).
-
Figure 12—figure supplement 9—source data 1
Cartesian x-y-z coordinates of interneurons (sheet 1) and motor neurons (sheet 2) from LG injection 1656 (UoG).
The x-y coordinates are normalized (between –0.5 and 0.5) and scaled to an idealized spinal cord of dimensions 1700 μm and 900 μm in the mediolateral and dorsoventral directions respectively, while z coordinates are in micron, with the axis origin taken at the border between L4 and L5 and negative values in the rostral direction.
- https://cdn.elifesciences.org/articles/81976/elife-81976-fig12-figsupp9-data1-v3.xlsx
-
Figure 12—figure supplement 9—source data 2
Cartesian x-y-z coordinates of interneurons (sheet 1) and motor neurons (sheet 2) from LG injection 1657 (UoG).
- https://cdn.elifesciences.org/articles/81976/elife-81976-fig12-figsupp9-data2-v3.xlsx
-
Figure 12—figure supplement 9—source data 3
Cartesian x-y-z coordinates of interneurons (sheet 1) and motor neurons (sheet 2) from LG injection 1570 (UoG).
- https://cdn.elifesciences.org/articles/81976/elife-81976-fig12-figsupp9-data3-v3.xlsx
-
Figure 12—figure supplement 9—source data 4
Cartesian x-y-z coordinates of interneurons (sheet 1) and motor neurons (sheet 2) from LG injection 1571 (UoG).
- https://cdn.elifesciences.org/articles/81976/elife-81976-fig12-figsupp9-data4-v3.xlsx
Figure 12—figure supplement 10
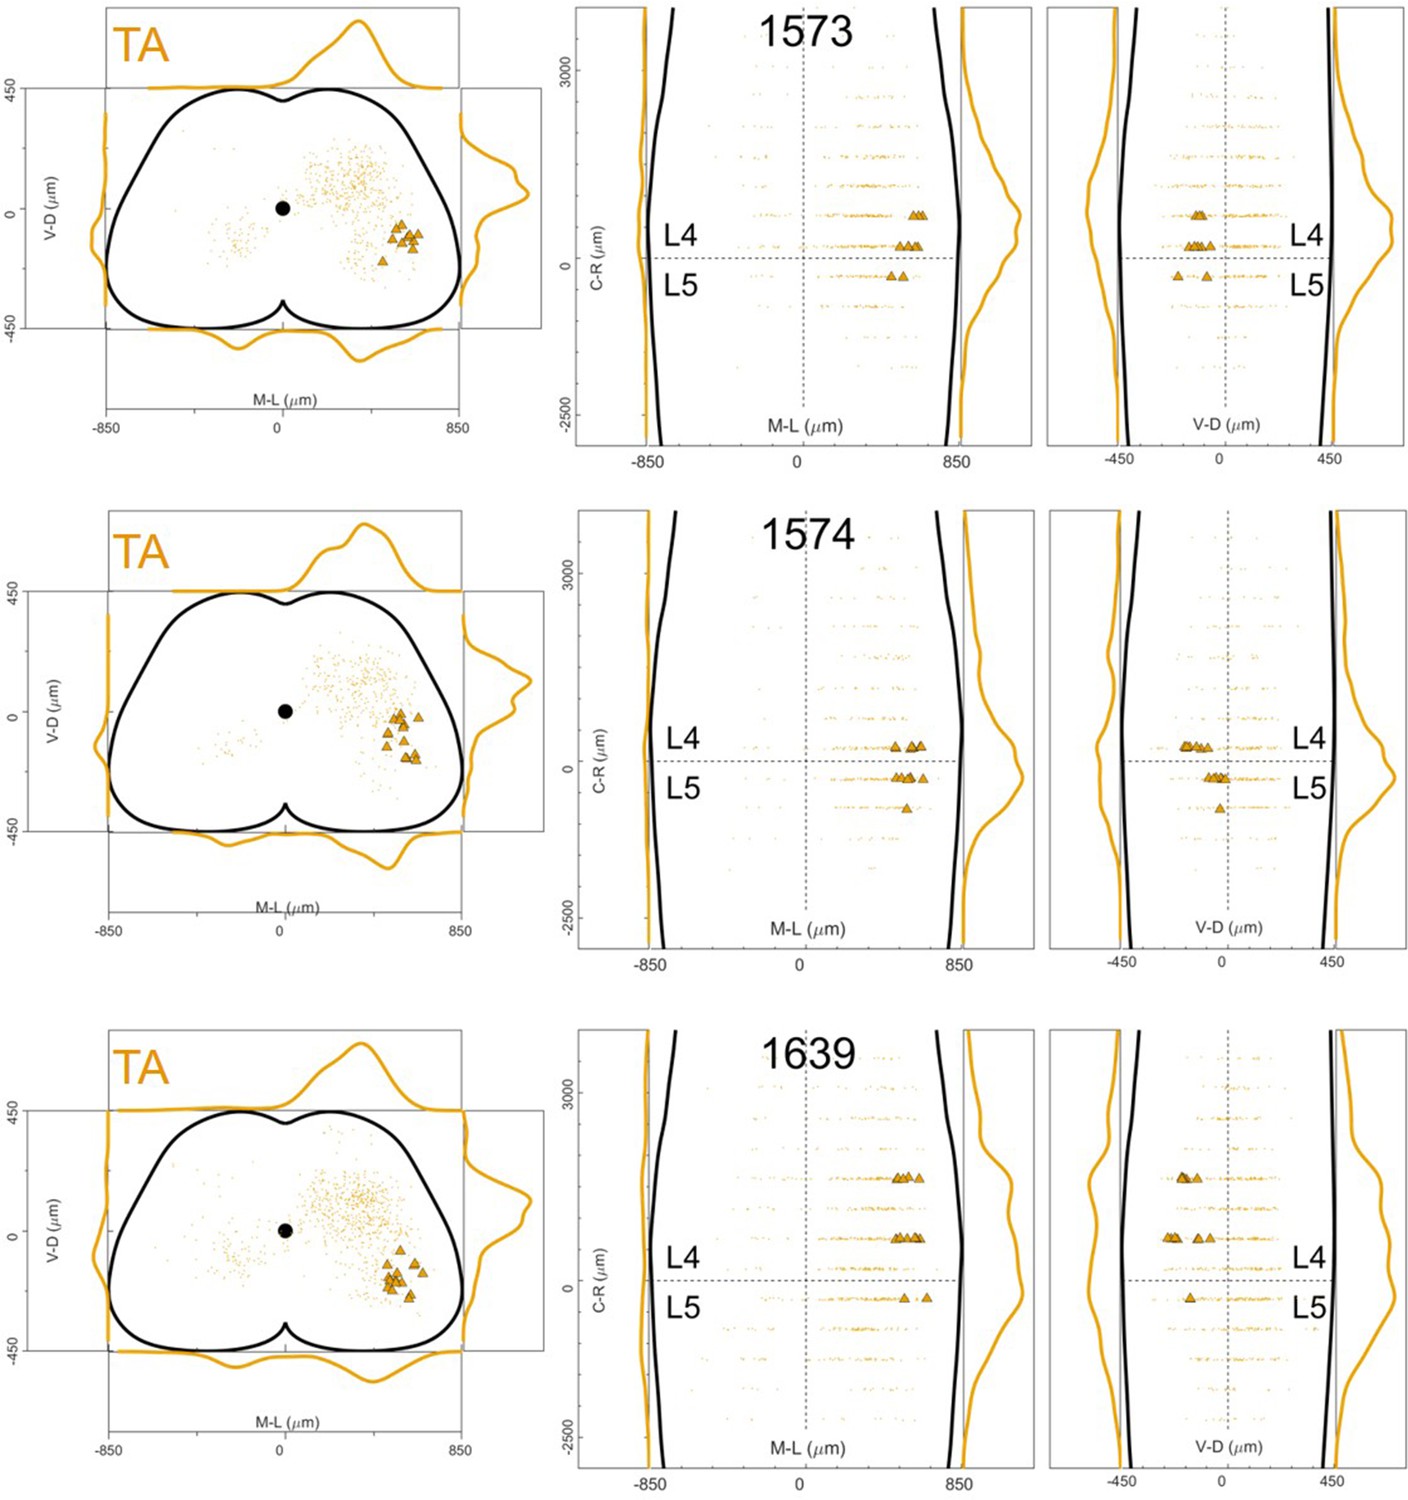
Distribution of motor neurons (triangles) and premotor interneurons (dots) of 3 TA (yellow) single injections with low titre rabies virus in ChatCre/+; Rosa26RΦGT mice (UoG).
-
Figure 12—figure supplement 10—source data 1
Cartesian x-y-z coordinates of interneurons (sheet 1) and motor neurons (sheet 2) from TA injection 1573 (UoG).
The x-y coordinates are normalized (between –0.5 and 0.5) and scaled to an idealized spinal cord of dimensions 1700 μm and 900 μm in the mediolateral and dorsoventral directions respectively, while z coordinates are in micron, with the axis origin taken at the border between L4 and L5 and negative values in the rostral direction.
- https://cdn.elifesciences.org/articles/81976/elife-81976-fig12-figsupp10-data1-v3.xlsx
-
Figure 12—figure supplement 10—source data 2
Cartesian x-y-z coordinates of interneurons (sheet 1) and motor neurons (sheet 2) from TA injection 1574 (UoG).
- https://cdn.elifesciences.org/articles/81976/elife-81976-fig12-figsupp10-data2-v3.xlsx
-
Figure 12—figure supplement 10—source data 3
Cartesian x-y-z coordinates of interneurons (sheet 1) and motor neurons (sheet 2) from TA injection 1639 (UoG).
- https://cdn.elifesciences.org/articles/81976/elife-81976-fig12-figsupp10-data3-v3.xlsx
Figure 12—figure supplement 11
Distribution of motor neurons (triangles) and premotor interneurons (dots) of 4 GS (blue) single injections with rabies virus in Olig2Cre/+; Rosa26RΦGT mice (MDC).
-
Figure 12—figure supplement 11—source data 1
Cartesian x-y-z coordinates of interneurons (sheet 1) and motor neurons (sheet 2) from GS injection 353 (MDC).
The x-y coordinates are normalized (between –0.5 and 0.5) and scaled to an idealized spinal cord of dimensions 1700 μm and 900 μm in the mediolateral and dorsoventral directions respectively, while z coordinates are in micron, with the axis origin taken at the border between L4 and L5 and negative values in the rostral direction.
- https://cdn.elifesciences.org/articles/81976/elife-81976-fig12-figsupp11-data1-v3.xlsx
-
Figure 12—figure supplement 11—source data 2
Cartesian x-y-z coordinates of interneurons (sheet 1) and motor neurons (sheet 2) from GS injection 399 (MDC).
- https://cdn.elifesciences.org/articles/81976/elife-81976-fig12-figsupp11-data2-v3.xlsx
-
Figure 12—figure supplement 11—source data 3
Cartesian x-y-z coordinates of interneurons (sheet 1) and motor neurons (sheet 2) from GS injection 1332 (MDC).
- https://cdn.elifesciences.org/articles/81976/elife-81976-fig12-figsupp11-data3-v3.xlsx
-
Figure 12—figure supplement 11—source data 4
Cartesian x-y-z coordinates of interneurons (sheet 1) and motor neurons (sheet 2) from GS injection 1349 (MDC).
- https://cdn.elifesciences.org/articles/81976/elife-81976-fig12-figsupp11-data4-v3.xlsx
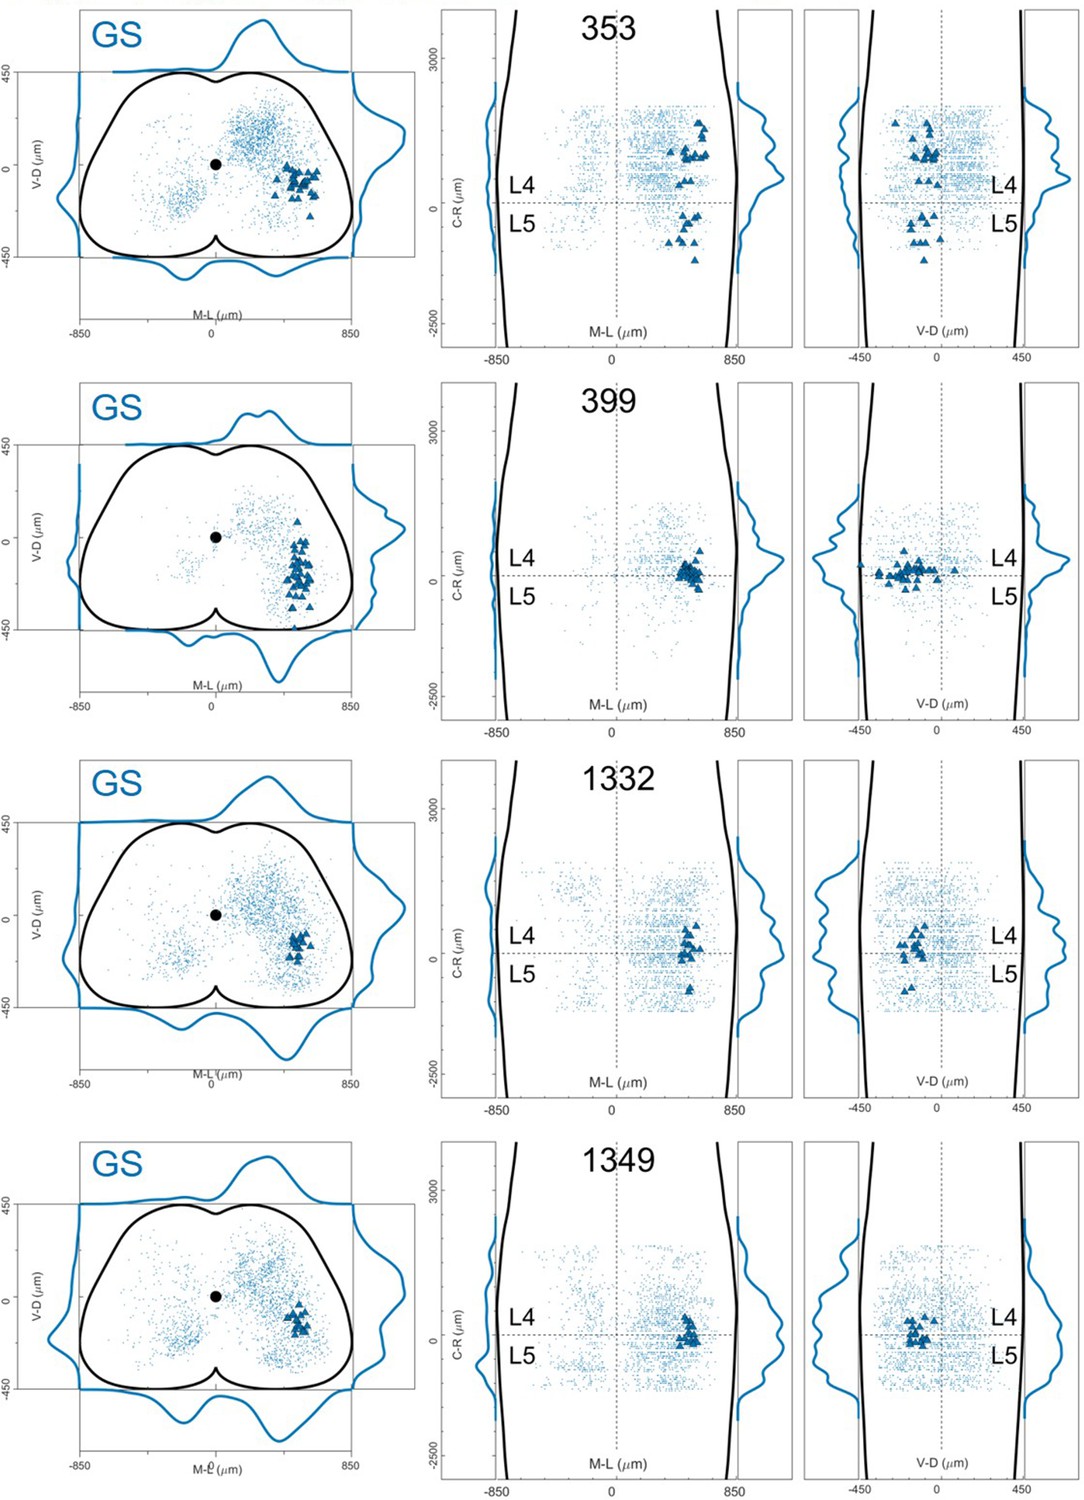
Figure 12—figure supplement 12
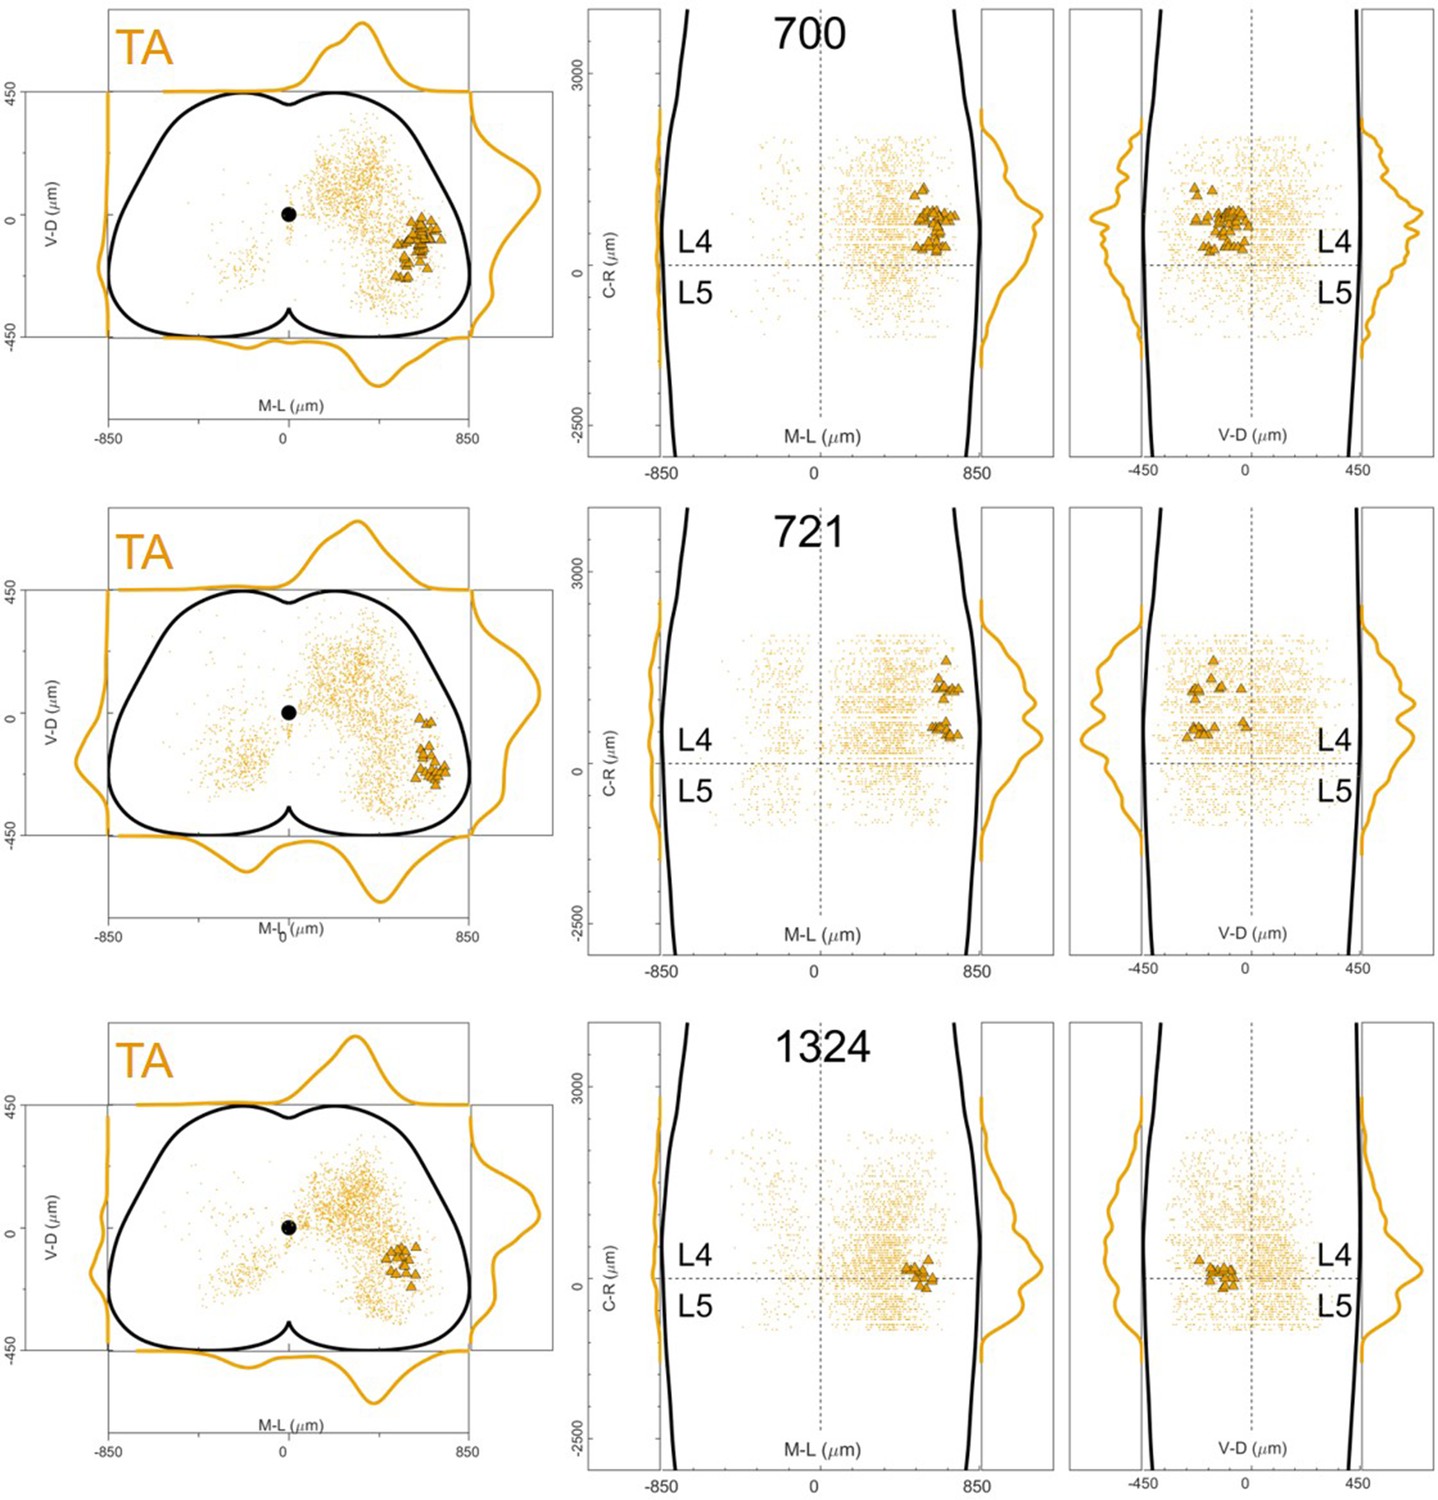
Distribution of motor neurons (triangles) and premotor interneurons (dots) of 3 TA (yellow) single injections with rabies virus in Olig2Cre/+; Rosa26RΦGT mice (MDC).
-
Figure 12—figure supplement 12—source data 1
Cartesian x-y-z coordinates of interneurons (sheet 1) and motor neurons (sheet 2) from TA injection 700 (MDC).
The x-y coordinates are normalized (between –0.5 and 0.5) and scaled to an idealized spinal cord of dimensions 1700 μm and 900 μm in the mediolateral and dorsoventral directions respectively, while z coordinates are in micron, with the axis origin taken at the border between L4 and L5 and negative values in the rostral direction.
- https://cdn.elifesciences.org/articles/81976/elife-81976-fig12-figsupp12-data1-v3.xlsx
-
Figure 12—figure supplement 12—source data 2
Cartesian x-y-z coordinates of interneurons (sheet 1) and motor neurons (sheet 2) from TA injection 721 (MDC).
- https://cdn.elifesciences.org/articles/81976/elife-81976-fig12-figsupp12-data2-v3.xlsx
-
Figure 12—figure supplement 12—source data 3
Cartesian x-y-z coordinates of interneurons (sheet 1) and motor neurons (sheet 2) from TA injection 1324 (MDC).
- https://cdn.elifesciences.org/articles/81976/elife-81976-fig12-figsupp12-data3-v3.xlsx
Figure 12—figure supplement 13
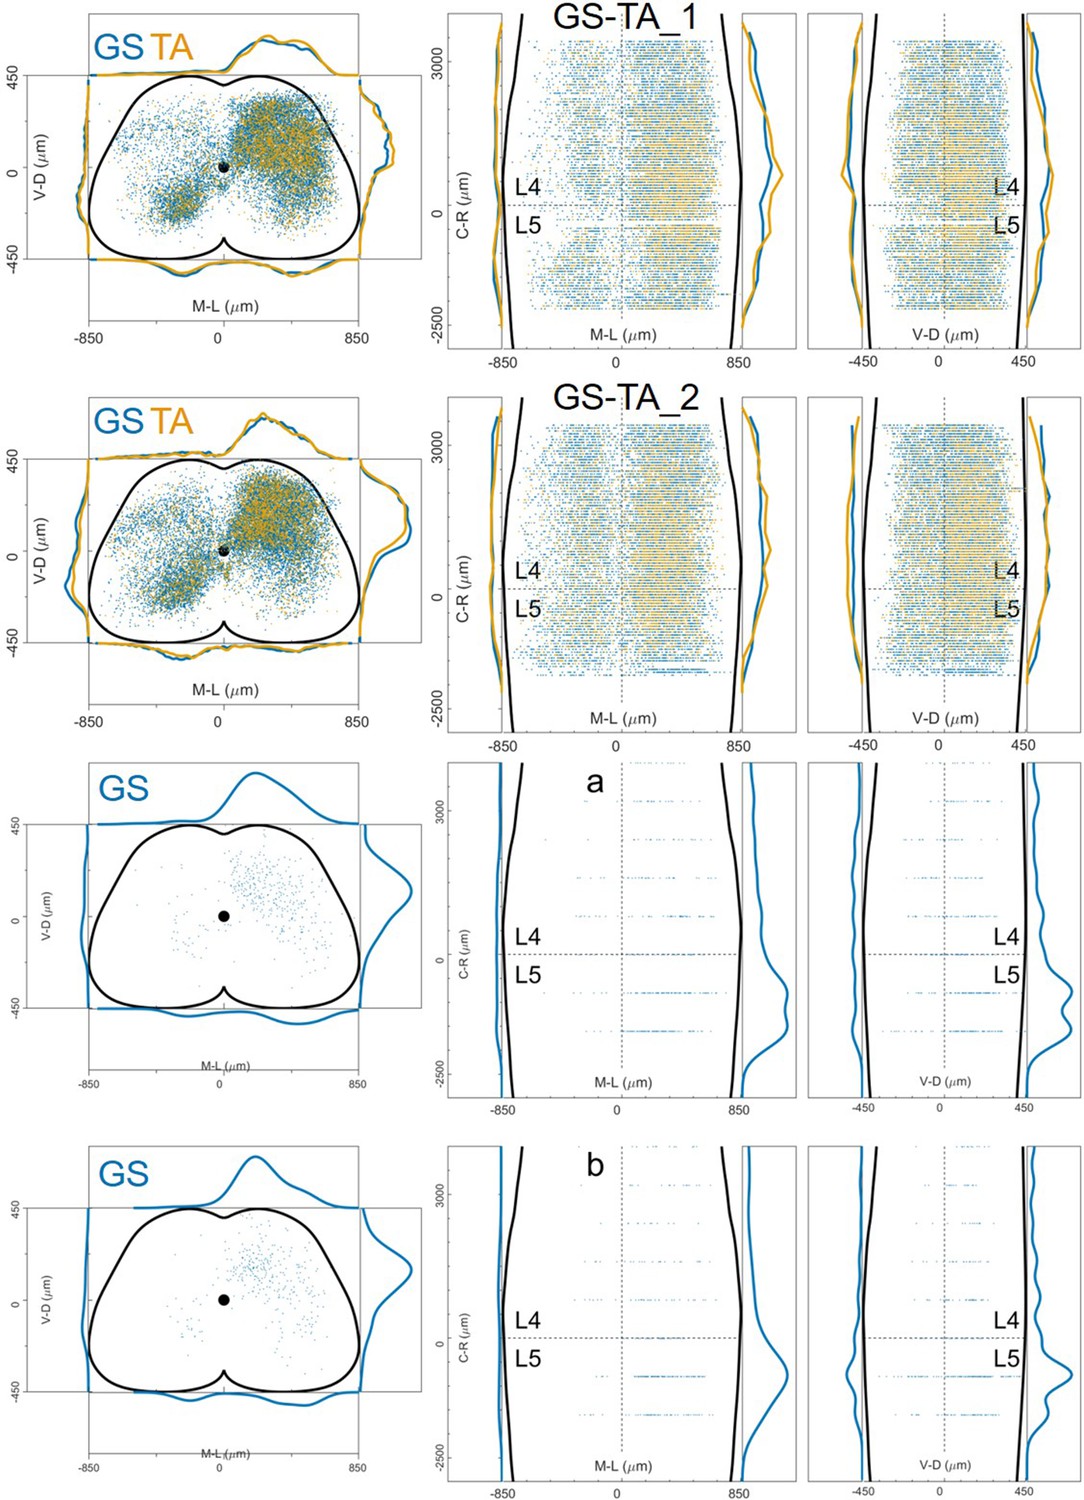
Distribution of infected neurons (primary infected motor neurons or secondary infected interneurons are not distinguished) of 2 GS (blue) and TA (yellow) double injections and 2 GS single injections of rabies and AAV-Ef1a-B19G in wild-type mice (Salk).
-
Figure 12—figure supplement 13—source data 1
Cartesian x-y-z coordinates of infected neurons from GS injection 1 (Salk).
The x-y coordinates are normalized (between –0.5 and 0.5) and scaled to an idealized spinal cord of dimensions 1700 μm and 900 μm in the mediolateral and dorsoventral directions respectively, while z coordinates are in micron, with the axis origin taken at the border between L4 and L5 and negative values in the rostral direction.
- https://cdn.elifesciences.org/articles/81976/elife-81976-fig12-figsupp13-data1-v3.xlsx
-
Figure 12—figure supplement 13—source data 2
Cartesian x-y-z coordinates of infected neurons from GS injection 2 (Salk).
- https://cdn.elifesciences.org/articles/81976/elife-81976-fig12-figsupp13-data2-v3.xlsx
-
Figure 12—figure supplement 13—source data 3
Cartesian x-y-z coordinates of infected neurons from GS injection a (Salk).
- https://cdn.elifesciences.org/articles/81976/elife-81976-fig12-figsupp13-data3-v3.xlsx
-
Figure 12—figure supplement 13—source data 4
Cartesian x-y-z coordinates of infected neurons from GS injection b (Salk).
- https://cdn.elifesciences.org/articles/81976/elife-81976-fig12-figsupp13-data4-v3.xlsx
-
Figure 12—figure supplement 13—source data 5
Cartesian x-y-z coordinates of infected neurons from TA injection 1 (Salk).
- https://cdn.elifesciences.org/articles/81976/elife-81976-fig12-figsupp13-data5-v3.xlsx
-
Figure 12—figure supplement 13—source data 6
Cartesian x-y-z coordinates of infected neurons from TA injection 2 (Salk).
- https://cdn.elifesciences.org/articles/81976/elife-81976-fig12-figsupp13-data6-v3.xlsx
Figure 12—figure supplement 14
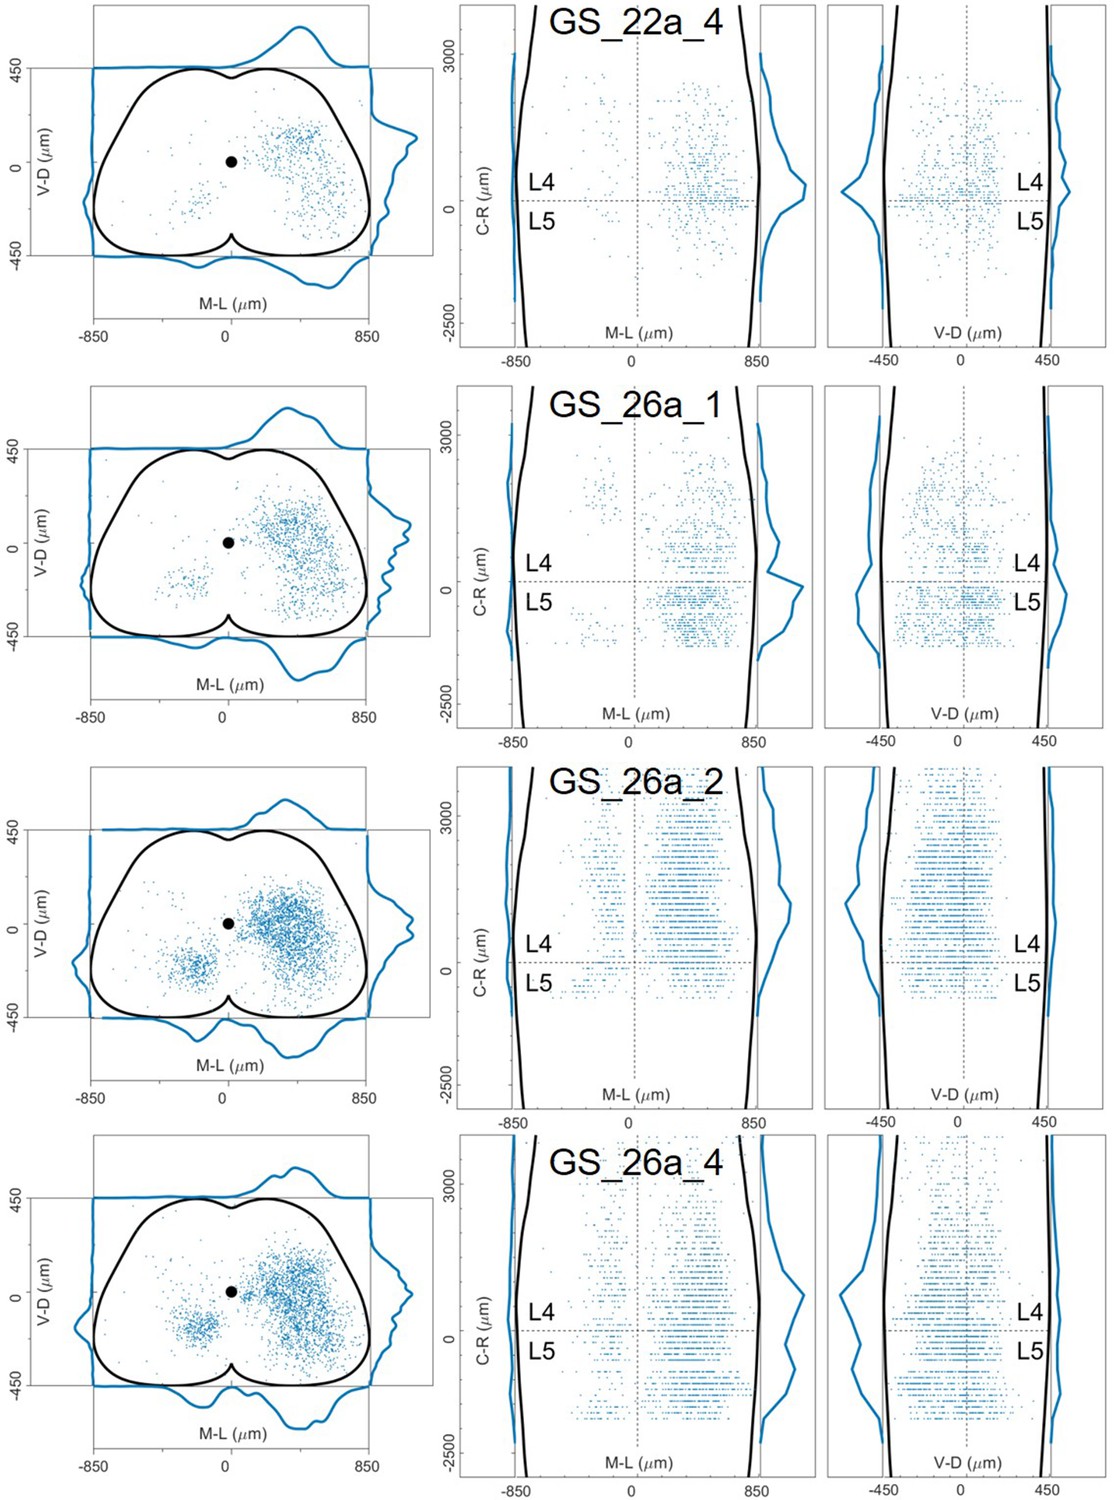
Distribution of infected neurons (primary infected motor neurons or secondary infected interneurons are not distinguished) of 4 GS (blue) single injections of rabies and AAV-CAG-Flex-oG in ChatCre/+ mice (Salk).
-
Figure 12—figure supplement 14—source data 1
Cartesian x-y-z coordinates of infected neurons from GS injection 22a_4 (Salk).
The x-y coordinates are normalized (between –0.5 and 0.5) and scaled to an idealized spinal cord of dimensions 1700 μm and 900 μm in the mediolateral and dorsoventral directions respectively, while z coordinates are in micron, with the axis origin taken at the border between L4 and L5 and negative values in the rostral direction.
- https://cdn.elifesciences.org/articles/81976/elife-81976-fig12-figsupp14-data1-v3.xlsx
-
Figure 12—figure supplement 14—source data 2
Cartesian x-y-z coordinates of infected neurons from GS injection 26a_1 (Salk).
- https://cdn.elifesciences.org/articles/81976/elife-81976-fig12-figsupp14-data2-v3.xlsx
-
Figure 12—figure supplement 14—source data 3
Cartesian x-y-z coordinates of infected neurons from GS injection 26a_2 (Salk).
- https://cdn.elifesciences.org/articles/81976/elife-81976-fig12-figsupp14-data3-v3.xlsx
-
Figure 12—figure supplement 14—source data 4
Cartesian x-y-z coordinates of infected neurons from GS injection 26a_4 (Salk).
- https://cdn.elifesciences.org/articles/81976/elife-81976-fig12-figsupp14-data4-v3.xlsx
Figure 12—figure supplement 15
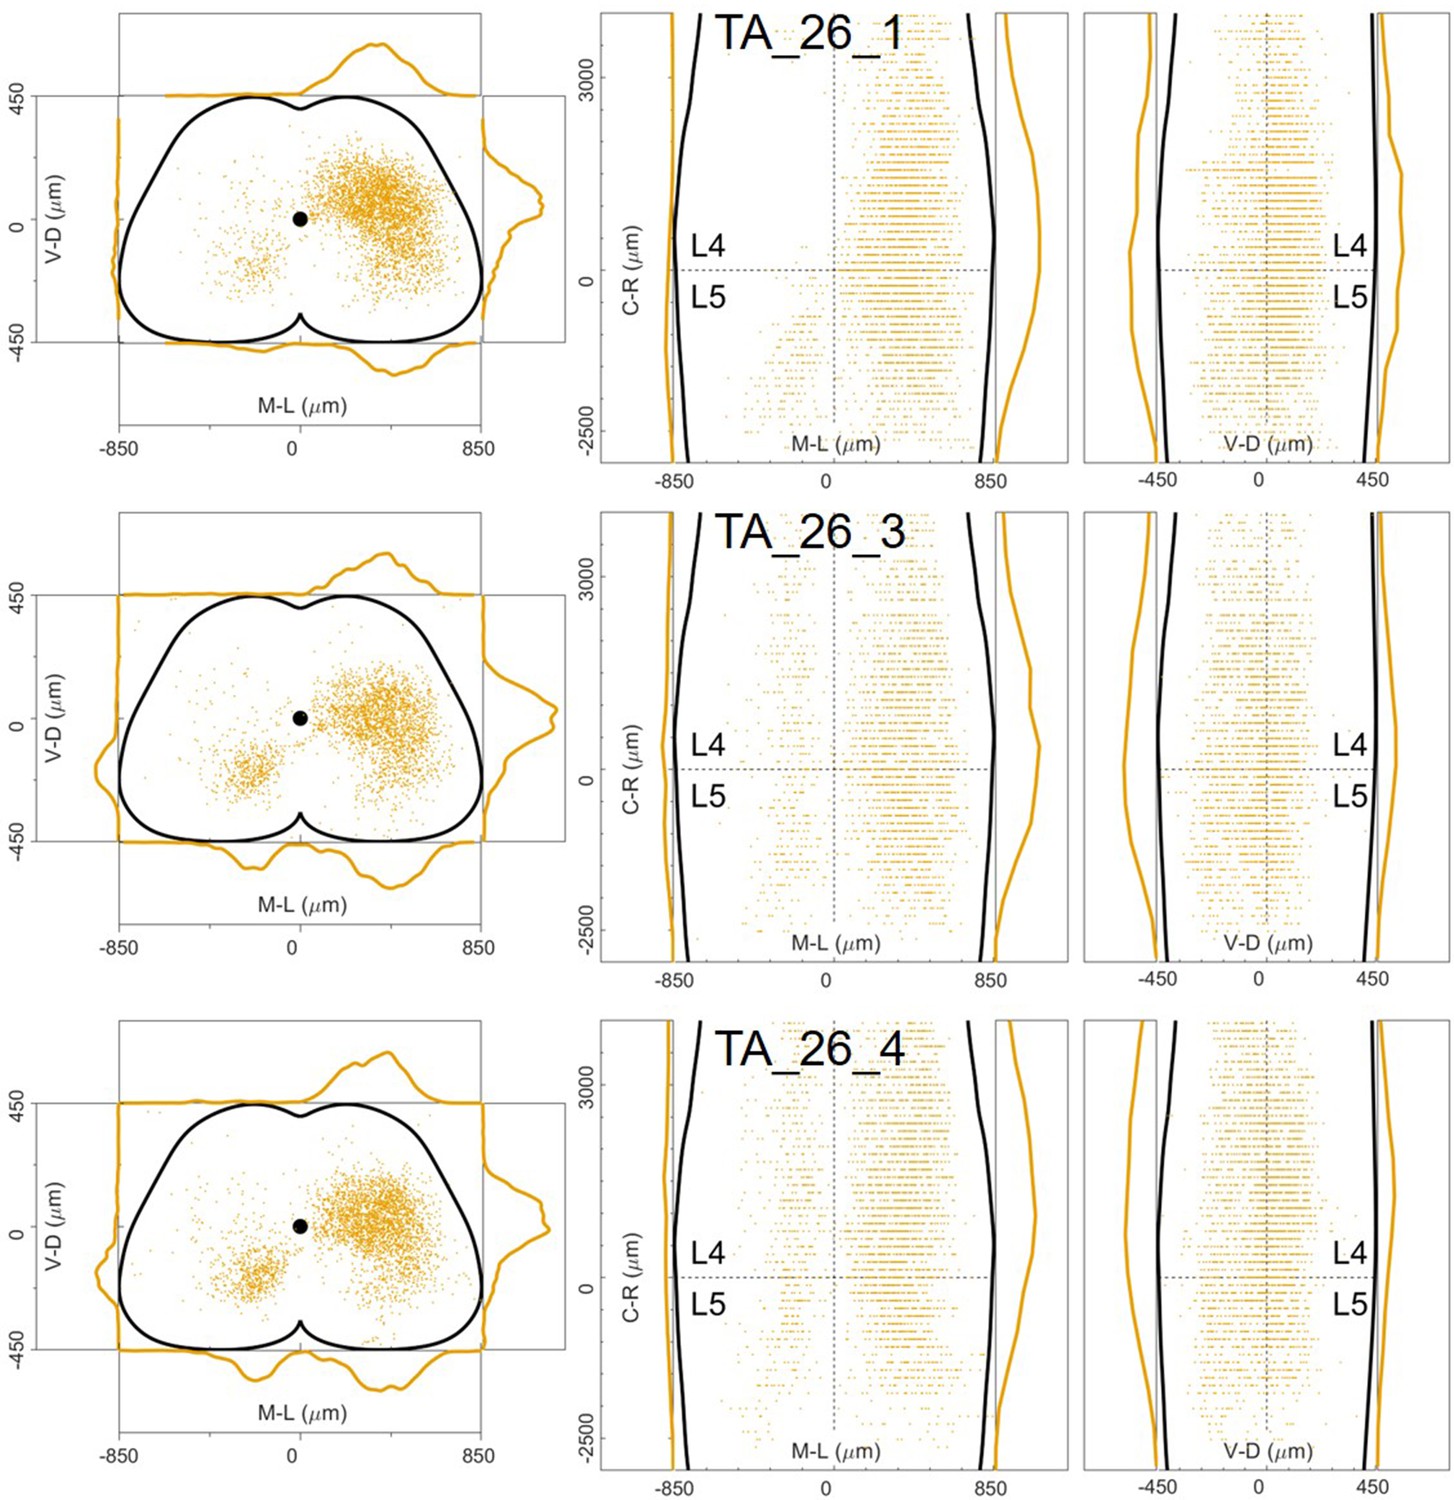
Distribution of infected neurons (primary infected motor neurons or secondary infected interneurons are not distinguished) of 3 TA (yellow) single injections of rabies and AAV-CAG-Flex-oG in ChatCre/+ mice (Salk).
-
Figure 12—figure supplement 15—source data 1
Cartesian x-y-z coordinates of infected neurons from TA injection 26_1 (Salk).
The x-y coordinates are normalized (between –0.5 and 0.5) and scaled to an idealized spinal cord of dimensions 1700 μm and 900 μm in the mediolateral and dorsoventral directions respectively, while z coordinates are in micron, with the axis origin taken at the border between L4 and L5 and negative values in the rostral direction.
- https://cdn.elifesciences.org/articles/81976/elife-81976-fig12-figsupp15-data1-v3.xlsx
-
Figure 12—figure supplement 15—source data 2
Cartesian x-y-z coordinates of infected neurons from TA injection 26_3 (Salk).
- https://cdn.elifesciences.org/articles/81976/elife-81976-fig12-figsupp15-data2-v3.xlsx
-
Figure 12—figure supplement 15—source data 3
Cartesian x-y-z coordinates of infected neurons from TA injection 26_4 (Salk).
- https://cdn.elifesciences.org/articles/81976/elife-81976-fig12-figsupp15-data3-v3.xlsx
Figure 12—figure supplement 16
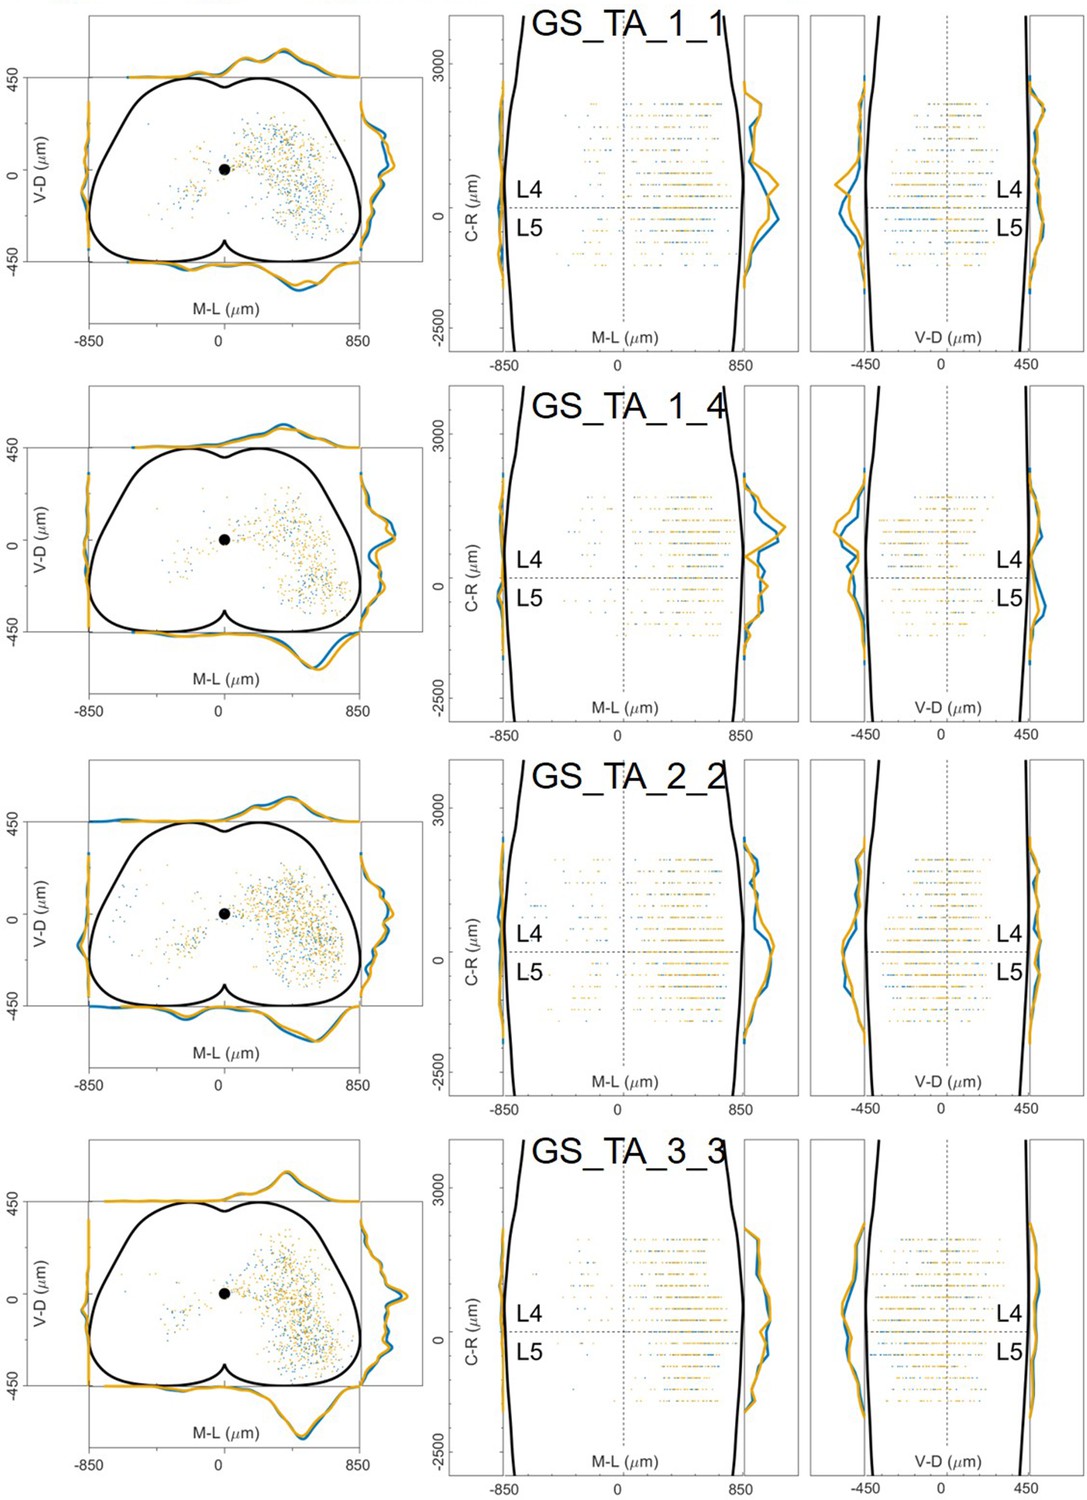
Distribution of infected neurons (primary infected motor neurons or secondary infected interneurons are not distinguished) of 4 GS (blue) and TA (yellow) double injections of PRV-152 and PRV-614 in wild type mice (Salk).
-
Figure 12—figure supplement 16—source data 1
Cartesian x-y-z coordinates of infected neurons from GS injection 1_1 (Salk).
The x-y coordinates are normalized (between –0.5 and 0.5) and scaled to an idealized spinal cord of dimensions 1700 μm and 900 μm in the mediolateral and dorsoventral directions respectively, while z coordinates are in micron, with the axis origin taken at the border between L4 and L5 and negative values in the rostral direction.
- https://cdn.elifesciences.org/articles/81976/elife-81976-fig12-figsupp16-data1-v3.xlsx
-
Figure 12—figure supplement 16—source data 2
Cartesian x-y-z coordinates of infected neurons from GS injection 1_4 (Salk).
- https://cdn.elifesciences.org/articles/81976/elife-81976-fig12-figsupp16-data2-v3.xlsx
-
Figure 12—figure supplement 16—source data 3
Cartesian x-y-z coordinates of infected neurons from GS injection 2_2 (Salk).
- https://cdn.elifesciences.org/articles/81976/elife-81976-fig12-figsupp16-data3-v3.xlsx
-
Figure 12—figure supplement 16—source data 4
Cartesian x-y-z coordinates of infected neurons from GS injection 3_3 (Salk).
- https://cdn.elifesciences.org/articles/81976/elife-81976-fig12-figsupp16-data4-v3.xlsx
-
Figure 12—figure supplement 16—source data 5
Cartesian x-y-z coordinates of infected neurons from TA injection 1_1 (Salk).
- https://cdn.elifesciences.org/articles/81976/elife-81976-fig12-figsupp16-data5-v3.xlsx
-
Figure 12—figure supplement 16—source data 6
Cartesian x-y-z coordinates of infected neurons from TA injection 1_4 (Salk).
- https://cdn.elifesciences.org/articles/81976/elife-81976-fig12-figsupp16-data6-v3.xlsx
-
Figure 12—figure supplement 16—source data 7
Cartesian x-y-z coordinates of infected neurons from TA injection 2_2 (Salk).
- https://cdn.elifesciences.org/articles/81976/elife-81976-fig12-figsupp16-data7-v3.xlsx
-
Figure 12—figure supplement 16—source data 8
Cartesian x-y-z coordinates of infected neurons from TA injection 3_3 (Salk).
- https://cdn.elifesciences.org/articles/81976/elife-81976-fig12-figsupp16-data8-v3.xlsx
Figure 13 with 2 supplements
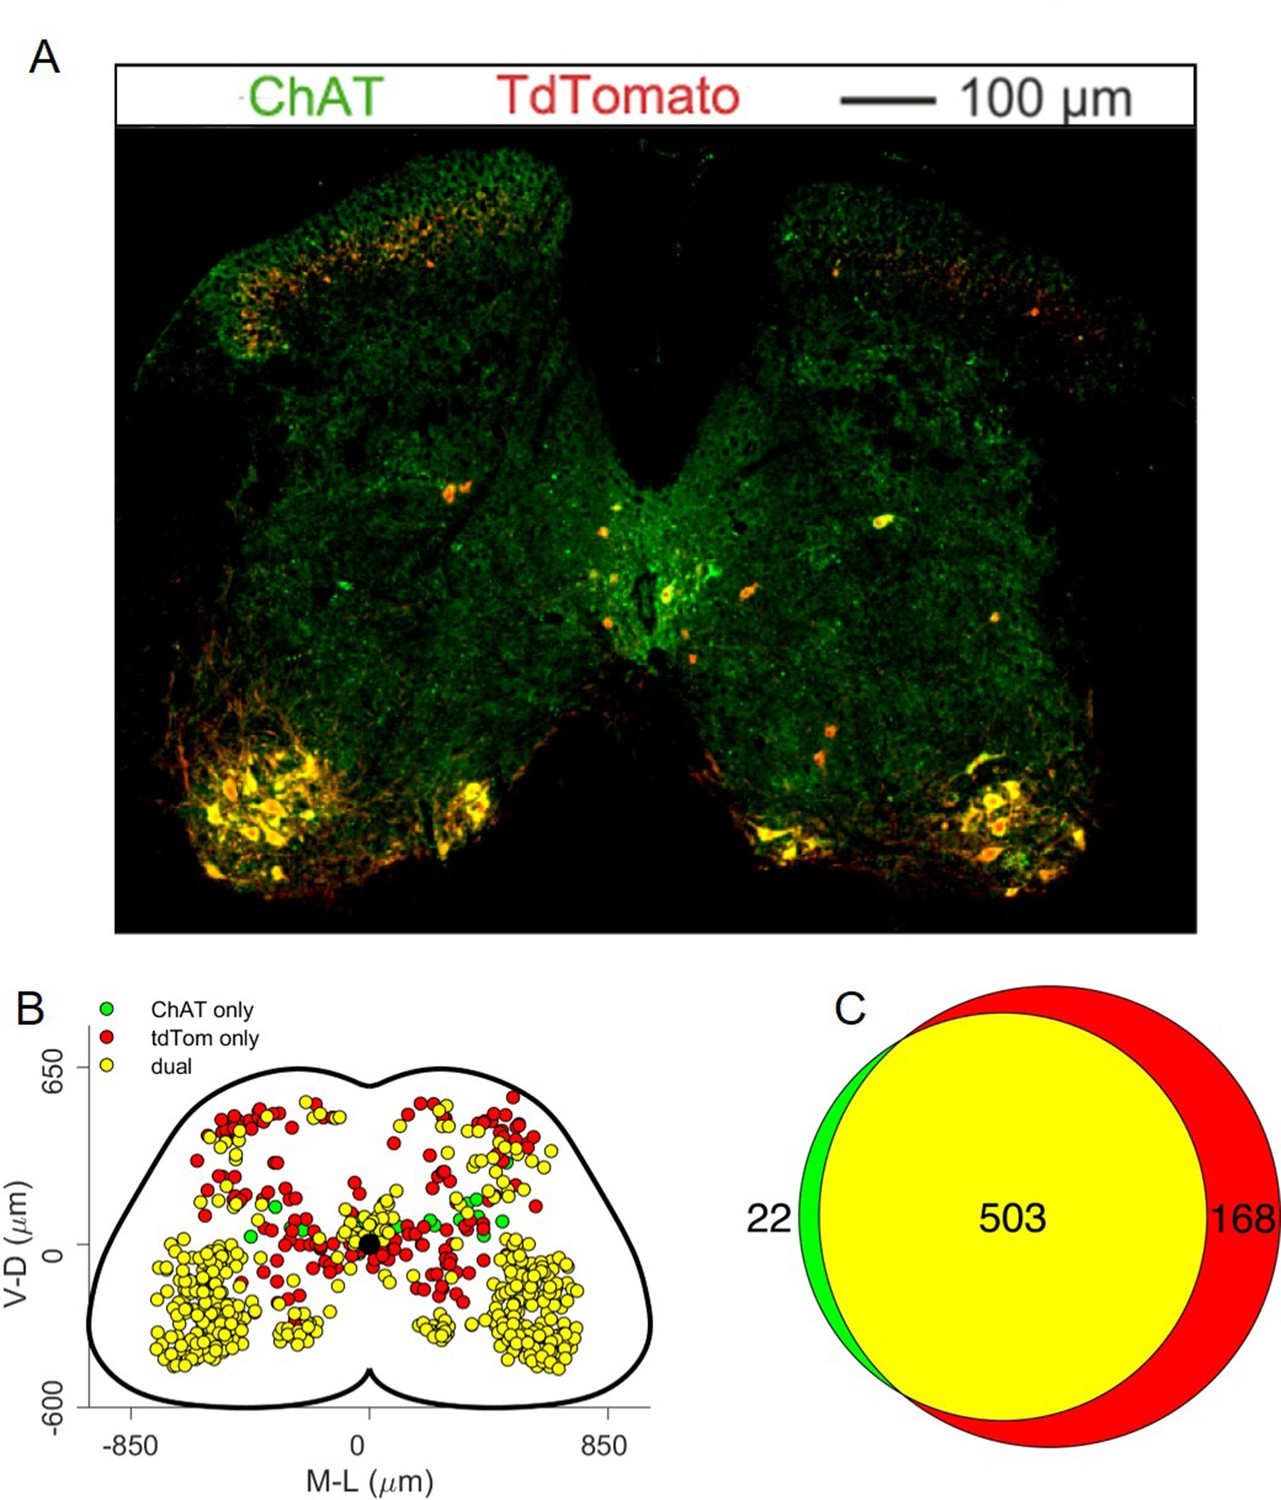
Analysis of ectopic Cre expression in ChatCre/+; Rosa26RCL-tdTom mice.
(A) Representative lumbar section stained with antibodies against ChAT (green) and tdTom (red) and (B) map of neurons labelled with both or one of the two antibodies in all the 13 analysed sections from 3 mice, showing that some of the tdTom positive neurons do not express ChAT, indicating either a developmental downregulation of ChAT expression or a modest leak in the Cre expression. (C) Venn diagram showing the overall number of mapped neurons.
-
Figure 13—source data 1
Cartesian x-y coordinates of neurons labelled with ChAT and/or TdTomato in the lower lumber spinal cord of ChATCre; Rosa26RCL-tdTom mice.
- https://cdn.elifesciences.org/articles/81976/elife-81976-fig13-data1-v3.xlsx
Figure 13—figure supplement 1
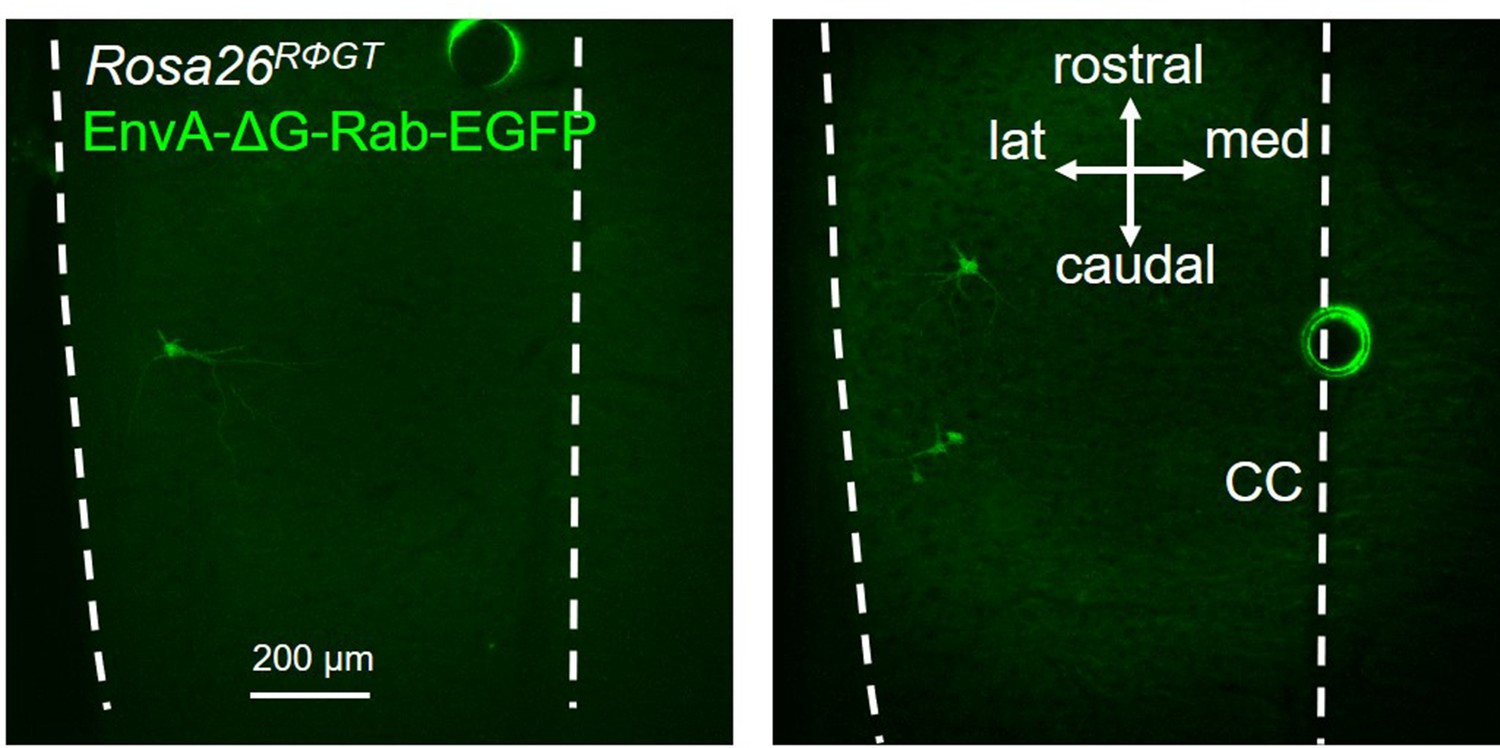
Two examples of a longitudinal section of two different spinal cords from a heterozygous Rosa26RΦGT mouse injected in the LG with EnvA-ΔG-Rab-EGFP, showing a small number of infected motor neurons, but no evidence of transsynaptic jumps, indicating ectopic expression of the TVA receptor, but not of the rabies glycoprotein.
Figure 13—figure supplement 2
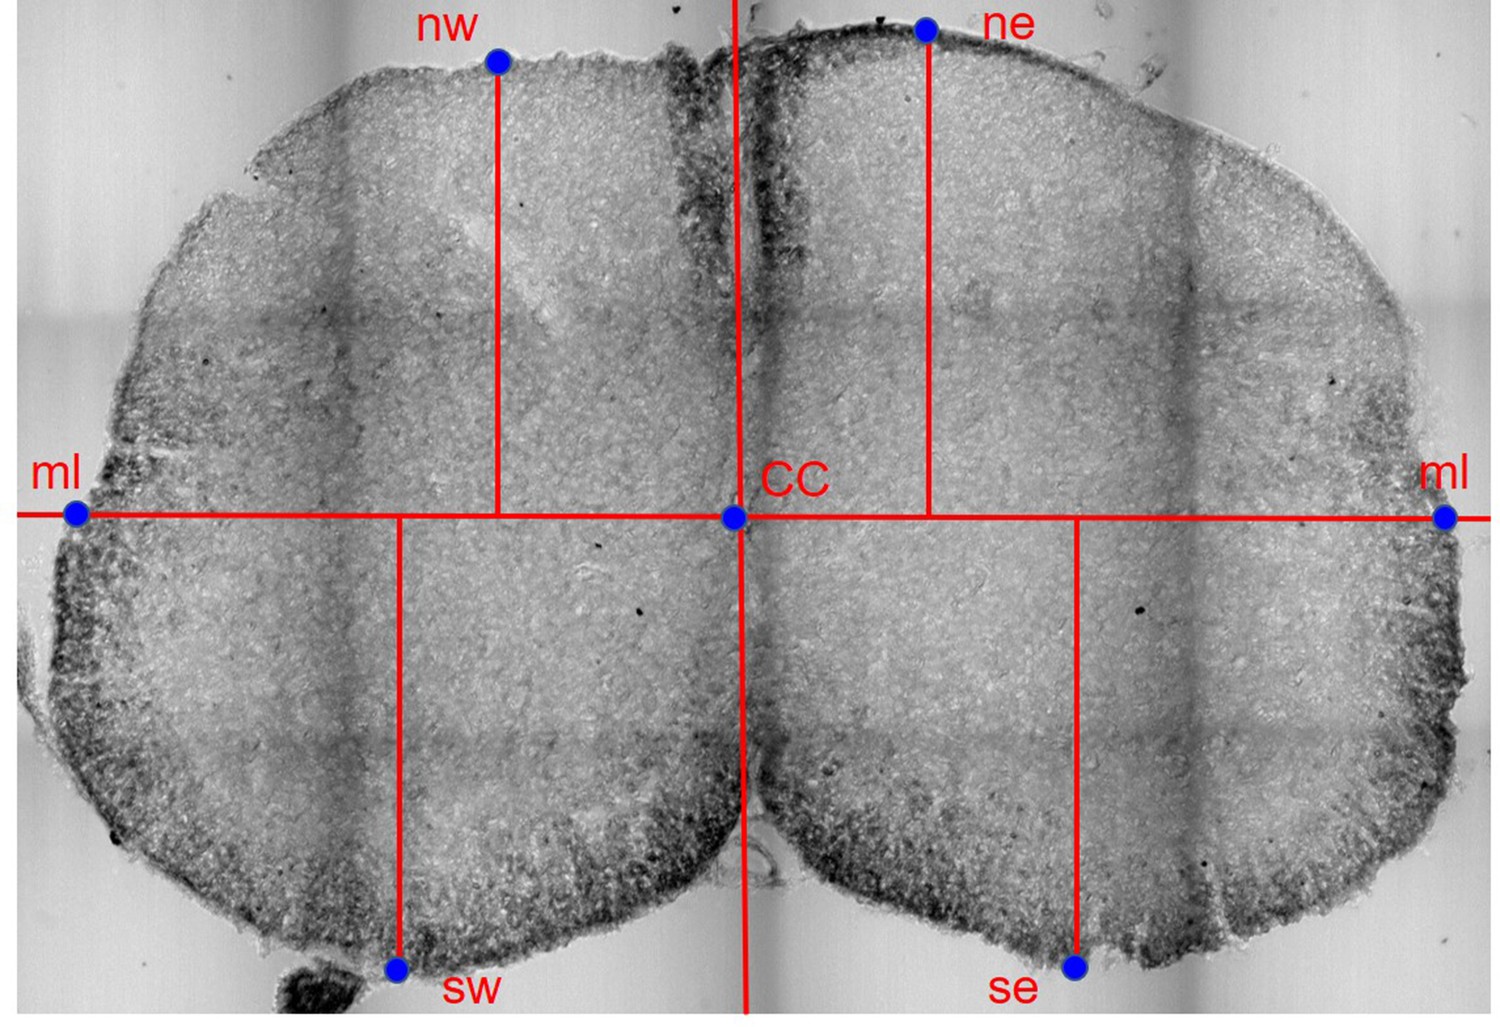
Schematic of a section of the spinal cord, indicating the reference points used for normalization.
Each section was translated to have the origin of a Cartesian set of axes centered on the central canal (CC). A line passing through the central canal and perpendicular to the dorso-ventral axis was used to identify the edge of the white matter in the mediolateral direction (ml) and the ml-CC distance was used to normalize the x-coordinates. Along the dorso-ventral axes, the 4 edges of the white matter (ne, nw, se, sw) were identified and their distance from the horizontal line passing through the central canal were used to normalize the y-coordinates independently in each of the 4 quadrants.
Tables
Table 1
Details of individual experiments performed in the four different laboratories (University College London, UCL, University of Glasgow, UoG, Max Delbrück Center for Molecular Medicine, MDC, Salk Institute), with individual cell count and virus concentration.
Same experimental code as in Figures 3D-E—6B, E, H, Figures 8E and 9E and Figure 11E and figure supplements. Experiments performed at the Salk Institute (except the PRV-Bartha experiments) were co-injections of either AAV6-B19G (3×10¹² titre) or of AAV6 - CAG-Flex-optimizedG (oG, 1×10¹² titre). AAV and RV were injected in a 3:1 ratio. For all labs and muscles the total volume injected was 1 μl, with the exception of PRV-Bartha experiments, where 0.5 μl were injected. In the Salk Institute experiments, no attempt was made to identify primarily infected motor neurons, therefore the cell count refers to both motor neurons and interneurons.
| Code | Lab | Injection | Perfusion | Muscle | TitreI.U. | MNs | Double labelled MNs | Ipsi dorsal median (μm) | Ipsipremotor INs | Contrapremotor INs | Totalpremotor INs | premotor INs/MNs ratio | Section sampling |
|---|---|---|---|---|---|---|---|---|---|---|---|---|---|
| 170427 n2 | UCL | P2 | P11 | LG | 1×10¹⁰ | 46 | 3 | 285 | 741 | 116 | 857 | 19 | 1/2 (30 μm) |
| TA | 5×10⁹ | 41 | 298 | 912 | 88 | 1000 | 24 | ||||||
| 170427 n3 | UCL | P2 | P11 | LG | 1×10¹⁰ | 32 | 2 | 267 | 620 | 87 | 707 | 22 | 1/2 (30 μm) |
| TA | 5×10⁹ | 6 | 276 | 386 | 34 | 420 | 70 | ||||||
| 170503 n6 | UCL | P2 | P11 | LG | 1×10¹⁰ | 83 | 1 | 294 | 1935 | 639 | 2574 | 31 | 1/2 (30 μm) |
| TA | 5×10⁹ | 55 | 315 | 1887 | 315 | 2202 | 40 | ||||||
| 170125 n3 | UCL | P1 | P10 | LG | 5×10⁹ | 39 | 0 | 365 | 670 | 107 | 777 | 20 | 1/2 (30 μm) |
| MG | 5×10⁹ | 39 | 353 | 819 | 307 | 1126 | 29 | ||||||
| 170508 n7 | UCL | P2 | P11 | LG | 1×10¹⁰ | 110 | 3 | 352 | 1955 | 382 | 2337 | 21 | 1/2 (30 μm) |
| MG | 5×10⁹ | 67 | 322 | 1497 | 429 | 1926 | 29 | ||||||
| 170125 n7 | UCL | P1 | P10 | TA | 5×10⁹ | 47 | 0 | 363 | 907 | 308 | 1215 | 26 | 1/2 (30 μm) |
| PL | 5×10⁹ | 39 | 380 | 1044 | 195 | 1239 | 32 | ||||||
| 170125 n8 | UCL | P1 | P10 | TA | 5×10⁹ | 22 | 2 | 343 | 920 | 157 | 1077 | 49 | 1/2 (30 μm) |
| PL | 5×10⁹ | 22 | 330 | 741 | 83 | 824 | 37 | ||||||
| 1570 | UoG | P1 | P10 | LG | 2×10⁸ | 11 | - | 322 | 1111 | 404 | 1515 | 138 | 1/8 (60 μm) |
| 1571 | UoG | P1 | P10 | LG | 2×10⁸ | 12 | - | 340 | 760 | 196 | 956 | 80 | 1/8 (60 μm) |
| 1573 | UoG | P1 | P10 | TA | 5×10⁸ | 10 | - | 332 | 447 | 68 | 515 | 52 | 1/8 (60 μm) |
| 1574 | UoG | P1 | P10 | TA | 5×10⁸ | 14 | - | 365 | 297 | 26 | 323 | 23 | 1/8 (60 μm) |
| 1577 | UoG | P2 | P10 | LG | 2×10⁹ | 18 | 2 | 329 | 313 | 43 | 356 | 20 | 1/8 (60 μm) |
| TA | 5×10⁹ | 26 | 312 | 688 | 105 | 793 | 31 | ||||||
| 1578 | UoG | P2 | P10 | LG | 2×10⁹ | 21 | 5 | 330 | 292 | 34 | 326 | 16 | 1/8 (60 μm) |
| TA | 5×10⁹ | 22 | 346 | 790 | 130 | 920 | 42 | ||||||
| 1579 | UoG | P2 | P10 | LG | 2×10⁹ | 30 | 1 | 322 | 1023 | 194 | 1217 | 41 | 1/8 (60 μm) |
| MG | 5×10⁸ | 7 | 306 | 169 | 19 | 188 | 27 | ||||||
| 1580 | UoG | P2 | P10 | LG | 2×10⁹ | 14 | 0 | 316 | 414 | 48 | 462 | 33 | 1/8 (60 μm) |
| MG | 5×10⁸ | 8 | 348 | 470 | 87 | 557 | 70 | ||||||
| 1605 | UoG | P1 | P10 | MG | 1×10⁸ | 6 | - | 340 | 412 | 110 | 522 | 87 | 1/8 (60 μm) |
| 1611 | UoG | P1 | P10 | PL | 1×10⁸ | 2 | - | 328 | 167 | 24 | 191 | 96 | 1/8 (60 μm) |
| 1613 | UoG | P2 | P10 | PL | 1×10⁸ | 1 | - | 340 | 164 | 16 | 180 | 180 | 1/8 (60 μm) |
| 1639 | UoG | P2 | P10 | TA | 2×10⁸ | 15 | - | 341 | 591 | 94 | 685 | 46 | 1/8 (60 μm) |
| 1640 | UoG | P2 | P10 | PL | 2×10⁸ | 20 | - | 322 | 629 | 122 | 751 | 38 | 1/8 (60 μm) |
| 1644 | UoG | P2 | P10 | LG | 1×10⁸ | 1 | - | 344 | 142 | 32 | 174 | 174 | 1/8 (60 μm) |
| TA | 2×10⁸ | - | 296 | 57 | 11 | 68 | - | ||||||
| 1646 | UoG | P2 | P10 | LG | 1×10⁸ | 1 | - | 261 | 90 | 16 | 106 | 106 | 1/8 (60 μm) |
| TA | 2×10⁸ | 3 | 305 | 76 | 13 | 89 | 30 | ||||||
| 1653 | UoG | P2 | P10 | LG | 1×10⁸ | 2 | - | 307 | 60 | 6 | 66 | 33 | 1/8 (60 μm) |
| TA | 2×10⁸ | 2 | 312 | 58 | 8 | 66 | 33 | ||||||
| 1656 | UoG | P2 | P10 | LG | 1×10⁸ | - | - | 311 | 563 | 145 | 708 | - | 1/8 (60 μm) |
| 1657 | UoG | P2 | P10 | LG | 1×10⁸ | 1 | - | 321 | 323 | 51 | 374 | 374 | 1/8 (60 μm) |
| 1660 | UoG | P2 | P10 | MG | 2×10⁸ | 7 | - | 324 | 509 | 3 | 512 | 73 | 1/8 (60 μm) |
| 1661 | UoG | P2 | P10 | MG | 2×10⁸ | 10 | - | 338 | 175 | 63 | 238 | 24 | 1/8 (60 μm) |
| 1662 | UoG | P2 | P10 | MG | 2×10⁸ | 10 | - | 313 | 375 | 230 | 605 | 61 | 1/8 (60 μm) |
| 1701 | UoG | P2 | P10 | LG | 2×10⁹ | 8 | 2 | 351 | 169 | 26 | 195 | 24 | 1/8 (60 μm) |
| MG | 5×10⁹ | 34 | 329 | 594 | 190 | 784 | 23 | ||||||
| 1702 | UoG | P2 | P10 | LG | 2×10⁹ | 14 | 2 | 331 | 561 | 107 | 668 | 48 | 1/8 (60 μm) |
| MG | 5×10⁹ | 2 | 322 | 76 | 11 | 87 | 44 | ||||||
| 353 | MDC | P4 | P10 | GS | 1×10⁹ | 31 | - | 283 | 1542 | 431 | 1973 | 64 | All (40 μm) |
| 399 | MDC | P4 | P10 | GS | 1×10⁹ | 41 | - | 286 | 569 | 77 | 646 | 16 | All (40 μm) |
| 1332 | MDC | P4 | P10 | GS | 1×10⁹ | 18 | - | 317 | 1605 | 323 | 1928 | 107 | All (40 μm) |
| 1349 | MDC | P4 | P10 | GS | 1×10⁹ | 18 | - | 305 | 1416 | 459 | 1875 | 104 | All (40 μm) |
| 700 | MDC | P4 | P10 | TA | 1×10⁹ | 47 | - | 318 | 1723 | 122 | 1845 | 39 | All (40 μm) |
| 721 | MDC | P4 | P10 | TA | 1×10⁹ | 22 | - | 310 | 1934 | 465 | 2399 | 109 | All (40 μm) |
| 1324 | MDC | P4 | P10 | TA | 1×10⁹ | 17 | - | 292 | 2041 | 301 | 2342 | 138 | All (40 μm) |
| 1 | Salk | P2 | P10 | GS | 1×10¹¹ | N/A | N/A | 328 | 9185 | 2735 | 11920 | N/A | All (60 μm) |
| TA | 1×10¹¹ | N/A | N/A | 349 | 3330 | 731 | 4061 | N/A | |||||
| 2 | Salk | P2 | P10 | GS | 1×10¹¹ | N/A | N/A | 303 | 8827 | 3867 | 12694 | N/A | All (60 μm) |
| TA | 1×10¹¹ | N/A | N/A | 294 | 3198 | 1132 | 4330 | N/A | |||||
| a | Salk | P1 | P8 | GS | 1×10¹⁰ | N/A | N/A | 248 | 334 | 42 | 376 | N/A | 1/9 (30 μm) |
| b | Salk | P1 | P8 | GS | 1×10¹⁰ | N/A | N/A | 237 | 275 | 30 | 305 | N/A | 1/9 (30 μm) |
| 22 a_4 | Salk | P2 | P9 | GS | 3×10¹¹ | N/A | N/A | 403 | 464 | 58 | 522 | N/A | All (60 μm) |
| 26 a_1 | Salk | P2 | P9 | GS | 3×10¹¹ | N/A | N/A | 383 | 941 | 91 | 1032 | N/A | All (60 μm) |
| 26 a_2 | Salk | P2 | P9 | GS | 3×10¹¹ | N/A | N/A | 351 | 1910 | 401 | 2311 | N/A | All (60 μm) |
| 26 a_4 | Salk | P2 | P9 | GS | 3×10¹¹ | N/A | N/A | 382 | 1923 | 392 | 2315 | N/A | All (60 μm) |
| 26_1 | Salk | P2 | P9 | TA | 3×10¹¹ | N/A | N/A | 348 | 3236 | 263 | 3499 | N/A | All (60 μm) |
| 26_3 | Salk | P2 | P9 | TA | 3×10¹¹ | N/A | N/A | 367 | 2078 | 465 | 2543 | N/A | All (60 μm) |
| 26_4 | Salk | P2 | P9 | TA | 3×10¹¹ | N/A | N/A | 350 | 2494 | 597 | 3091 | N/A | All (60 μm) |
| 1_1 PRV | Salk | P11 | P13 | GS | 1×10⁹ | N/A | N/A | 318 | 430 | 54 | 484 | N/A | 1/4 (60 μm) |
| TA | 1×10⁹ | N/A | N/A | N/A | |||||||||
| 1_4 PRV | Salk | P11 | P13 | GS | 1×10⁹ | N/A | N/A | 349 | 238 | 23 | 261 | N/A | 1/4 (60 μm) |
| TA | 1×10⁹ | N/A | N/A | N/A | |||||||||
| 2_2 PRV | Salk | P11 | P13 | GS | 1×10⁹ | N/A | N/A | 357 | 515 | 82 | 597 | N/A | 1/4 (60 μm) |
| TA | 1×10⁹ | N/A | N/A | N/A | |||||||||
| 3_3 PRV | Salk | P11 | P13 | GS | 1×10⁹ | N/A | N/A | 377 | 1005 | 53 | 1058 | N/A | 1/4 (60 μm) |
| TA | 1×10⁹ | N/A | N/A | N/A |
Table 2
Summary of pros and cons of each described method.
| Method | Pros | Cons | Outcome | Reference |
|---|---|---|---|---|
| Muscle injection of AAV-G (serotype 2.6)+RabV (Figure 1A) | Avoids the possibility of retrograde disynaptic transfer from second order motor neurons due to restriction of G expression to targeted motor neurons | The labelled premotor population could be contaminated by anterogradely labelled neurons from primary sensory neurons. | Flexor- extensor segregation No flexor- extensor segregation | (Tripodi et al., 2011) Present study |
| Avoids the possibility of retrograde disynaptic transfer from premotor spinal interneurons. | ||||
| Muscle injection of AAV-flex-G (serotype 2.6)+RabV in ChatCre/+ mice (Figure 1B) | Avoids the possibility of retrograde disynaptic transfer from second order motor neurons due to restriction of G expression to targeted motor neurons | Conditional expression of G may be inefficient | Flexor- extensor segregation No flexor- extensor segregation | (Wang et al., 2017) Present study |
| Avoids the possibility of retrograde disynaptic transfer from premotor spinal interneurons. | ||||
| Avoids potential anterograde sensory contamination. | ||||
| Central injection of AAV-flex-G (serotype 2.9) in ChatCre/+ mice followed by muscle injection of RabV, in adults (Figure 1C) | Limits the issue of potential disynaptic transfer from cholinergic interneurons | Potential for disynaptic transfer from cholinergic premotor interneurons, transsynaptically labelled motor neurons and mis-targeted primary motor neurons | Flexor- extensor segregation | Takeoka and Arber, 2019 |
| Avoids potential anterograde tracing from sensory neurons | ||||
| Genetically driven expression of G in ChatCre/+ or Olig2Cre/+ mice + muscle RabV injection in neonates (Figure 1D and E) | Avoids potential anterograde tracing from sensory neurons | Potential for disynaptic transfer from premotor spinal interneurons, transsynaptically labelled motor neurons and mis-targeted primary motor neurons. | No flexor- extensor segregation | Present study |
| Ensures homogenous expression of G in all motor neurons | ||||
| Muscle injection of PRV-Bartha with strictly timed fixation of tissue (Figure 1F) | High efficiency in transsynaptic transmission. Not reliant on viral recombination. | Timed fixation does not guarantee that transsynaptic jumps occur only up to the second order | No flexor-extensor segregation | Present study |
Key resources table
| Reagent type (species) or resource | Designation | Source or reference | Identifiers | Additional information |
|---|---|---|---|---|
| Strain, strain background (Rabies virus) | ΔG-Rab-eGFP | Gift from M. Tripodi lab, LMCB Cambridge | ||
| Strain, strain background (Rabies virus) | ΔG-Rab-mCherry | Gift from M. Tripodi lab, LMCB Cambridge | ||
| Strain, strain background (Adeno associated virus) | AAV6-Ef1a-B19G | Produced by Applied Viromics (USA) | ||
| Strain, strain background (Adeno associated virus) | AAV6-CAG-Flex-oG | Produced at the Salk GT3 virus core facility | ||
| Strain, strain background (M. musculus, ChatCre/+) | ChAT-IRES-Cre | Jackson laboratory | IMSR Cat# JAX:006410; RRID:IMSR_JAX:006410 | allele symbol: Chattm2(cre)Lowl; maintained on a C57BL6/J background |
| Strain, strain background (M. musculus, Olig2Cre/+) | Olig2-Cre | Jackson laboratory | IMSR Cat# JAX:025567; RRID:IMSR_JAX:025567 | allele symbol: B6.129-Olig2tm1.1(cre)Wdr/J maintained on a C57BL6/J background |
| Strain, strain background (M. musculus, Rosa26RΦGT) | RΦGT | Jackson laboratory | IMSR Cat# JAX:024708; RRID:IMSR_JAX:024708 | allele symbol: Gt(ROSA)26Sortm1(CAG-RABVgp4,-TVA)Arenk; maintained on a C57BL6/J background |
| Strain, strain background (M. musculus, Slc6A5eGFP) | Slc6A5eGFP | Gift from H. Zeilhofer lab, University of Zurich | IMSR Cat# RBRC04708; RRID:IMSR_RBRC04708 | allele symbol: Tg(Slc6a5-EGFP)1Uze; maintained on a C57BL6/J background |
| Strain, strain background (M. musculus, Rosa26RCL-tdTom) | Ai9(RCL-tdT) | Jackson laboratory | IMSR Cat# JAX:007909; RRID:IMSR_JAX:007909 | allele symbol: Gt(ROSA)26Sortm9(CAG-tdTomato)Hze/J; maintained on a C57BL6/J background |
| Cell line (Homo-sapiens, female) | HEK293t/17 | Gift from M. Tripodi lab, LMCB Cambridge | RRID:CVCL_1926 | ATCC, cat. no. CRL-1126 |
| Cell line (Mesocricetus auratus, male) | BHK-21 | Gift from M. Tripodi lab, LMCB Cambridge | RRID: CVCL_1915 | ATCC # CCL-10 |
| Cell line (Mesocricetus auratus, male) | BHK-G | Gift from M. Tripodi lab, LMCB Cambridge | RRID:CVCL_1915 | Derived from ATCC # CCL-10 |
| Antibody (UCL) | Anti-ChAT (Goat polyclonal) | Millipore | Cat# AB144P; RRID:AB_2079751 | IF (1:100) |
| Antibody (UCL) | Anti-mCherry (Chicken polyclonal) | Abcam | Cat# ab205402; RRID:AB_2722769 | IF (1:2500) |
| Antibody (UCL) | Anti-GFP (Rabbit polyclonal) | Abcam | Cat# ab290; RRID:AB_303395 | IF (1:2500) |
| Antibody (UCL) | Anti-vGluT2 (Guinea pig polyclonal) | Millipore | Cat# AB2251-I; RRID:AB_2665454 | IF (1:2500) |
| Antibody (UCL) | Anti-Isl1 (Guinea pig polyclonal) | Gift from T. Jessell lab, Columbia University, New York | IF (1:7500) | |
| Antibody (UCL) | Anti-guinea pig IgG H&L Alexa Fluor 647 (Donkey polyclonal) | Millipore | Cat# AP193SA6; RRID:AB_2340477 | IF (1:700) |
| Antibody (UCL) | Anti-Goat IgG H&L Alexa Fluor 405 (Donkey polyclonal preadsorbed) | Abcam | Abcam Cat# AB175665; RRID:AB_2636888 | IF (1:200) |
| Antibody (UCL) | Anti-Rabbit IgG H&L Alexa Fluor488 (Donkey polyclonal Highly Cross-Adsorbed) | Thermo Fisher Scientific | Cat# A-21206; RRID:AB_2535792 | IF (1:1000) |
| Antibody (UCL) | Anti-Chicken IgY (IgG) H&L Cy3-AffiniPure (Donkey polyclonal) | Jackson ImmunoResearch Labs | Cat# 703-165-155; RRID:AB_2340363 | IF (1:1000) |
| Antibody (Glasgow University) | Anti-GFP (chicken polyclonal) | Abcam | Cat# Ab13970 RRID:AB_300798 | IF (1:1000) |
| Antibody (Glasgow University) | Anti-mCherry (rabbit polyclonal) | Abcam | Cat# Ab167453 RRID:AB_2571870 | IF (1:2000) |
| Antibody (Glasgow University) | Anti-chicken IgY H&L Alexa Fluor488 (Donkey polyclonal) | Jackson ImmunoResearch Labs | Cat# 703-545-155; RRID:AB_2340363 | IF (1:500) |
| Antibody (MDC) | Anti-ChAT (rabbit polyclonal) | Abcam | Cat# Ab2750952 RRID:AB_2750952 | IF (1:16,000) |
| Antibody (MDC) | Anti-Rabbit IgG H&L Alexa Fluor488 (Donkey polyclonal) | Thermo Fisher Scientific | Cat# A-21206; RRID:AB_2535792 | IF (1:1000) |
| Antibody (Salk) | Anti-GFP (goat polyclonal) | Rockland | Cat#600-101-215; RRID:AB_218182 | IF (1:1000) |
| Antibody (Salk) | Anti-RFP (rabbit polyclonal) | Rockland | Cat#600-401-379; RRID:AB_2209751 | IF (1:1000) |
| Antibody (Salk) | Anti-goat IgY H&L Alexa Fluor488 (Donkey polyclonal) | Invitrogen | Cat#A11055; RRID:AB_2534102 | IF (1:1000) |
| Antibody (Salk) | Anti-rabbit IgY H&L Alexa Fluor555 (Donkey polyclonal) | Invitrogen | Cat#A32794; RRID:AB_2762834 | IF (1:1000) |
| Chemical compound, drug | Mowiol 4–88 | Sigma Aldrich | Cat# 81381–250 G | |
| Software, algorithm | ZEN Digital Imaging for Light Microscopy: Zen Blue 2.3 | Carl Zeiss light microscopy imaging systems | RRID:SCR_013672 | |
| Software, algorithm | Imaris 9.1 | Bitplane | RRID:SCR_007370 | |
| Software, algorithm | Adobe illustrator version CC 2019 | Adobe | RRID:SCR_010279 | |
| Software, algorithm | Matlab version 2021b | Mathworks | RRID:SCR_001622 |
Additional files
Download links
A two-part list of links to download the article, or parts of the article, in various formats.
Downloads (link to download the article as PDF)
Open citations (links to open the citations from this article in various online reference manager services)
Cite this article (links to download the citations from this article in formats compatible with various reference manager tools)
Spinal premotor interneurons controlling antagonistic muscles are spatially intermingled
eLife 11:e81976.
https://doi.org/10.7554/eLife.81976


