Integrative modeling reveals the molecular architecture of the intraflagellar transport A (IFT-A) complex
- Department of Molecular Biosciences, Center for Systems and Synthetic Biology, University of Texas, United States
- Max Planck Institute of Molecular Cell Biology and Genetics, Germany
- Human Technopole, Italy
Figures
Figure 1 with 3 supplements

AlphaFold2 structures of the IFT-A subunits are supported by experimentally-determined intramolecular cross-links.
(A) Sample preparation protocol for obtaining an enriched sample of endogenous IFT-A from T. thermophila. The sample preparation was followed by chemical cross-linking using DSSO and tandem (MS2/MS3) mass spectrometry to identify cross-linked peptides. Image created with BioRender.com. (B) Bar diagrams highlight the extensive intramolecular DSSO cross-links (purple arcs connecting cross-linked amino acid pairs) within each of the IFT-A subunits (bars, numbers denote amino acid positions). (C) Violin plots of the distance between Cɑ atoms of chemically cross-linked residues. Surrounding images show locations of intramolecular crosslinks (black bars) on aligned AlphaFold2 predicted models of IFT-A subunits from Chlamydomonas reinhardtii (green) and Tetrahymena thermophila (pink). A maximum distance of 35 Å between Cɑ atoms is expected for DSSO cross-links. 97% of intramolecular cross-links are satisfied for T. thermophila and 94% for C. reinhardtii.
Figure 1—figure supplement 1
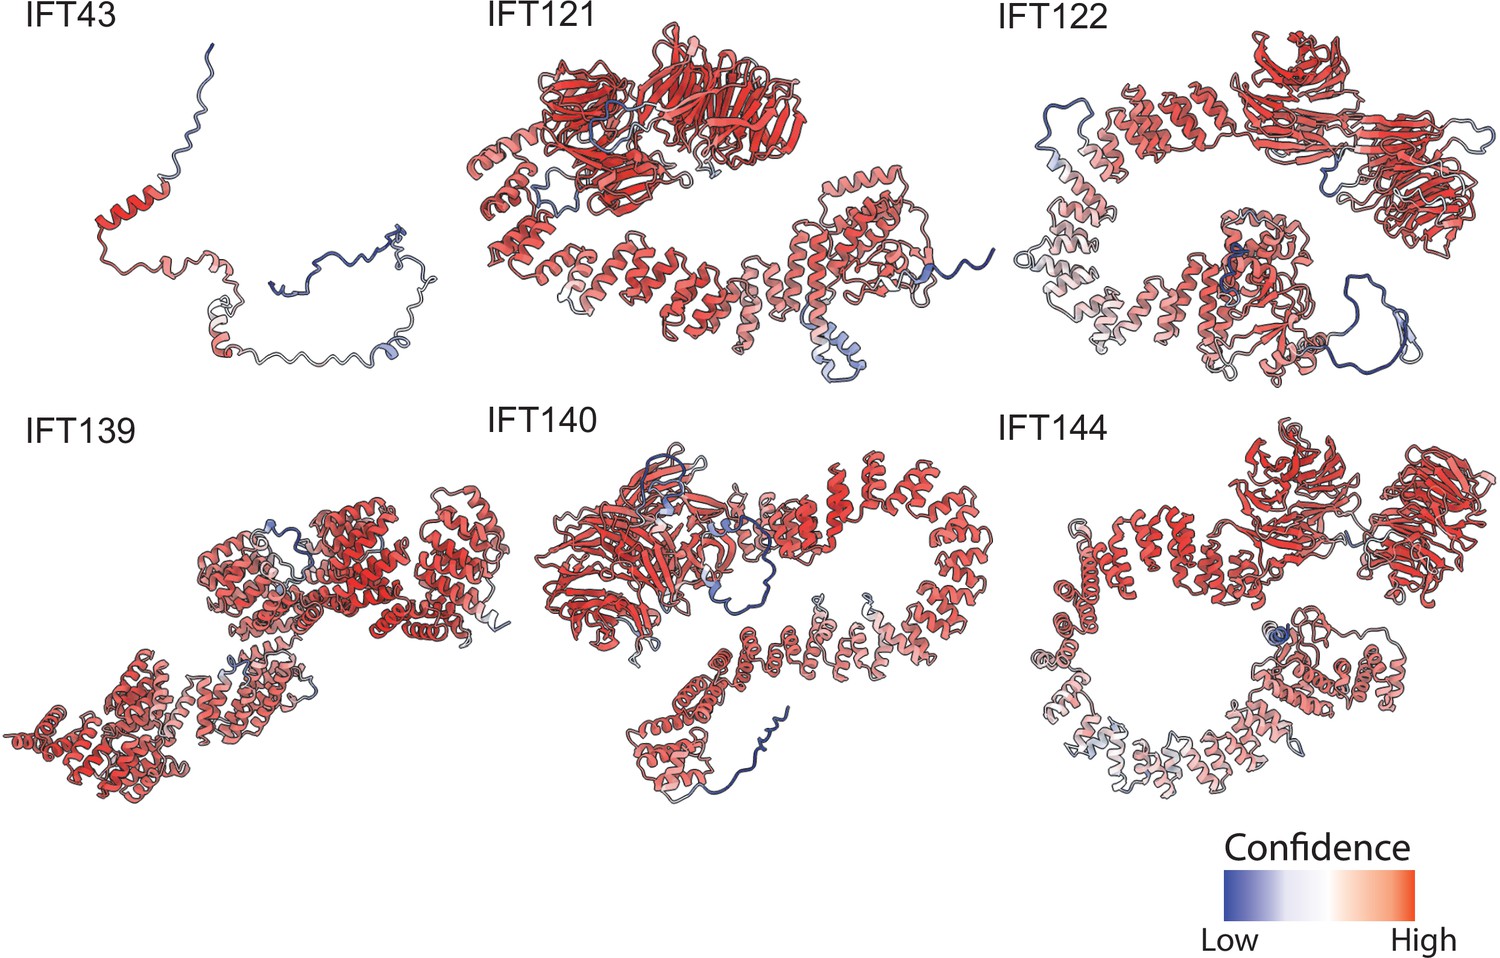
AlphaFold2 structural predictions for T. thermophila proteins of the IFT-A complex.
Structures are colored based on pLDDT (Tunyasuvunakool et al., 2021) where red represents higher confidence predictions and blue lower confidence predictions.
Figure 1—figure supplement 2
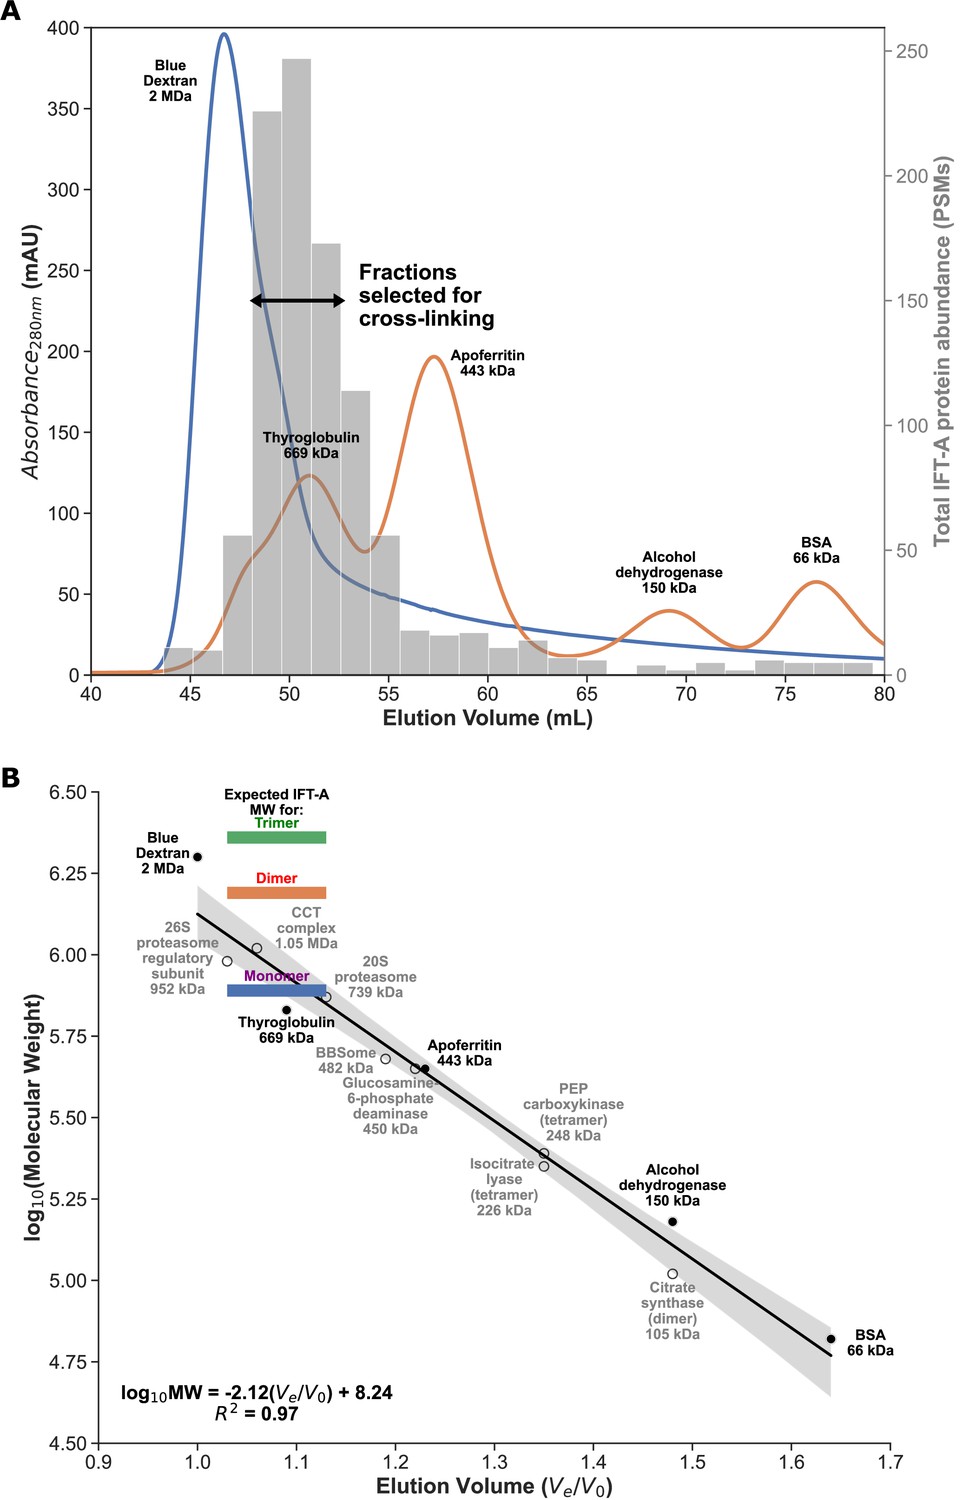
Enrichment for monomeric IFT-A from Tetrahymena cilia.
(A) FPLC size exclusion chromatography elution traces for molecular weight calibrants (lines, left axis), overlaid with mass-spectrometry determined IFT-A protein abundances (in protein spectral matches, PSMs; bars, right axis) measured from Tetrahymena whole cell extract. Using these data, we identified IFT-A fractions to be subsequently collected from ciliary M+M preparations for cross-linking. (B) Linear regression between chromatography elution volumes (Ve, peak elution volume in mL; V0, void volume from Blue Dextran) and molecular weight calibrants (known size calibrants, filled circles; protein complexes of known composition, open circles) provided a molecular weight estimate for the selected IFT-A fractions ranging between 720 kDa and 1.1 MDa, consistent with an IFT-A monomer, whose expected molecular weight is 772 kDa.
Figure 1—figure supplement 3
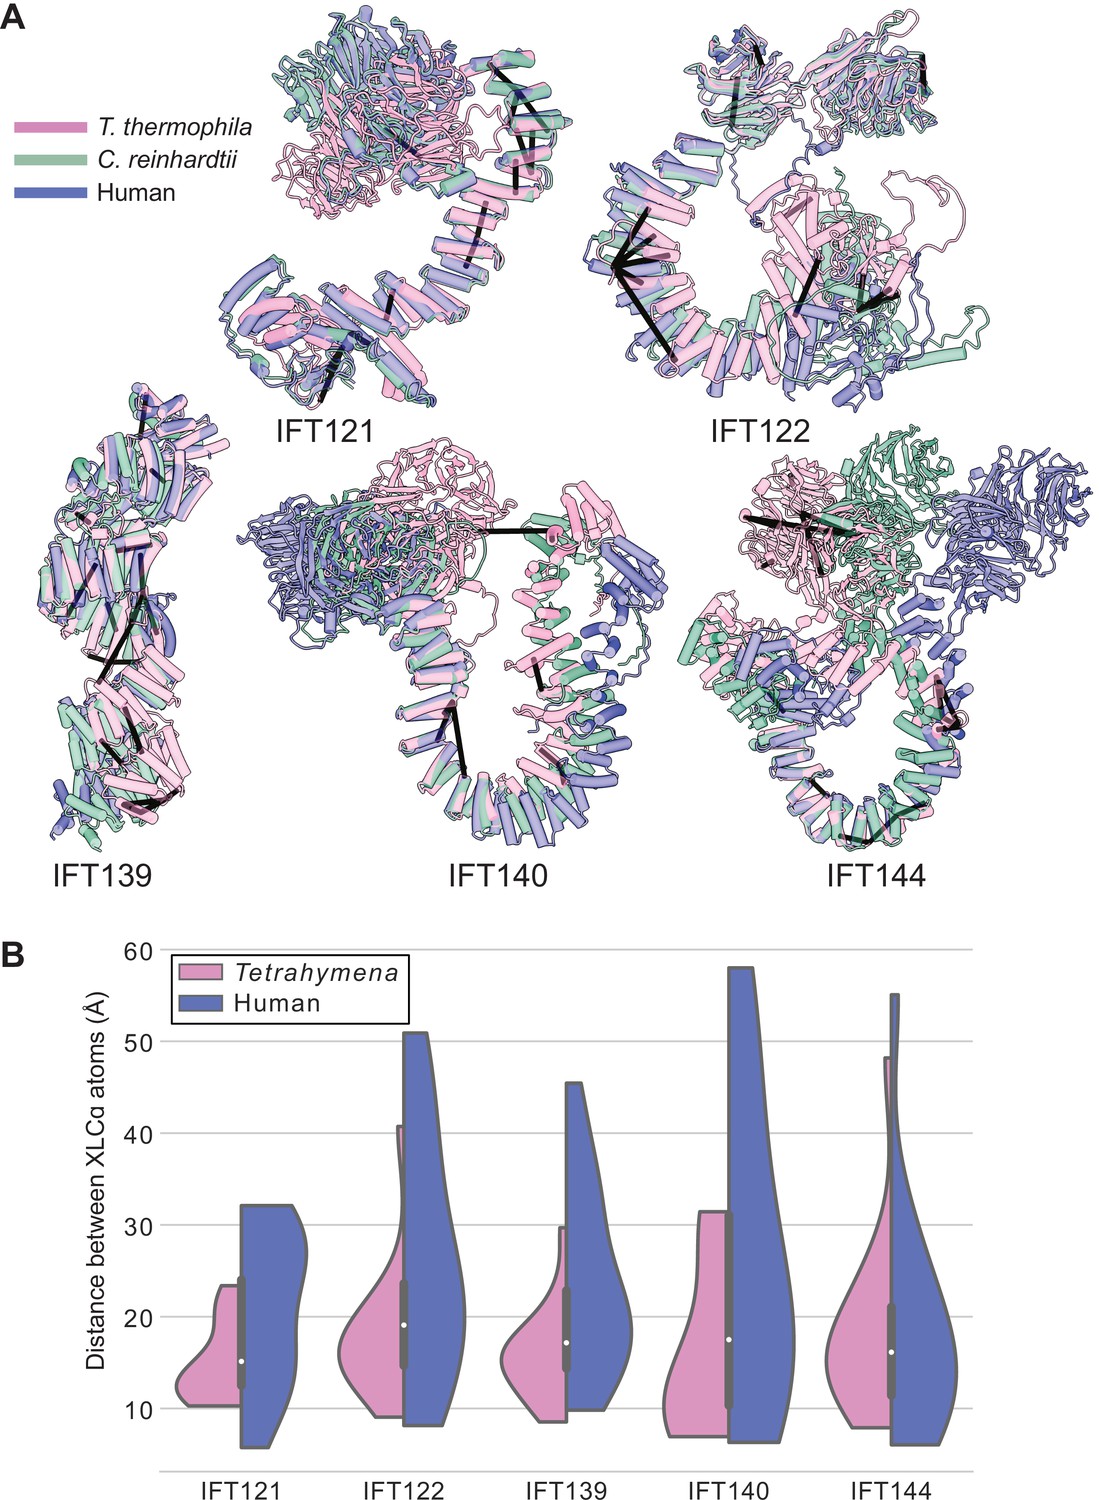
Tetrahymena IFT-A cross-links mapped onto AlphaFold-predicted structures of human IFT-A proteins.
(A) Locations of intramolecular crosslinks (black bars) are visualized on structural alignments of AlphaFold2 predicted models of IFT-A subunits from Tetrahymena thermophila (pink), Chlamydomonas reinhardtii (green), and humans (blue). (B) Violin plots show the distance between Cɑ atoms of chemically cross-linked residues by DSSO. A maximum distance of 35 Å between Cɑ atoms is expected for DSSO cross-links. 86% of intramolecular cross-links are satisfied for the human structures.
Figure 2 with 4 supplements
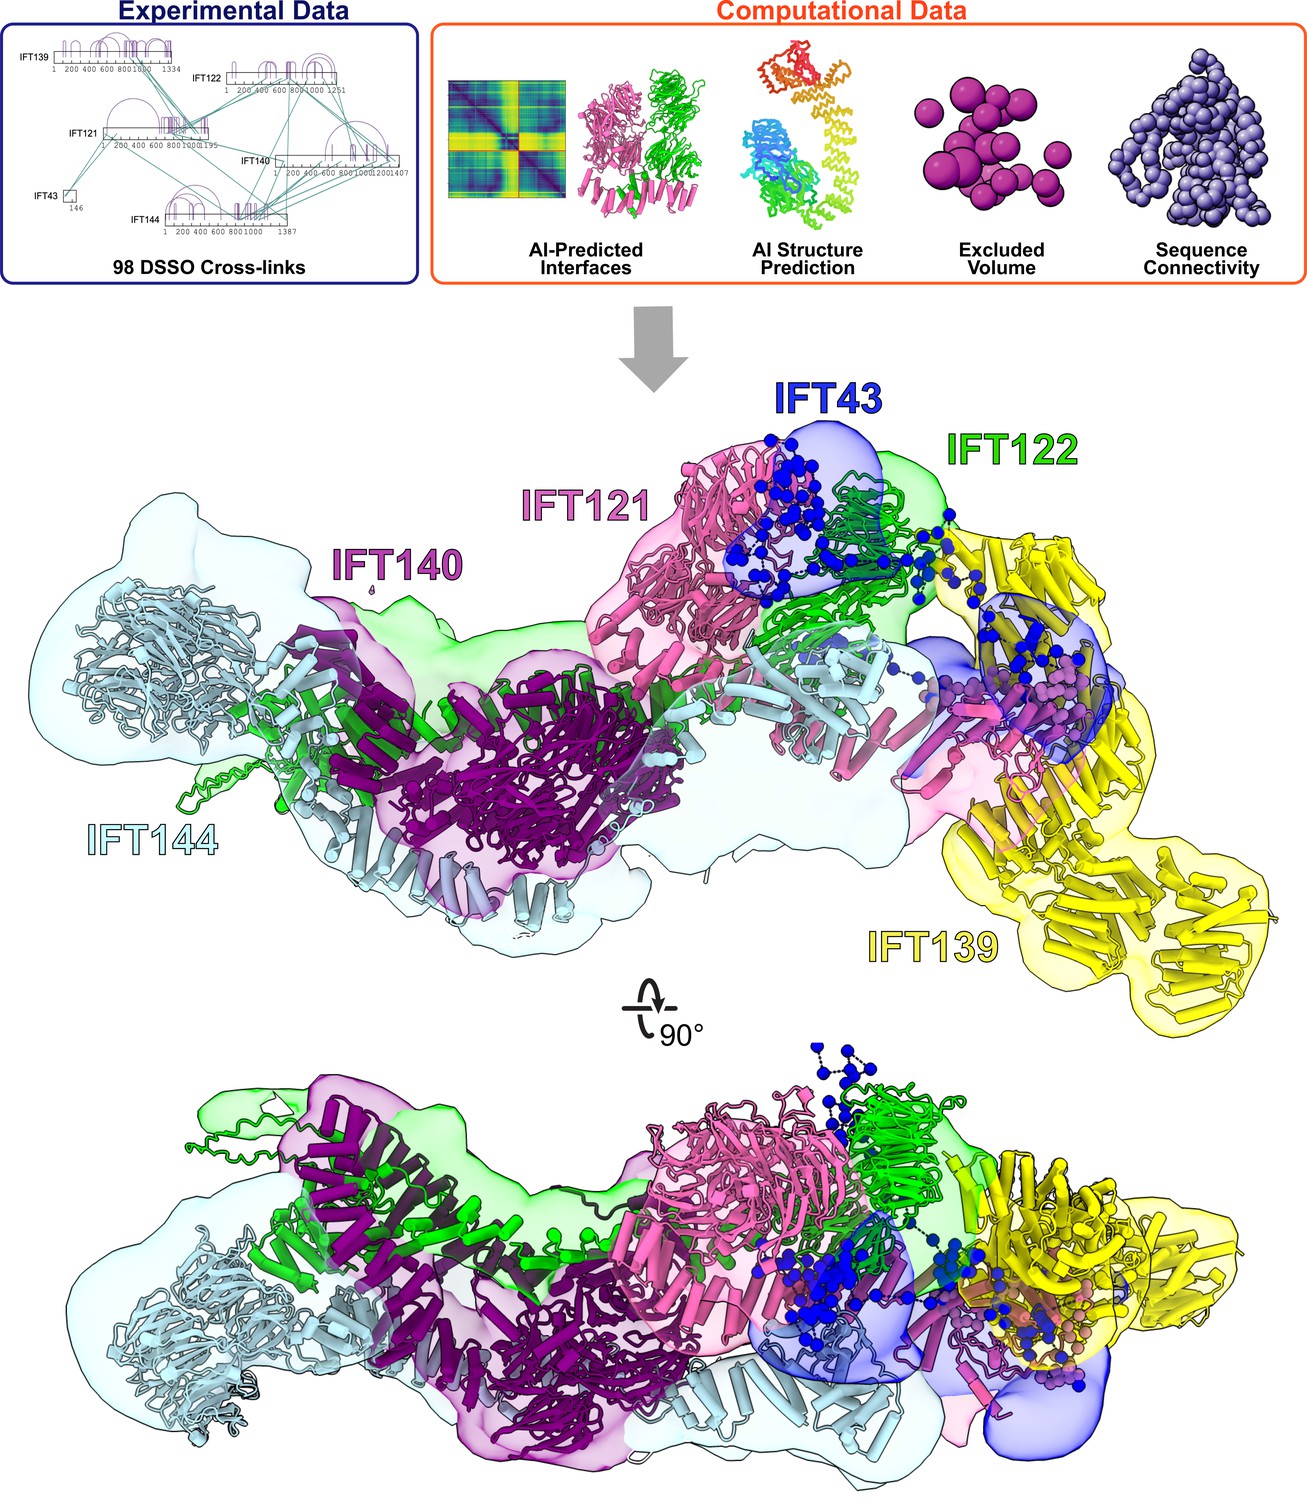
Integrative modeling of the IFT-A monomer identifies subunit locations and interactions.
Using spatial restraints (top panels) based on chemical cross-links (intramolecular, purple arcs; intermolecular, green lines), AlphaFold2 protein models, and AlphaFold2 high-confidence predicted interfaces between proteins (see Methods for more details), an integrative model (bottom panel) of monomer IFT-A was determined that best satisfied these spatial restraints. The centroid model of the top-scoring cluster of 9121 models is shown (ribbon diagram) in the localized probability density (colored volumes) for each subunit.
Figure 2—figure supplement 1
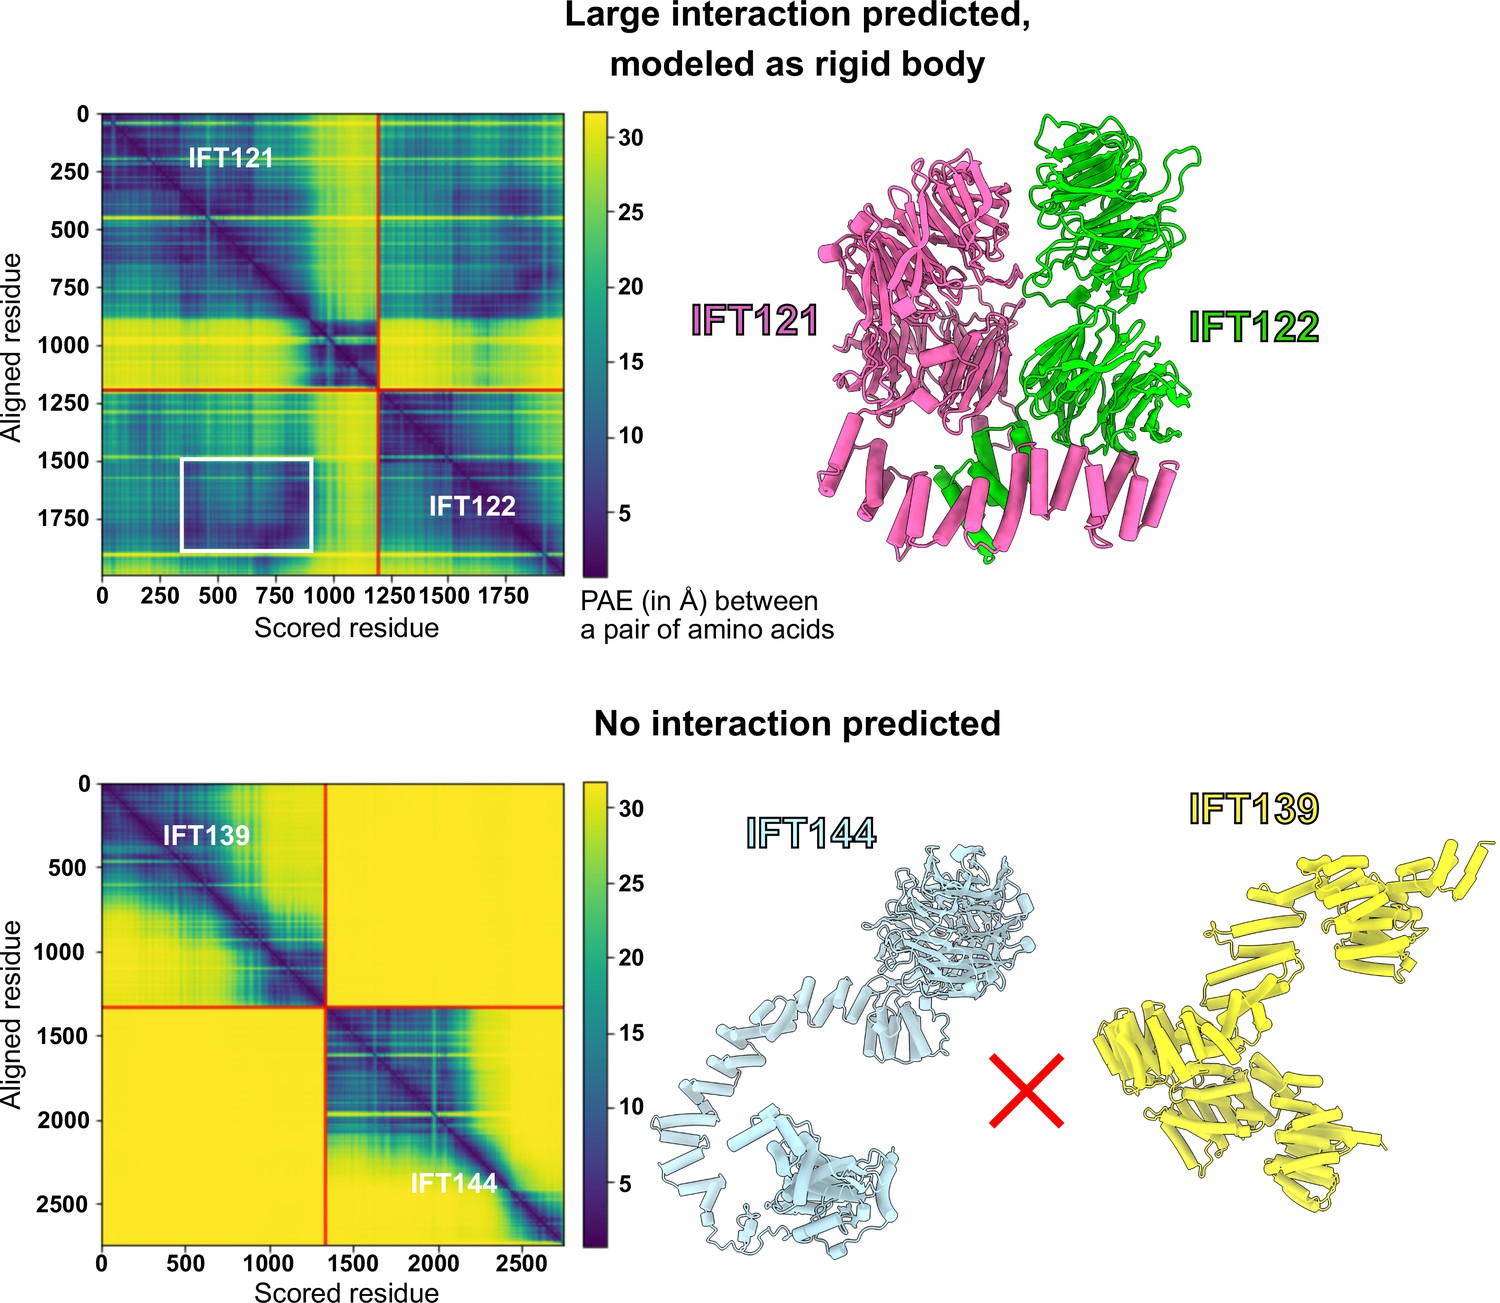
AlphaFold PAE analysis was used to determine the boundaries for rigid-bodies in integrative modeling.
AlphaFold-Multimer (Evans et al., 2021) was used to model pairs of IFT-A proteins and compute the predicted aligned error (PAE, reported in Å, where darker colors indicate higher confidence in the relative spatial positions of two amino acid residues) between all pairs of amino acid residues in both structures. Using these PAE scores and thresholds determined by comparing PAE scores to independent structural evidence (McCafferty et al., 2022b), we defined boundaries of well-predicted interacting domains to be used as rigid bodies for subsequent integrative modeling (see Methods), as for the case shown for IFT121-IFT122 (top panels). The white box indicates the extracted interacting region, which in this case lies within larger well-predicted monomeric structures; the complete IFT121-122 interaction model is drawn at right. No such information was used from the PAE plots of the proteins that were not predicted to interact, as for the case of IFT139-IFT144 (bottom panels), for which neither AlphaFold nor chemical cross-links showed any evidence for interacting.
Figure 2—figure supplement 2
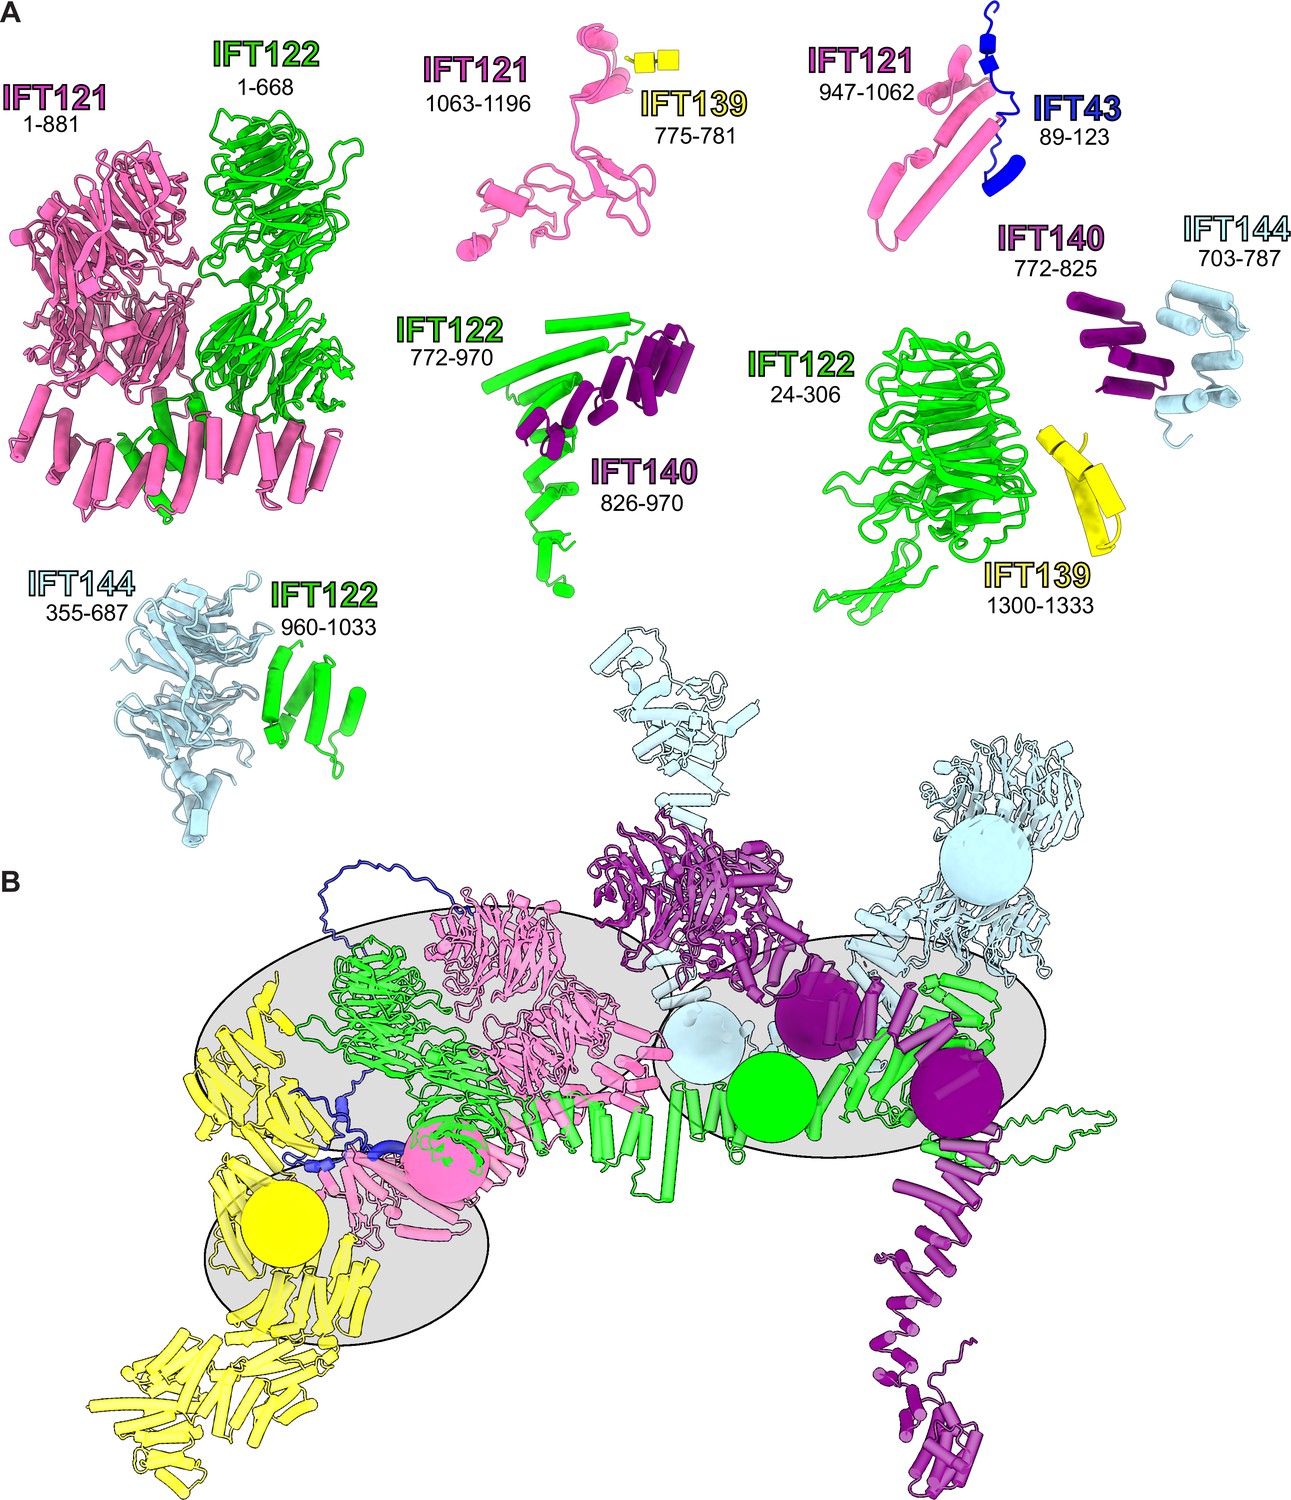
Summary of all AlphaFold-Multimer-predicted intermolecular interfaces used as rigid bodies in the model.
(A) Rigid body protein segment pairs determined from AlphaFold-Multimer on the basis of high-confidence model PAE scores. A starting model for integrative modeling was assembled from these rigid bodies, as shown in (B). We restricted the number of degrees of freedom explored during integrative modeling by defining regions that were modeled as groups of rigid bodies (gray ellipses) as well as restricting flexibility to ‘pivot points’ of low AlphaFold confidence (colored spheres) within each protein.
Figure 2—figure supplement 3
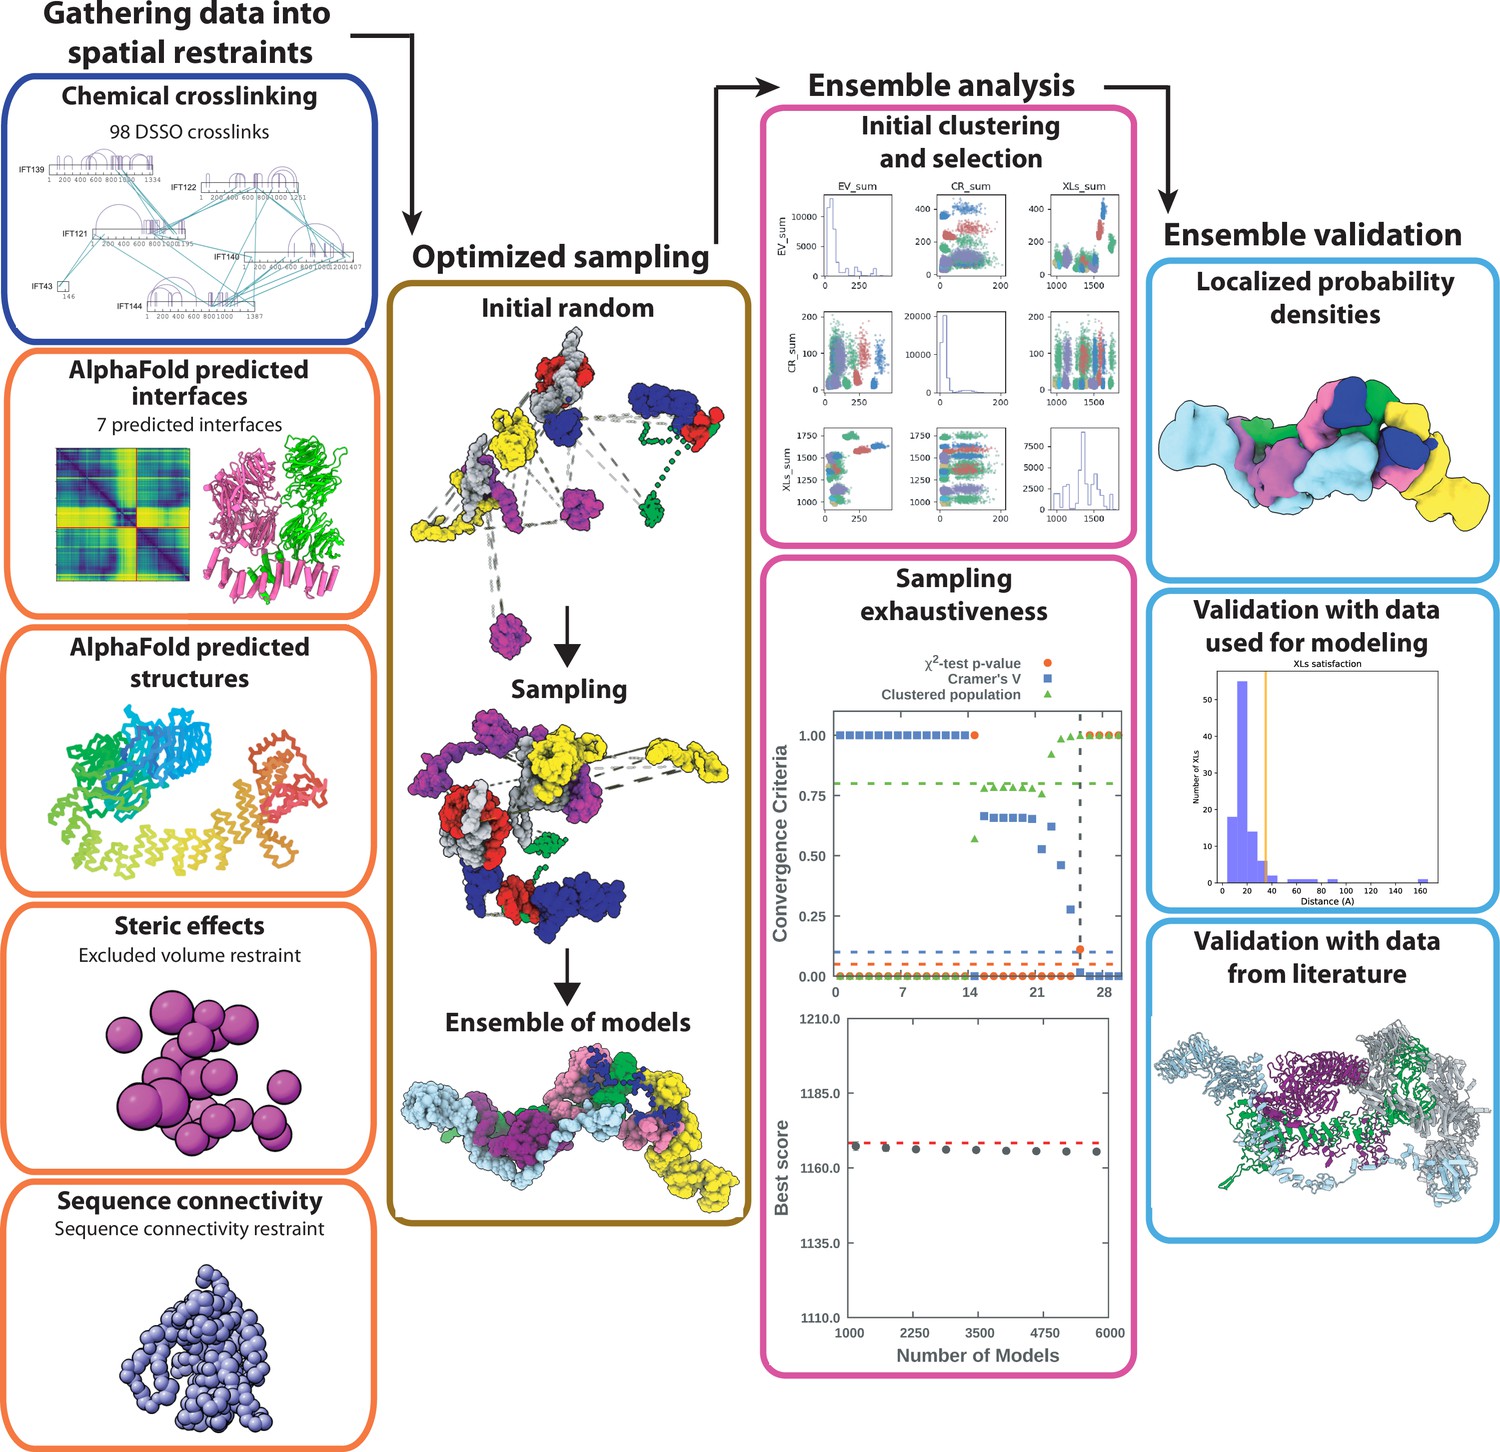
Integrative modeling scheme.
The four step protocol of IMP (shown as consecutive columns of panels) includes (1) gathering data into spatial restraints, (2) optimized sampling, (3) ensemble analysis, and (4) ensemble validation. In (1) we show the restraints that were used in the model. In (2) we show the initial random positions followed by a Monte Carlo sampling. In (3) we show the ensemble analysis, which includes clustering models by score and testing for convergence of high-scoring models. Finally, in step (4) we validate the model both against data that was used in the model and using protein interactions previously reported in the literature.
Figure 2—figure supplement 4
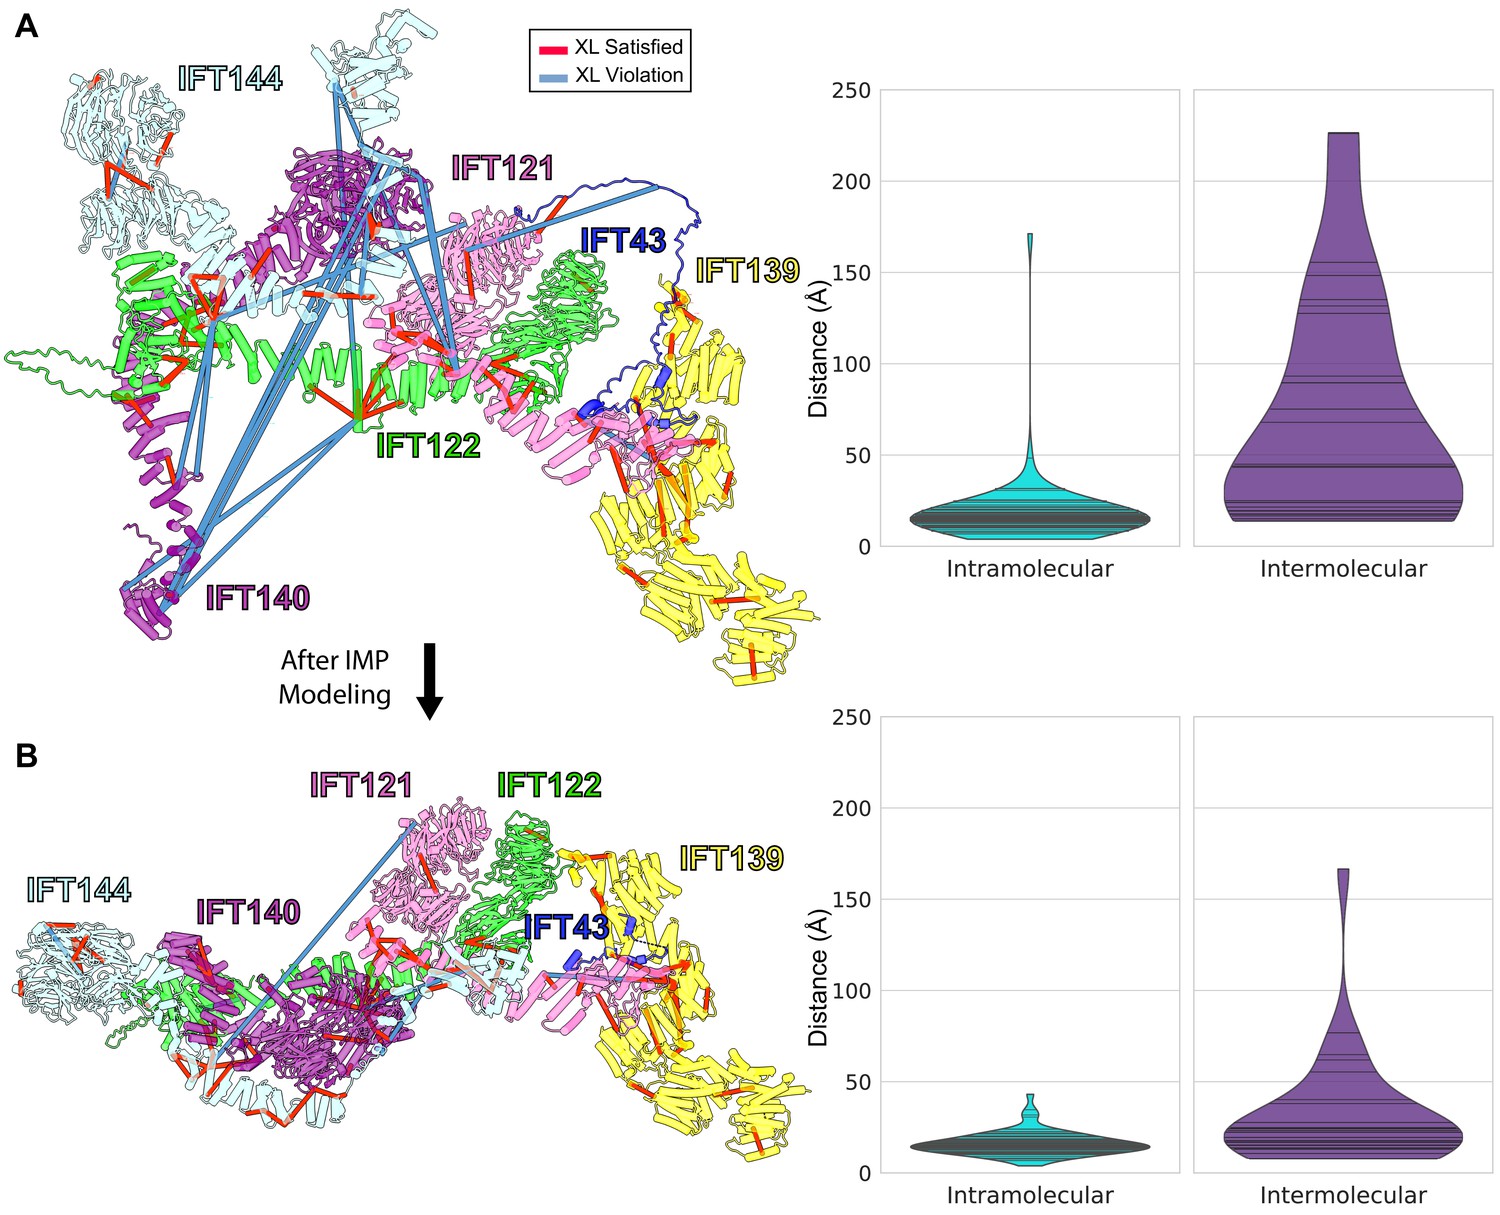
Initial (A) and final (B) configurations of the IFT-A monomer model.
(A) The initial model built based on pairwise AlphaFold-Multimer predictions. The starting model showed numerous violations of intermolecular cross-linker distances (violin plots at right, showing distances between cross-linked amino acid residues in Ångstroms). (B) Integrative modeling using IMP markedly reduced the number of violations, producing a final model consistent with 98.6% of intramolecular and 72% of intermolecular cross-links, assessed as the percentage of cross-linked residue pair alpha carbons positioned within 35 Å of each other.
Figure 3
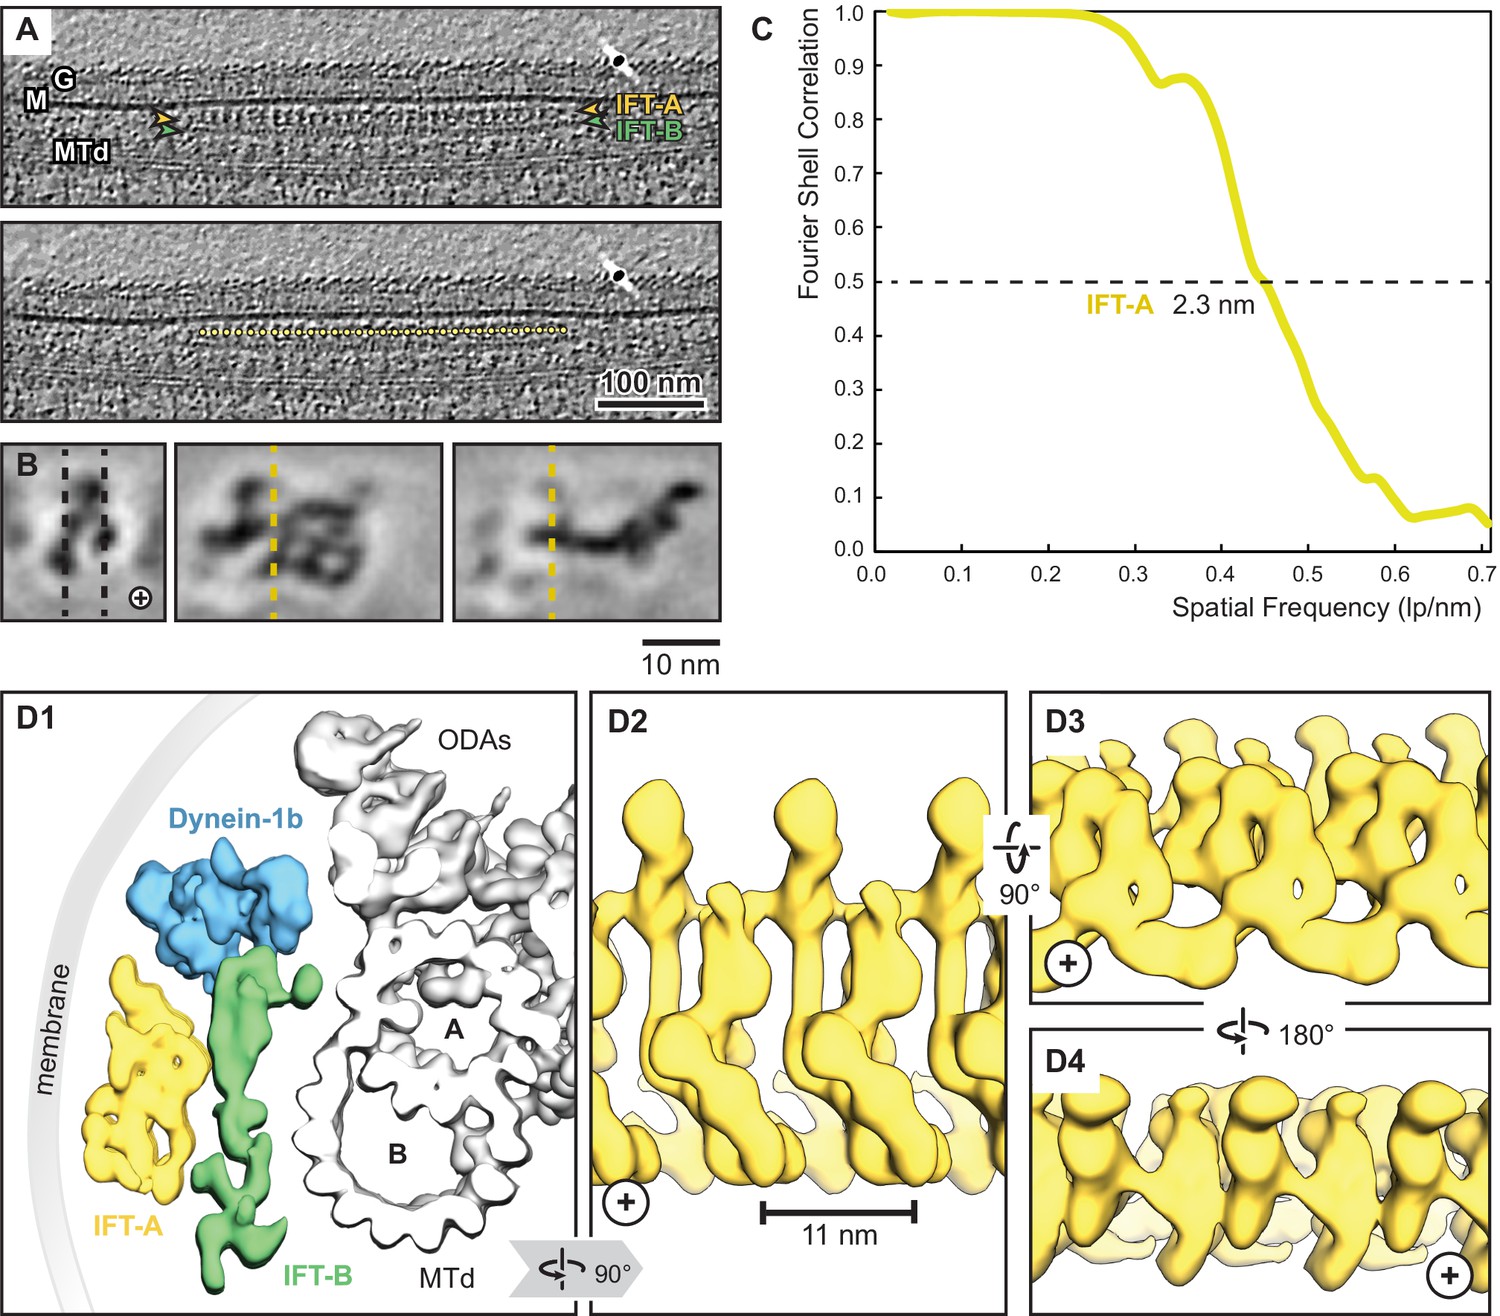
Overview of the IFT-A cryo-ET structure.
(A) IFT train in a raw tomogram of a C. reinhardtii cilium with the section showing the repeats of IFT-A and IFT-B. The picking of IFT-A particles is shown in the lower panel (MTd, microtubule doublet; G, glycocalyx; M, membrane; the direction of the ciliary tip is to the right side). (B) Subtomogram average of IFT-A; the left panel shows the same orientation as in A (plus, direction of the ciliary tip). Vertical dashed lines in the left panel indicate slice sections corresponding to the middle and right panels, respectively. (C) The Fourier shell correlation of the subtomogram average indicates a resolution of 2.3 nm at a cut-off criterion of 0.5. The pixel size is 0.71 nm. (D1) 3D isosurface of a reconstructed IFT train in between the membrane and the microtubule doublet as seen from the ciliary base towards the tip (ODAs, outer dynein arms; A, B, A-, and B-tubule) and composed of three averages: IFT-A (yellow), IFT-B (green) and dynein-1b (blue). (D2) The IFT-A polymer as seen from the membrane towards the microtubule doublet. (D3) and (D4) Views of IFT-A as indicated.
Figure 4 with 3 supplements
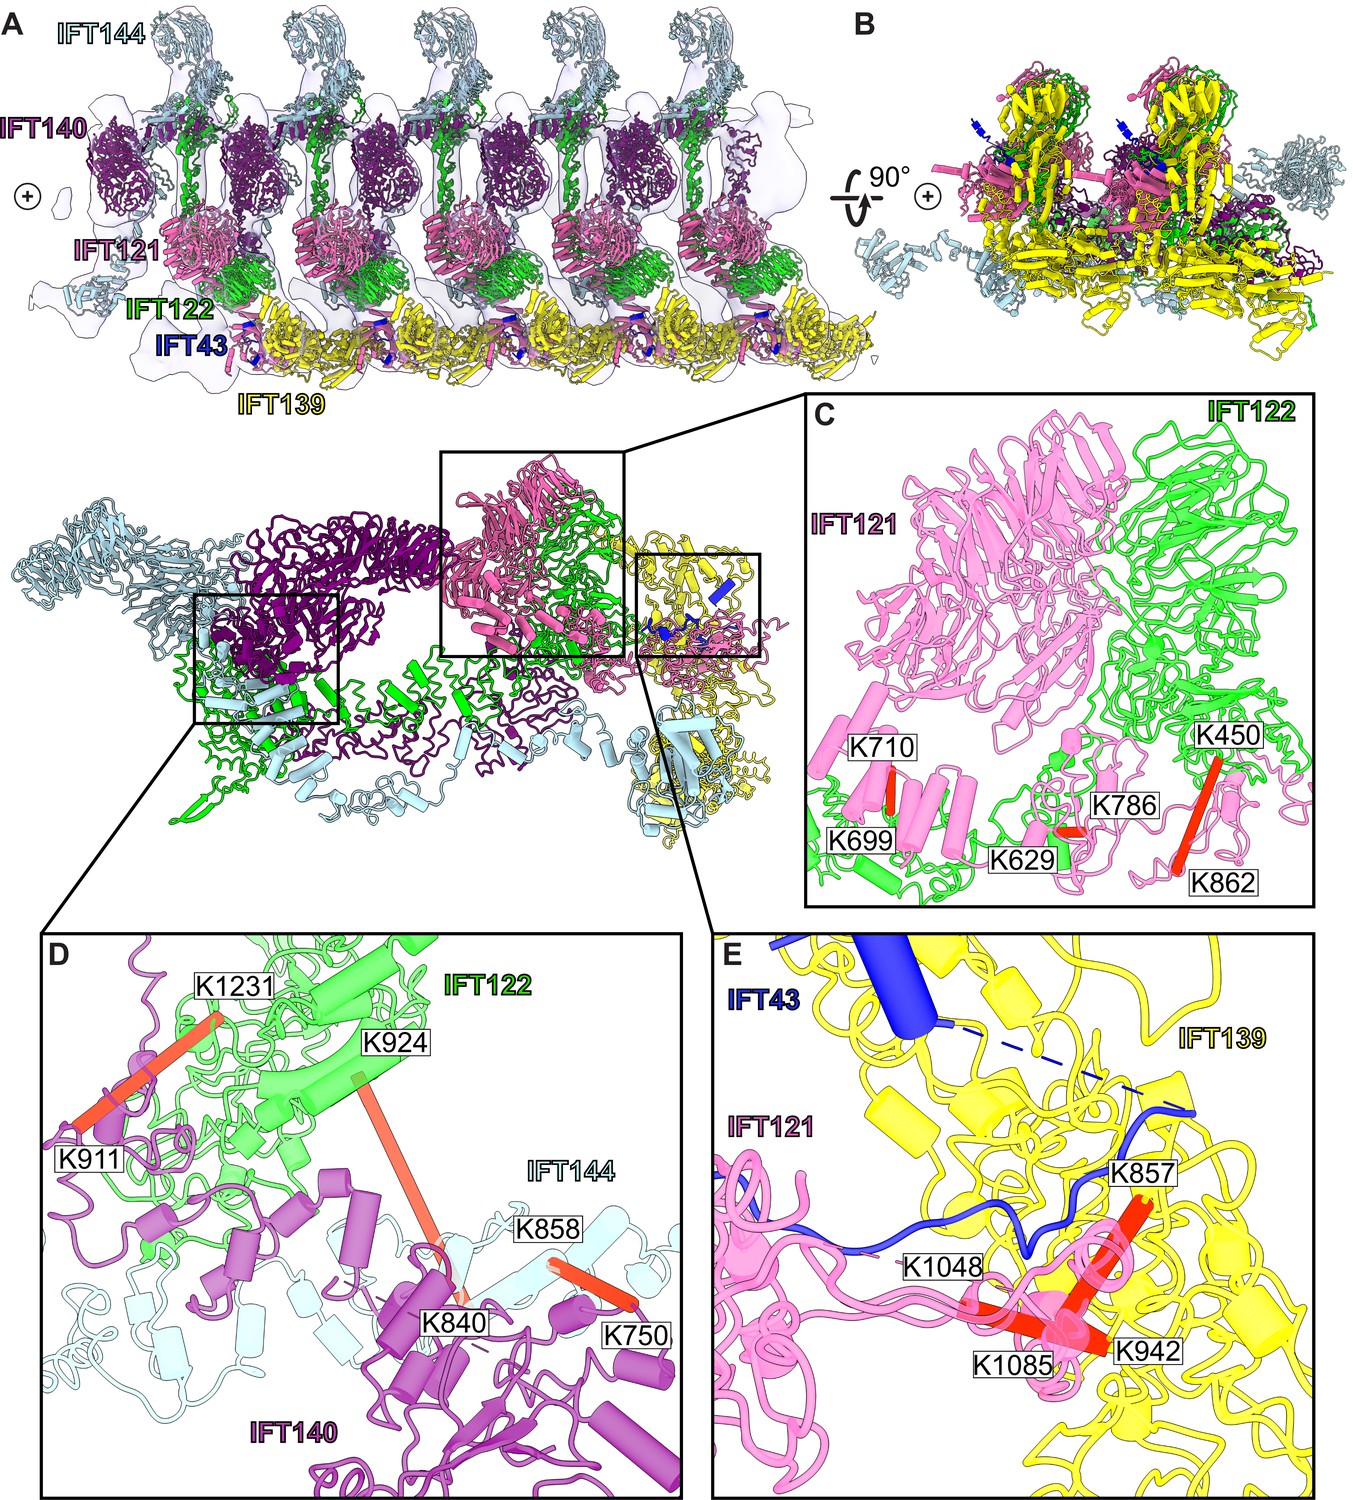
A model of the IFT-A train based on docking the monomeric model into the subtomogram average.
(A) The final cluster centroid model fit into the five IFT-A polymeric repeat subtomogram average map using molecular dynamics-based flexible fitting (Kidmose et al., 2019). (B) An alternative side view of the IFT-A trains to show interactions between adjacent monomers. Plus signs in A,B indicate the direction of the ciliary tip. (C) The IFT121-IFT122 interaction in the train-docked model with satisfied intermolecular cross-linked pairs shown in red. (D) The interaction between IFT122-IFT140-IFT144 is shown with satisfied intermolecular cross-links in red. (E) The interaction between IFT43-IFT121-IFT139 with satisfied intermolecular cross-links between IFT121 and IFT139 shown.
Figure 4—figure supplement 1
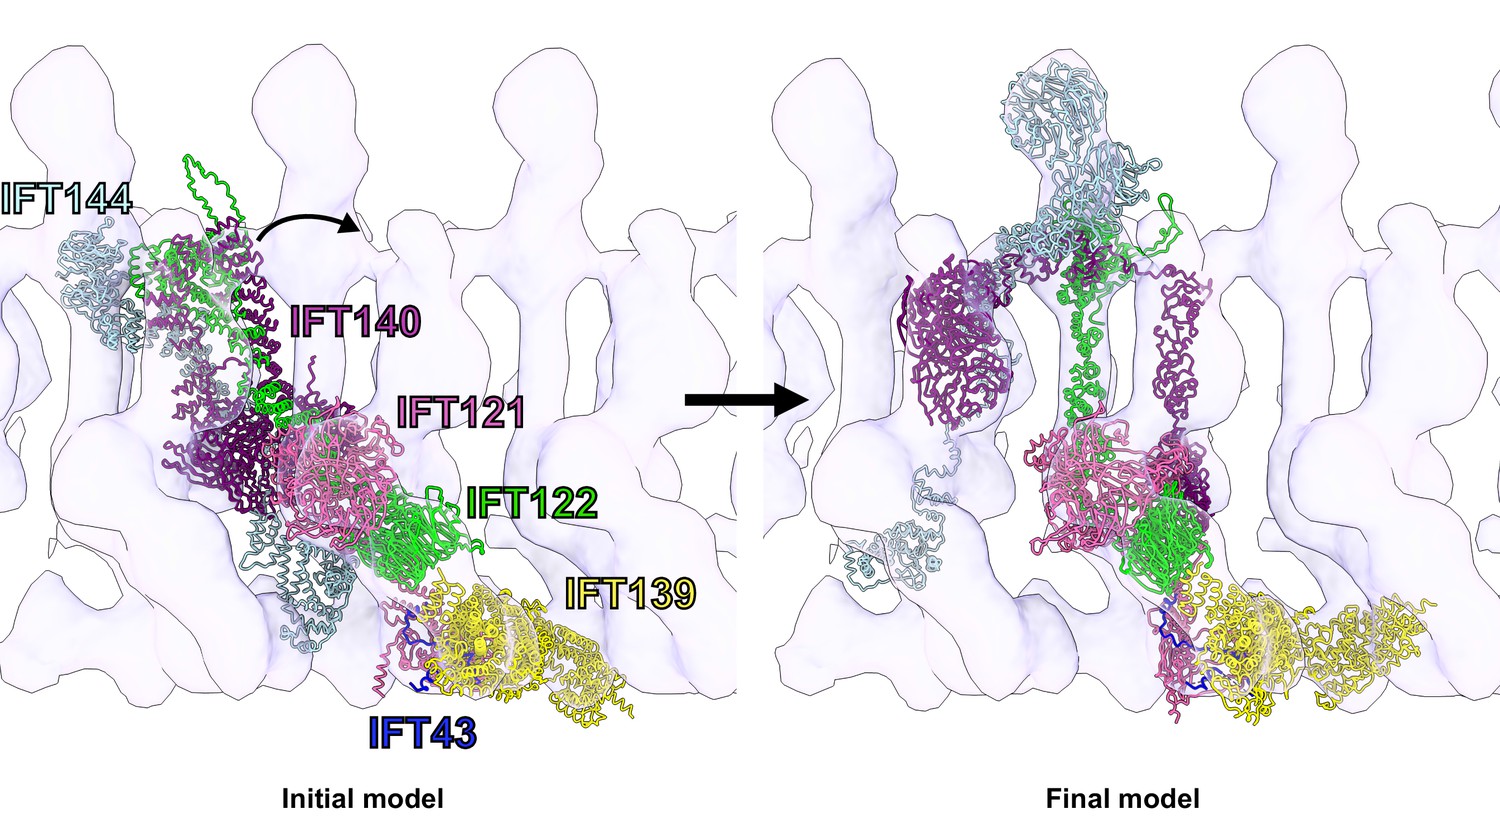
Flexible fitting of the IFT-A integrative model into the 23 Å subtomogram average of an anterograde IFT-A train.
The starting position of the IFT-A integrative model (left panel) was determined by rigidly docking the model into the subtomogram average cryo-ET density using the ChimeraX fit-in-map tool (Goddard et al., 2018). The final structure (right panel) was obtained by flexibly fitting into the density using Namdinator (Kidmose et al., 2019). Figure 4—video 1 provides a visualization of the IFT-A conformational changes required to fit the monomer into the polymeric train.
Figure 4—figure supplement 2

Independent 3D structural models of IFT-A derived by distinct workflows nonetheless compare favorably.
A comparison of our model (center panel), based on determining a monomeric structure using cross-linking mass spectrometry, AlphaFold2, and integrative modeling, followed by docking into a 23 Å subtomogram average of polymeric IFT-A, compares favorably with (left panel, reprinting Figure 5C of Hesketh et al., 2022) a monomeric structure determined by single particle cryo-EM then docked into a 30 Å subtomogram average of polymeric IFT-A, as well as with (right panel, reprinting Figure 4C of Lacey et al., 2022) a polymeric IFT-A model built into an 18 Å subtomogram average. Note the latter model omits IFT43 and the repeating IFT-A monomer adopts an alternative choice of neighboring IFT140/144 subunits, but otherwise shows similar packing of subunits within the cryo-ET density map. (Reprinted images are used with permission under CC-BY-NC-ND 4.0 International license and are unchanged apart from adding labels for clarity.).
© 2022, Hesketh et. al. The left panel is a reprinting of Figure 5C from Hesketh et al., 2022, which is made available under a CC-BY-NC-ND 4.0 International license. Any further reproduction must adhere to the terms of the original license.
© 2022, Lacey et al. The right panel is a reprinting of Figure 4C from Lacey et al., 2022, which is made available under a CC-BY-NC-ND 4.0 International license. Any further reproduction must adhere to the terms of the original license.
Figure 4—video 1
Fitting monomeric IFT-A into the anterograde train cryo-ET structure.
Figure 5
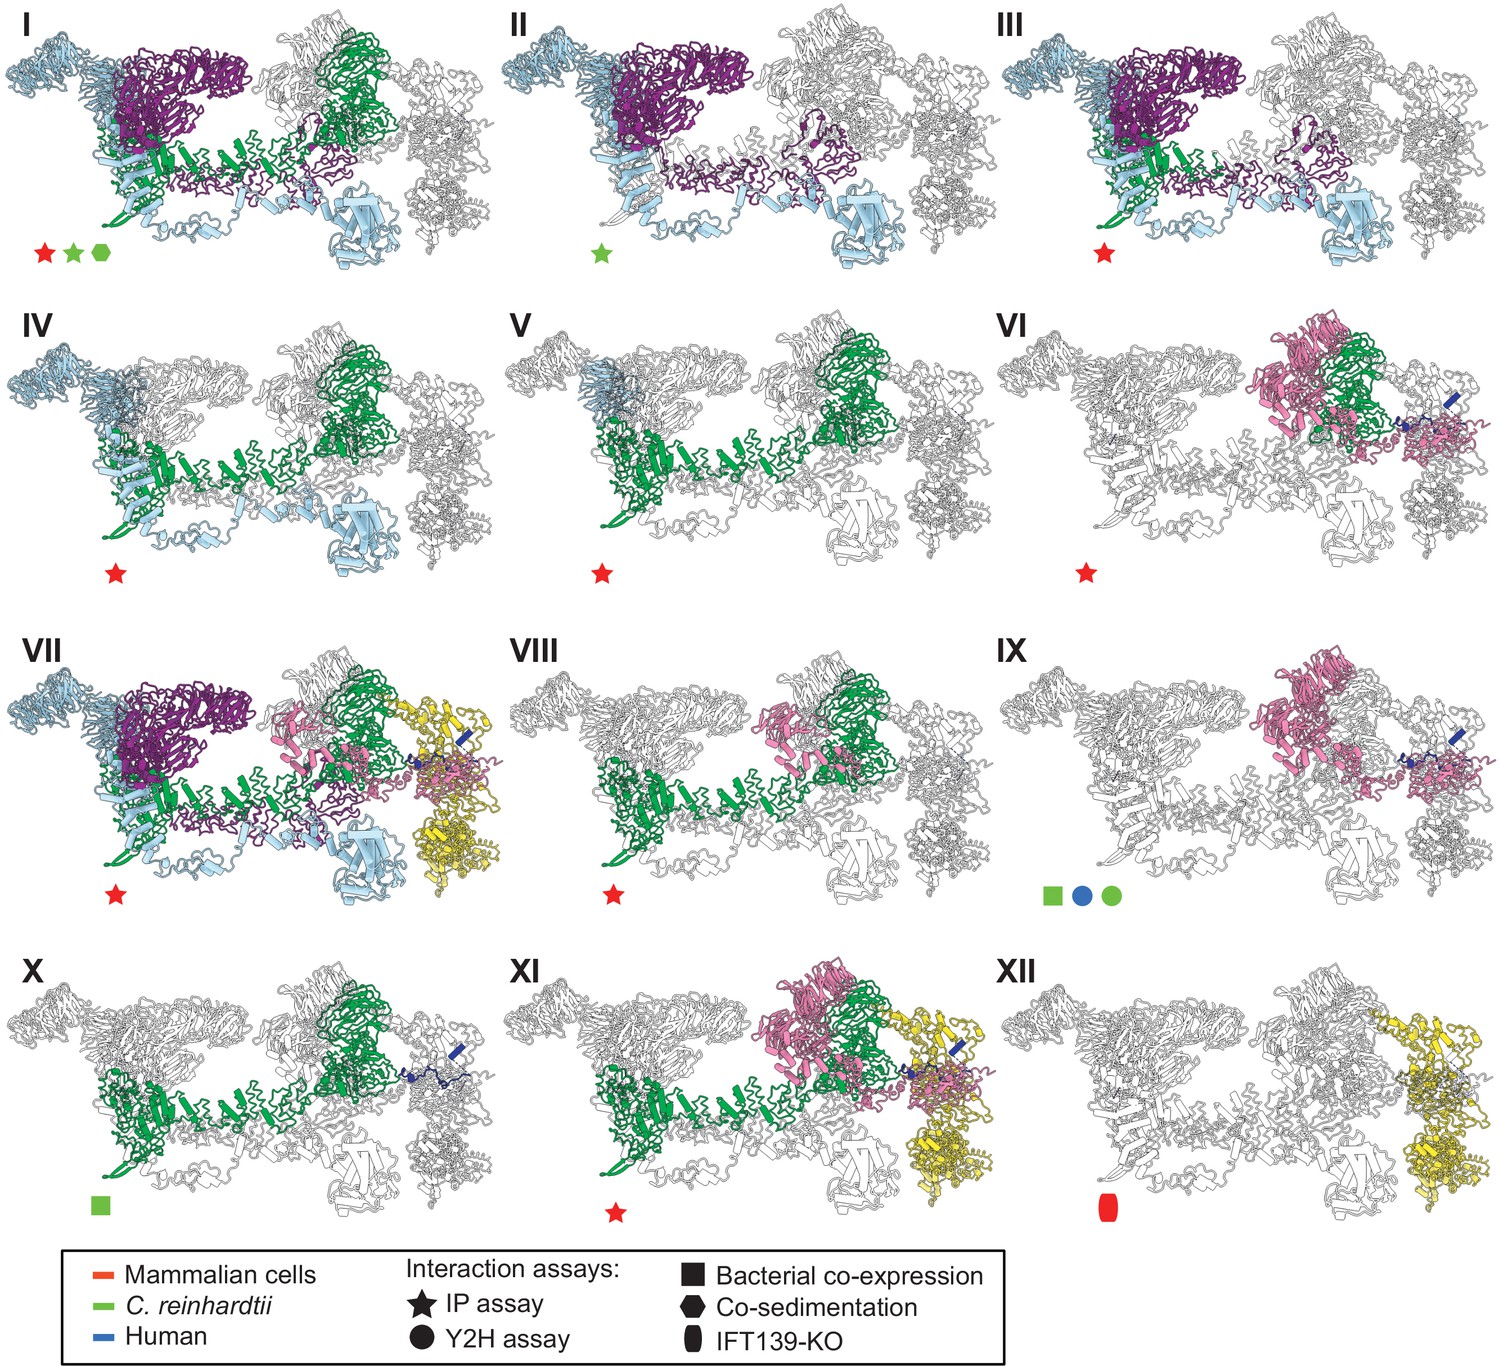
The IFT-A 3D model is highly concordant with literature evidence not used in modeling.
Panels I-XII highlight specific IFT-A intermolecular interactions, both at the protein and domain level, known from the literature (see the text for detailed discussion and citations). The interacting proteins or domains form direct contacts within the IFT-A model in all cases examined. Support for the interactions was observed across organisms, consistent with high conservation of the IFT-A complex across species. IP, immunoprecipitation; Y2H, yeast 2-hybrid; KO, knockout mutant. Proteins are colored as in Figure 4.
Figure 6 with 1 supplement
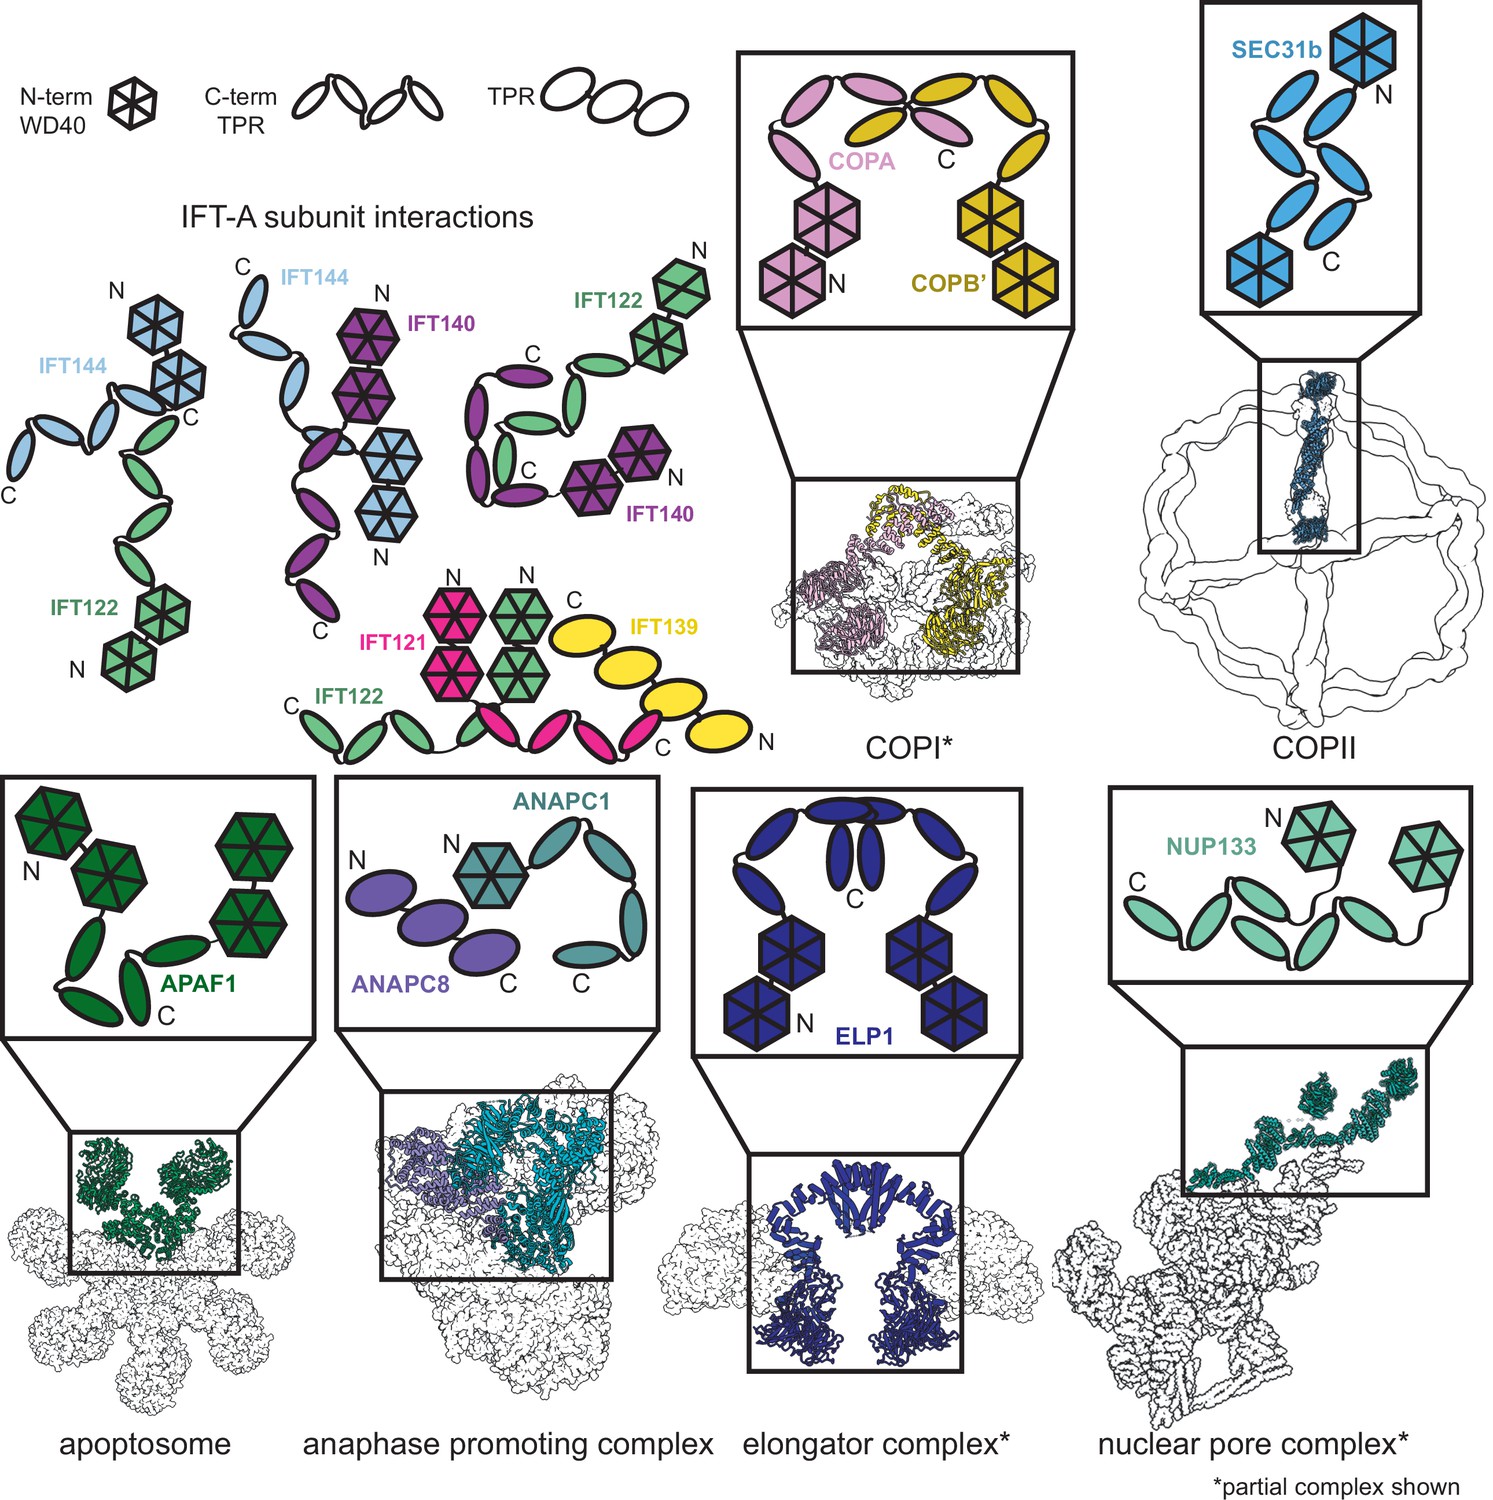
Proteins sharing IFT-A subunit domain architectures vary markedly in their quaternary assemblies.
By performing structure-based searches (Holm and Rosenström, 2010) of the set of AlphaFold2-predicted human protein structures (Tunyasuvunakool et al., 2021), we identified proteins that have a similar domain architecture to IFT121, IFT122, IFT140, and IFT144 (as in Figure 6—figure supplement 1). Colors highlight the role of these domains in depictions of native complexes containing proteins with these domain architectures. As in our model of the IFT-A complex, stable interactions between TPR domains underlie diverse macromolecular assemblies. COPI PDB: 5A1W (Dodonova et al., 2015), COPII PDB: 6ZL0 (Hutchings et al., 2021), apoptosome PDB: 5JUY (Cheng et al., 2016), anaphase promoting complex PDB: 5G05 (Zhang et al., 2016), elongator complex PDB: 5CQR (Xu et al., 2015), nuclear pore complex PDB: 7WB4 (Huang et al., 2022).
Figure 6—figure supplement 1

Proteins from the human proteome that are structurally similar to IFT121, 122, 140, and 144.
IFT121, IFT122, IFT140, and IFT144 were individually searched against AlphaFold-predicted human protein structures (Tunyasuvunakool et al., 2021) using DALI (Holm and Rosenström, 2010) to identify other proteins that are structurally similar and share domain architectures.
Figure 7
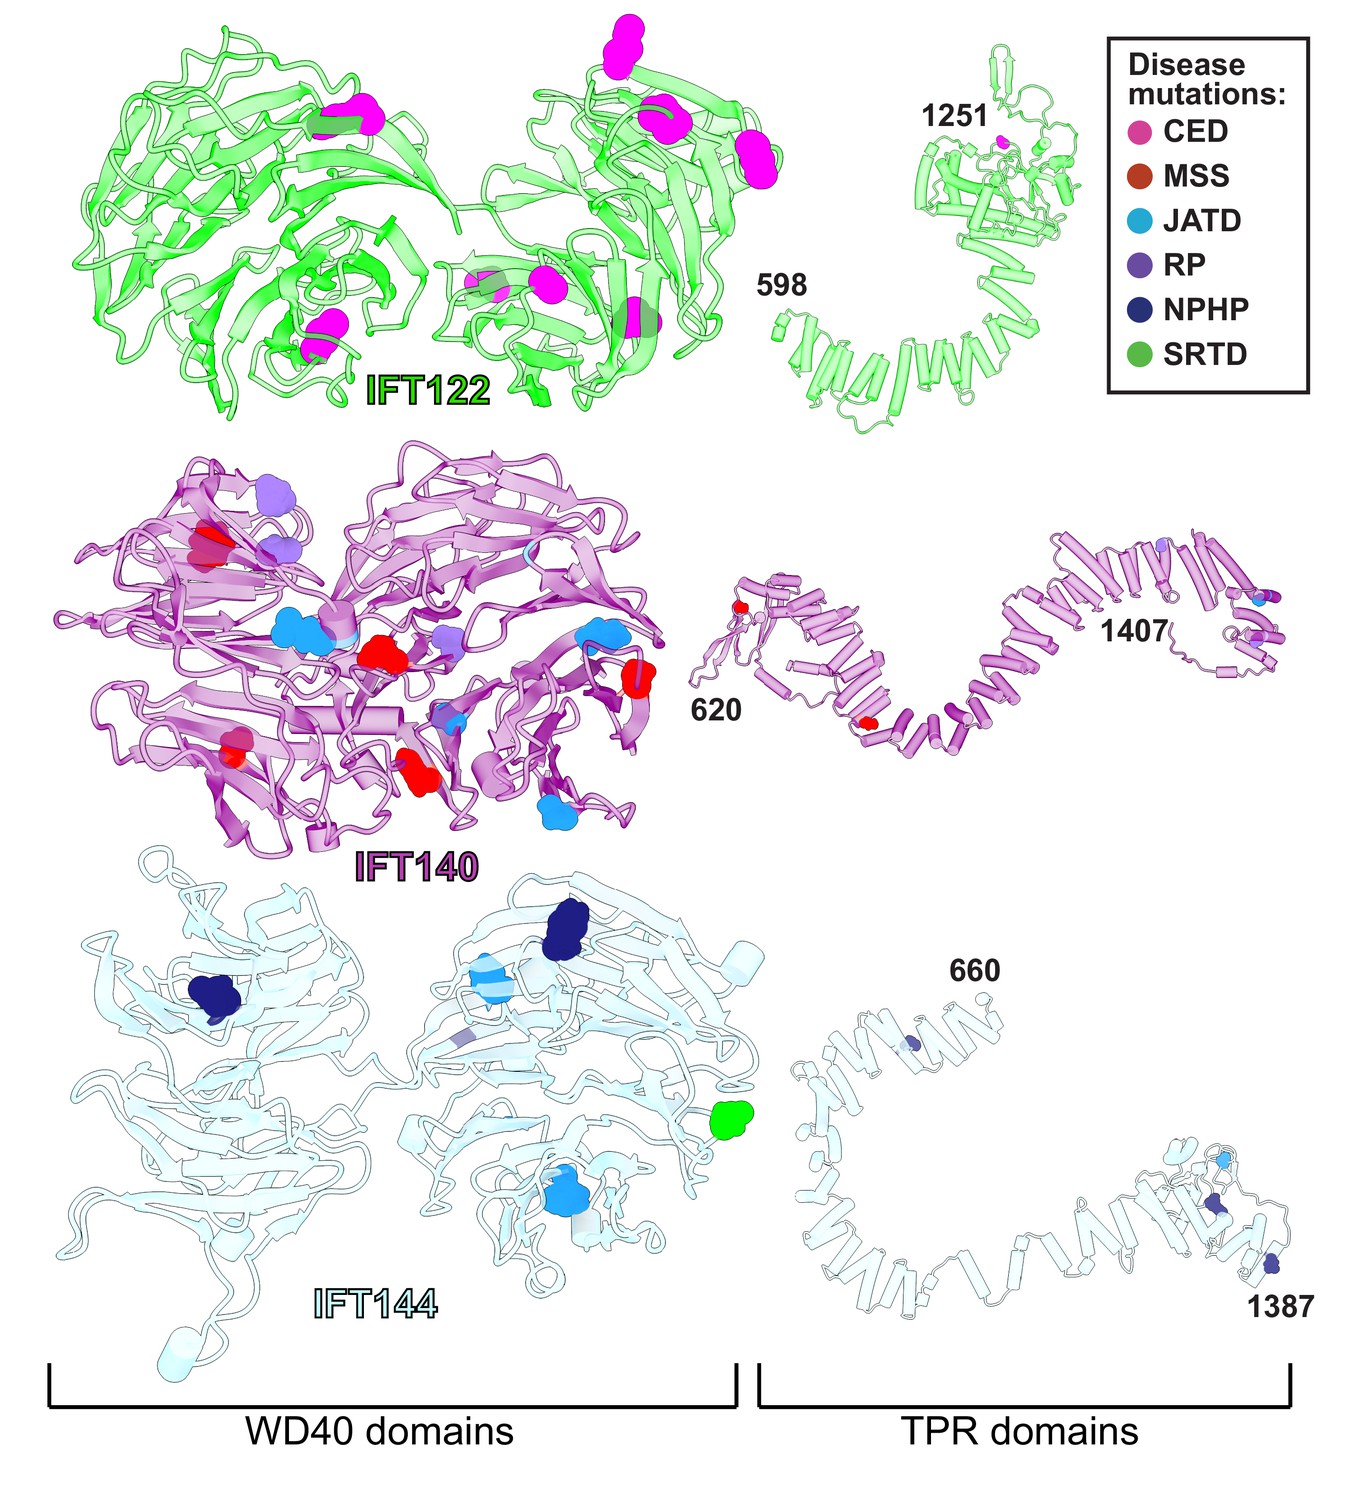
WD40 domains of IFT-A core proteins are hotspots for disease-causing missense mutations.
Disease-causing missense mutations are displayed on the structures of IFT122, IFT140, and IFT144 (IFT-A core) and colored by disease. 79% of the mutations on the IFT-A core proteins are concentrated in the WD40 domains of these proteins. The mutations are located in the exposed regions of the domains and do not interfere with other IFT-A interactions suggesting they may disrupt more transient interactions formed between IFT-A and its cargos. TPR domains are shown smaller in scale relative to WD40 domains for display purposes. CED, cranioectodermal dysplasia; JATD, Jeune asphyxiating thoracic dystrophy; NPHP, nephronophthisis; MSS, Mainzer-Saldino syndrome; RP, retinitis pigmentosa; SRTD, short-rib thoracic dysplasia.
Figure 8
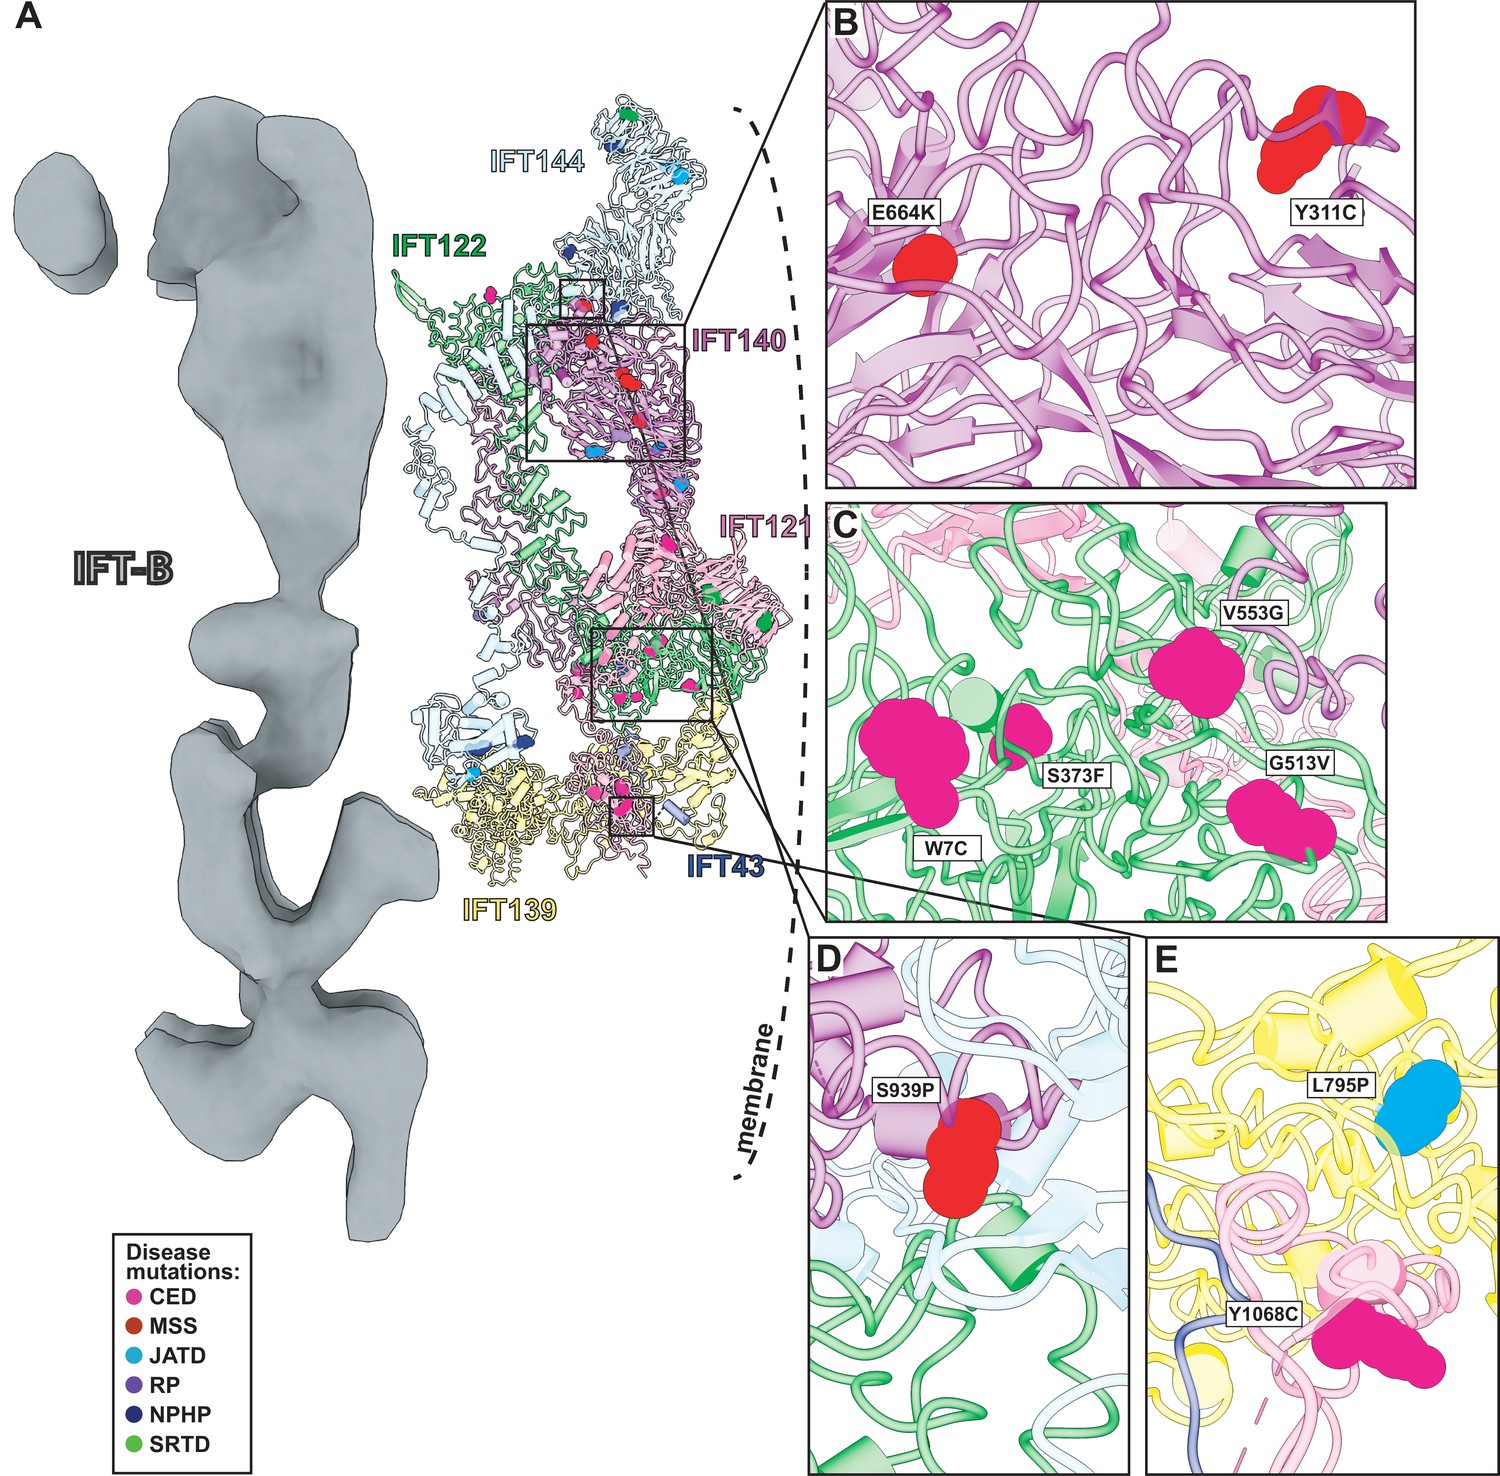
Human disease mutations form clusters on exposed WD40 domains and interaction interfaces of the IFT-A complex.
(A) Human disease mutations are mapped onto our IFT-A structure with missense mutations colored by disease. The dotted line indicates the ciliary membrane. (B) The closeup of MSS variants E664K and Y311C, which are located among many other disease-causing variants on the WD40 domains of IFT140. (C) A closeup of CED alleles on the WD40 domain of IFT122 are positioned under the membrane and nearby IFT121. (D) IFT140 MSS variant S939P lies at the interaction interface with proteins IFT122 and IFT144. (E) A closeup of CED variant Y1068C of IFT121 and its proximity to neighboring proteins, IFT43 and IFT139. The closeup also captures JATD variant L795P of IFT139 and its location near the interaction interface with IFT121. Abbreviations are provided in the Figure 7 legend.
Tables
Table 1
Cryo-ET data collection and processing statistics.
| IFT-A complex (EMD-26791) | |
|---|---|
| Data collection | |
| Magnification | 30,000 |
| Voltage (kV) | 300 |
| Electron exposure (e–/Å2) | 100–140 |
| Defocus range (μm) | –3 to –6 |
| Pixel size (Å) | 14.13 (bin6), 7.08 (bin3) |
| Tilt-range/step (°) | ±64° / 2 |
| Processing | |
| Symmetry imposed | C1 |
| Final particle images (no.) | 9350 |
| Map resolution (Å) | 23 |
| FSC threshold | 0.5 |
Key resources table
| Reagent type (species) or resource | Designation | Source or reference | Identifiers | Additional information |
|---|---|---|---|---|
| Gene (Tetrahymena thermophila) | IFT43 | Uniprot | Q22NF5 | |
| Gene (Tetrahymena thermophila) | IFT121 | Uniprot | Q22U89 | |
| Gene (Tetrahymena thermophila) | IFT122 | Uniprot | Q244W3 | |
| Gene (Tetrahymena thermophila) | IFT139 | Uniprot | I7MFN3 | |
| Gene (Tetrahymena thermophila) | IFT140 | Uniprot | I7LVZ7 | |
| Gene (Tetrahymena thermophila) | IFT144 | Uniprot | Q22BP2 | |
| Strain, strain background (Tetrahymena thermophila) | SB715 | Tetrahymena Stock Center (Cornell University, Ithaca, NY) | SB715 | |
| Software, algorithm | Integrative Modeling Platform (IMP) software | https://github.com/salilab/imp | ||
| Software, algorithm | AlphaFold2 software | Colab version (https://colab.research.google.com/github/sokrypton/ColabFold/blob/main/AlphaFold2.ipynb) | ||
| Software, algorithm | AlphaFold-Multimer | https://github.com/deepmind/alphafold | ||
| Software, algorithm | Namdinator | https://namdinator.au.dk/namdinator/ | ||
| Software, algorithm | SerialEM | https://bio3d.colorado.edu/SerialEM/download.html | ||
| Software, algorithm | K2Align | https://github.com/dtegunov/k2align | ||
| Software, algorithm | IMOD | https://bio3d.colorado.edu/imod/ | ||
| Software, algorithm | ChimeraX | https://www.cgl.ucsf.edu/chimerax/download.html | ||
| Software, algorithm | DigitalMicrograph | https://www.gatan.com/products/tem-analysis/gatan-microscopy-suite-software | ||
| Software, algorithm | Proteome Discoverer 2.3 | Thermo Fisher Scientific |
Additional files
Download links
A two-part list of links to download the article, or parts of the article, in various formats.
Downloads (link to download the article as PDF)
Open citations (links to open the citations from this article in various online reference manager services)
Cite this article (links to download the citations from this article in formats compatible with various reference manager tools)
Integrative modeling reveals the molecular architecture of the intraflagellar transport A (IFT-A) complex
eLife 11:e81977.
https://doi.org/10.7554/eLife.81977


