Alternative splicing downstream of EMT enhances phenotypic plasticity and malignant behavior in colon cancer
- Department of Pathology, Erasmus University Medical Center, Netherlands
- Laboratory of Genetics and Developmental Biology, Institute Curie, France
- Institute of Biological and Chemical Systems - Functional Molecular Systems (IBCS FMS), Karlsruhe Institute of Technology, Germany
- Faculty of Medicine, University of Valparaiso, Chile
Figures
Figure 1 with 1 supplement
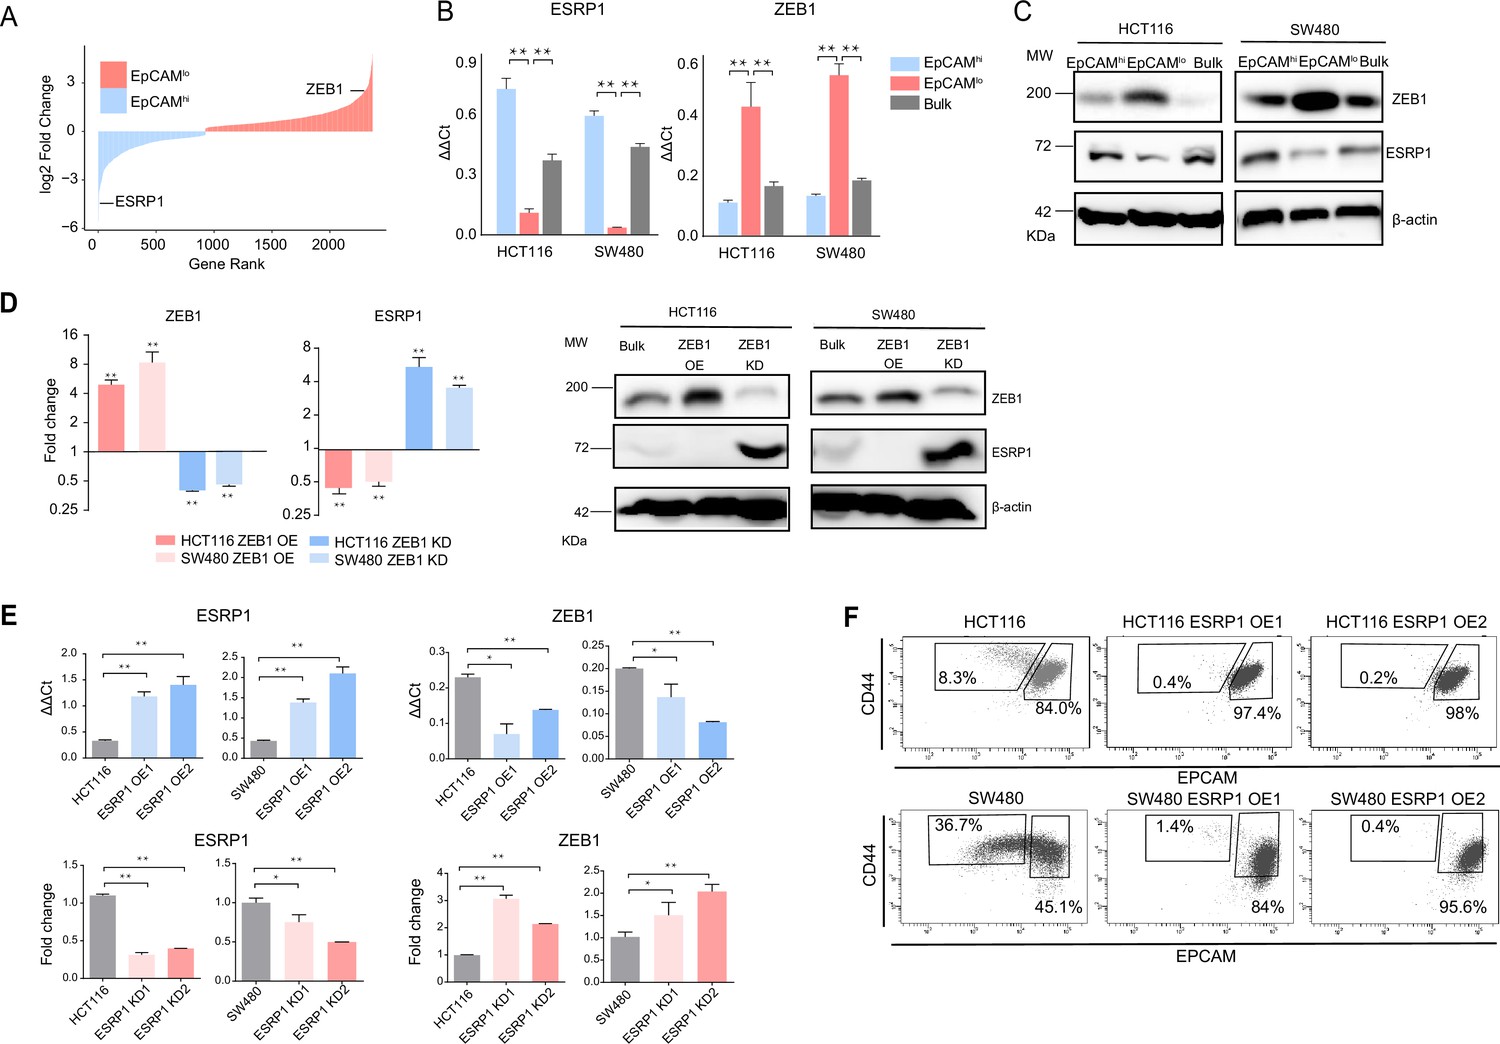
ZEB1 and ESRP1 differential expression in quasi-mesenchymal and highly metastatic EpCAMlo colon cancer cells.
(A) Gene rank plot showing differentially expressed genes between EpCAMhi and EpCAMlo with combined analysis of HCT116 and SW480. (B) RT-qPCR ESRP1 and ZEB1 expression analysis of HCT116 and SW480 EpCAMhi, EpCAMlo, and bulk subpopulations. GAPDH expression was used as control (means ± SEM, n=3). **=p < 0.01. (C) ESRP1 and ZEB1 western analysis in HCT116 and SW480 EpCAMhi, EpCAMlo, and bulk fractions. β-Actin was used as loading control. (D) RT-qPCR and western analysis of ZEB1 and ESRP1 expression in ZEB1-OE and -KD HCT116 and SW480 cells. Expression values were normalized in each sample with those from the parental HCT116 and SW480 cell lines. HCT116 and SW480 cells transduced with the shZEB1 lentivirus were induced by 1 µg/mL doxycycline for 72 hr. Expression values were normalized with those from non-induced cells; GAPDH expression was employed as control (means ± SEM, n=3). *=p < 0.05, **=p < 0.01. β-Actin was used as loading control. (E) RT-qPCR ZEB1 and ESRP1 expression analysis in ESRP1-OE and -KD HCT116 and SW480 cells. Two independent ESRP1-OE clones were selected for each cell line. Expression values were normalized in each sample with those from the parental HCT116 and SW480 cell lines. HCT116 and SW480 cells transduced with the shESRP1 lentivirus were induced by 1 µg/mL doxycycline for 72 hr. Two independent clones were selected for each cell line. Expression values were normalized with those from non-induced cells; GAPDH expression was employed as control (means ± SEM, n=3). *=p < 0.05, **=p < 0.01. (F) CD44/EpCAM FACS analysis of HCT116 and SW480 EpCAMlo and EpCAMhi subpopulations in ESRP1-OE cells. Two independent clones are shown for each cell lines.
-
Figure 1—source data 1
Original files and labelled bands of western blots in Figure 1C–D.
- https://cdn.elifesciences.org/articles/82006/elife-82006-fig1-data1-v2.pdf
Figure 1—figure supplement 1
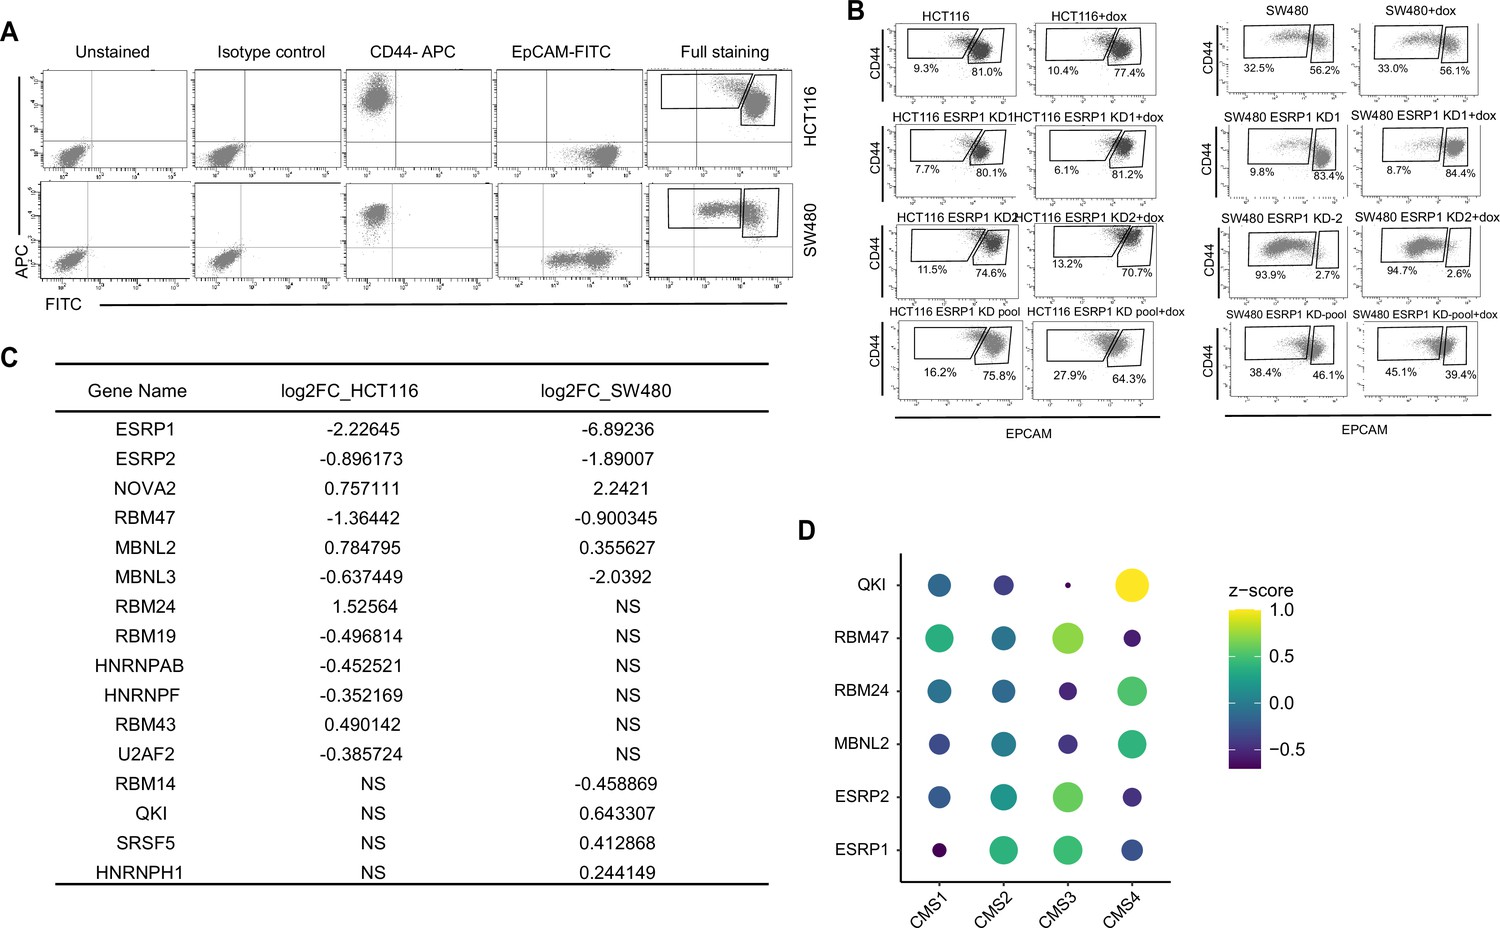
ESRP1 and RNA-binding proteins (RBPs) functional and expression analysis in cell lines and patient-derived colon cancers.
(A) FACS isotype and compensation controls in the analysis of the HCT116 and SW480 cell lines. The gates relative to the EpCAMhi/lo subpopulations are specifically designed for the HCT116 and SW480 cell lines, as shown for the full staining. For the sake of simplicity and readability, the quadrants showing negative, single positive, and double positive regions have not been repeated in the figures encompassing FACS analyses. (B) CD44/EpCAM FACS analysis of EpCAMlo and EpCAMhi subpopulations in ESRP1-KD (shESRP1-transduced) HCT116 and SW480 cells. Cells were induced with 1 µg/mL doxycycline for 72 hr before analysis. (C) List of RBPs differentially expressed between EpCAMlo and EpCAMhi subpopulation in SW480 and HCT116. The RBPs’ list was from reference (Fu and Ares, 2014). (D) Dot plot analysis of the z-score scaled RBPs’ expression values across the four colon cancer consensus molecular subtypes (CMS; annotated according to Guinney et al., 2015). RNAseq data were obtained from the COAD (COlon-ADenoma) tumors of The Cancer Genome Atlas (TCGA) deposited in the TCGA Splicing Variants Database (TSVdb) (n=206 primary tumors).
Figure 2 with 1 supplement

ESRP1 downregulation in EpCAMlo colon cancer cells affects alternative splicing (AS) of CD44 and NUMB among a broad spectrum of downstream target genes.
(A) Heatmap of common AS events between RNAseq data from a previous ESRP1-KD study in human non-small cell lung cancer cells (H358) (Yang et al., 2016) and our own HCT116 and SW480 EpCAMhi and EpCAMlo RNAseq data (Sacchetti et al., 2021). The gene list on the right of the heatmap encompasses AS variants earmarked by ΔPSI (differential percentage spliced in) > 0.1. (B) CD44 and NUMB exon peak plots relative to the AS analysis of the RNAseq data obtained from a previous ESRP1-KD study in human non-small cell lung cancer cells (H358; upper graph) (Yang et al., 2016) and from our own HCT116 (middle graph) and SW480 (lower graph) EpCAMhi/lo analysis (Sacchetti et al., 2021). Each peak plot depicts the expression of specific exons; the height of each peak is indicative of the expression level of the specific exons. CD44v: CD44 exons v2 to v10. CD44v and CD44s, and NUMB exon 12 is highlighted by gray rectangles. (C) RT-qPCR expression analysis of CD44s, CD44v6, NUMB1/3, and NUMB2/4 isoforms in HCT116 and SW480 EpCAMhi, EpCAMlo, and bulk subpopulations. Expression of the constitutive CD44 and NUMB exons was employed to normalize the results (means ± SEM, n=3). **=p < 0.01. (D) Western analysis of CD44s, CD44v6, and NUMB isoforms in HCT116 and SW480 EpCAMhi, EpCAMlo, and bulk subpopulations. Please note that the molecular weight of CD44v6 is expected to range between 80 and 150 kDa (Azevedo et al., 2018, Ponta et al., 2003). β-Actin was used as loading control.
-
Figure 2—source data 1
Original files and labelled bands of western blots in Figure 2D.
- https://cdn.elifesciences.org/articles/82006/elife-82006-fig2-data1-v2.pdf
Figure 2—figure supplement 1
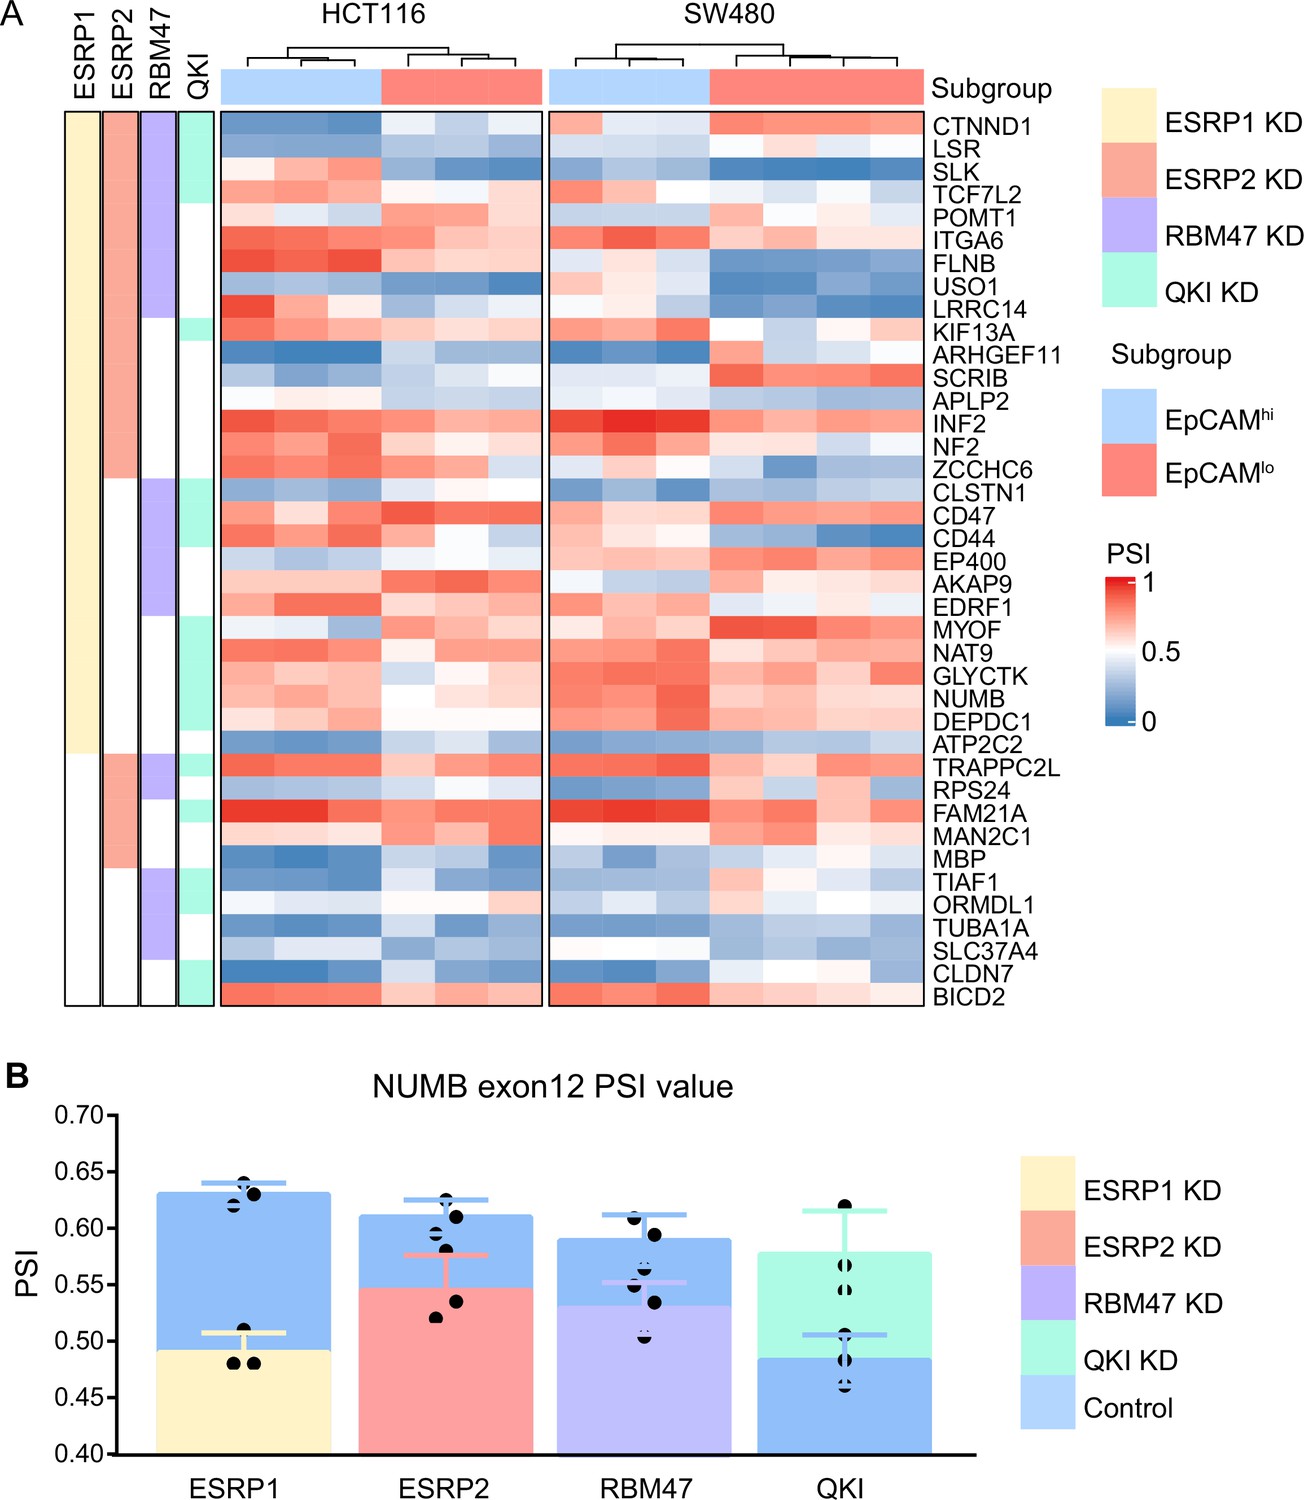
ESRP1/2-, RBM47-, and QKI-regulated alternative splicing (AS) targets.
(A) Heatmap of the AS events observed by comparing previously published RNAseq data from RBP-KD studies (ESRP1-KD in H358 Yang et al., 2016, ESRP2-KD in LNCaP Nieto et al., 2016, RBM47-KD in H358 Yang et al., 2016, and QKI-KD in CAL27; GEO Accession: GSM4677985) with our own HCT116/SW480 EpCAMhi/lo RNAseq data (Sacchetti et al., 2021). Shared AS targets between RBPs KD cells, and HCT116/SW480 EpCAMhi/lo subpopulations are shown. The gene list on the right side of the heatmap encompasses variants earmarked by ΔPSI (differential percentage spliced in) >0.1. The colored bars on the left of the heatmap shows if there are variants spliced by different RNA-binding proteins (RPBs). Color in white means AS is not involved in. (B) PSI value of NUMB exon 12 between ESRP1 KD, ESRP2 KD, RBM47 KD, QKI KD, and control cells.
Figure 3 with 2 supplements
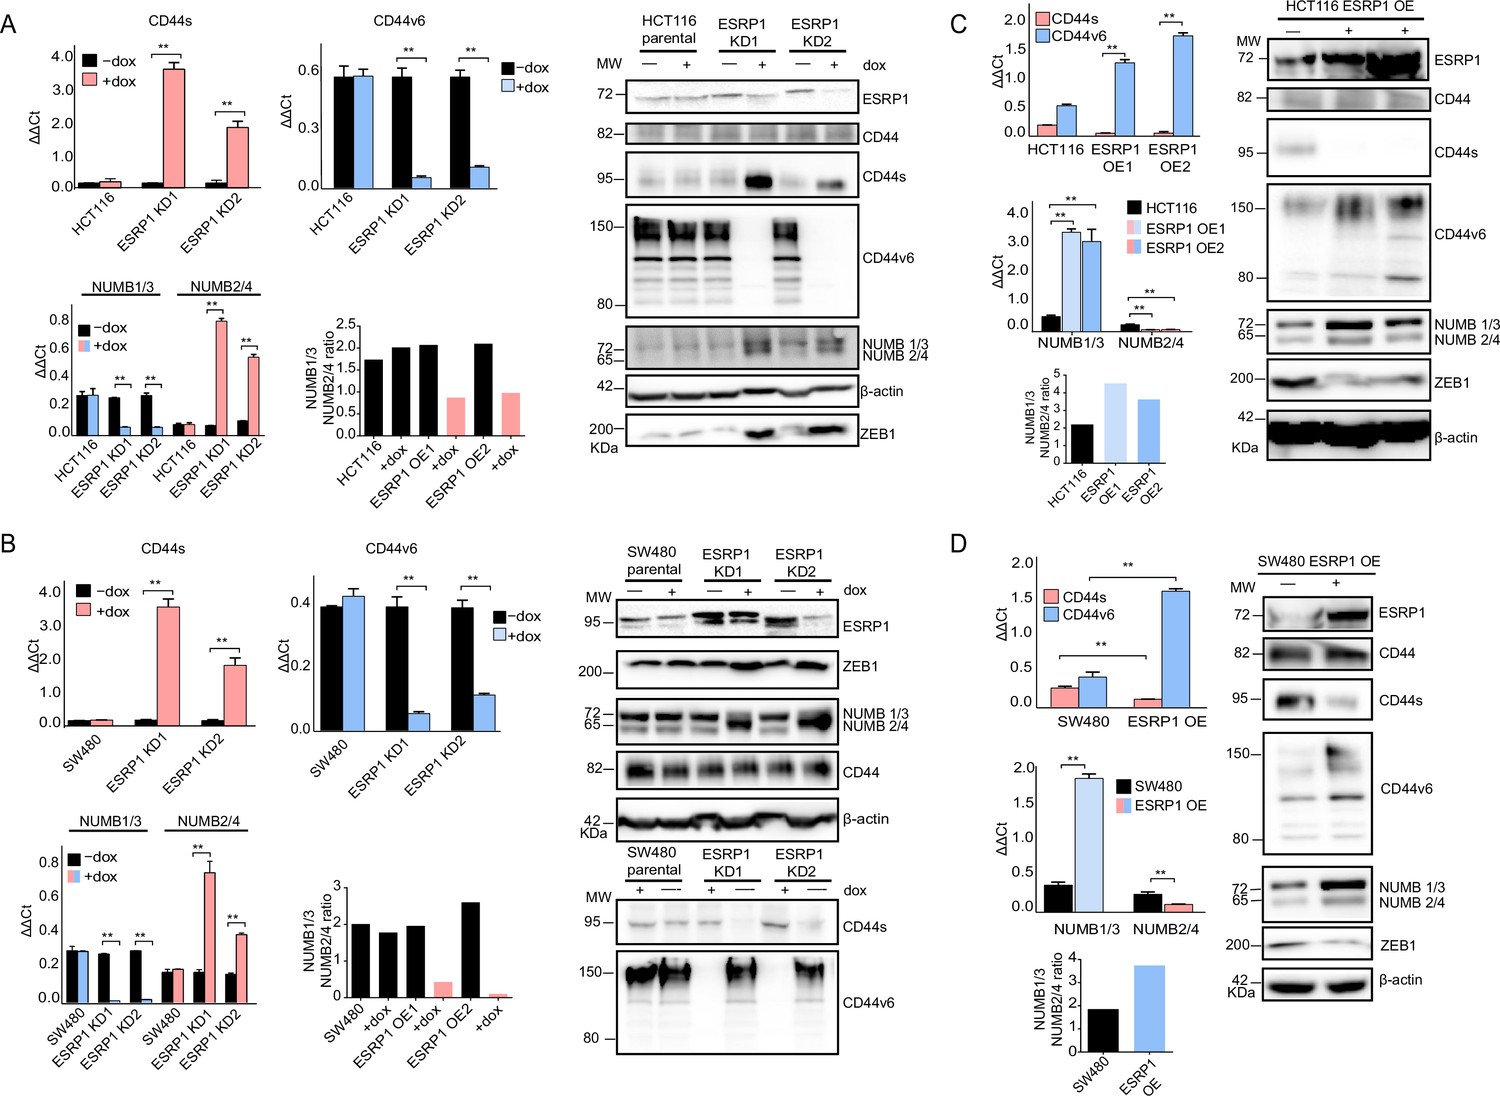
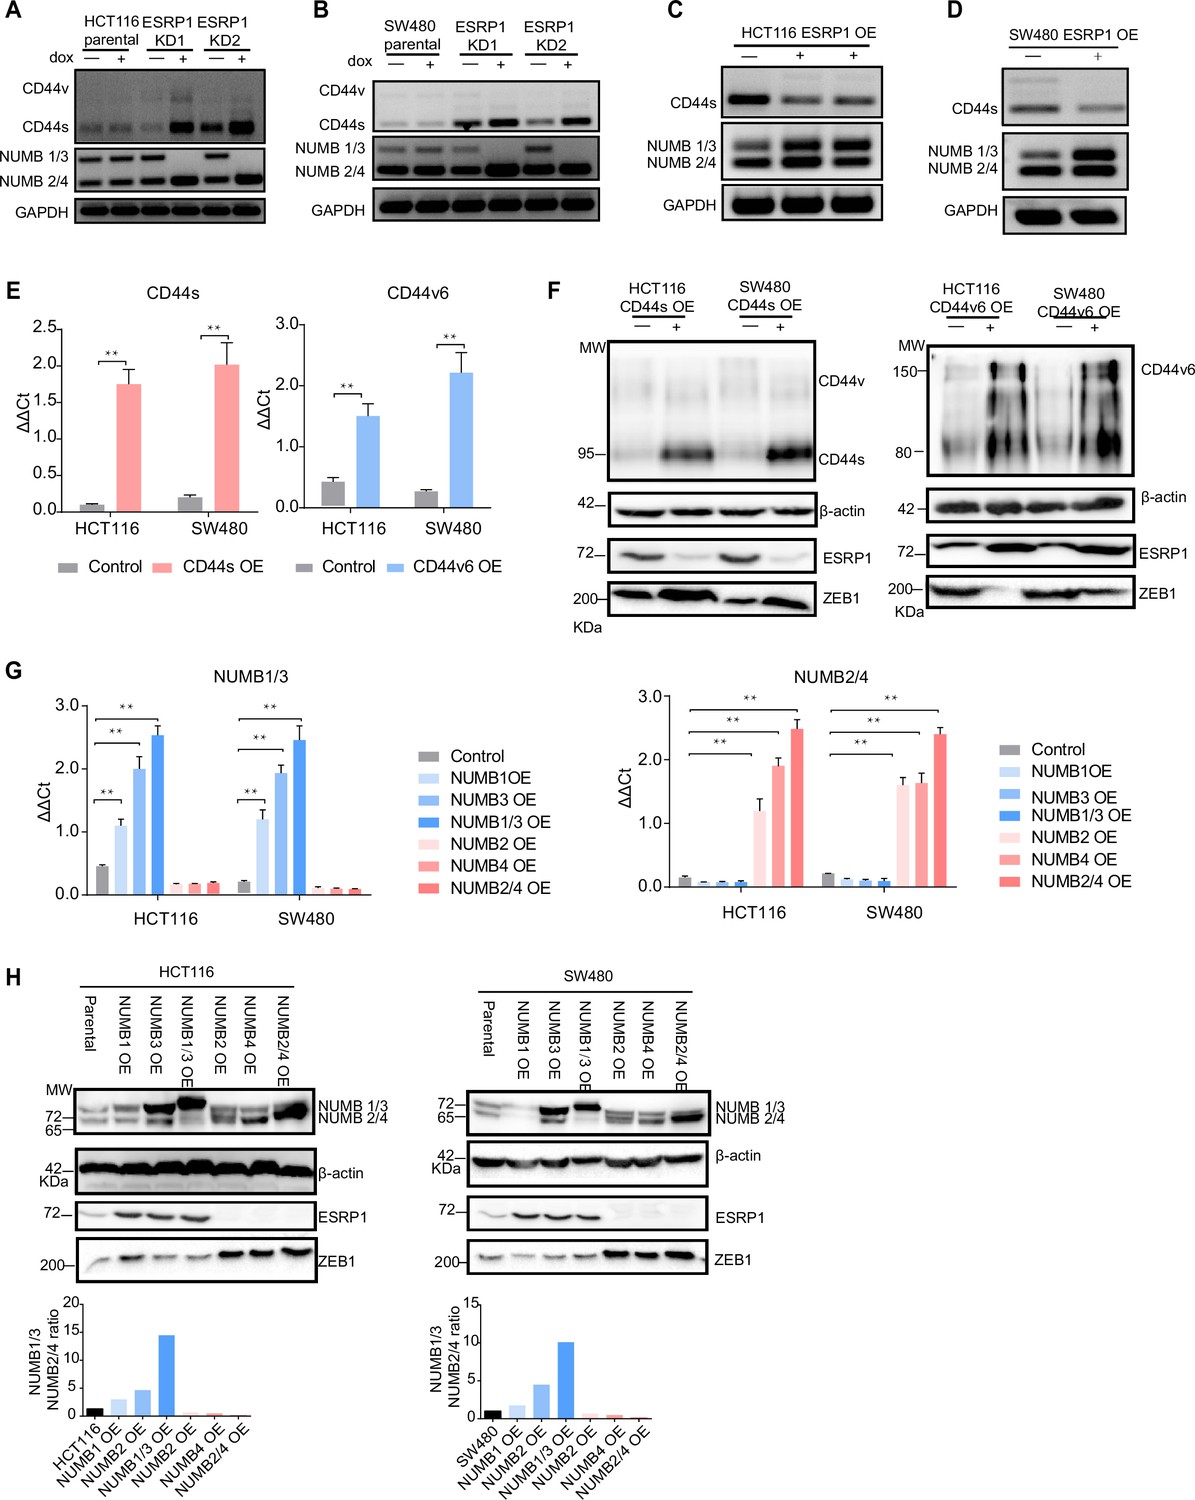
ESRP1 differential expression regulates CD44 and NUMB alternative splicing (AS) isoforms expression.
(A) RT-qPCR (left histogram panels) and western (right panel) analysis of CD44 and NUMB isoforms expression in ESRP1-KD (shESRP1-transduced) HCT116 cells. Two independent HCT116 ESRP1-KD clones were employed. Cells were induced with 1 µg/mL doxycycline for 72 hr before analysis. Expression of the constitutive CD44 and NUMB exons was employed to normalize the results (means ± SEM, n=3). **=p < 0.01. The ratio of NUMB1/3 and NUMB2/4 bands was quantified by ImageJ and shown in bar plot. Please note that the molecular weight of CD44v6 is expected to range between 80 and 150 kDa (Azevedo et al., 2018, Ponta et al., 2003). β-Actin was used as loading control for western blots. (B) RT-qPCR (left histogram panels) and western (right panel) analysis of CD44 and NUMB isoforms expression in ESRP1-KD (shESRP1-transduced) SW480 cells. Two independent SW480 ESRP1-KD clones were employed. Cells were induced with 1 µg/mL doxycycline for 72 hr before analysis. Expression of the constitutive CD44 and NUMB exons was employed to normalize the results (means ± SEM, n=3). **=p < 0.01. The ratio of NUMB1/3 and NUMB2/4 bands was quantified by ImageJ and shown in bar plot. Please note that the molecular weight of CD44v6 is expected to range between 80 and 150 kDa (Azevedo et al., 2018, Ponta et al., 2003). β-Actin was used as loading control for western blots. (C) RT-qPCR (left histogram panels) and western (right panel) analysis of CD44 and NUMB isoforms expression in ESRP1-OE HCT116 cells. Two independent HCT116 ESRP1-OE clones were employed. Expression of the constitutive CD44 and NUMB exons was employed to normalize the results (means ± SEM, n=3). **=p < 0.01. The ratio of NUMB1/3 and NUMB2/4 bands was quantified by ImageJ and shown in bar plot. Please note that the molecular weight of CD44v6 is expected to range between 80 and 150 kDa (Azevedo et al., 2018, Ponta et al., 2003). β-Actin was used as loading control for western blots. (D) RT-qPCR (left histogram panels) and western (right panel) analysis of CD44 and NUMB isoforms expression in ESRP1-OE SW480 cells. Expression of the constitutive CD44 and NUMB exons was employed to normalize the results (means ± SEM, n=3). **=p < 0.01. The ratio of NUMB1/3 and NUMB2/4 bands was quantified by ImageJ and shown in bar plot. Please note that the molecular weight of CD44v6 is expected to range between 80 and 150 kDa (Azevedo et al., 2018, Ponta et al., 2003). β-Actin was used as loading control for western blots.
-
Figure 3—source data 1
Original files and labelled bands of western blots in Figure 3A.
- https://cdn.elifesciences.org/articles/82006/elife-82006-fig3-data1-v2.pdf
-
Figure 3—source data 2
Original files and labelled bands of western blots in Figure 3B.
- https://cdn.elifesciences.org/articles/82006/elife-82006-fig3-data2-v2.pdf
-
Figure 3—source data 3
Original files and labelled bands of western blots in Figure 3C.
- https://cdn.elifesciences.org/articles/82006/elife-82006-fig3-data3-v2.pdf
-
Figure 3—source data 4
Original files and labelled bands of western blots in Figure 3D.
- https://cdn.elifesciences.org/articles/82006/elife-82006-fig3-data4-v2.pdf
Figure 3—figure supplement 1
ESRP1, CD44, and NUMB isoforms analysis in overexpressing and knockdown (KD) colon cancer cell lines.
RT-PCR analysis of CD44 and NUMB isoforms expression in HCT116 (A) and SW480 (B) ESRP1-KD (shESRP1-transduced) cells, and in HCT116 (C) and SW480 (D) ESRP1-OE cells. Cells were induced with 1 µg/mL doxycycline for 72 hr before RNA isolation. GAPDH was used as control. (E) RT-qPCR analysis of CD44s and CD44v6 expression in HCT116 and SW480 CD44s- (left), and CD44v6-OE (right) cells. Expression of the constitutive CD44 exons was employed to normalize the results (means ± SEM, n=3). **=p < 0.01. (F) Western analysis of CD44, ESRP1, and ZEB1 expression in HCT116 and SW480 CD44s- (left), and CD44v6-OE (right) cells. Please note that the molecular weight of CD44v6 is expected to range between 80 and 150 kDa (Azevedo et al., 2018, Ponta et al., 2003). β-Actin was used as loading control for western blots. (G) RT-PCR analysis of NUMB1-4 isoforms expression in HCT116 and SW480 NUMB1-4 OE cells. Expression of the constitutive NUMB exons was employed to normalize the results (means ± SEM, n=3). **=p < 0.01. (H) Western analysis of NUMB1-4 isoforms, ESRP1, and ZEB1 expression in HCT116 and SW480 NUMB1-4 OE cells (upper panels). The ratio of NUMB1/3 and NUMB2/4 bands was quantified by ImageJ and shown in bar plot (lower histogram panels). β-Actin was used as loading control for western blots.
-
Figure 3—figure supplement 1—source data 1
Original files and labelled bands of PCR gels in Figure 3—figure supplement 1A.
- https://cdn.elifesciences.org/articles/82006/elife-82006-fig3-figsupp1-data1-v2.pdf
-
Figure 3—figure supplement 1—source data 2
Original files and labelled bands of PCR gels in Figure 3—figure supplement 1B.
- https://cdn.elifesciences.org/articles/82006/elife-82006-fig3-figsupp1-data2-v2.pdf
-
Figure 3—figure supplement 1—source data 3
Original files and labelled bands of PCR gels in Figure 3—figure supplement 1C.
- https://cdn.elifesciences.org/articles/82006/elife-82006-fig3-figsupp1-data3-v2.pdf
-
Figure 3—figure supplement 1—source data 4
Original files and labelled bands of PCR gels in Figure 3—figure supplement 1.
- https://cdn.elifesciences.org/articles/82006/elife-82006-fig3-figsupp1-data4-v2.pdf
-
Figure 3—figure supplement 1—source data 5
Original files and labelled bands of western blots in Figure 3—figure supplement 1.
- https://cdn.elifesciences.org/articles/82006/elife-82006-fig3-figsupp1-data5-v2.pdf
-
Figure 3—figure supplement 1—source data 6
Original files and labelled bands of western blots in Figure 3—figure supplement 1.
- https://cdn.elifesciences.org/articles/82006/elife-82006-fig3-figsupp1-data6-v2.pdf
Figure 3—figure supplement 2

CD44 and NUMB isoform-specific expression affects cell migration and Notch signaling activation.
(A) Migration assay analysis of HCT116 CD44s-, CD44v6-, and NUMB1/4-OE cells. EpCAMlo and EpCAMhi cells were used as controls. Each bar represents the mean ± SD of cells migrated to the bottom of the transwell from two independent experiments. (n=3) (B) Migration assay analysis of SW480 CD44s-, CD44v6-, and NUMB1/4-OE cells. EpCAMlo and EpCAMhi cells were used as controls. Each bar represents the mean ± SD of cells migrated to the bottom of the transwell from two independent experiments. (n=3) (C) RT-qPCR analysis of EMT-TFs in HCT116 and SW480 CD44s-, CD44v6-, and NUMB1/4-OE cells. GAPDH expression was used as control, normalized with the HCT116 or SW480 parental in each sample (means ± SEM, n=3). Increased gene expression is depicted by red bars, whereas downregulation – when compared with parental cells – is shown by blue bar. (D) RT-qPCR analysis of the Notch signaling pathway markers HES1, HEY1, and ID2 in HCT116 and SW480 NUMB1/4-OE cells. GAPDH expression was used as control (means ± SEM, n=3). *=p < 0.05; **=p < 0.01.
Figure 4 with 1 supplement
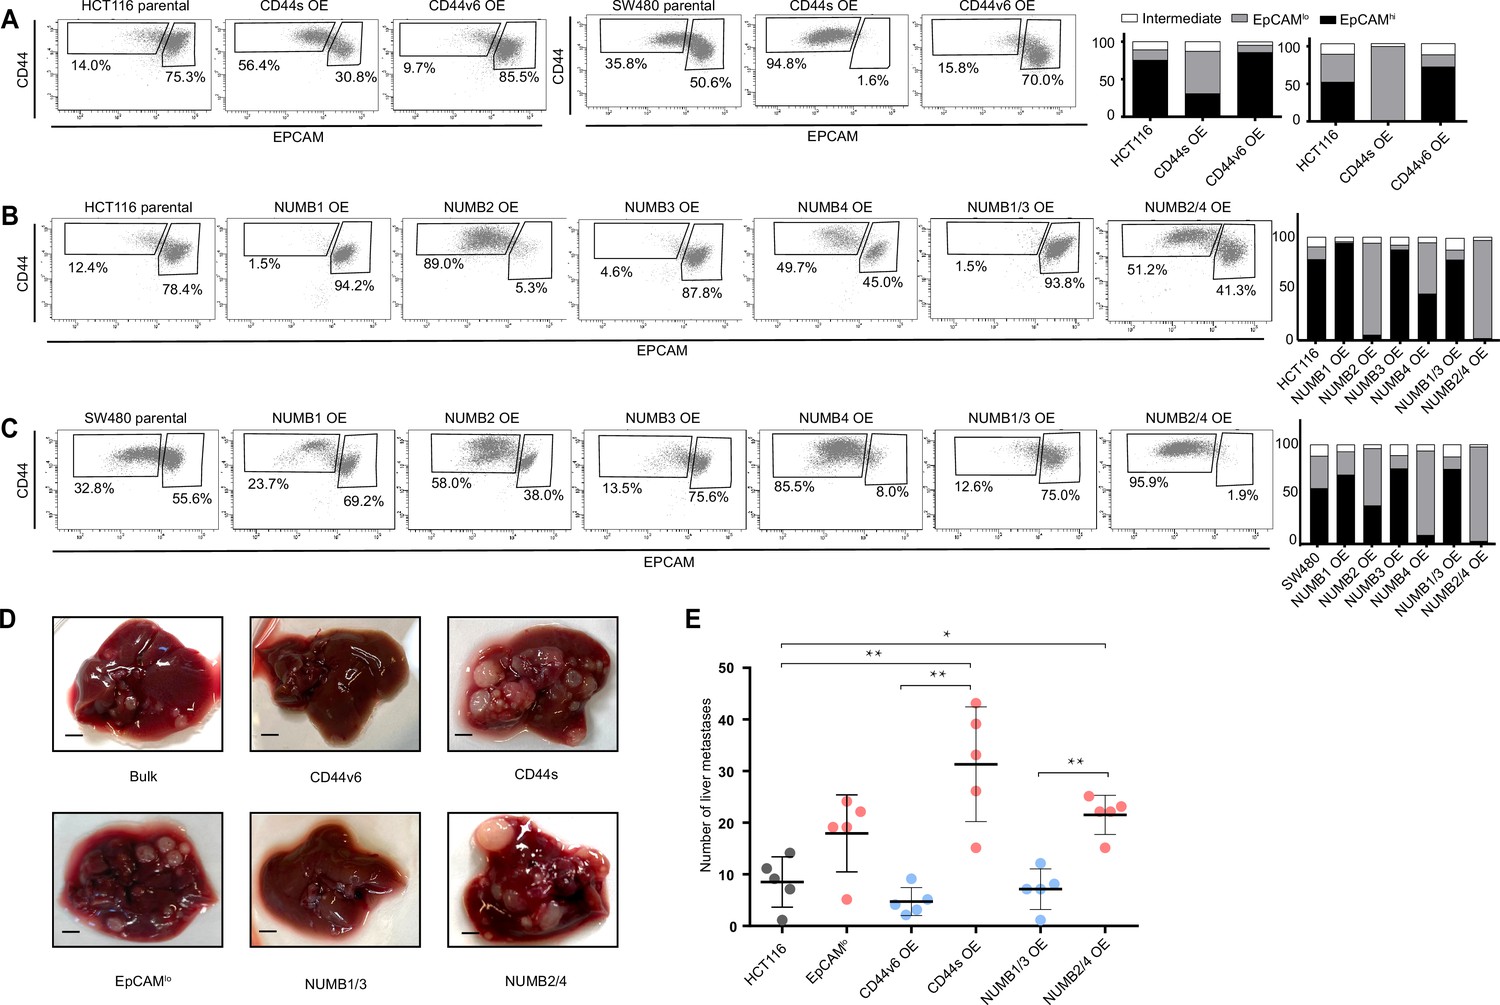
CD44 and NUMB alternative splicing (AS) isoforms have opposite functions in quasi-mesenchymal and epithelial colon cancer cells and their capacity to metastasize the liver.
(A) CD44/EpCAM FACS analysis of EpCAMlo and EpCAMhi subpopulations in CD44s-OE (left) and CD44v6-OE HCT116 and SW480 cell lines. The bar charts on the right depict the percentages of EpCAMlo and EpCAMhi cells. The subpopulation of cells mapping in between, but yet outside, the CD44hiEpCAMhi and CD44hiEpCAMlo gates, is here labelled as ‘intermediate’. (B) and (C) CD44/EpCAM FACS analysis of EpCAMlo and EpCAMhi subpopulations in NUMB1-4 OE HCT116 and SW480 cells. The bar charts on the right depict the percentages of EpCAMlo and EpCAMhi cells. (D) Macroscopic images of livers from mice spleen-injected with CD44s-, CD44v6-, NUMB2/4-, and NUMB1/3-OE HCT116 cells. HCT116 EpCAMlo and bulk cells were used as positive control. Scale bar: 5 mm. (E) Liver metastasis multiplicity after intrasplenic injection of CD44s-, CD44v6-, NUMB2/4-, and NUMB1/3-OE HCT116 cells. For each transplantation experiment, 5×10⁴ cells were injected in the spleen of recipient NSG mouse. Six weeks after injection, mice were sacrificed and individual tumors counted. (means ± SEM, n=5) *=p < 0.05; **=p < 0.01.
Figure 4—figure supplement 1

CD44 and NUMB isoforms regulate colon cancer cell proliferation.
(A) Proliferation assays of HCT116 CD44s- and CD44v6-OE cells. Both OD values and cell multiplicities are shown from day 1 to 6 (means ± SEM, n=3). *=p < 0.05; **=p < 0.01. (B) Proliferation assays of SW480 CD44s- and CD44v6-OE cells. Both OD values and cell multiplicities are shown from day 1 to 6 (means ± SEM, n=3). *=p < 0.05; **=p < 0.01. (C) Proliferation assays of HCT116 NUMB1/4-OE cells. Both OD values and cell multiplicities are shown from day 1 to 6 (means ± SEM, n=3). **=p < 0.01. (D) Proliferation assays of SW480 NUMB1/4-OE cells. Both OD values and cell multiplicities are shown from day 1 to 6 (means ± SEM, n=3). **=p < 0.01.
Figure 5 with 1 supplement
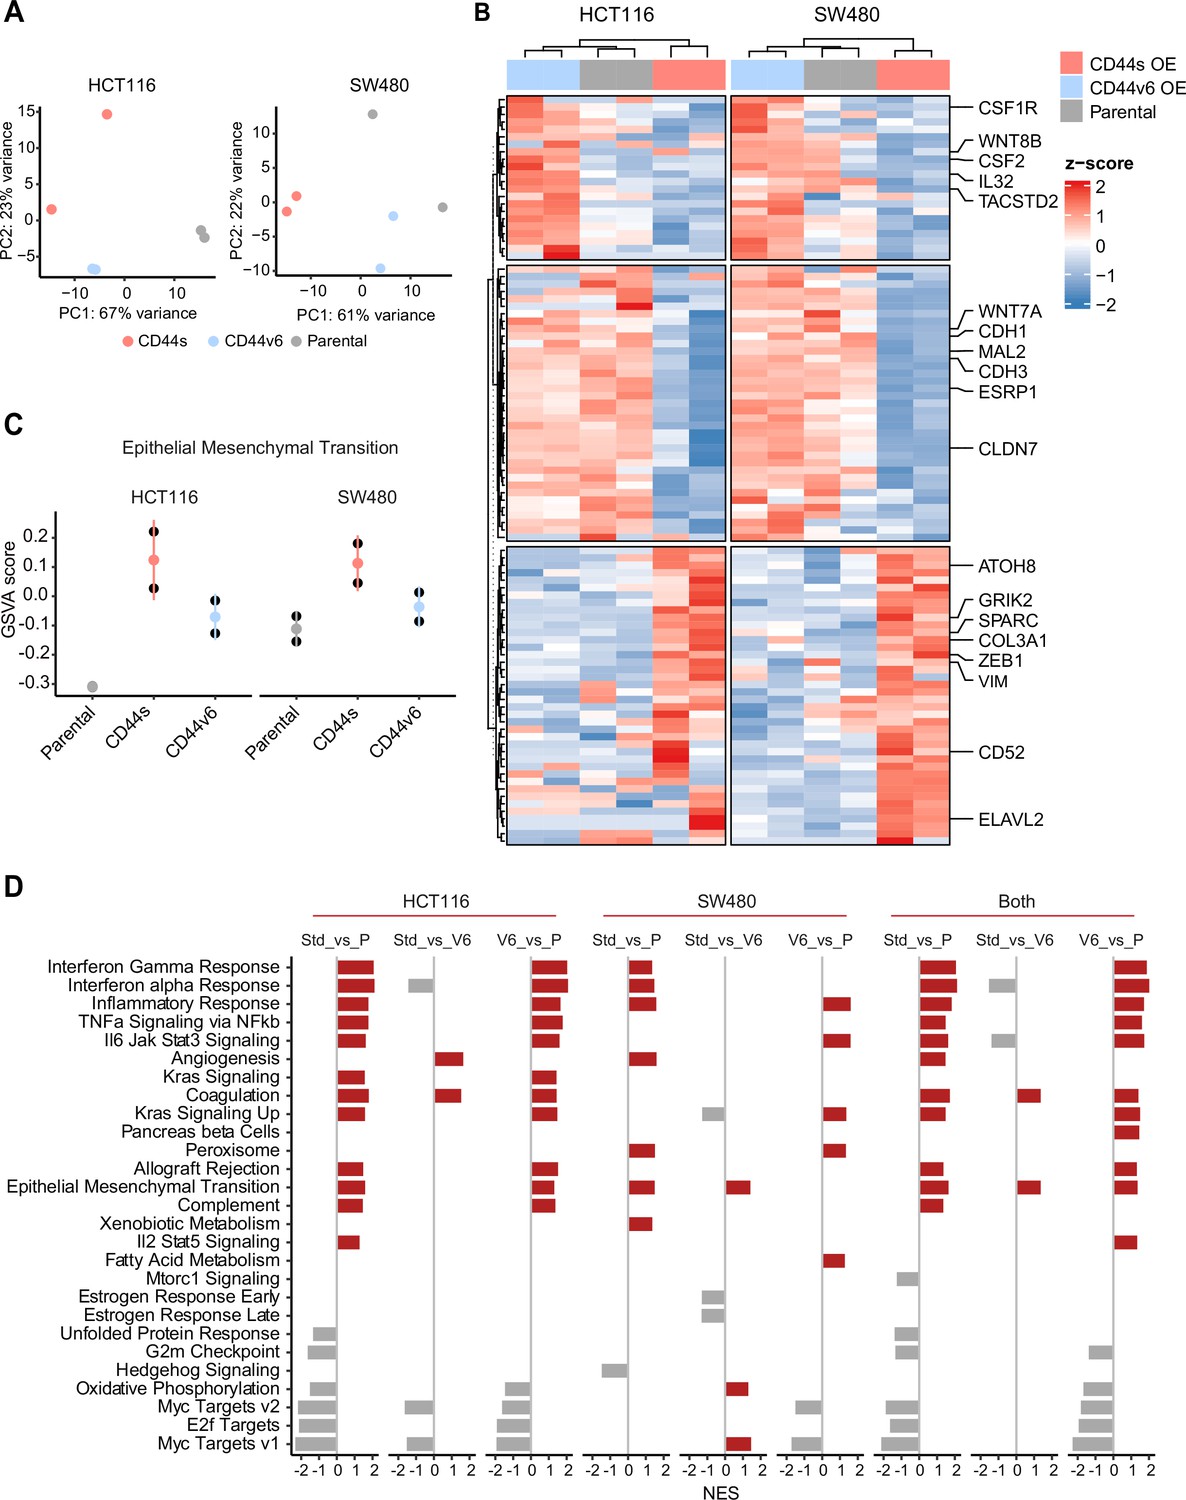
RNAseq analysis of CD44s- and CD44v6-expressing colon cancer cells reveals a broad spectrum of downstream alternative splicing (AS) targets and biological functions.
(A) Principal component analysis (PCA) of RNAseq profiles from CD44s- and CD44v6-OE HCT116 and SW480 cell lines. (B) Heatmap of differentially expressed gene among HCT116 and SW480 CD44s-OE, CD44v6-OE, and parental cells. (C) Gene set enrichment analysis (GSEA) of epithelial-mesenchymal transition (EMT) in expression profiles from HCT116 and SW480 parental, CD44s-OE, and CD44v6-OE cells. Normalized enrichment score (NES) >1, and pval <0.05. (D) GSEA of HCT116 and SW480 expression profiles in parental, CD44s-OE, CD44v6-OE cells compared with each other. Plots show only significantly altered pathways, with NES >1, and pval <0.05.
Figure 5—figure supplement 1
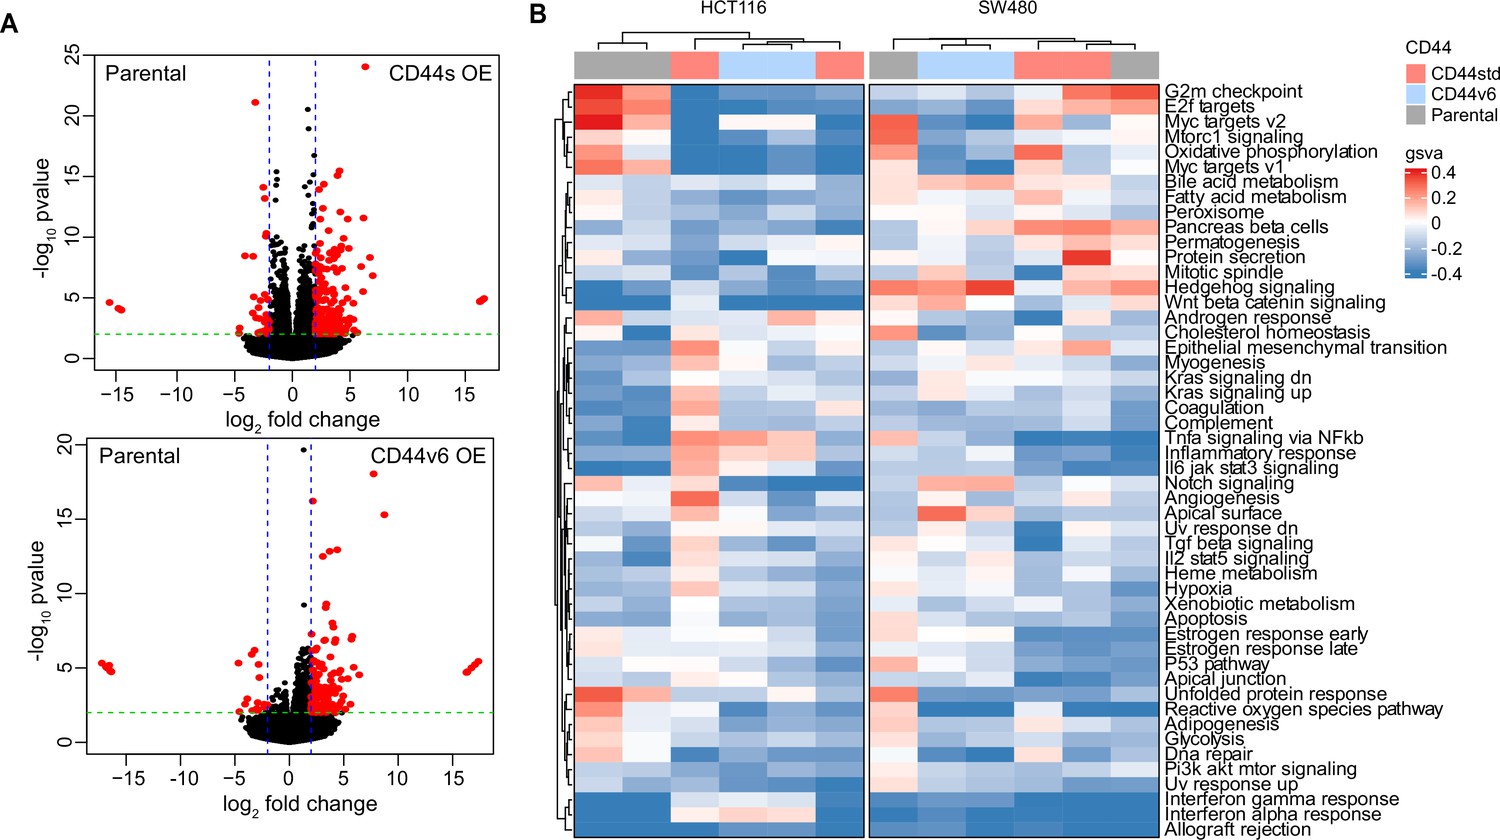
Gene enrichment and pathway analysis of CD44s- and CD44v6-overexpressing (OE) colon cancer cells.
(A) Volcano plots showing differentially expressed genes (absLFC >2, pval <0.01, red) by comparing parental cell lines to the CD44s- and CD44v6-OE samples in both cell lines. (B) Gene set enrichment analysis of parental, CD44s- and CD44v6-OE cells compared with each other in HCT116 and SW480 cells shown in heatmap, respectively. Only significantly altered pathways (normalized enrichment score [NES] >1, and pval <0.05) are shown.
Figure 6

Increased ZEB1 and decreased ESRP1 expression correlate with the NUMB2/4 and CD44s isoforms and with poor overall survival.
(A) RNAseq data from The Cancer Genome Atlas (TCGA) were subdivided into three groups based on ZEB1 and ESRP1 expression level: ZEB1hiESRP1lo (ZEB1hi, red dots), ZEB1loESRP1hi (ZEB1lo, blue dots), and intermediate (gray dots). (B) Kaplan-Meier analysis of overall survival in the ZEB1hiESRP1hi and ZEB1loESRP1lo patient groups. (C) Box plots showing CD44 and NUMB gene and isoforms expression across the ZEB1hiESRP1lo, ZEB1loESRP1hi, and intermediate patient groups. (D) Dot plot analysis of the z-score scaled expression values of CD44s, CD44v6, NUMB1-4 isoforms across the four colon cancer consensus molecular subtypes (CMS). (E) Stacked bar plot showing the composition of the CMS across the ZEB1hi/lo and intermediate patient groups.
Figure 7 with 1 supplement

Gene and pathway correlation analyses of CD44 and NUMB isoforms in patient-derived colon cancers.
(A) Gene correlation analysis showing the correlation of gene expression with CD44s and CD44v6 isoform expression in the The Cancer Genome Atlas (TCGA) patient cohort. Differentially expressed genes from CD44s- (red) and CD44v6-OE (blue) RNAseq data are highlighted. (B) Pathway correlation analysis showing the correlation of pathway activity CD44 and NUMB isoform expression in the TCGA patient cohort.
Figure 7—figure supplement 1
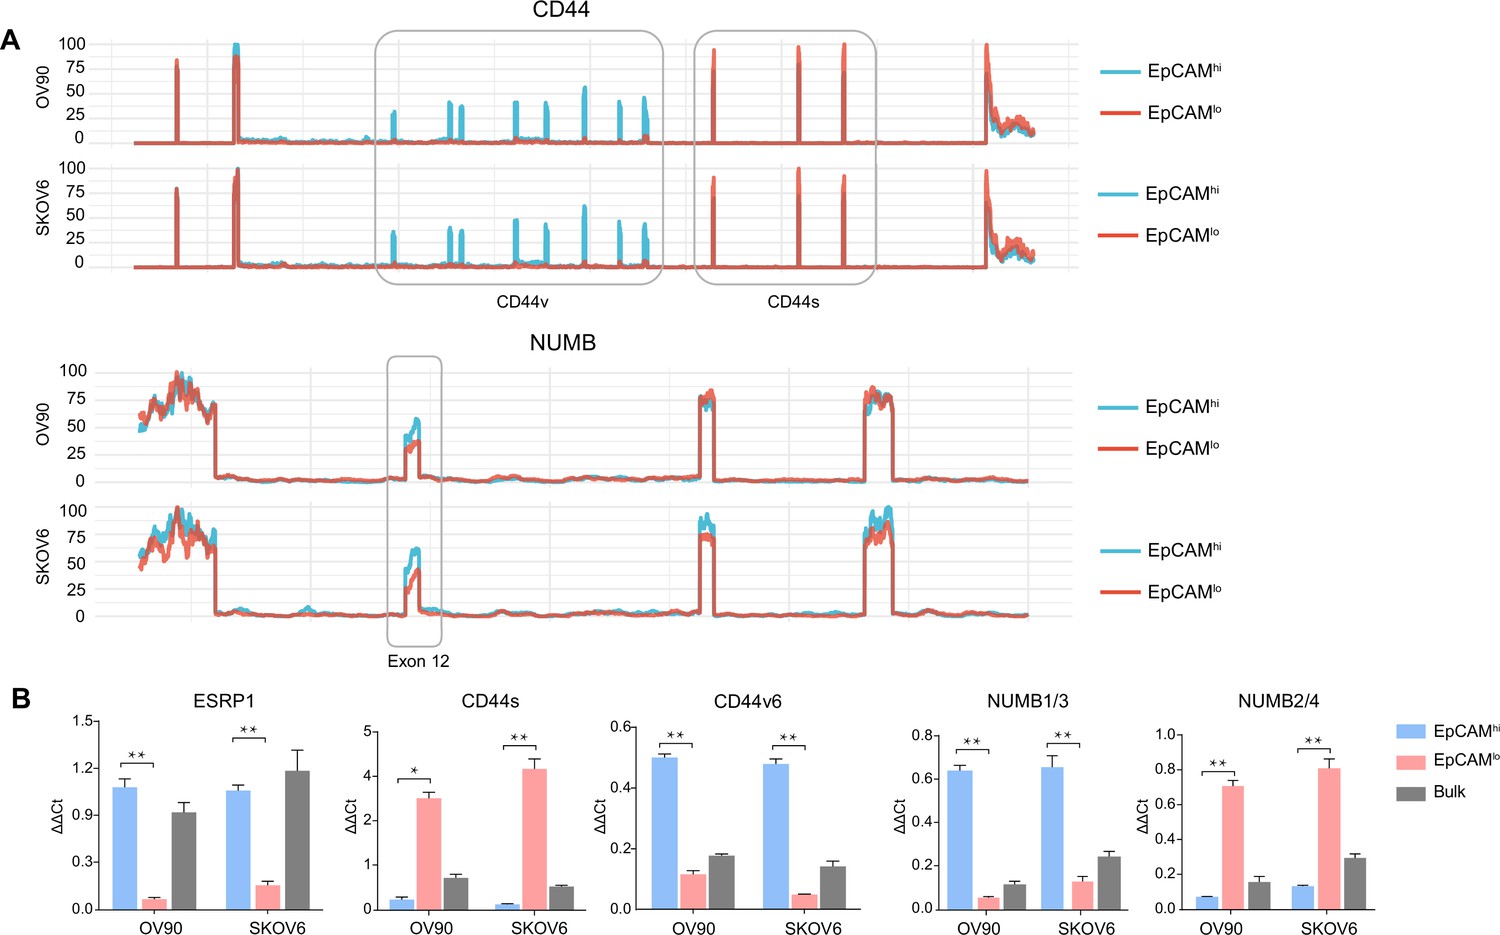
CD44 and NUMB isoforms expression in EpCAMhi/lo ovarian and cervical cancer cells.
(A) CD44 and NUMB exon chromosome sites information from alternative splicing (AS) analysis in the ovarian and cervical cancer cell lines OV90 and SKOV6. Exon peak plot depicts the expression of different exons in the three groups; peak height is indicative of the expression level of specific exons. CD44v: CD44 exons v2 to v10. CD44v and CD44s, and NUMB exon 12 are highlighted by gray rectangles. (B) RT-qPCR expression analysis of ESRP1, CD44s, CD44v6, NUMB1/3, and NUMB2/4 isoforms in EpCAMhi, EpCAMlo, and bulk subpopulations in OV90 and SKOV6 ovarian cancer cell lines. GAPDH expression was used as control (means ± SEM, n=3). **=p < 0.01.
Author response image 1
Tables
Key resources table
| Reagent type (species) or resource | Designation | Source or reference | Identifiers | Additional information |
|---|---|---|---|---|
| Cell line (Homo sapiens) | HCT116 (adult colorectal carcinoma) | ECACC | Cat# 91091005, RRID:CVCL_0291 | |
| Cell line (Homo sapiens) | SW480 (adult colorectal carcinoma) | ECACC | Cat# 87092801, RRID:CVCL_0546 | |
| Transfected construct (Homo sapiens) | Human-ESRP1 shRNA | Horizon | Cat# V3THS_400802 | Lentiviral construct to transfect express the shRNA |
| Antibody | Anti-human ZEB1 (rabbit monoclonal) | Cell Signaling | Cat# 3396, RRID:AB_1904164 | WB (1.1000) |
| Antibody | Anti-human ESRP1 (rabbit polyclonal) | Thermo Fisher | Cat# PA5-11520, RRID:AB__2899836 | WB (1.1000) |
| Antibody | Anti-human CD44s (mouse monoclonal) | Thermo Fisher | Cat# MA5-13890, RRID:AB_10986810 | WB (1.100) |
| Antibody | Anti-human CD44v6 (mouse monoclonal) | Abcam | Cat# ab78960, RRID:AB_1603730 | WB (1.1000) |
| Antibody | Anti-human NUMB (rabbit monoclonal) | Cell Signaling | Cat# 2756, RRID:AB_2534177 | WB (1.1000) |
| Antibody | Anti-human B-actin (rabbit monoclonal) | Cell Signaling | Cat# 8457,R RID:AB_10950489 | WB (1.2000) |
| Antibody | Anti-mouse CD44-APC (rat monoclonal) | BD Pharmingen | Cat# 559250, RRID:AB_398661 | FACS (1 µg/106 cells) |
| Antibody | Anti-human EpCAM-FITC (mouse monoclonal) | GeneTex | Cat# GTX30708, RRID:AB_1240769 | FACS (1 µg/106 cells) |
| Recombinant DNA reagent | ESRP1 cDNA ORF Clone (human) | Sino Biological | Cat# HG13708-UT | |
| Recombinant DNA reagent | pcDNA empty vector (plasmid) | Gift from Ron Smits | ||
| Recombinant DNA reagent | pcDNA-human-CD44s (plasmid) | Gift from Véronique Orian-Rousseau | ||
| Recombinant DNA reagent | pUC57-human-CD44v6 (plasmid) | Gift from Véronique Orian-Rousseau | ||
| Recombinant DNA reagent | pcDNA-human-NUMB1 (plasmid) | Gift from Salvatore Pece | ||
| Recombinant DNA reagent | pcDNA-human-NUMB2 (plasmid) | Gift from Salvatore Pece | ||
| Recombinant DNA reagent | pcDNA-human-NUMB3 (plasmid) | Gift from Salvatore Pece | ||
| Recombinant DNA reagent | pcDNA-human-NUMB4 (plasmid) | Gift from Salvatore Pece | ||
| Recombinant DNA reagent | shZEB1 | Sacchetti et al., 2021 | Cat# 1864 | |
| Recombinant DNA reagent | pSLIK-Hygro | Addgene | Cat# 25737 | |
| Software, algorithm | R | Seurat, GSVA, MAGIC (Stuart et al., 2019; van Dijk et al., 2018; La Manno et al., 2018) | RRID:SCR_007322, RRID:SCR_021058 | Version 4.0.4 |
| Software, algorithm | Python | Velocyto, scVelo (La Manno et al., 2018; Bergen et al., 2020) | RRID:SCR_018167, RRID:SCR_018168 | Version 3.8.3 |
| Software, algorithm | STAR | Dobin et al., 2013 | RRID:SCR_004463 | |
| Software, algorithm | MISO | Katz et al., 2010. | RRID:SCR_003124 |
Additional files
-
Supplementary file 1
List of alternative splicing targets in ESRP1 knocking down H358 line (a), HCT116 (b), and SW480 (c) EpCAMlo and EpCAMhi subpopulation, filtered by ΔPSI (differential percentage spliced in) > 0.1.
- https://cdn.elifesciences.org/articles/82006/elife-82006-supp1-v2.xlsx
-
Supplementary file 2
List of alternative splicing targets in ESRP1-KD in the H358 cell line, ESRP2-KD in LNCaP, RBM47-KD in H358 line, QKI-KD in CAL27, and HCT116 and SW480 EpCAMlo and EpCAMhi subpopulation, filtered by ΔPSI (differential percentage spliced in) > 0.1.
- https://cdn.elifesciences.org/articles/82006/elife-82006-supp2-v2.xlsx
-
Supplementary file 3
Lists of primer sequences used for RT-PCR analysis.
- https://cdn.elifesciences.org/articles/82006/elife-82006-supp3-v2.xlsx
-
Supplementary file 4
Differential expressed gene lists from the RNAseq analysis HCT116 CD44s- and CD44v6-OE cells.
- https://cdn.elifesciences.org/articles/82006/elife-82006-supp4-v2.xlsx
-
Supplementary file 5
Differential expressed gene lists from the RNAseq analysis SW480 CD44s- and CD44v6-OE cells.
- https://cdn.elifesciences.org/articles/82006/elife-82006-supp5-v2.xlsx
-
Supplementary file 6
List of gene set enrichment analysis (GSEA) in CD44s OE vs. CD44v6 OE vs. parental HCT116 and SW480 cells.
- https://cdn.elifesciences.org/articles/82006/elife-82006-supp6-v2.xlsx
-
Supplementary file 7
List of gene set variation analysis (GSVA) in CD44s OE vs. CD44v6 OE vs. parental HCT116 and SW480 cells.
- https://cdn.elifesciences.org/articles/82006/elife-82006-supp7-v2.xlsx
-
MDAR checklist
- https://cdn.elifesciences.org/articles/82006/elife-82006-mdarchecklist1-v2.pdf
Download links
A two-part list of links to download the article, or parts of the article, in various formats.
Downloads (link to download the article as PDF)
Open citations (links to open the citations from this article in various online reference manager services)
Cite this article (links to download the citations from this article in formats compatible with various reference manager tools)
Alternative splicing downstream of EMT enhances phenotypic plasticity and malignant behavior in colon cancer
eLife 11:e82006.
https://doi.org/10.7554/eLife.82006


