T cells modulate the microglial response to brain ischemia
- Institute for Stroke and Dementia Research, University Hospital, LMU Munich, Germany
- Institute of Diabetes and Regeneration Research, Institute of Computational Biology, Helmholtz Zentrum München, Germany
- Department of Neurology, Focus Program Translational Neuroscience (FTN) and Immunotherapy (FZI), RhineMain Neuroscience Network (rmn(2)), University Medical Center of the Johannes Gutenberg University Mainz, Germany
- Munich Cluster for Systems Neurology (SyNergy), Germany
- Biomedical Center (BMC), Faculty of Medicine, LMU Munich, Germany
- Institute of Clinical Neuroimmunology, University Hospital, LMU Munich, Germany
Figures
Figure 1
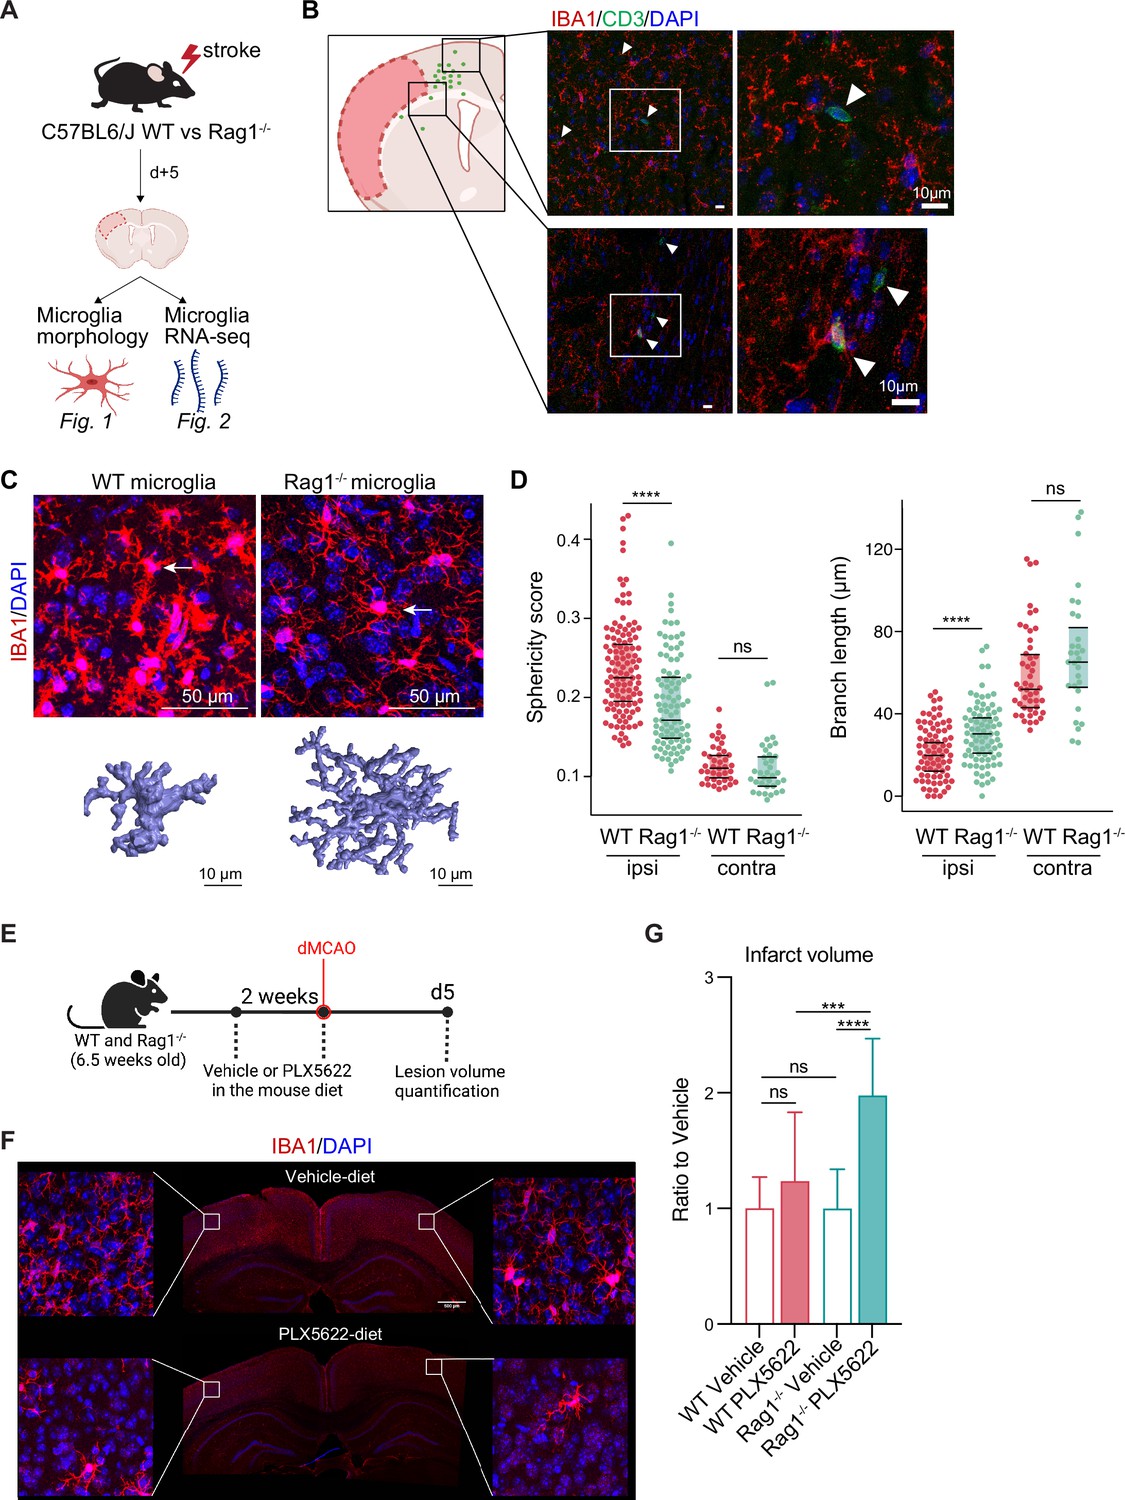
Lymphocytes influence microglia morphology after stroke.
(A) Schematic of the experimental design: morphological analysis of microglia and transcriptomic profile of sorted microglia were performed in naïve mice or 5 days after stroke in wild-type (WT) and Rag1−/− mice. (B) Top left, cumulative topographic maps of CD3+ T cells 5 days after stroke. Cells were accumulated from one section at bregma level of five animals each. Each cell is represented as a single dot. The infarct is depicted in pink. Right, representative immunohistochemistry images of microglia (IBA1, red) and T cells (CD3, green) in the perilesional area 5 days after stroke in WT mice. 4’,6-Diamidin-2-phenylindol (DAPI; blue) was used as nuclear dye. Bar scale indicates 10 μm. (C) Top, representative images of IBA1+ microglial cells in the perilesional region (900 µm distal to the infarct border, cortical layer 4). Bottom, three-dimensional (3D) reconstruction of microglia in WT and Rag1−/− mice. (D) Morphological analysis of microglia in the peri-infarct area (ipsi) and in the contralateral hemisphere (contra) for two representative features: sphericity and branch length (µm) in WT (red) and Rag1−/− (green) mice. Each dot corresponds to one microglial cell; n=3mice per condition; ns, non significant; ****, p<0.0001. Wilcoxon rank sum test with continuity correction and Bonferroni post-hoc correction for multiple testing. (E) WT and Rag1−/− mice were fed a chow diet containing the CSF1 receptor antagonist, PLX5622 (1200 ppm in mouse chow) for 2 weeks and until 5 days post-stroke to eliminate microglia from the brain, and another group of mice were fed with a control chow diet (vehicle). Infarct volumetry was quantified on cresyl violet staining 5 days after distal occlusion of the middle cerebral artery (dMCAO). (F) Images show that 2 weeks of PLX5622-diet almost completely depleted microglia from the brain (IBA1, red; 4’,6-Diamidin-2-phenylindol [DAPI], blue), scale bar: 500 µm. (G) Infarct volumes of PLX5622-treated mice as a ratio to vehicle-treated mice 5 days after stroke; One-way ANOVA and Tukey’s multiple comparison test; n=13–15 mice per condition; bar graphs show the mean and the standard deviation (SD); ns, non significant; ***, p<0.001; ****, p<0.0001.
Figure 2 with 3 supplements
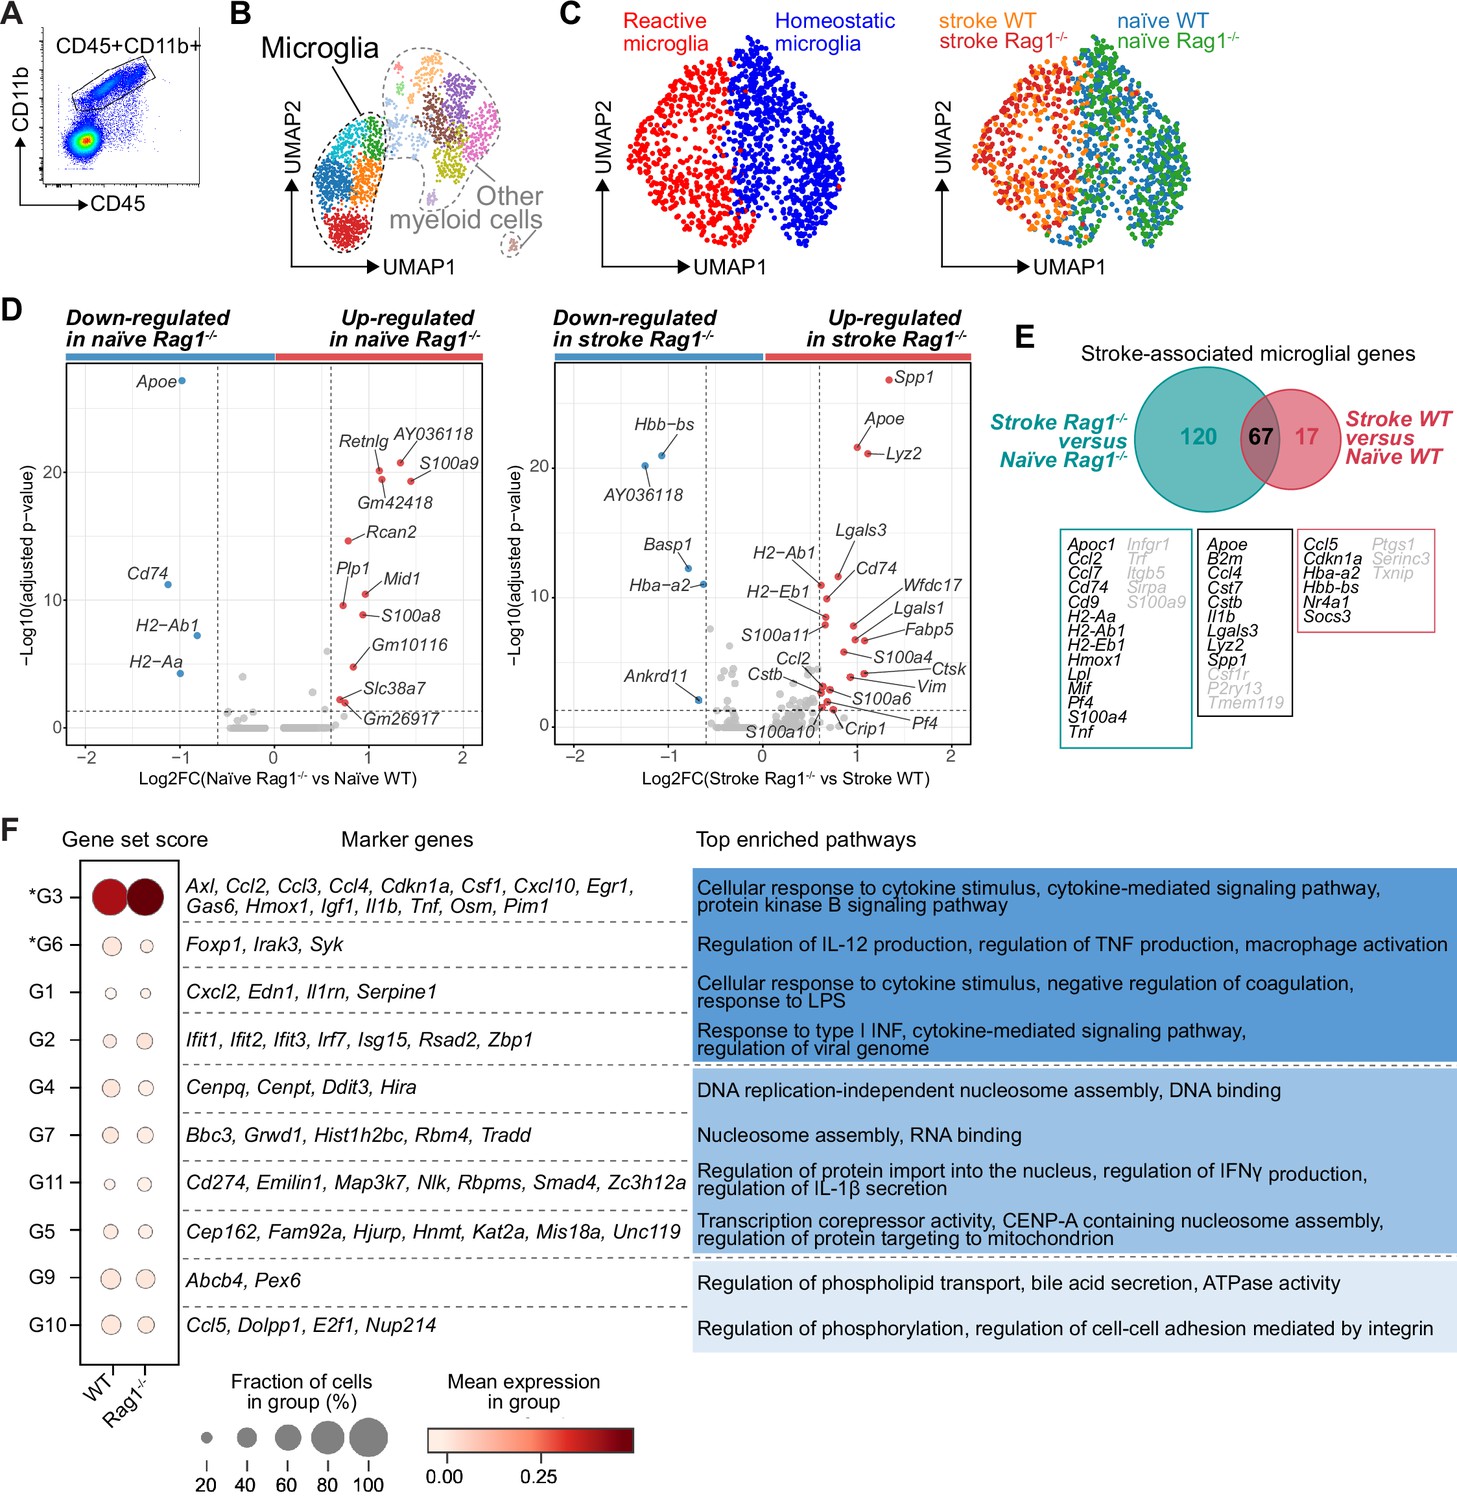
Lymphocytes influence microglia transcriptional signature.
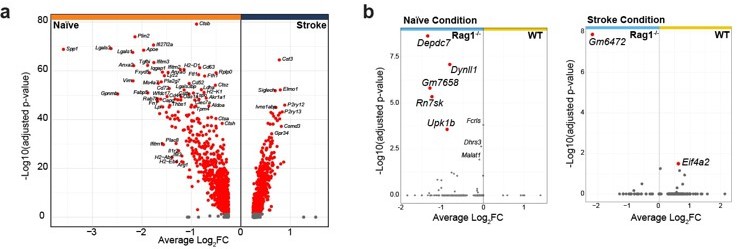
(A) CD45+CD11b+ cells were sorted from the ipsilateral hemisphere in naïve mice or 5 days after stroke in wild-type (WT) and Rag1−/− (3 mice per condition), and RNA was isolated for single cell RNA sequencing (10× Genomics). (B) Uniform manifold approximation and projection 2D space (UMAP) plots of 2345 CD45+CD11b+ cells colored by 15 distinct transcriptional clusters (Figure 2—figure supplement 1A). (C) Clustering of the microglia subset color-coded by homeostatic and reactive microglia (right) and by conditions (left). (D) Volcano plots of the differentially expressed genes in microglia in naïve and stroke condition. Dotted lines indicate an adjusted p-value≤0.05 and FC = 1.5. (E) Number of microglial genes regulated after stroke in comparison to naïve condition in Rag1−/− and WT mice. 67 genes were common to both genotypes, 17 genes were specifically regulated in WT mice and 120 genes only in Rag1−/− mice. Boxes indicate key microglial genes in each condition (genes indicated in gray were down-regulated after stroke). (F) Selected gene sets of highly correlated and anti-correlated genes based on trajectory inference analysis in stroke condition (Figure 2—figure supplement 2E–G). Mean gene set activation score in WT and Rag1−/− cells, selected marker genes, and top enriched gene ontology pathways associated to each gene set. Gene sets were classified by p-value (the lowest p-value at the top, asterisks [*] indicate significant difference between genotype in stroke condition) and by similar pathways, such as: pathways related to inflammation (dark blue), pathways related to DNA/RNA regulation (blue), and lipid pathways (light blue).
Figure 2—figure supplement 1
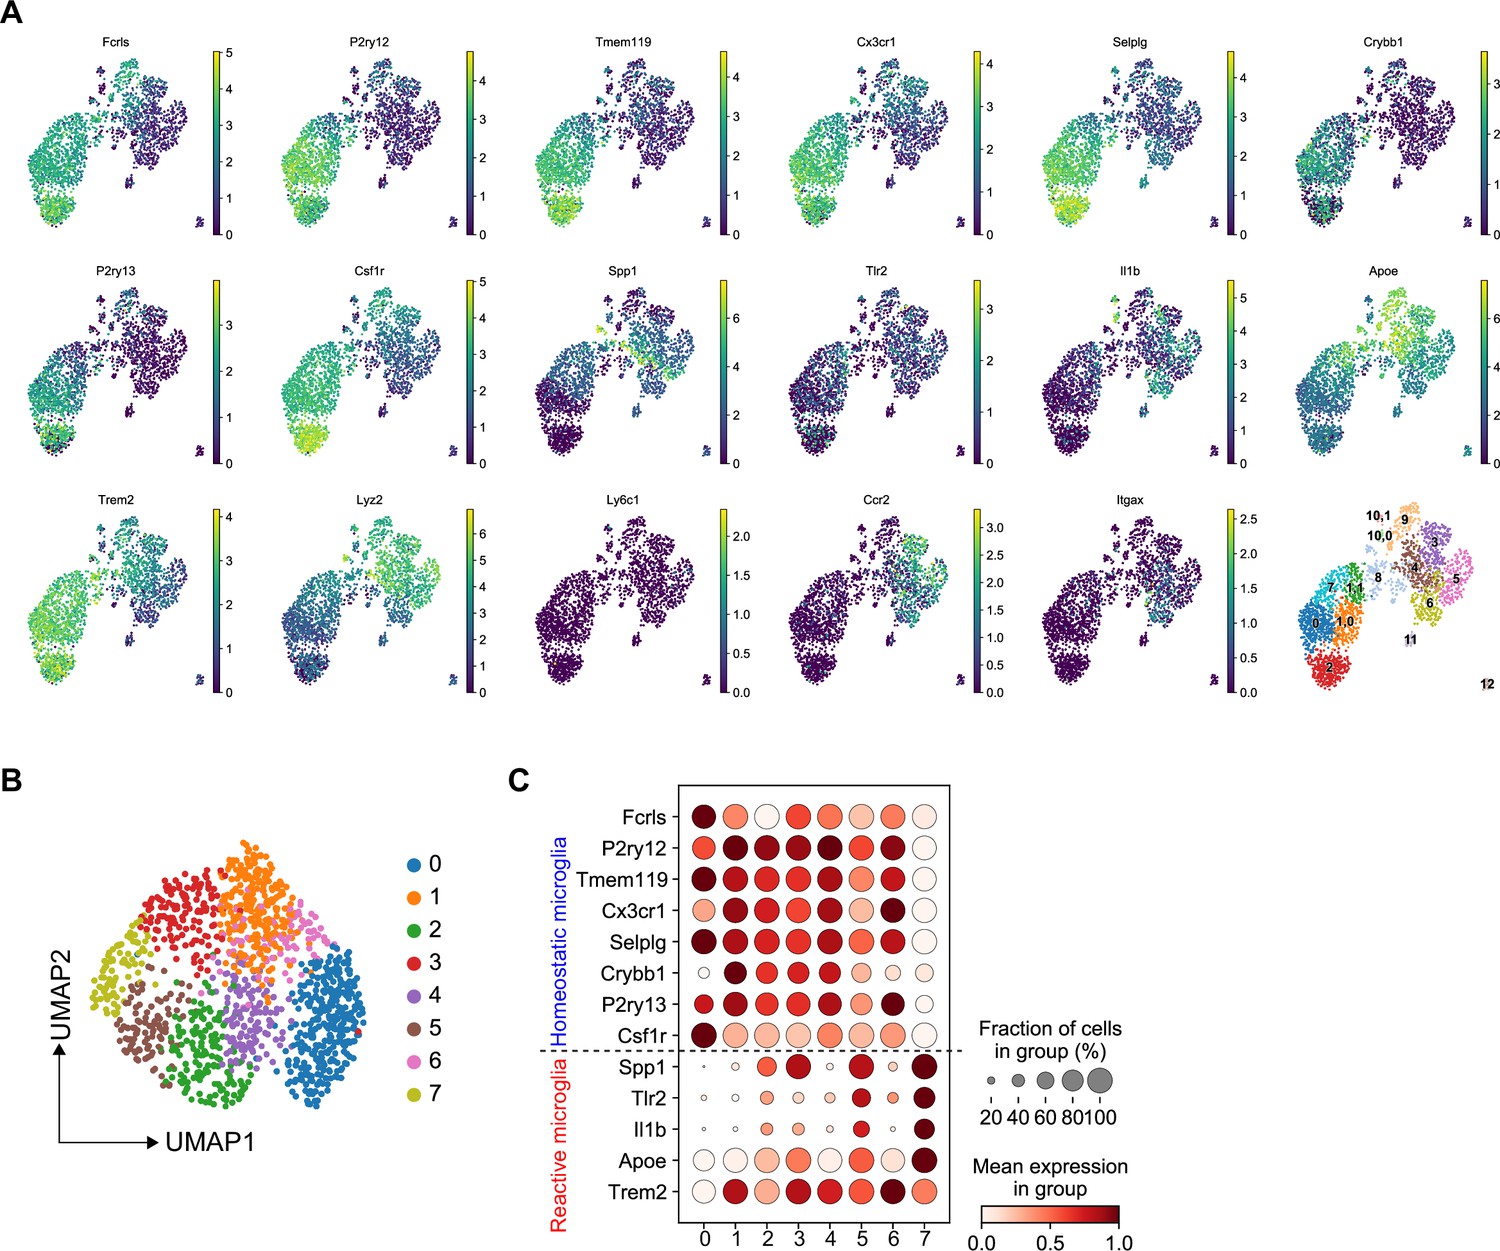
Transcriptomic analysis of microglia isolated from wild-type (WT) and Rag1−/− mice in naïve and stroke conditions.
(A) Uniform manifold approximation and projection (UMAP) plots showing expression of known CD45+CD11b+ myeloid cell marker genes and Louvain-clusters. (B and C) Manifold and clustering of microglia: (B) UMAP plots indicate Louvain-clusters of microglial cells. (C) Dot plots show gene expression distribution of marker genes split by Louvain-cluster, and their grouping into homeostatic (top) and reactive (bottom) microglia.
Figure 2—figure supplement 2
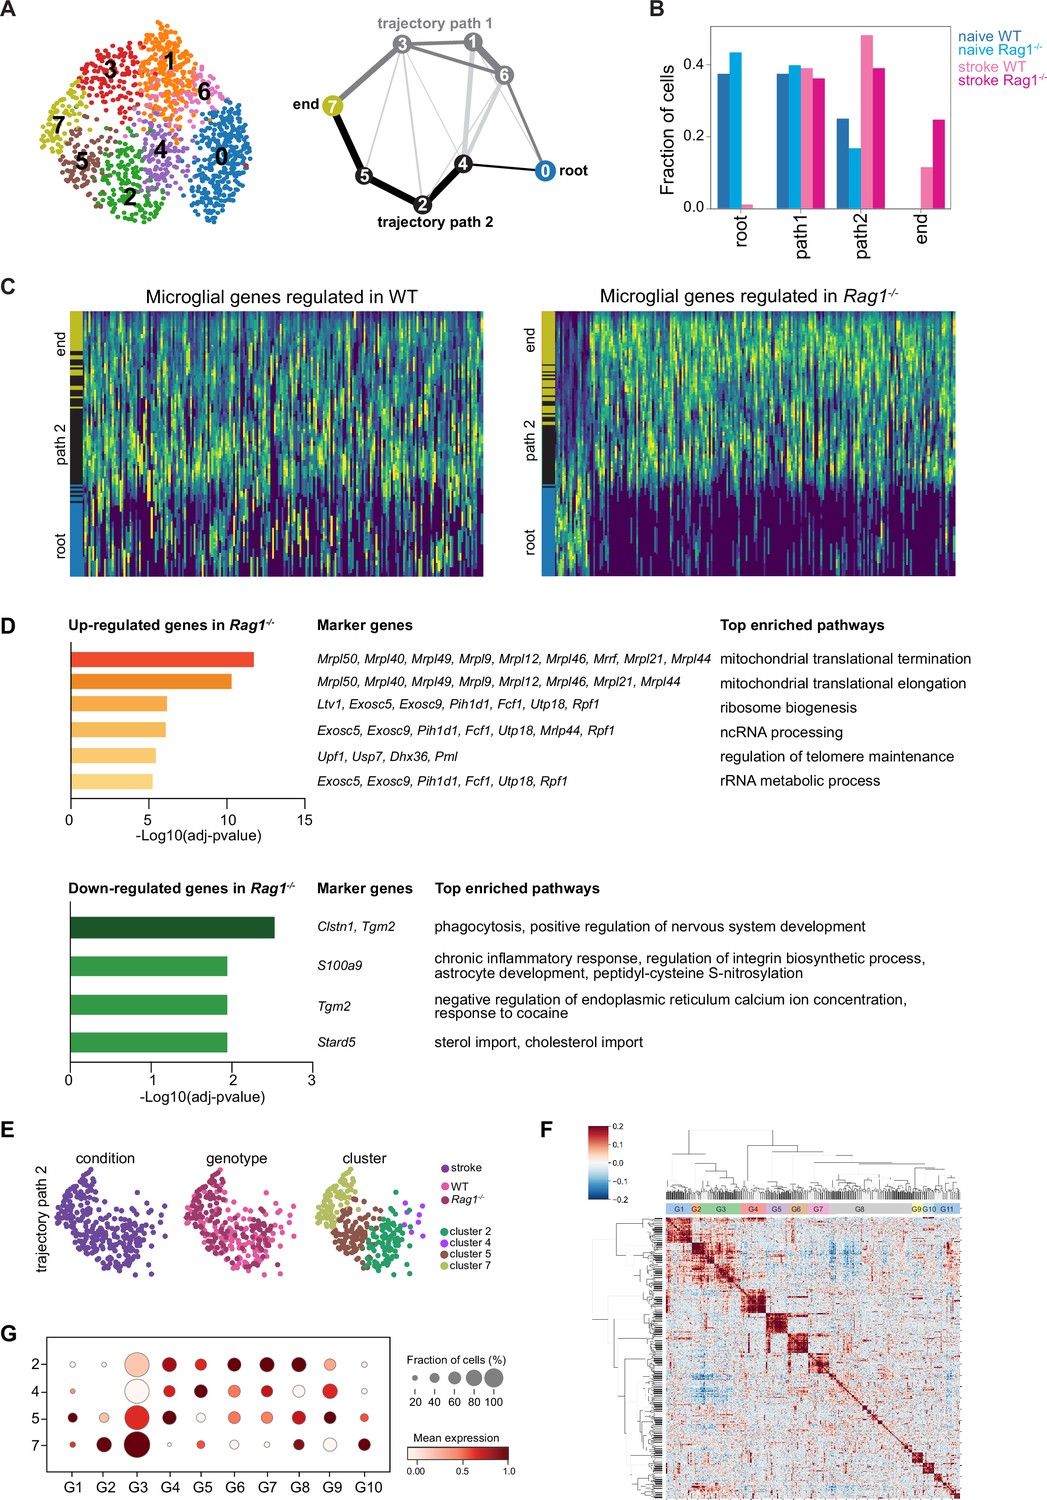
Microglia single cell trajectory inference in wild-type (WT) and Rag1−/− mice in naïve and stroke conditions.
(A and B) Microglia single cell trajectory inference describes the evolution of microglia activation from naïve to stroke condition. (A) Partition-based graph abstraction graph (PAGA, right) shows cluster connectivity of Louvain-clusters (left) with a threshold of 0.1. Nodes represent subsets, and thicker edges indicate stronger connectedness between subsets. The trajectories path 1 and 2 are selected based on the connectivity (edge width) in the PAGA after the root and end paths were defined based on marker gene expression. Clusters along the paths from root-to-end were merged since these are consecutive. Trajectory path 1 (dark gray): root (cluster 0), path 1 (clusters 6, 1, and 3 merged), and end (cluster 7); trajectory path 2 (black): root (cluster 0), path 2 (cluster 4, 2, and 5 merged), and end (cluster 7). (B) Barplot shows cell frequencies split by condition in trajectories path 1 and path 2. (C and D) Differential microglial gene expression analysis between root and end clusters along trajectory path 2. (C) Heatmaps show scaled expression along path 2 trajectory of microglial genes specifically regulated in Rag1−/− and compared in WT (left) and Rag1−/− (right) in path 2 (Wilcoxon test, adjusted p<0.05). For balanced representation of cells along the trajectory root and path 2, cells were randomly subset to 100 cells before plotting. (D) Top enriched pathways of microglial genes up- and down-regulated in Rag1−/− mice. (E–G) Microglia gene set expression in stroke condition. (E) Uniform manifold approximation and projection (UMAP) plots in path 2 and end cell clusters colored-coded by stroke condition (left), genotype (middle), and clusters (right). (F) Gene-gene correlation map of the correlated and anti-correlated genes extracted from clusters 2, 4, 5, and 7 identified 11 gene clusters. Due to low correlation, G8 was excluded of further analysis. (G) Dot plots show gene set expression distribution (G1–G11) of the stroke cell clusters (2, 4, 5, and 7).
Figure 2—figure supplement 3
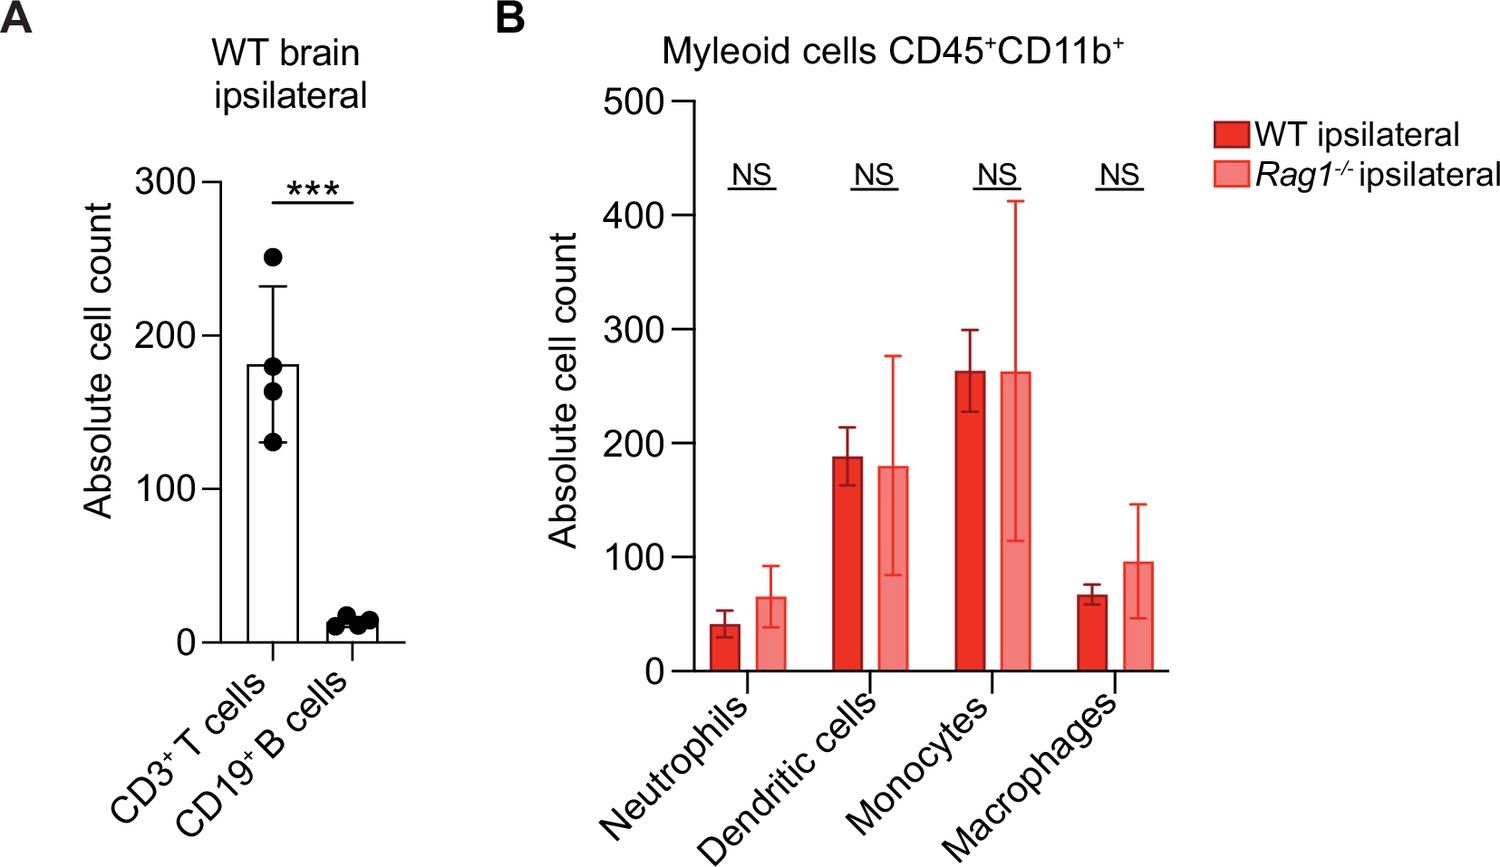
Immune cell infiltration in wild-type (WT) and Rag1−/− mice after stroke.
(A) Absolute cell count of CD3+ T cells and CD19+ B cells in the ischemic hemisphere (ipsilateral) 5 days after distal occlusion of the middle cerebral artery (dMCAO) in WT mice as quantified by flow cytometry. There is a 14-fold increase of T cells in comparison to B cells at this time point; Student t-test, ***p<0.001. (B) Absolute cell count of CD45highCD11b+ myeloid cells: Ly6G+ Neutrophils, CD11c+MHCII+ dendritic cells, Ly6C+Ly6G– monocytes, F4/80+Ly6G– macrophages in the ischemic hemisphere (ipsilateral) 5 days after dMCAO in WT (red) and Rag1−/− (pink) mice as quantified by flow cytometry; ANOVA with Šídák’s multiple comparisons test, NS: non significant. N=4 mice/condition; Bar graphs show the mean ± the standard deviation.
Figure 3 with 1 supplement
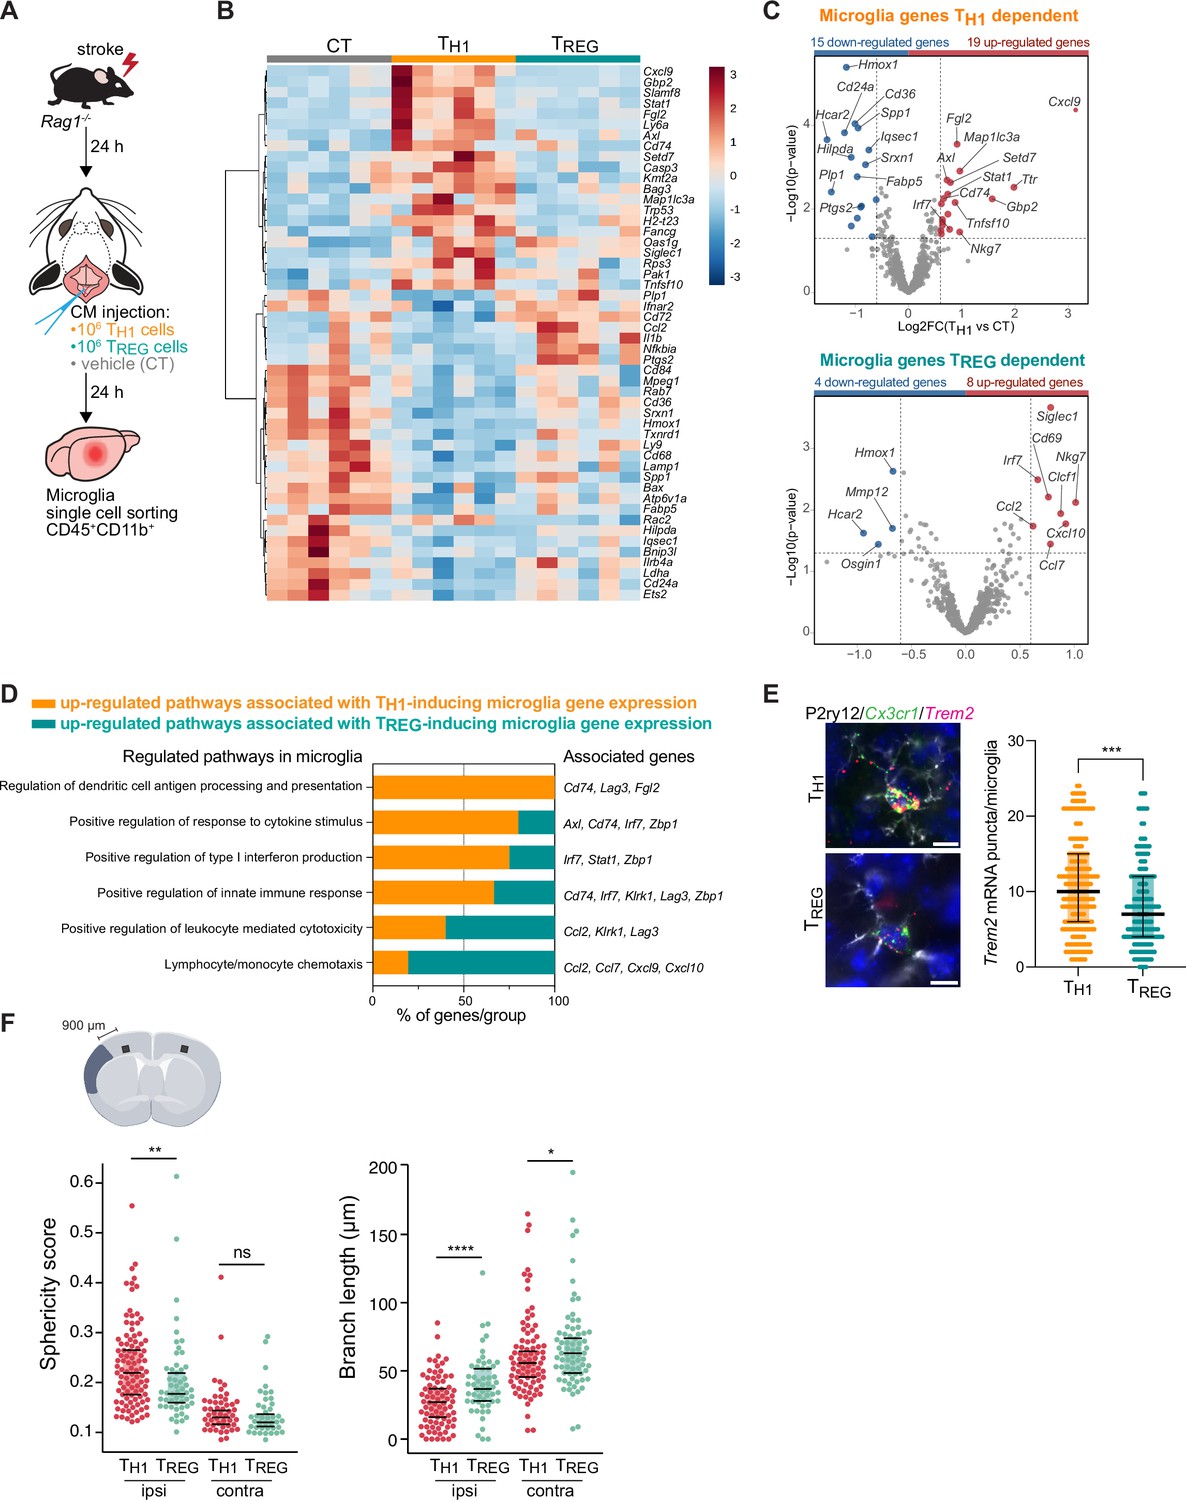
TH1 and regulatory T cells (TREG) cells influence microglia gene expression after stroke.
(A) Naïve CD4 cells were polarized in vitro to TH1 or TREG phenotype (Figure 3—figure supplement 1A). One million cells (TH1 or TREG cells) or vehicle (control, CT) were injected into the cisterna magna (CM) in Rag1−/− mice 24 hr after stroke induction (n=6 mice per condition). Microglia cells CD45+CD11b+ were sorted from the ipsilesional hemisphere, and RNA was extracted. Gene expression analysis was performed using the Neuroinflammation Panel profiling kit on the Nanostring platform. In a second set of experiment, 100 µm coronal sections were proceeded for single-molecule fluorescence in situ hybridization (smFISH) or microglia morphology. (B) Heatmap representation of microglia gene expression between conditions: control (CT; vehicle administration of PBS), TH1 or TREG. (C) Up- and down-regulated differentially expressed genes between either isolated microglia from TH1- (top) and TREG- (bottom) treated Rag1−/− mice relative to control condition (microglia isolated from Rag1−/− mice treated with vehicle, genes are color-coded accordingly to a p-value<0.05 and |fold change|>1.5). (D) Pathway analysis was performed for the up-regulated genes in each condition using the ClueGO package from Cytoscape. (E) Higher amount of Trem2 mRNA puncta (red) per Cx3cr1-positive (green) in P2ry12-labeled microglia (white) in TH1-treated mice in comparison the TREG-treated mice. 4’,6-Diamidin-2-phenylindol (DAPI; blue) was used as nuclear dye. Scale bar = 10 µm. Each dot corresponds to one P2ry12-microglial cell; n=3 mice per condition; graphs show the median with interquartile range . (F) Morphological analysis of IBA1+ microglia in the ipsilateral (900 µm distal to the infarct border, cortical layer 4) and contralateral hemisphere, as shown in the representative coronal section. Sphericity score and branch length (µm) of microglia treated with TH1 (orange) or TREG cells (green). Each dot corresponds to one microglial cells; ns, non significant; n=3 mice per condition. *, p<0.05; **, p<0.01; ****, p<0.0001. Wilcoxon rank sum test with continuity correction and Bonferroni post-hoc correction for multiple testing.
Figure 3—figure supplement 1
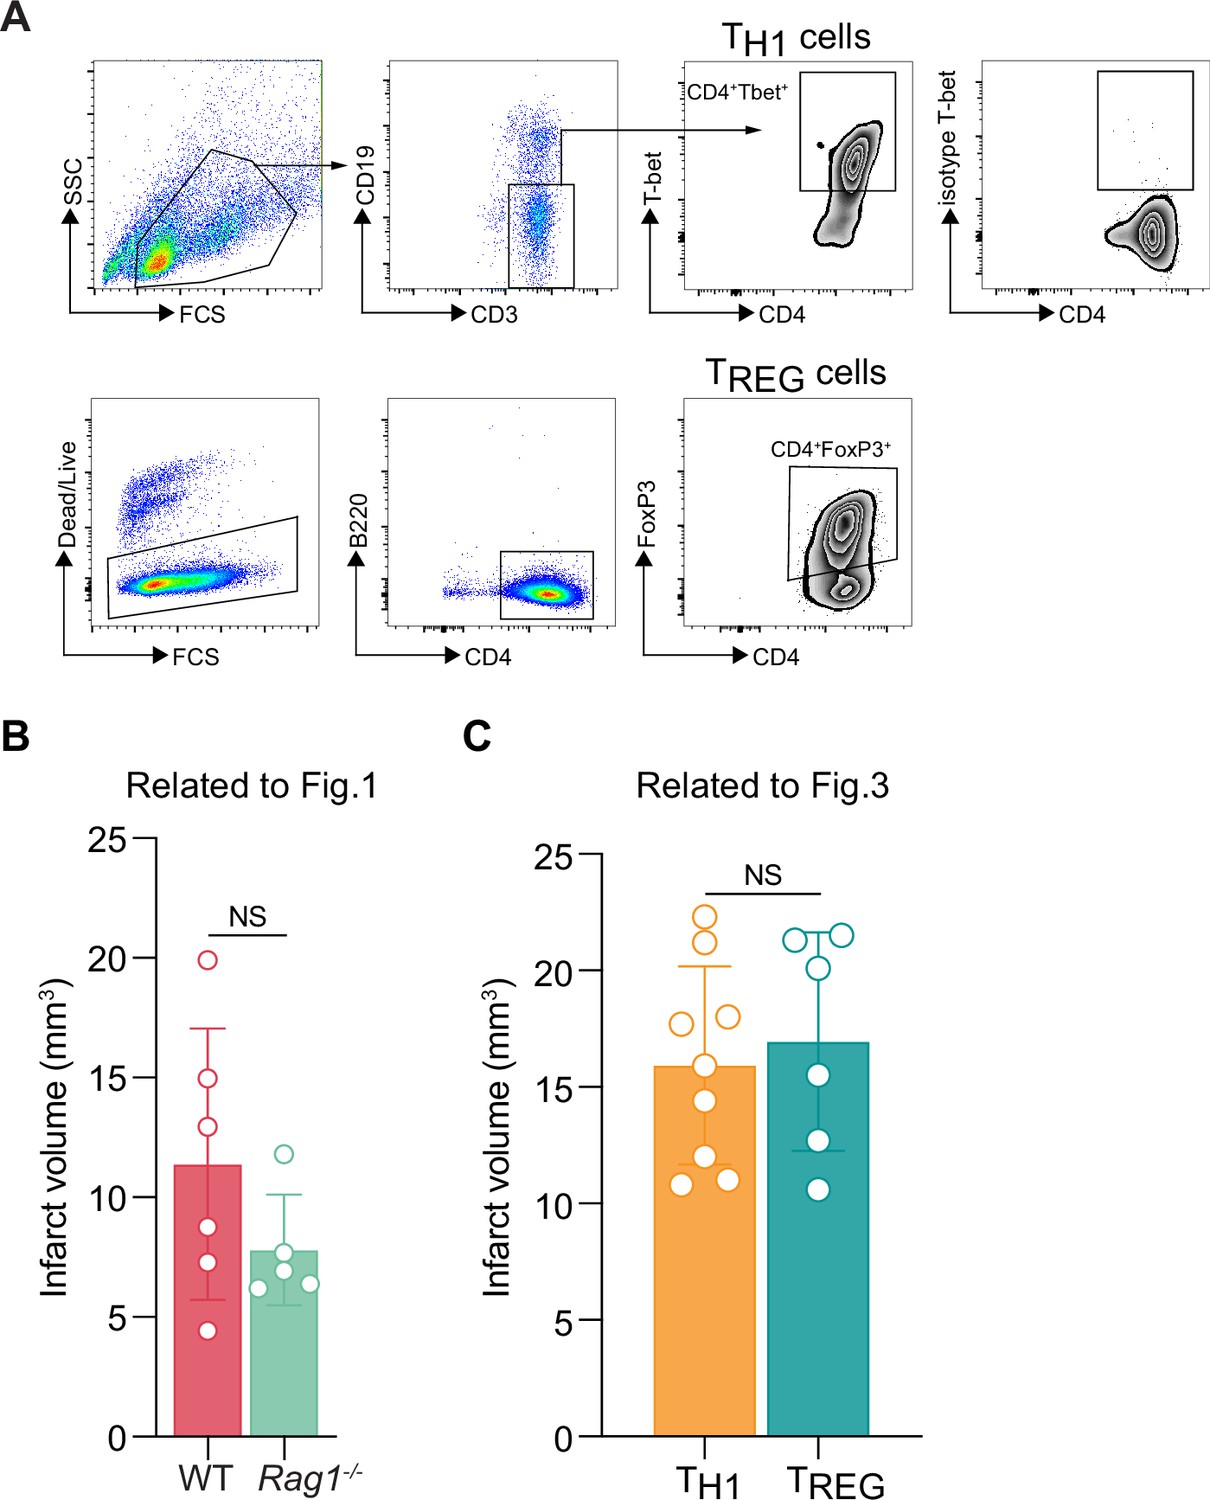
T cell polarization in vitro and infarct volumetry in Rag1−/−.
(A) CD4 naïve T cells were polarized in vitro toward TH1 (top row, CD4+Tbet+) or regulatory T cells (TREG; bottom row, CD4+FoxP3+). (B and C) Infarct volume analysis 5 days after distal occlusion of the middle cerebral artery (dMCAO) as quantified on cresyl violet stained coronal sections (20 μm thick sections taken every 400 μm). Data are represented as mean ± SD. Each dot corresponds to one mouse. Student t-test; NS, non significant.
Figure 4 with 1 supplement
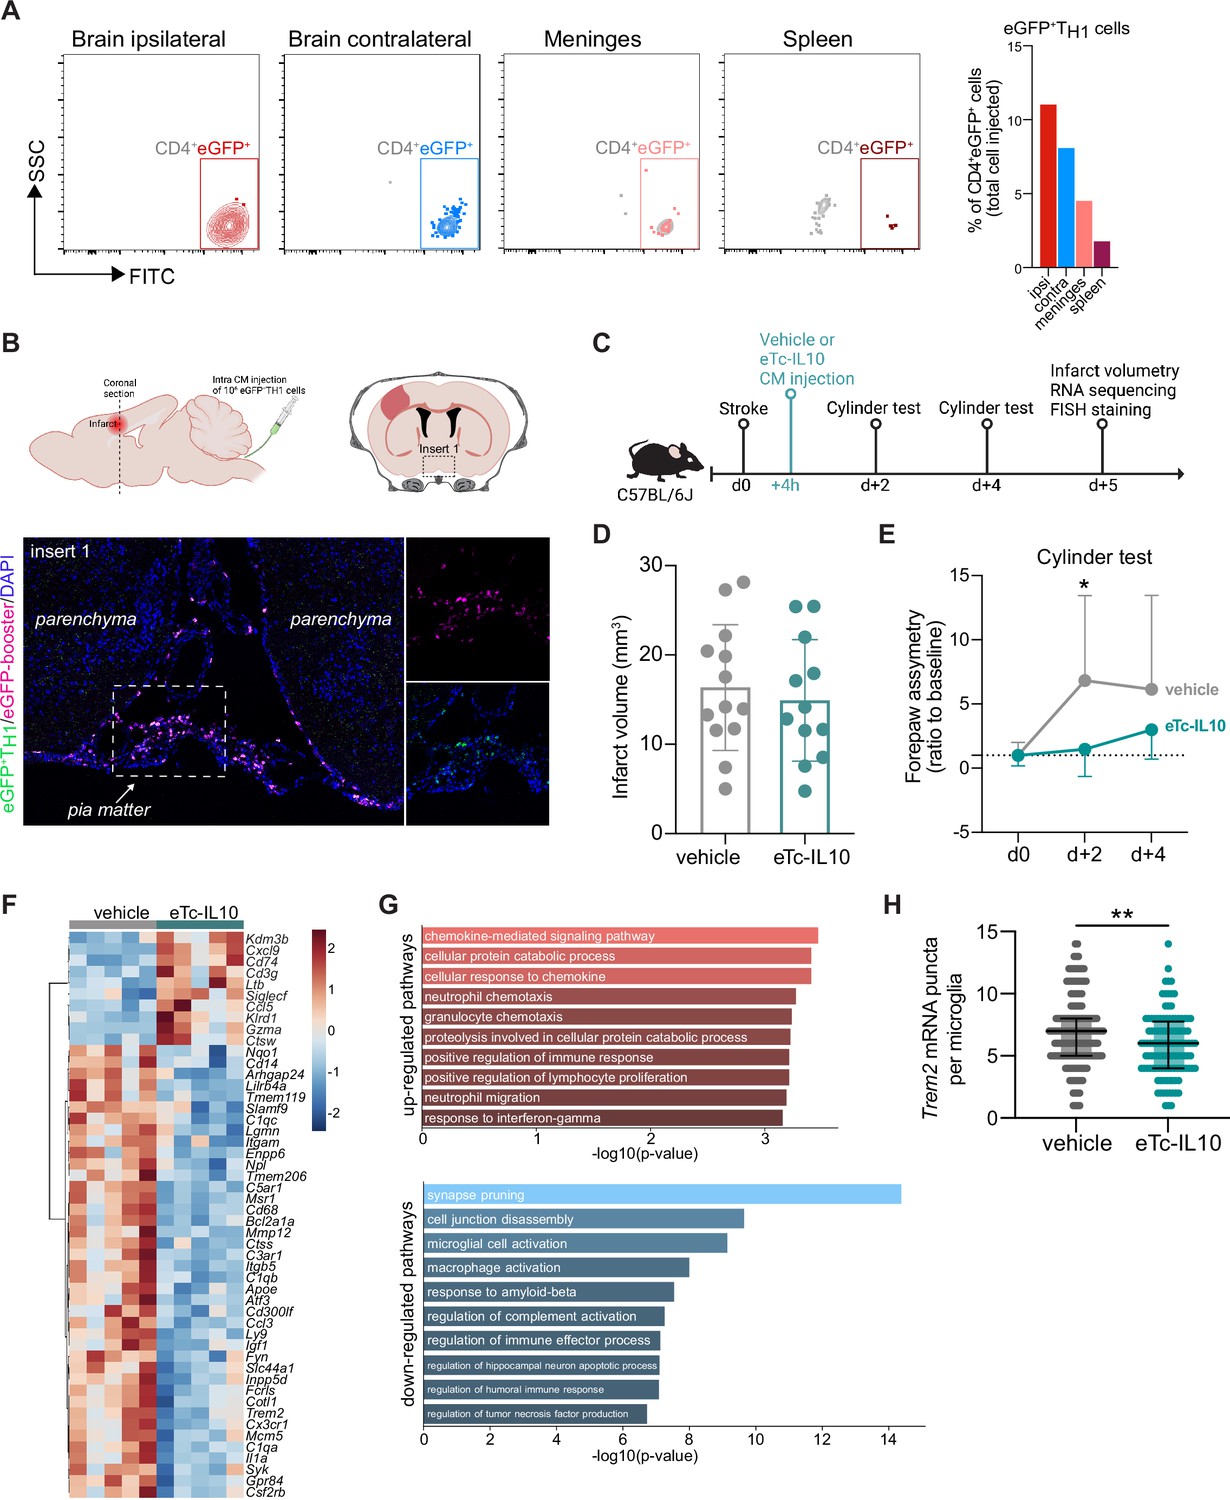
Acute post-stroke treatment with engineered T cells overexpressing IL-10 modulates microglial activation and ameliorates functional deficit.
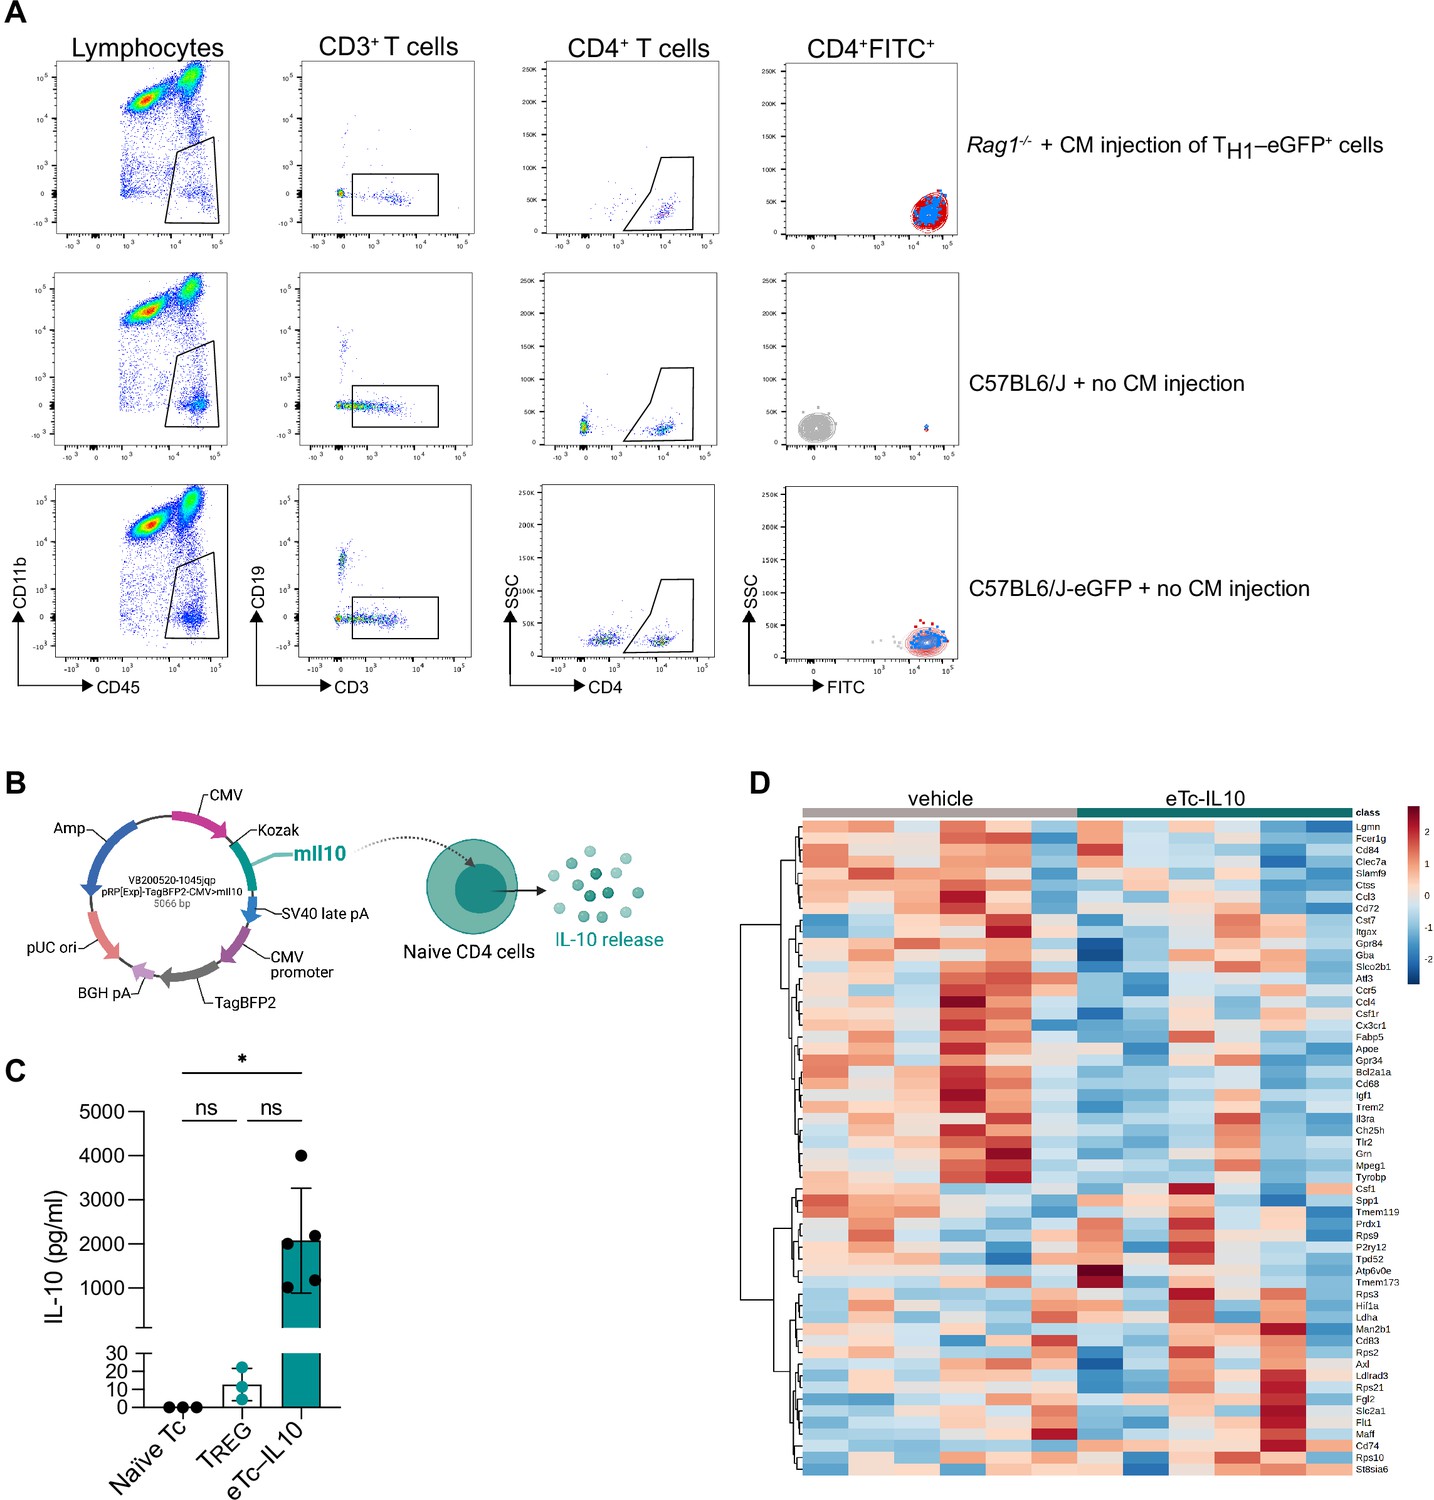
(A and B) Flow cytometry analysis and whole skull-brain coronal sections of 106 eGFP+TH1 cells injected into the cisterna magna (CM) of Rag1−/− mice 24 hr after stroke. Samples were collected 4 hr after CM injection for further analysis. (A) Flow cytometry plots showing CD4+eGFP+ cells isolated from the brain (ipsilateral and contralateral hemispheres), meninges, and spleen (the detailed gating strategy is shown in Figure 4—figure supplement 1A). The graph represents the percentage of eGFP+TH1 cells relative to the total number of cells injected in the CM (106 eGFP+TH1 cells). (B) Coronal section showing eGFP+TH1 cells in the meninges. Insert 1 indicates a representative photomicrograph of eGFP+TH1 cells counterstained with an eGFP-booster (magenta), and cell nuclei are stained with 4’,6-Diamidin-2-phenylindol (DAPI; blue). The magnified images of white boxed area show eGFP+TH1 cells injected into the CM are located in the meninges. (C) Timeline of the experimental design. (D) Infarct volumes at 5 days after stroke in wild-type (WT) C57BL/6 J mice treated by CM administration of either T cells secreting IL-10 (eTc-IL10, 106 naïve CD4+) cells transfected with a plasmid overexpressing IL-10, Figure 4—figure supplement 1B, C, d or vehicle (aCSF) 4 hr after stroke induction. (E) Percentage of assymetry in independent forepaw use (‘0%’ indicates symmetry) in mice treated with vehicle or eTc-IL10; *, p<0.05, ANOVA with Šídák’s multiple comparisons test; n=12–13 mice per condition. (F) Heatmap representation of ipsilateral brain gene expression between vehicle and eTc-IL10 treated mice 5 days after stroke; n=5 mice per condition; one sample per condition was excluded due to unsatisfactory quality control check. (G) Selected gene ontology annotations for the 50 genes that were up-(top) and down-regulated (bottom) in the whole ipsilateral brain tissue of eTc-IL10 treated mice in comparison to vehicle treated mice. (H) Single-molecule fluorescence in situ hybridization (smFISH) analysis of brains from eTc-IL10 treated mice showed a reduction of Trem2 mRNA puncta per Cx3cr1-positive microglia in the peri-infarct region in comparison to vehicle treated mice; **, p<0.01, Mann-Whitney U test; each dot corresponds to one microglial cell; n=3 mice per condition; graphs show the median with interquartile range.
Figure 4—figure supplement 1
Localization of polarized T cell and IL-10 plasmid construct.
(A) Gating strategy of CD4+eGFP+ cells analyzed by flow cytometry in the ipsilateral (red) and contralateral (blue) hemispheres (CD45+CD11b–CD19–CD3+CD4+FITC+) in Rag1−/− (top row), C57BL6/J (no cell injection, mid-row) and in C57BL6/J actin-eGFP mice (no cell injection, bottom row). (B) Plasmid expression vector pIL-10 was constructed by inserting 537 bp IL-10 cDNA under a CMV promoter with a BFP2 tag and ampicillin resistance. (C) IL-10 concentration measured by ELISA in naïve T cells, regulatory T cells (TREG), and naïve T cell transfected with pIL-10 (eTc-IL10); bar plots are represented as mean ± SD; each data point corresponds to an individual biological replicate which was averaged from 2 technical replicates; ns, non significant; *, p<0.05. (D) Heatmap representation of brain gene expression between vehicle and eTc-IL10 treated mice selected from the known disease-associated microglial genes (Keren-Shaul et al., 2017).
Author response image 1
Additional files
Download links
A two-part list of links to download the article, or parts of the article, in various formats.
Downloads (link to download the article as PDF)
Open citations (links to open the citations from this article in various online reference manager services)
Cite this article (links to download the citations from this article in formats compatible with various reference manager tools)
T cells modulate the microglial response to brain ischemia
eLife 11:e82031.
https://doi.org/10.7554/eLife.82031


