Presynaptic contact and activity opposingly regulate postsynaptic dendrite outgrowth
- Institute of Neuroscience, Howard Hughes Medical Institute, University of Oregon, United States
Figures
Figure 1 with 1 supplement
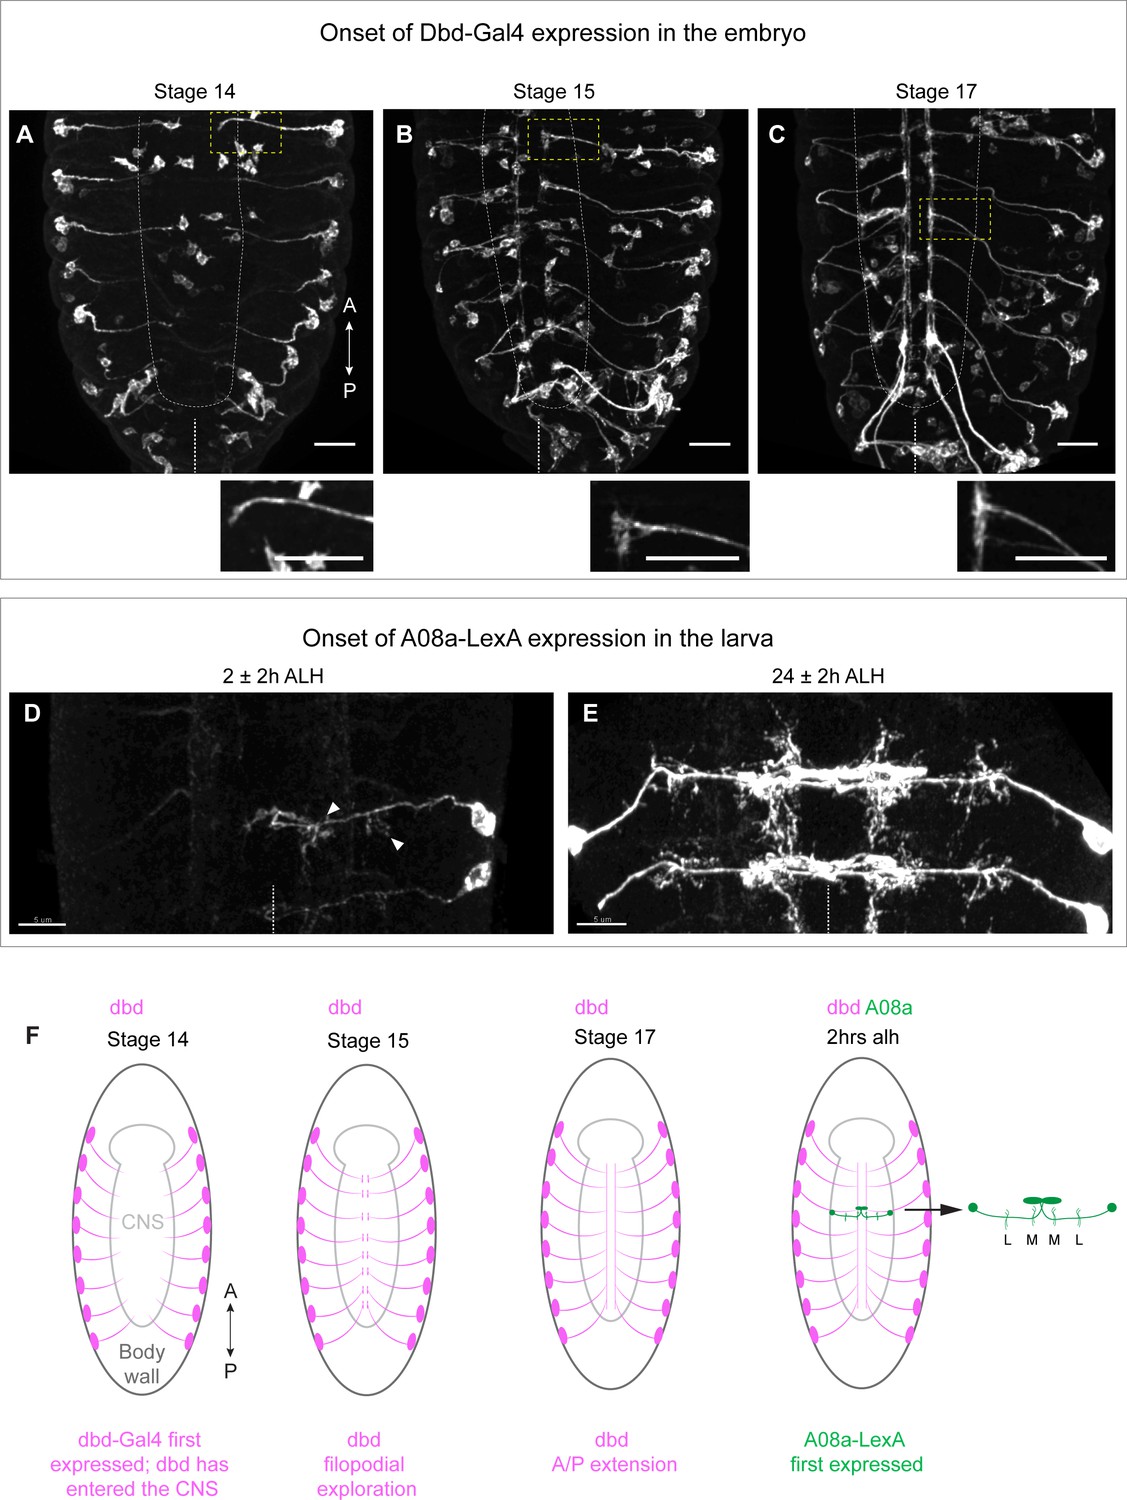
Onset of dbd-Gal4 and A08a-LexA expression in the embryo and early larva.
(A–C) Stage 14, 15, and 17 fixed embryos. dbd-Gal4 pattern labeled with smGdP-myr::HA (white). Stage 14, n=4 animals; stage 15, n=13 animals; stage 17, n=17 animals. Cell bodies not in the body wall are likely part of the gut. Insets show zoomed in view of dbd outlined by yellow dashed box. White dashed line indicates outline of central nervous system (CNS). Midline indicated by white dashed line at the bottom of each image. Scale bars, 20 μm. (D) Dorsal view of VNC at 2±2 hr after larval hatching (alh) showing A08a-LexA expression pattern labeled with smGdP-myr::V5 in white. Arrow heads indicate the medial and lateral dendrites. In this image, LexA expression is on in A1R, weakly in A2R, and not at all in the opposing A1L and A2L hemisegments. n=7 animals. (E) Dorsal view of VNC at 26±2 hr alh. A08a-LexA is expressed robustly in all hemisegments at this time. n=7 animals. Images are max intensity projections. Scale bars, 5 μm. Midline indicated by white dotted line. (F) Illustrations summarizing results in A–D.
Figure 1—figure supplement 1
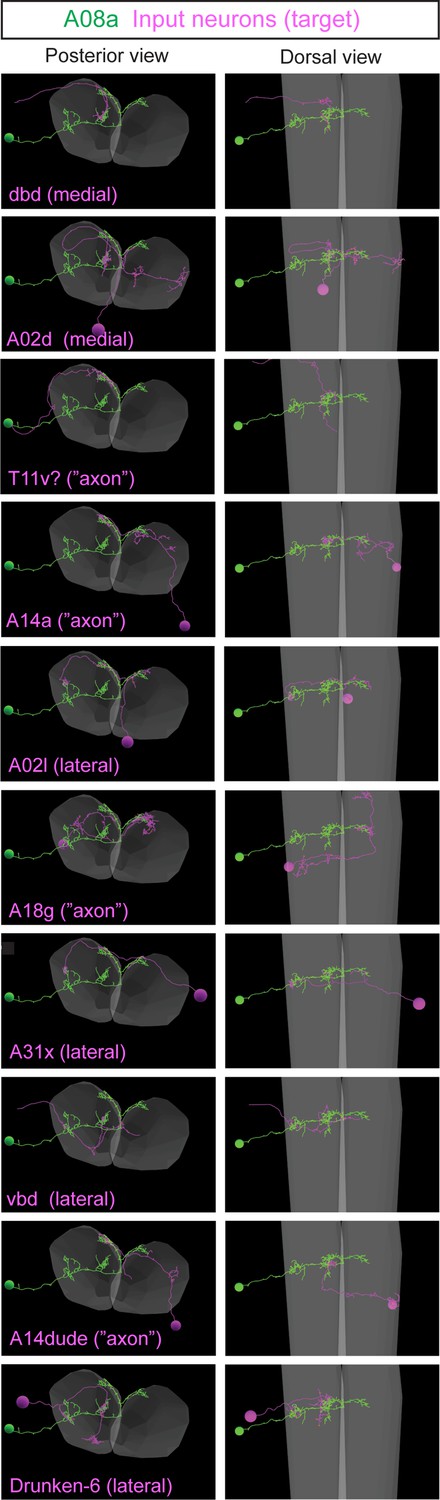
Neurons with the most synapses with A08a.
All neurons from A1 in the CATMAID TEM volume, shown in posterior and dorsal views. Green, A08a neuron with lateral dendrite arbor, medial dendrite arbor, and output domain. Magenta, top inputs to A08a; note that all neurons choose to synapse with only one domain: lateral, medial, or axon/output.
Figure 2
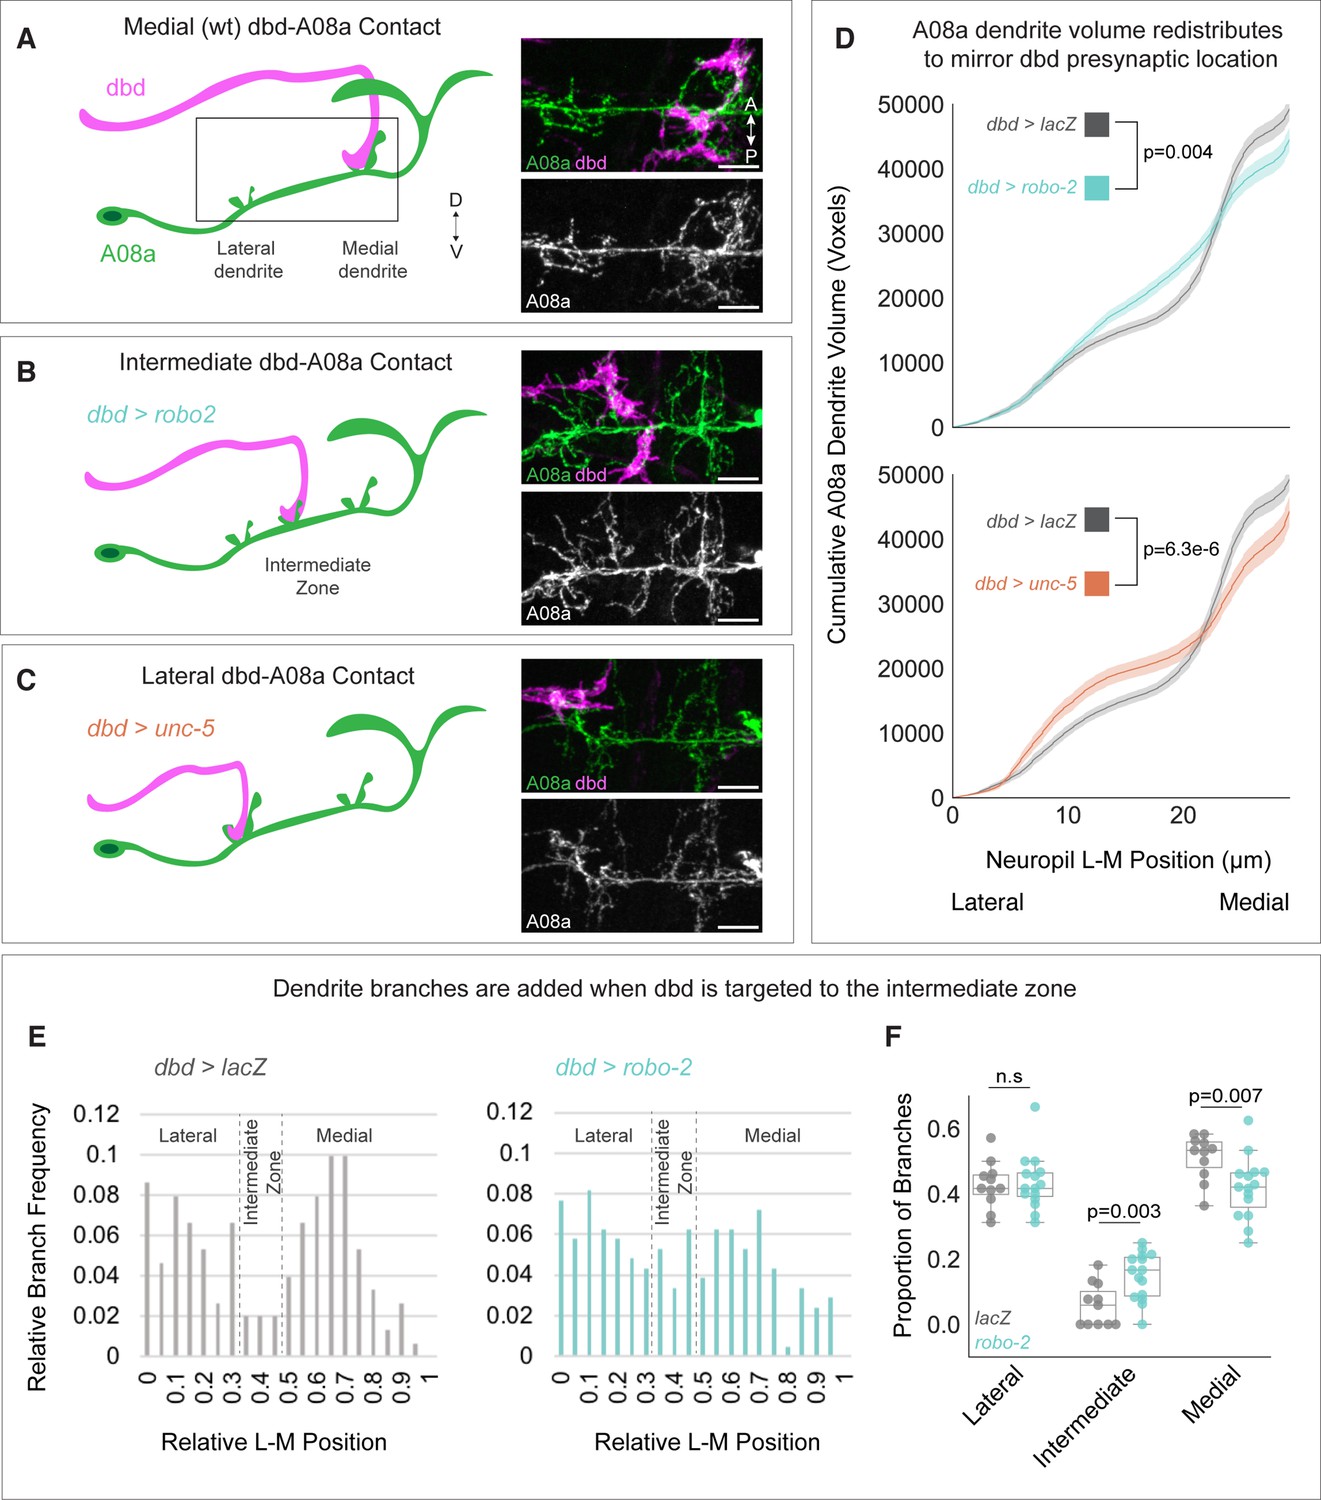
Dendrite development is promoted by presynaptic axons.
(A) Left: Illustration of wild-type dbd (pink) and A08a (green). dbd projects to the A08a medial dendrite. Right: A08a dendritic domain (boxed region shown in cartoon). dbd (pink) contacts the medial A08a dendrite (green). Secondary image of A08a channel alone (white) shows two distinct dendritic domains. (B) Left: Robo2 misexpression leads dbd to project to the A08a intermediate dendritic domain. Right: dbd contacts the intermediate A08a dendritic domain, where there are ectopic dendrites. (C) Left: Unc-5 misexpression leads dbd to project to the A08a lateral dendrite. Right: dbd contacts the lateral A08a dendrite, where there is ectopic dendritic material. Scale bar, 5 μm. Micrographs are from larvae aged 24±4 hr after larval hatching (alh). (D) Cumulative distribution of A08a dendrite volume (voxels) across the lateral-medial axis in conditions where dbd projects to the medial (gray, n=17 cells, 11 animals), intermediate (cyan, n=20 cells, 10 animals), or lateral (orange, n=11 cells, 10 animals) A08a dendrite. Solid line = mean distribution; shaded area = standard error of the mean (SEM). A08a dendrites receiving input from intermediate or lateral dbd neurons have significantly different volume distributions from wild-type dendrites (lacZ vs. robo-2, p=0.004; lacZ vs unc-5, p=6.3e-6. Two-way Kolmogorov-Smirnov test). Note that the control LacZ trace is the same for top and bottom panels. (E) Relative lateral-medial distribution of A08a dendrite branch points from the main A08a neurite in conditions where dbd projects to the medial (gray, n=11 cells from 7 animals) or intermediate (cyan, n=15 cells from 8 animals) dendritic domain. Lateral, intermediate, and medial boundaries are demarcated based on the local minimum of the LacZ distribution. (F) Proportion of branches occupying lateral, intermediate, and medial A08a dendritic domains when dbd projects to the medial dendrite (gray, n=11 cells from 7 animals) or intermediate zone (cyan, n=15 cells from 8 animals). Individual points represent single cells. When dbd projects to the intermediate domain, there are more A08a branches in the intermediate domain and fewer in the medial domain (Lateral Domain: lacZ vs. robo-2, p=0.85; Intermediate Domain: lacZ vs. robo-2, p=0.003; Medial Domain: lacZ vs. robo-2, p=0.007. Statistics computed using two-tailed unpaired t-test with unequal variance).
Figure 3 with 1 supplement
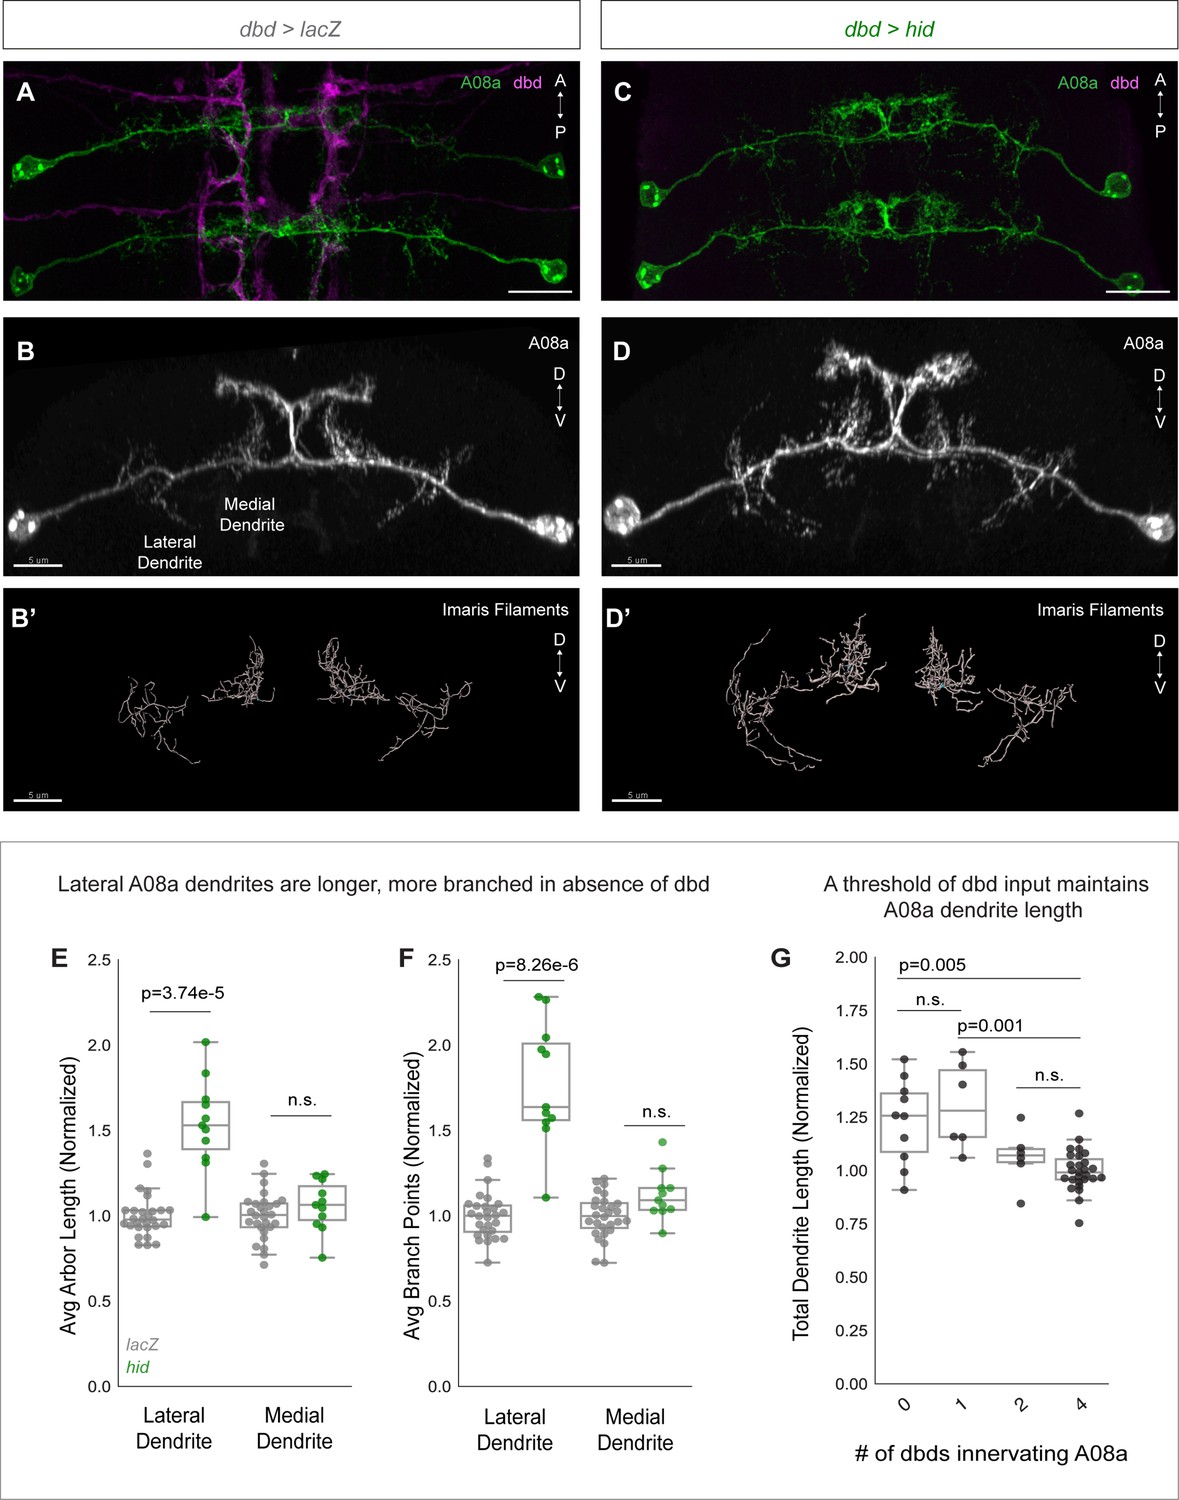
dbd ablation causes A08a lateral dendrite expansion.
(A) Control VNC at 24±2 hr after larval hatching (alh), dorsal view. A08a neurons (green) are innervated by dbd neurons (magenta). Scale bar, 10 μm. (B) Control A08a neurons from abdominal segment 1 of (A), posterior view. Scale bar, 5 μm. (B’) Imaris filament reconstruction of A08a dendrites in (B). Scale bar, 5 μm. (C) dbd ablation VNC at 24±2 hr alh, dorsal view. A08a neurons (green) lack innervation from dbd neurons (magenta). (D) A08a neurons in dbd ablation background from abdominal segment 1 of (C), posterior view. Scale bar, 5 μm. (D’) Imaris filament reconstruction of A08a dendrites in (D). Scale bar, 5 μm. (E) Average dendrite length of lateral and medial A08a dendritic arbors in LacZ (control, gray, n=28 animals) or Hid-expressing animals (green, n=11 animals). Hid animals have longer lateral dendrites (p=3.74e-5) but unchanged medial dendrite length (p=0.56). Values normalized to control mean for either lateral or medial arbor. Circles represent single-animal averages between left and right hemisegments. Values for Hid-expressing animals with 0 remaining dbd neurons innervating A1 segment are shown in (E) and (F). (F) Number of dendrite branch points of lateral and medial A08a dendritic arbors in LacZ (control, gray, n=28 animals) or Hid-expressing animals (green, n=11 animals). Hid animals have more branched lateral dendrites (p=8.26e-6) and unchanged levels of branching among medial dendrites (p=0.06). (G) Total A08a dendrite length when A08a is innervated by 4 (LacZ control, n=28 animals), 2 (Hid, n=6 animals), 1 (Hid, n=6 animals), or 0 (Hid, n=10 animals) dbd neurons. No statistical difference between 4 vs. 2 dbds (p=0.31) or 0 vs 1 dbd (p=0.50). 1 dbd vs. 4 dbds results in longer A08a dendrites (p=0.001) and 0 vs. 4 dbds results in longer A08a dendrites (p=0.005). Circles represent single-animal dendrite length summed across left and right hemisegments. Data are normalized to dendrites innervated by 4 dbd neurons (LacZ control). Statistics computed using two-tailed unpaired t-test with unequal variance. n.s.=not significant, p>0.05.
Figure 3—figure supplement 1
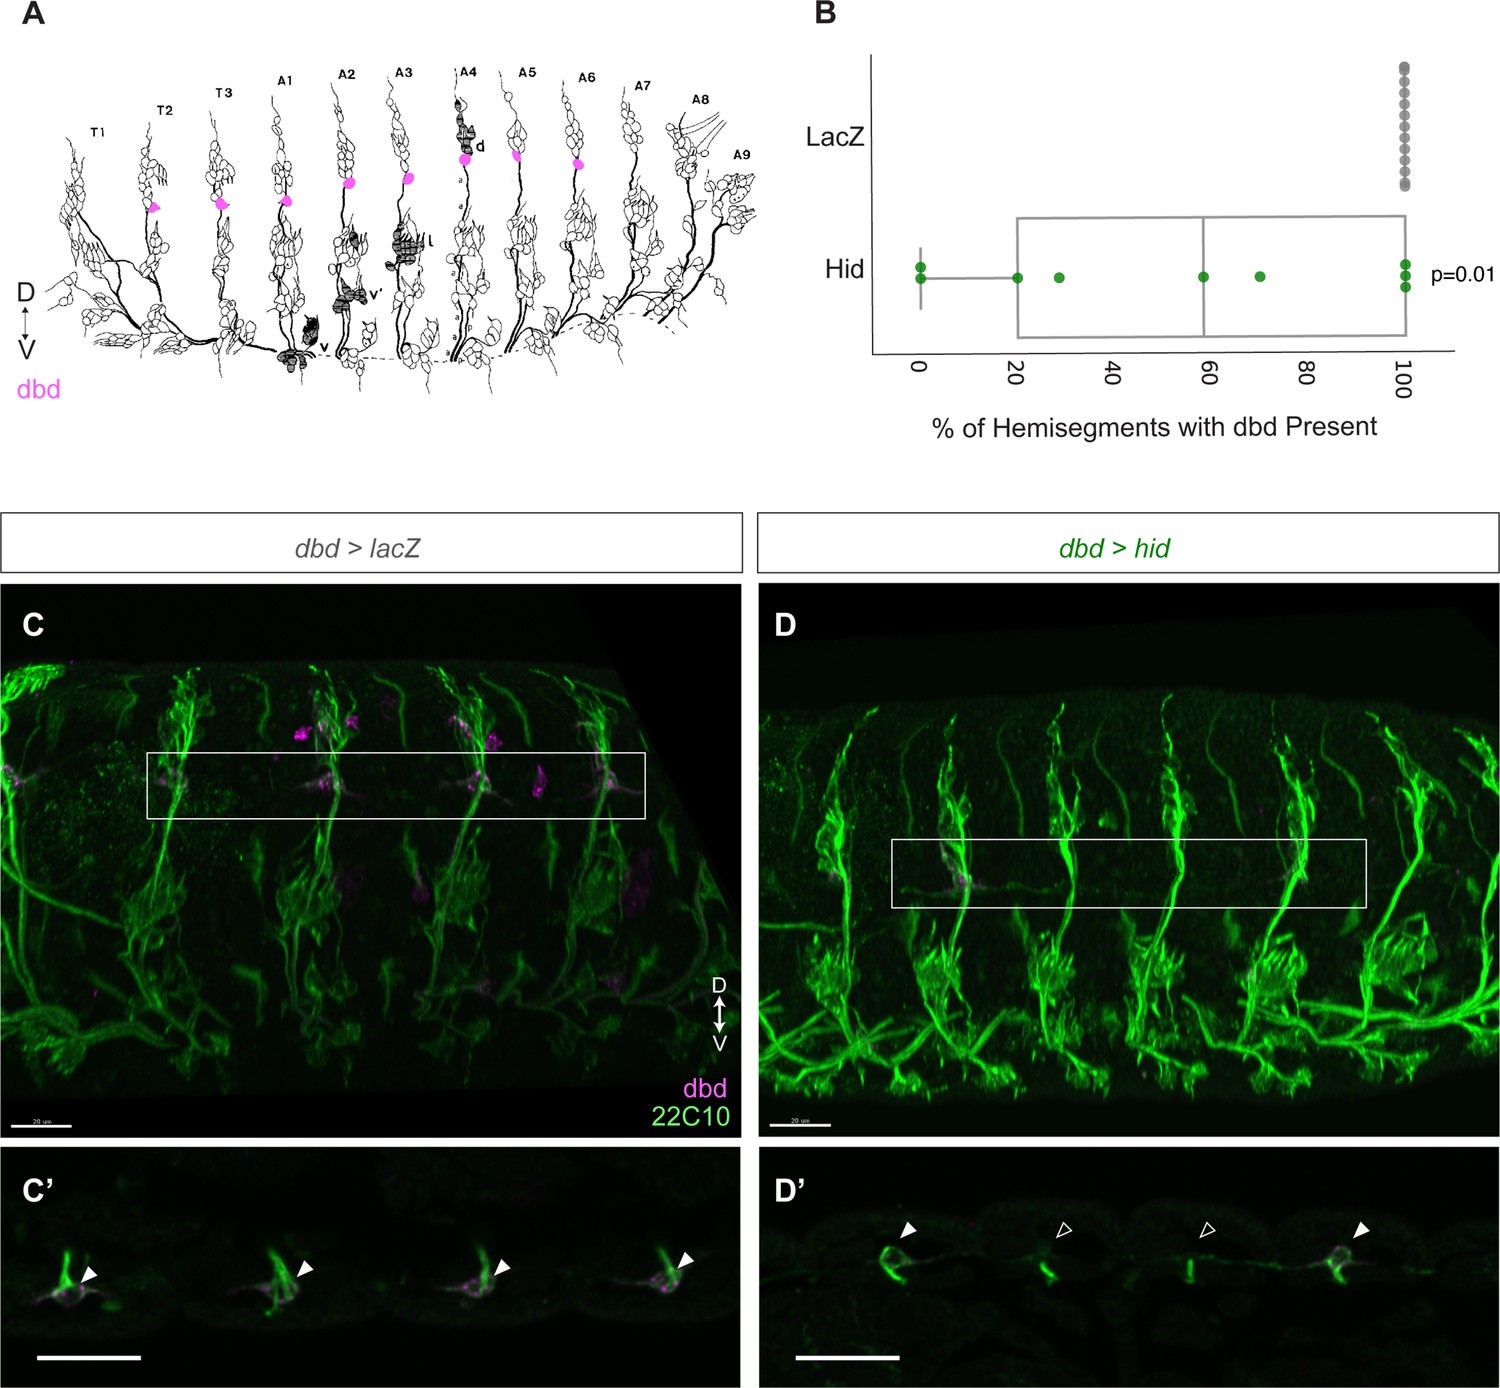
Validation of dbd ablation.
(A) Illustration of embryonic sensory neuron anatomy (modified from Ghysen et al., 1986). Sensory neuron anatomy is segmentally repeated, and cell bodies are in stereotyped positions in the dorsal-ventral axis. Dbd cell bodies are highlighted in pink, positioned at the base of the dorsal-most cluster or cell bodies. Anterior is to the left. (B) Percentage of hemisegments containing an intact dbd cell body, identified by 22C10 staining in control (gray) or Hid-expressing (green) embryos. All control embryos had dbd 22C10 labeling in 100% of hemisegments (n=14 embryos). Hid-expressing embryos had fewer dbd neurons (n=6 embryos; p=0.01, two-tailed unpaired t-test). Hid embryos with 100% of dbd neurons intact (n=3 embryos) were likely CyO+ instead of Hid+ (see Materials and methods). (C–C’) Stage 17 control embryo. 22C10 labels all sensory neurons (green), dbd-Gal4>myr::HA labels dbd and other cells (magenta). Scale bar, 20 μm. (C’) Substack of dbd cell bodies (filled arrowheads) boxed in (C). Scale bar, 20 μm. (D–D’) Stage 17 Hid-expressing embryo. 22C10 labels all sensory neurons (green), dbd-Gal4>smGdP-myr::HA labels dbd and other cells. Scale bar, 20 μm. (D’) Substack of dbd cell bodies boxed in (D). dbd cell bodies are present in the first and last segment (filled arrowhead) and missing in the middle two segments (empty arrowhead), indicative of successful ablation. Scale bar, 20 μm.
Figure 4
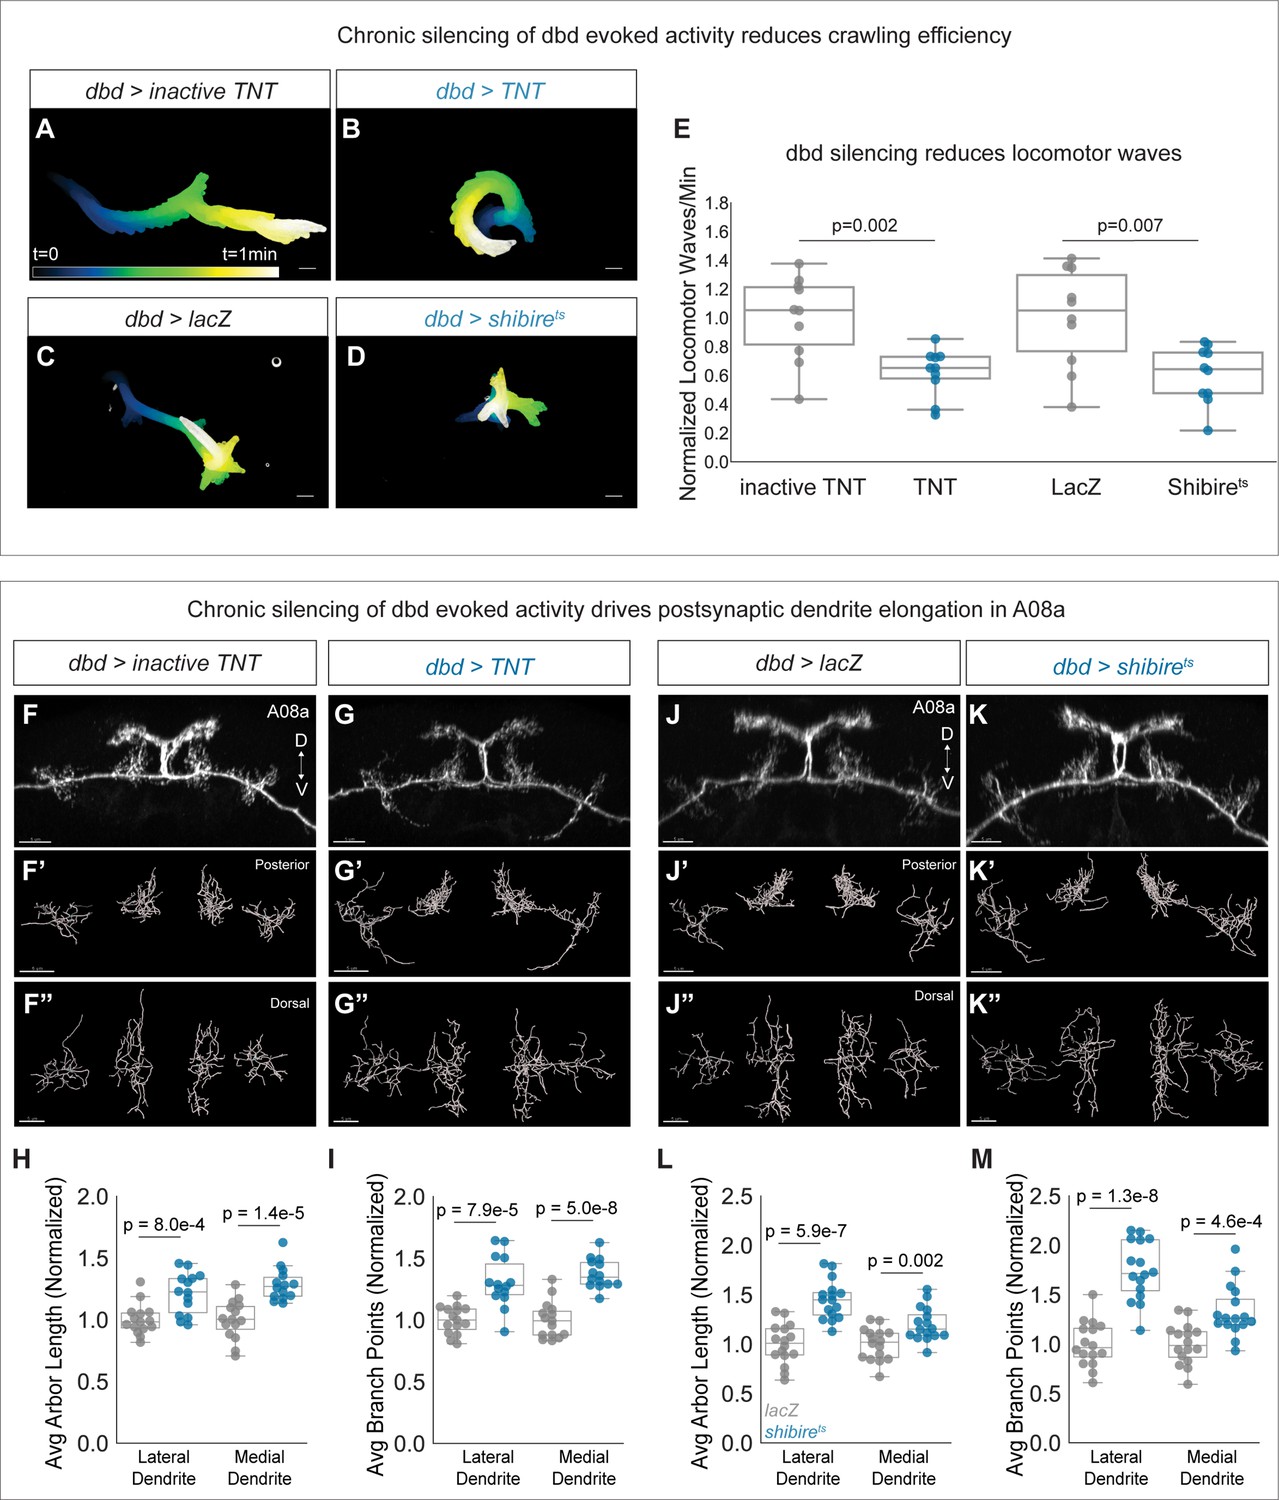
Chronic silencing of dbd activity drives A08a dendrite elongation.
(A) Representative crawling trace of inactive tetanus toxin light chain (TNT) control larva (26±2 hr after larval hatching [alh]). Trace is color-coded by time. Scale bar, 1 mm. (B) Representative crawling trace of TNT larva (26±2 hr alh). (C) Representative crawling trace of control LacZ-expressing larva (24±2 hr alh). Trace is color-coded by time. Scale bar, 1 mm. (D) Representative crawling trace of Shibirets larva (24±2 hr alh). (E) Number of locomotor waves (forward and reverse) initiated in 1 min, normalized to corresponding control. Control animals (gray) initiate more locomotor waves relative to animals with silenced dbd neurons (blue). Inactive TNT, n=10 animals; TNT, n=10 animals; LacZ, n=10 animals; Shibirets, n=10 animals (inactive TNT vs. TNT, p=0.002; LacZ vs. Shibirets, p=0.007). Circles represent locomotor waves of single animals. (F) Control A08a neurons at 26±2 hr alh, posterior view. (F’) Posterior view of Imaris filament reconstruction of A08a dendrites in (F). (F”) Dorsal view of (F’). (G) A08a neurons receiving input from TNT-expressing dbds at 26±2 hr alh, posterior view. (G’–G") Imaris filament reconstructions of dendrites in (G). (H) Average dendrite length of lateral and medial A08a dendritic arbors in inactive TNT (control, gray, n=15 animals) or TNT-expressing animals (blue, n=14 animals) (Lateral Dendrite: p=8e-4; Medial Dendrite: p=1.4e-5). (I) Number of dendrite branch points of lateral and medial A08a dendritic arbors in inactive TNT (control, gray, n=15 animals) or TNT-expressing animals (blue, n=14 animals) (Lateral Dendrite: p=7.9e-5; Medial Dendrite: p=5e-8). (J) Control A08a neurons at 24±2 hr alh, posterior view. (J’–J") Imaris filament reconstructions of dendrites in (J). (K) A08a neurons from receiving input from Shibirets-expressing dbd, posterior view. (K’–K") Imaris filament reconstructions of dendrites in (K). (L) Average dendrite length of lateral and medial A08a dendritic arbors in LacZ (control, gray, n=16 animals) or Shibirets-expressing animals (blue, n=16 animals) (Lateral Dendrite: p=5.9e-7; Medial Dendrite: p=0.002). (M) Number of dendrite branch points of lateral and medial A08a dendritic arbors in LacZ (control, gray, n=16 animals) or Shibirets-expressing animals (blue, n=16 animals) (Lateral Dendrite: 1.3e-8; Medial Dendrite: 4.6e-4). Images in F–G” and J–K” are Imaris 3D projections, Scale bars, 5 μm. Statistics computed using two-tailed unpaired t-test with unequal variance.
Figure 5
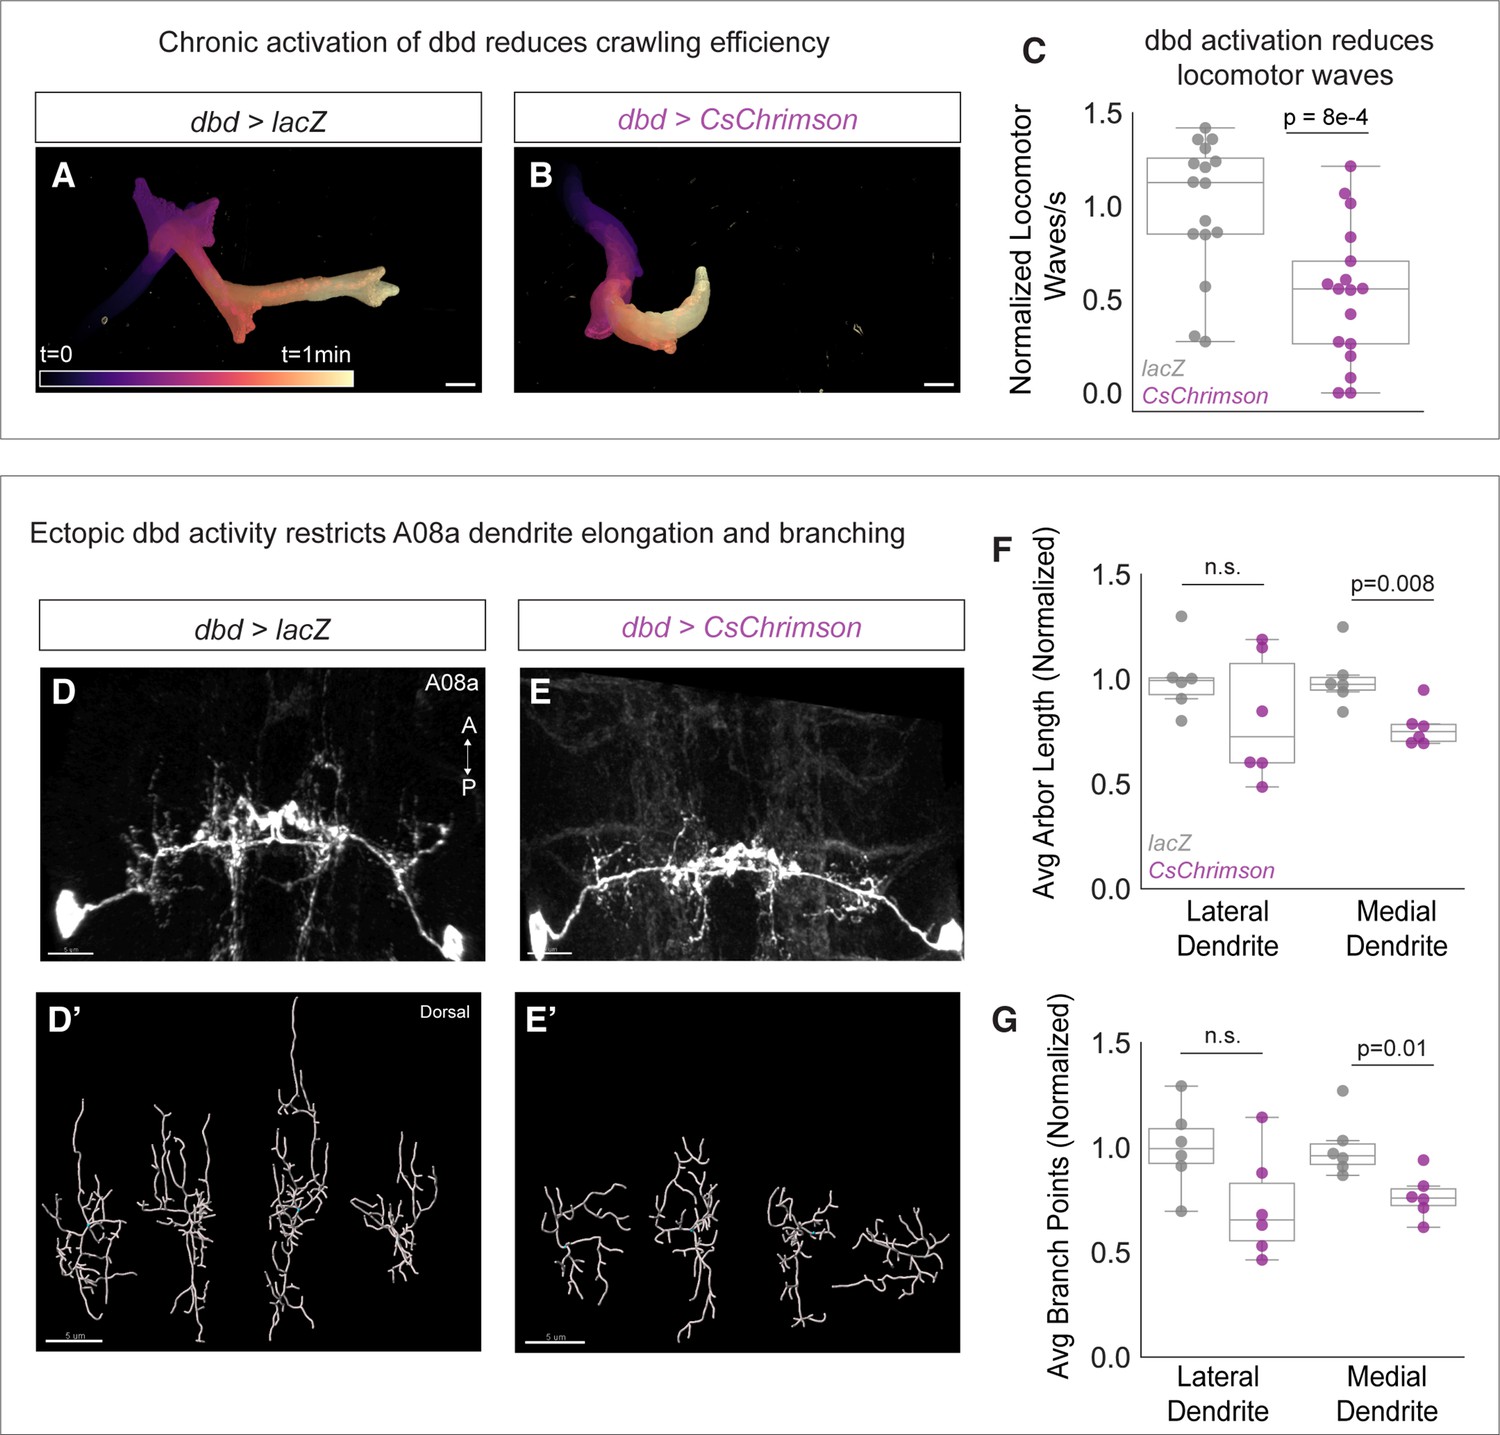
Chronic activation of dbd reduces A08a dendrite length.
(A) Representative crawling trace of control (UAS-lacZ) larva (25±2 hr after larval hatching [alh]). Trace is color-coded by time. Scale bar, 1 mm. (B) Representative crawling trace of CsChrimson larva (25±2 hr alh). (C) Average number of locomotor waves (forward and reverse) per second, normalized to control average. Control animals (gray) initiate more locomotor waves relative to animals with Chrimson-activated dbd neurons (magenta) (p=8e-4). Control, n=16 animals; Chrimison, n=17 animals. (D) Control A08a neurons control animal at 25±2 hr alh, dorsal view. (D’) Imaris filament reconstructions of dendrites in (D). (E) A08a neurons receiving input from CsChrimson-expressing dbd neurons, activated throughout development. (E’) Imaris filament reconstructions of dendrites in (E). (F) Average dendrite length of lateral and medial A08a dendritic arbors in control (gray, n=6 animals) or CsChrimson-expressing animals (magenta, n=6 animals) (Lateral Dendrites: p=0.22; Medial Dendrites: p=0.008). (G) Number of dendrite branch points of lateral and medial A08a dendritic arbors in control (gray, n=6 animals) or CsChrimson-expressing animals (magenta, n=6 animals) (Lateral Dendrites: p=0.06; Medial Dendrites: p=0.01). Images are Imaris 3D projections. Scale bars, 5 μm. Values for all quantification normalized to control mean for either lateral or medial arbor. Circles represent single-animal averages between left and right hemisegments. Statistics computed using two-tailed unpaired t-test with unequal variance. n.s.=not significant, p>0.05.
Figure 6
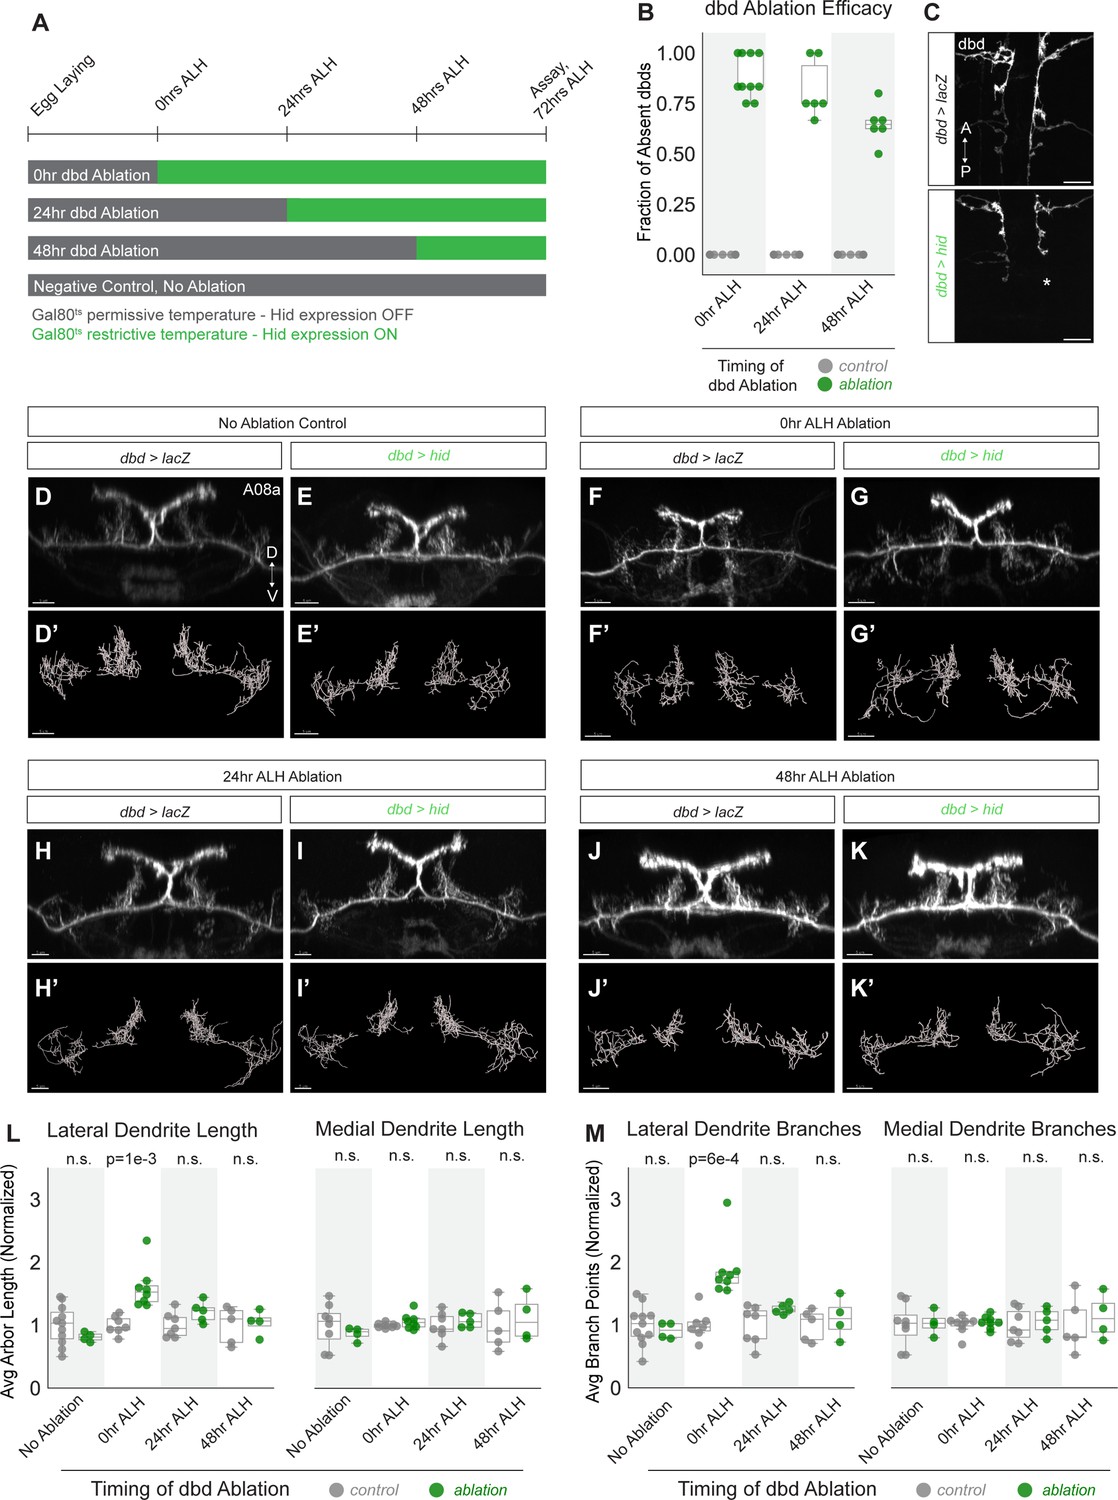
A08a dendrite plasticity is confined to a critical period in larval development.
(A) Experimental design. Hid expression was inhibited at 18°C by Gal80ts (gray bars). Hid expression was induced by shifting animals to 30°C (green bars) at the 25°C equivalent of 0 hr after larval hatching (alh), 24 hr alh, and 48 hr alh. A08a dendrites were assayed for length and branching at the 25°C developmental equivalent of 72 hr alh. (B) Fraction of dbds absent in control (UAS-lacZ) or ablation (UAS-hid) samples at 72 hr alh after initiating Hid expression at 0 hr alh (control n=11 animals; hid n=10 animals), 24 hr alh (control n=15 animals, Hid n=6 animals), and 48 hr alh (control n=13 animals, Hid n=6 animals). (C) Representative images of control (top) and ablation (bottom) samples showing first two abdominal segments. Samples are from the 48 hr alh ablation cohort, and were imaged at 72 hr alh. Control animals retain the full complement of dbds, while the hid sample shows a missing dbd in A2 indicated by the asterisk (*). Scale bars, 10 μm. (D) Control A08a raised continuously at 18°C. Imaris filament reconstructions of A08a dendrites in (D’). (E) A08a in hid-expressing animal raised continuously at 18°C. Imaris filament reconstructions of A08a dendrites in (E’). (F) A08a in control animal shifted to 30°C at 0 hr alh. Imaris filament reconstructions of A08a dendrites in (F’). (G) A08a in hid-expressing animal shifted to 30°C at 0 hr alh. Imaris filament reconstructions of A08a dendrites in (G’). (H) A08a in control animal shifted to 30°C at 24 hr alh. Imaris filament reconstructions of A08a dendrites in (H’). (I) A08a in hid-expressing animal shifted to 30°C at 24 hr alh. Imaris filament reconstructions of A08a dendrites in (I’). (J) A08a in control animal shifted to 30°C at 48 hr alh. Imaris filament reconstructions of A08a dendrites in (J’). (K) A08a in hid-expressing animal shifted to 30°C at 48 hr alh. Imaris filament reconstructions of A08a dendrites in (K’).Images in D-K are Imaris 3D projections. Scale bars, 5μm. (L) Average dendrite length of lateral (left) and medial (right) A08a dendritic arbors in control (UAS-lacZ; gray) or experimental, ablation (UAS-hid, green). (M) Average number of branch points on lateral (left) and medial (right) A08a dendrites in control (UAS-lacZ; gray) or experimental, ablation (UAS-hid, green). X-axes, timing of dbd ablation (no ablation control: control n=8–11 animals, Hid n=4 animals; 0 hr alh ablation: control n=7–8 animals, Hid n=8 animals; 24 hr alh ablation: control n=7 animals, Hid n=5 animals; 48 hr alh ablation: control n=5 animals, Hid n=4 animals). For Hid quantifications, only segments containing 0–1 dbds were analyzed (determined by absence of dbd membrane stain). Values for all quantification normalized to control mean for each ablation timepoint. Circles represent single-animal averages between left and right hemisegments. Statistics computed using two-tailed unpaired t-test with unequal variance. n.s=not significant, p>0.05.
Figure 7
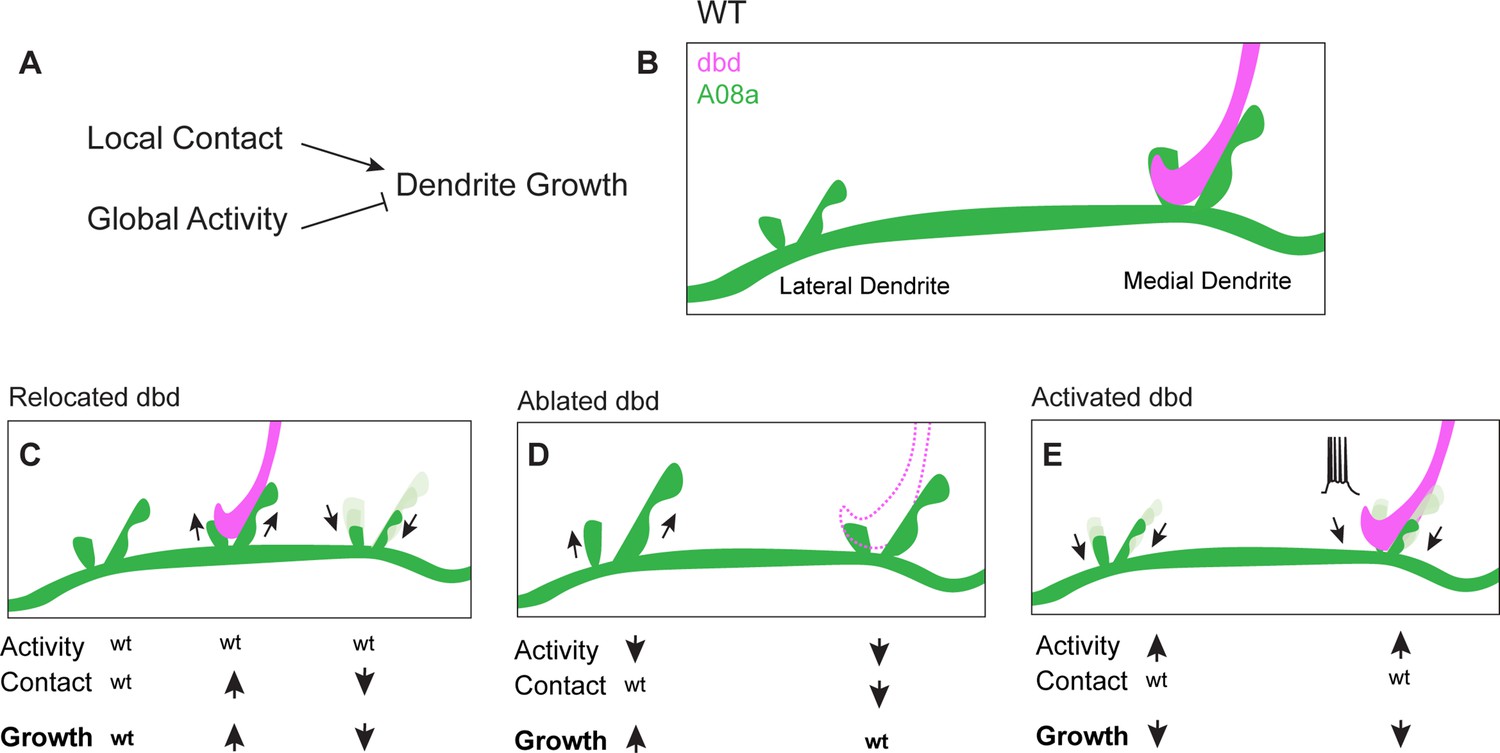
Proposed model: Presynaptic activity and contact opposingly regulate dendrite outgrowth.
(A) Presynaptic contact promotes local dendrite outgrowth, while presynaptic activity levels inhibit neuron-wide dendrite outgrowth. (B) Wild-type (WT) A08a dendrites. (C) When dbd is mistargeted to intermediate A08a dendritic domain, activity levels are wt. Local outgrowth is promoted at the intermediate domain, and inhibited by lack of contact at the medial dendrite. (D) When dbd is ablated, neuron-wide activity levels are decreased. This promotes lateral dendrite outgrowth. Lack of contact at the medial dendrite opposes the activity-dependent drive to elongate so dendrite length remains wt. (E) dbd activation promotes neuron-wide dendrite retraction/premature stabilization.
Tables
Table 1
Top postsynaptic partners of dbd.
Top 10 neurons with the most synapses with dbd in segment A1. Neurons must be observed in both left and right hemisegments and have a minimum of ≥3 synapses with dbd combined.
| Neuronidentifier | Cell body location | Synapses with dbd in A1 |
|---|---|---|
| Clamp-3 | A2 | 42 |
| A02a | A1+A2 | 37 |
| Jaam-4 | A1 | 36 |
| JaamXX | A1 | 33 |
| Jaam-3 | A1 | 29 |
| A08a | A1 | 26 |
| A06 | A1 | 24 |
| A08s1 | A2 | 22 |
| A02d | A1 | 21 |
| A08s2 | A2 | 19 |
| A10x | A1 | 17 |
| Jaam-1 | A1 | 16 |
Table 2
Top presynaptic partners of A08a.
Top 10 neurons with the most synapses with A08a in segment A1. Neurons must be observed in both left and right hemisegments and have a minimum of ≥3 synapses with A08a combined.
| Neuronidentifier | Cell body location | Synapses with A08a in A1 | A08a domaininnervated | Neurotransmitter (NT) identity | NT reference |
|---|---|---|---|---|---|
| dbd | A1+A2 | 33 | Medial dendrites | Cholinergic | Salvaterra and Kitamoto, 2001 |
| A02d | A1 | 30 | Medial dendrites | Glutamatergic* | Kohsaka et al., 2014 |
| T11v? | T2 | 24 | Axon/output | ||
| A14a1 | A1 | 21 | Axon/output | ||
| A18g | A2+A3 | 19 | Axon/output | Cholinergic | Hiramoto et al., 2021 |
| A02l | A1 | 16 | Lateral dendrites | Glutamatergic* | Kohsaka et al., 2014 |
| A31x | A1 | 12 | Lateral dendrites | GABAergic | Fushiki et al., 2016 |
| vbd | A1 | 12 | Lateral dendrites | Cholinergic | Salvaterra and Kitamoto, 2001 |
| A14 dude | A2 | 11 | Axon/output | ||
| Drunken-6 | A1 | 7 | Lateral dendrites |
-
*
Note that glutamate can act as an inhibitory neurotransmitter in the Drosophila CNS (Liu and Wilson, 2013; Rohrbough and Broadie, 2002).
Key resources table
| Reagent type (species) or resource | Designation | Source or reference | Identifiers | Additional information |
|---|---|---|---|---|
| Strain, strain background (Drosophila melanogaster) | 26F05-LexA | BDSC | 54702 | Expressed in A08a neurons |
| Strain, strain background (Drosophila melanogaster) | 165-Gal4 | W Grueber | N/A | Expressed in dbd neurons, as well as cIVda neurons |
| Strain, strain background (Drosophila melanogaster) | UAS-robo2::HA | BDSC | 66886 | Expresses HA-tagged Robo2 under UAS control |
| Strain, strain background (Drosophila melanogaster) | UAS-unc-5::HA | A Zarin | N/A | Expresses HA-tagged Unc-5 under UAS control |
| Strain, strain background (Drosophila melanogaster) | UAS-hid, tubP-Gal80ts/CyO | M Freeman | N/A | Expresses Hid under UAS control, Gal80ts negatively regulates Gal4 at 18°C. |
| Strain, strain background (Drosophila melanogaster) | UAS-TeTxLC-G2 | BDSC | 28838 | Expresses the light chain of tetanus toxin under UAS control |
| Strain, strain background (Drosophila melanogaster) | UAS-inactive TeTxLC | BDSC | 28840 | Expresses a mutated tetanus toxin light chain gene under UAS control |
| Strain, strain background (Drosophila melanogaster) | UAS-shi[ts1].K | BDSC | 44222 | Expresses temperature-sensitive shi under UAS control for inhibiting synaptic transmission at 30°C |
| Strain, strain background (Drosophila melanogaster) | UAS-LacZ | BDSC | 8529 | Control transgene |
| Strain, strain background (Drosophila melanogaster) | UAS-LacZ | BDSC | 8530 | Control transgene |
| Strain, strain background (Drosophila melanogaster) | 10xUAS-IVS-myr::smGdP::HA, 13xLexAop2-IVS-myr::smGdP::V5 | BDSC | 64092 | Expresses HA membrane tag under UAS control, V5 membrane tag under LexAop control |
| Strain, strain background (Drosophila melanogaster) | UAS-IVS-CsChrimson.mVenus (attP2) | V Jayaraman | N/A | Expresses CsChrimson tagged with mVenus under UAS control |
| Antibody | Anti-V5 tag mouse monoclonal | Invitrogen, Carlsbad, CA | Cat. R96025, Lot 1949337 | (1:1000) |
| Antibody | Anti-HA tag rat monoclonal | Roche Holding, AG, Basel, Switzerland | Cat. 11867423001, Lot 27573500 | (1:100, after suggested dilution) |
| Antibody | Anti-Futsch (22C10) mouse monoclonal | DSHB, Iowa City, IA | Concentrate 0.1 mL | (1:1000) |
| Antibody | Anti-Corazonin rabbit polyclonal | J Veenstra, Univ Bordeaux | N/A | (1:2000) |
| Antibody | Alexa Fluor 488 AffiniPure Donkey Anti-Mouse IgG (H+L) donkey polyclonal | Jackson ImmunoResearch, West Grove, PA | Cat. 715-545-151 | (1:400) |
| Antibody | Alexa Fluor 647 AffiniPure Donkey Anti-Rat IgG (H+L) donkey polyclonal | Jackson ImmunoResearch, West Grove, PA | Cat. 712-605-153 | (1:400) |
| Antibody | Alexa Fluor 488 AffiniPure Donkey donkey polyclonal Anti-Rat IgG (H+L) | Jackson ImmunoResearch, West Grove, PA | Cat. 712-545-153 | (1:400) |
| Antibody | Alexa Fluor RRX AffiniPure Donkey Anti-Mouse IgG (H+L) donkey polyclonal | Jackson ImmunoResearch, West Grove, PA | Cat. 715-295-151 | (1:400) |
| Antibody | Alexa Fluor 647 AffiniPure Donkey Anti-Mouse IgG (H+L) donkey polyclonal | Jackson ImmunoResearch, West Grove, PA | Cat. 715-605-151 | (1:400) |
Additional files
Download links
A two-part list of links to download the article, or parts of the article, in various formats.
Downloads (link to download the article as PDF)
Open citations (links to open the citations from this article in various online reference manager services)
Cite this article (links to download the citations from this article in formats compatible with various reference manager tools)
Presynaptic contact and activity opposingly regulate postsynaptic dendrite outgrowth
eLife 11:e82093.
https://doi.org/10.7554/eLife.82093


