Activity in developing prefrontal cortex is shaped by sleep and sensory experience
- Interdisciplinary Graduate Program in Neuroscience, University of Iowa, United States
- Department of Psychological and Brain Sciences, University of Iowa, United States
- DeLTA Center, University of Iowa, United States
- Iowa Neuroscience Institute, University of Iowa, United States
Figures
Figure 1
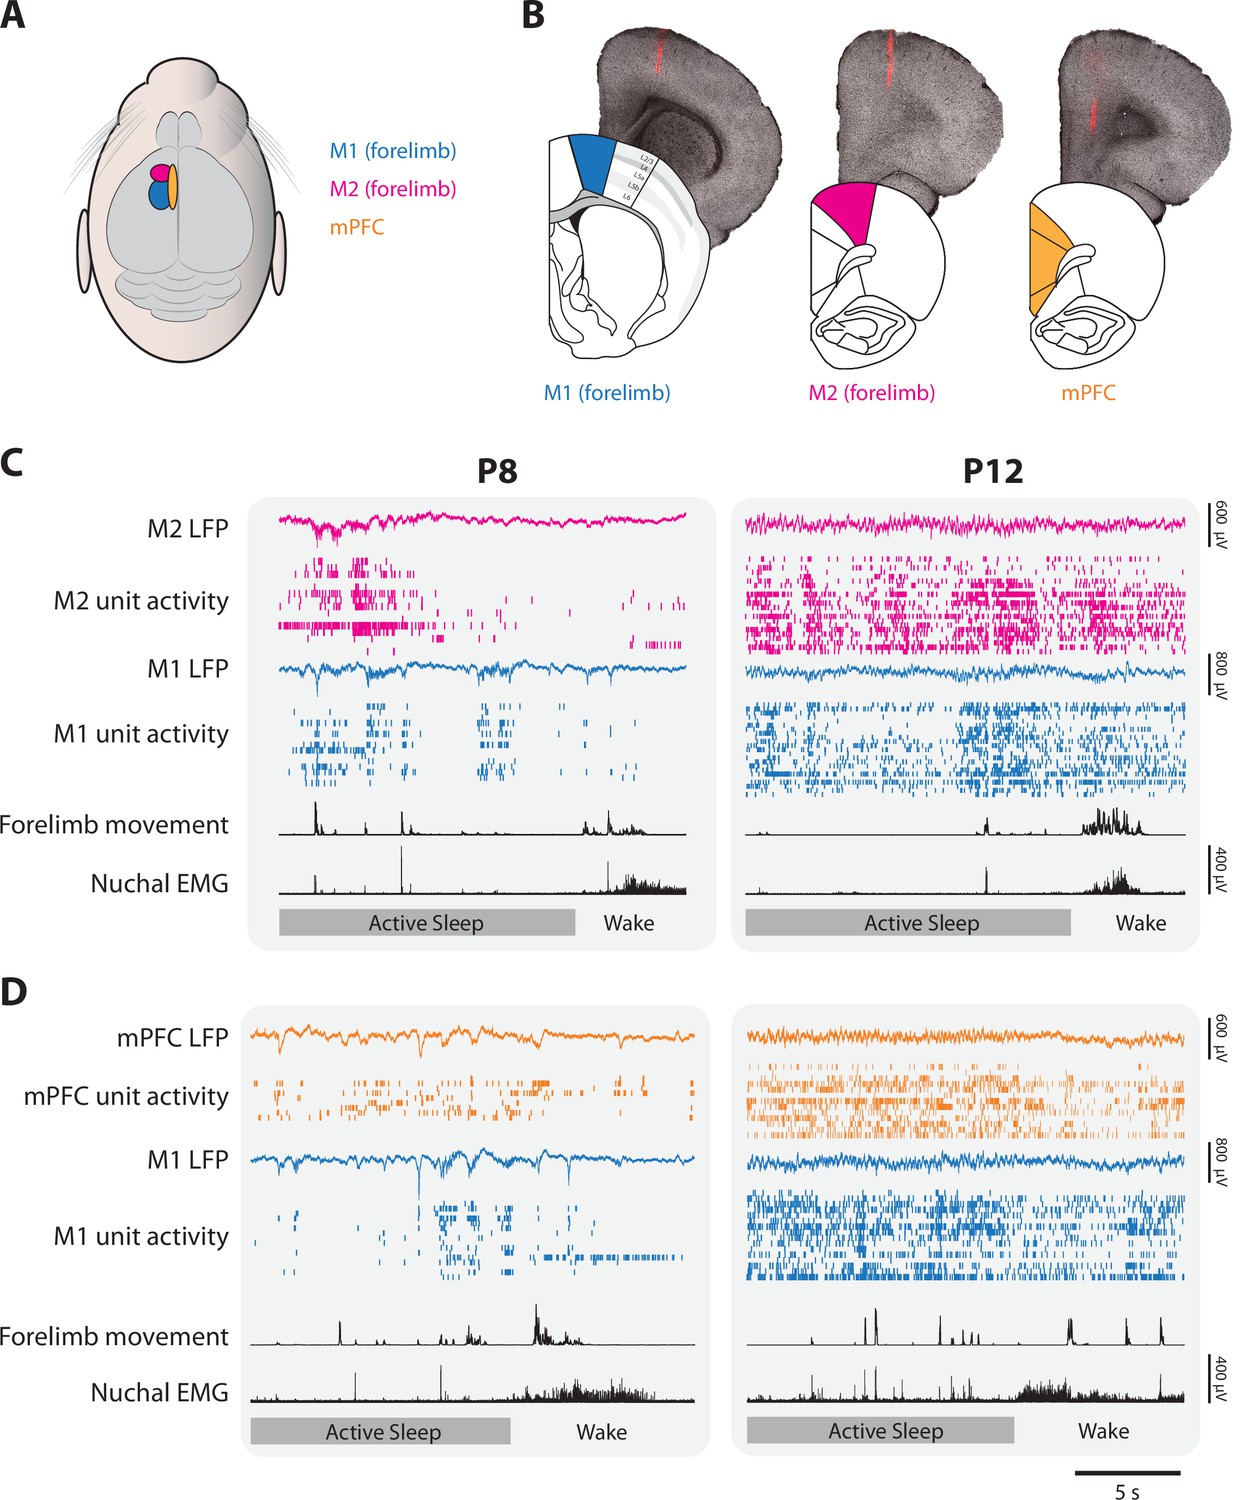
Representative neural activity in M1, M2, and mPFC in P8 and P12 rats.
(A) Illustration showing the surface locations of M1 (blue), M2 (magenta), and mPFC (gold). These color codes are used in all other figures. (B) From left to right, illustrations of coronal sections of M1, M2, and mPFC beneath corresponding brightfield coronal sections that show a fluorescent electrode track in each area. (C) Representative 20-s segments of data from paired recordings in M1 and M2 at P8 (left) and P12 (right) across behavioral states. For each record from the top, data are presented as follows: M2 local field potential (LFP) (magenta trace), M2 unit activity (magenta ticks), M1 LFP (blue trace), M1 unit activity (blue ticks), forelimb movement, and nuchal electromyography (EMG). Bottom row: Behavioral states marked as active sleep (dark gray) or wake (light gray). (D) Same as in C, but for paired recordings in M1 and mPFC (mPFC LFP, gold trace; mPFC unit activity, gold ticks).
Figure 2 with 1 supplement
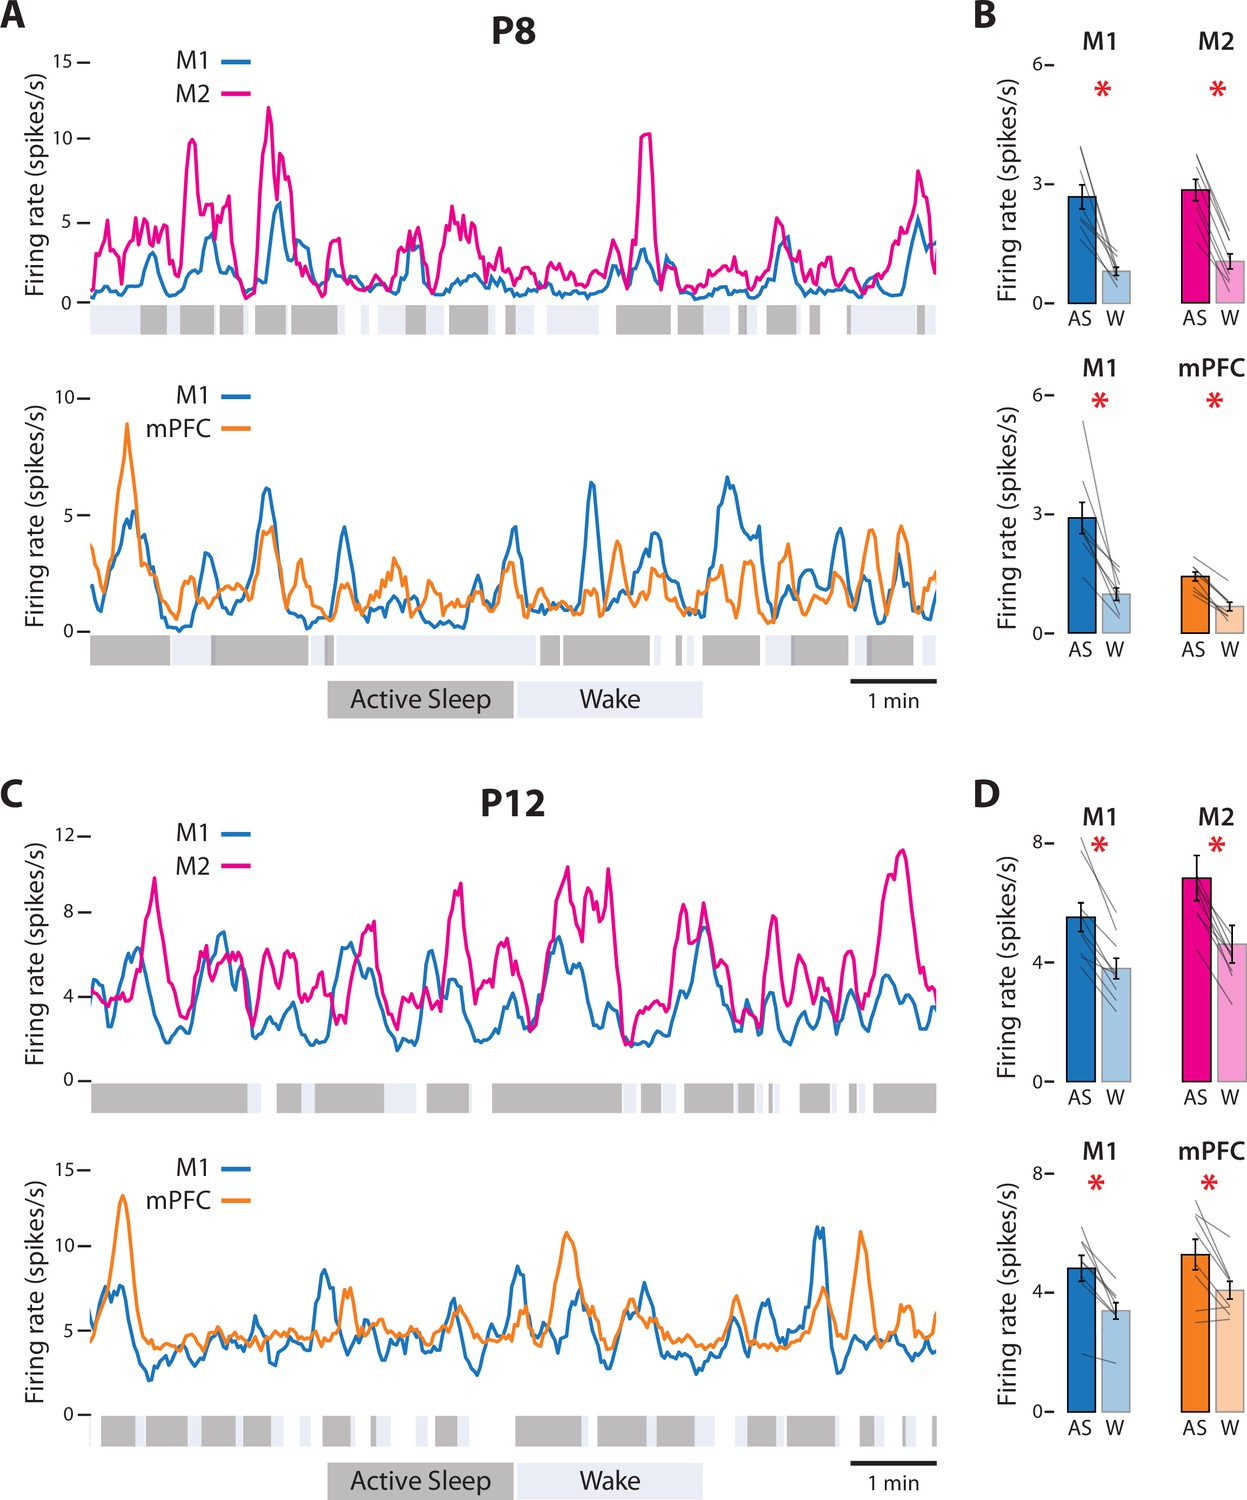
State-dependent unit activity in M1, M2, and mPFC in P8 and P12 rats.
(A) Representative 10-min segments of data from a P8 rat showing mean firing rate (2-s bins) in relation to active sleep (dark gray) and wake (light gray). Top: Units in M1 and M2. Bottom: Units in M1 and mPFC. (B) Top: Mean firing rates for M1 and M2 units during active sleep (AS) and wake (W). Bottom: Mean firing rates for M1 and mPFC units during AS and wake. Mean firing rates for individual pups are shown as gray lines. Means ± standard error of the mean (SEM). Asterisks denote significant difference between states, p ≤ 0.025. (C) Same as in A, but for a P12 rat. (D) Same as in B, but for P12 rats. (For M2, the values for one data pair exceed 8 spikes/s and are not shown.)
Figure 2—figure supplement 1

State-dependent activity of individual units in M1, M2, and mPFC.
(A) Firing rates of individual units from representative pairs of M1–M2 (left), and M1–mPFC (right) recordings during active sleep (AS) and wake (W) at P8. Light colored lines represent individual multiunit clusters, whereas dark colored lines represent individual single units. Black lines represent the mean across units. Means ± standard error of the mean (SEM). (B) Same as in A, but at P12.
Figure 3 with 1 supplement
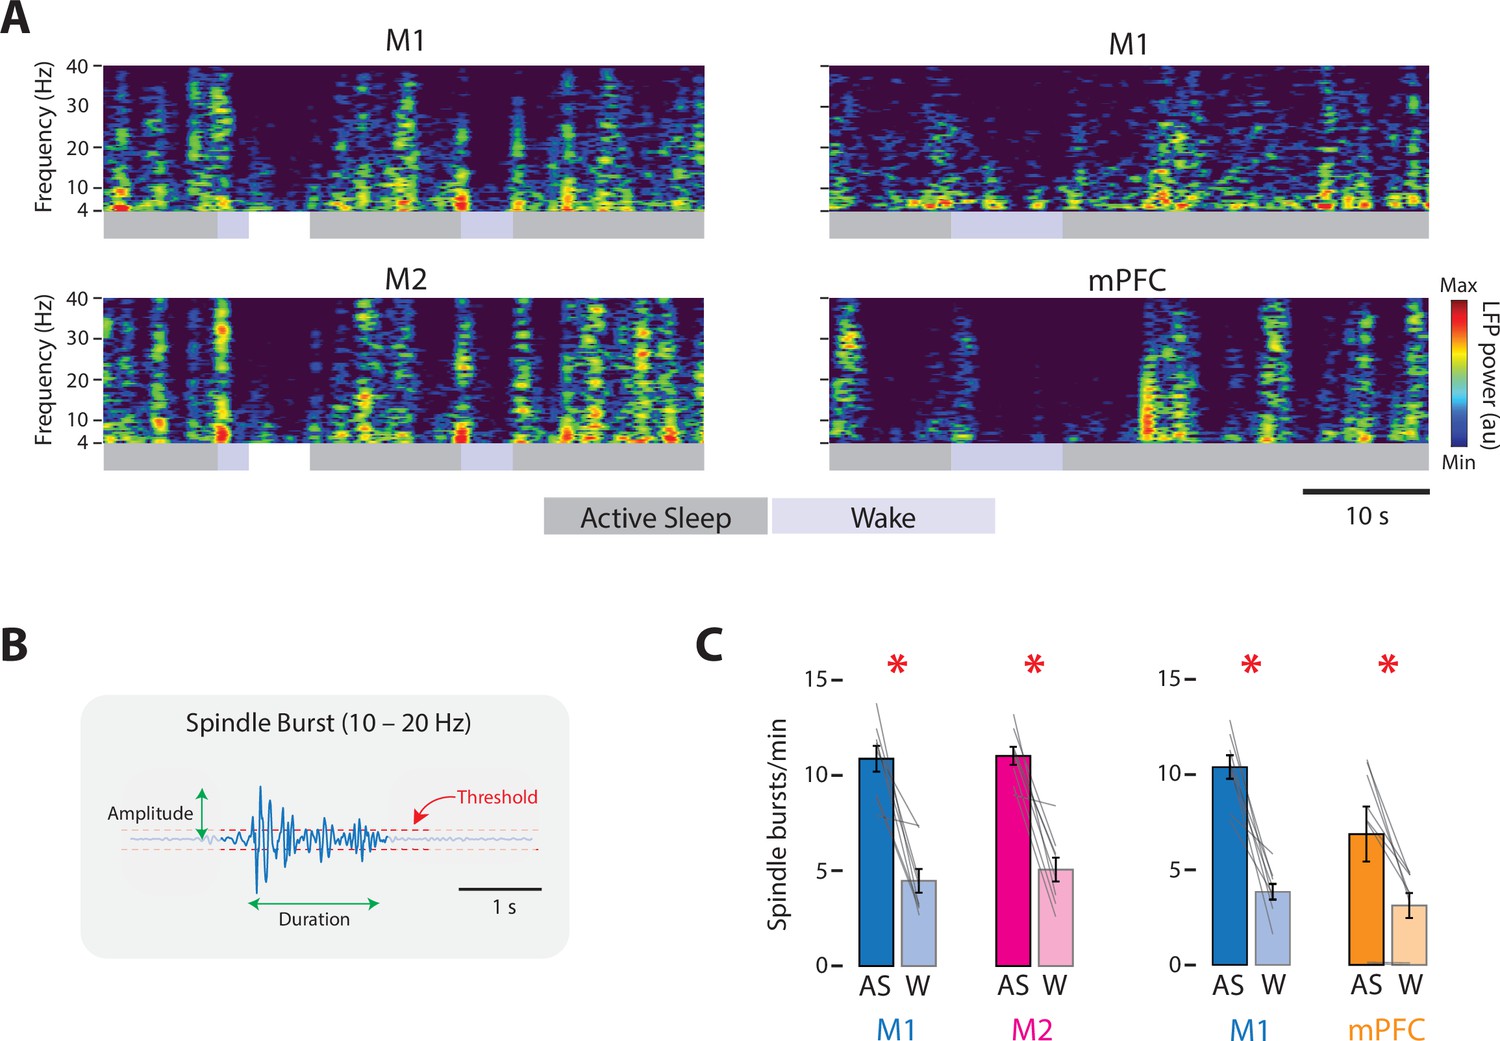
State-dependent spindle-burst activity in M1, M2, and mPFC in P8 rats.
(A) Left column: Representative 50-s segment of local field potential (LFP) data showing spindle bursts in the spectrogram for a paired M1 (top) and M2 (bottom) recording across active sleep (dark gray) and wake (light gray). Right column: Same as for left column, but for a paired M1 (top) and mPFC (bottom) recording. (B) Illustration to show method for detecting spindle bursts and calculating their amplitude and duration. Spindle bursts were defined when the median LFP amplitude exceeded, for at least 100 ms, an established threshold (horizontal dashed lines). (C) Bar graphs showing mean spindle-burst rate in M1, M2, and mPFC during active sleep (AS) and wake (W). Mean firing rates for individual pups are shown as gray lines. Means ± standard error of the mean (SEM). Asterisks denote significant difference between states, p ≤ 0.025.
Figure 3—figure supplement 1

Unit activity associated with spindle bursts in M1, M2, and mPFC.
(A) Perievent time histograms showing mean (± standard error of the mean [SEM]) firing rate in M1 and M2 (left) and M1 and mPFC (right) relative to the onset of a spindle burst. (B) Same as in A, but with normalized peak firing rates.
Figure 4
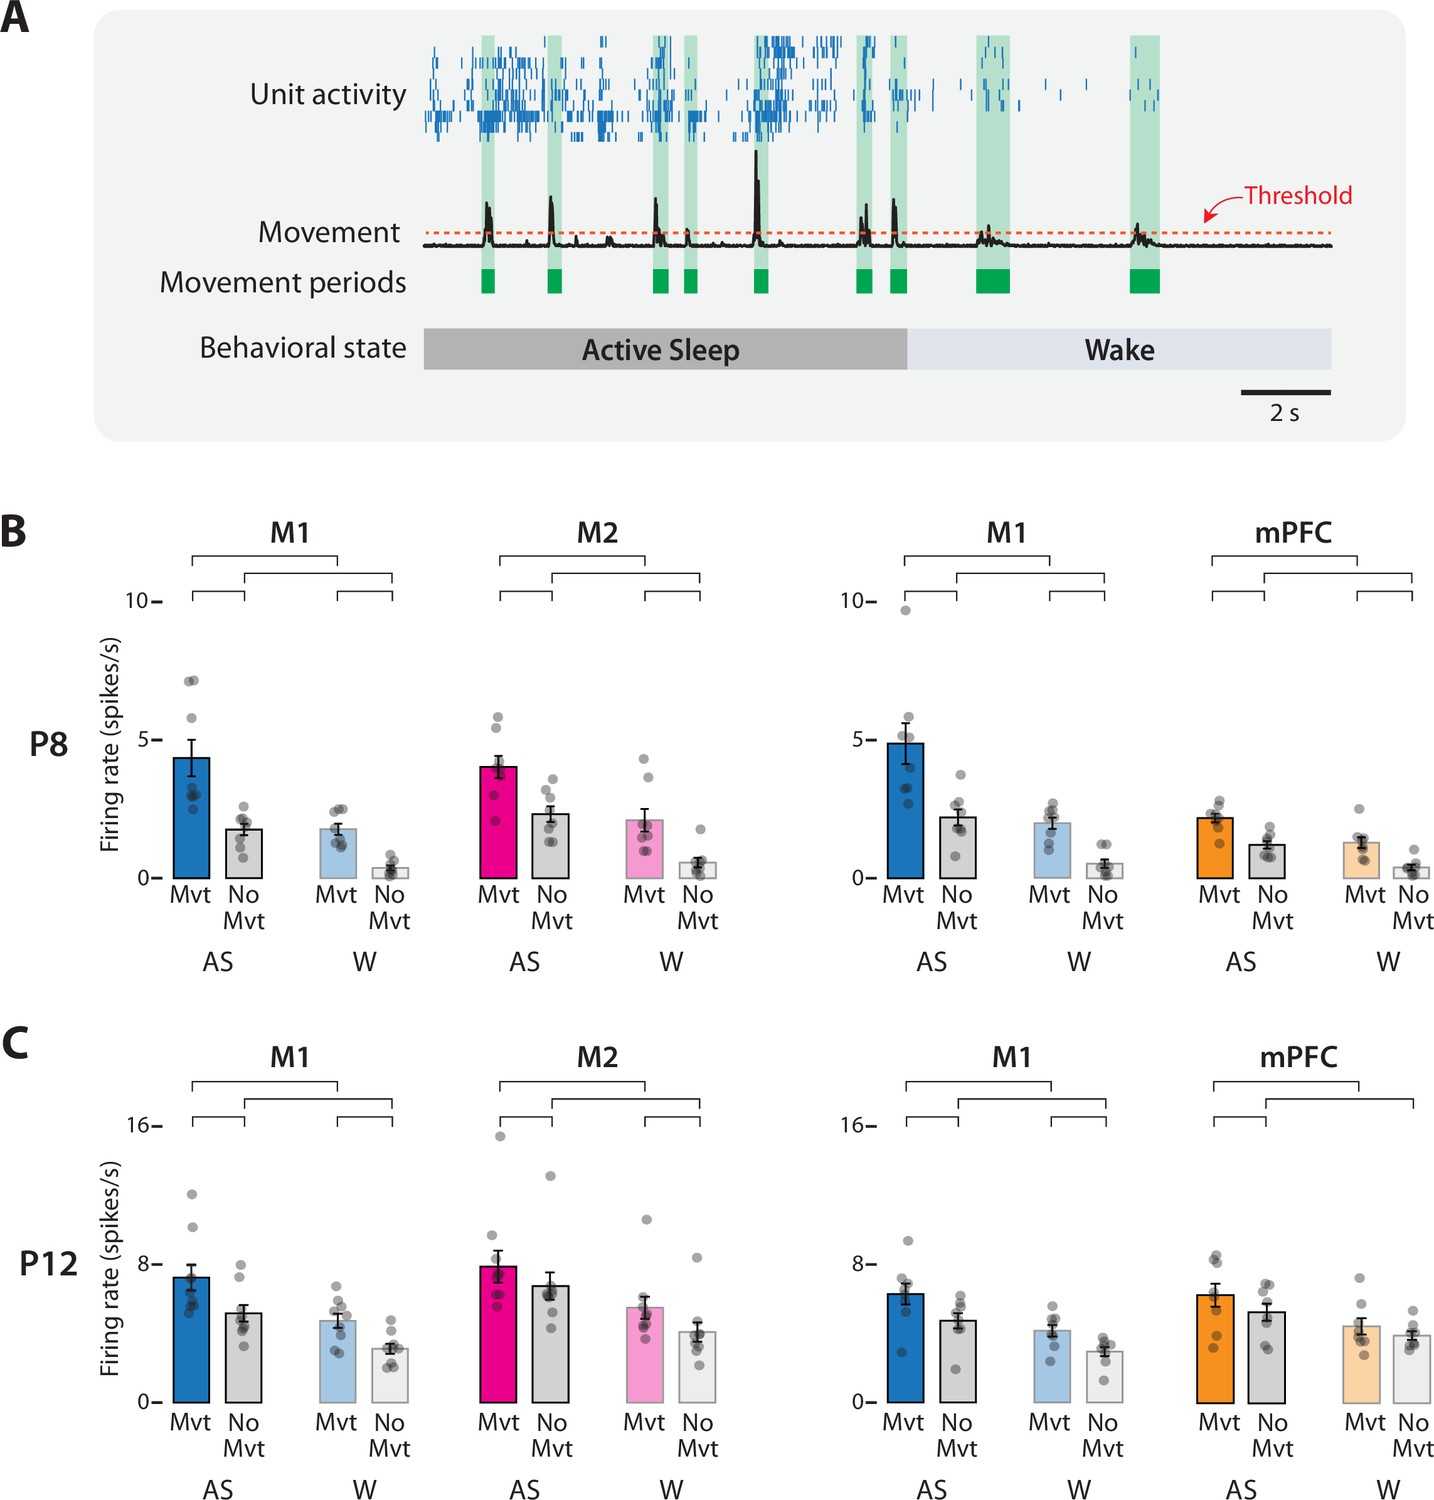
Movement-dependent unit activity in M1, M2, and mPFC in P8 and P12 rats.
(A) Representative 20-s segment of data showing unit activity (blue ticks), movement data (black trace), movement periods (green blocks), movement-detection threshold (horizontal dotted line), and behavioral state. (B) Bar graphs showing mean firing rates for neurons in M1, M2, and mPFC during periods of movement (Mvt) or no movement (No Mvt) across active sleep (AS) and wake (W). Mean firing rates for individual pups are shown as gray circles. Means ± standard error of the mean (SEM). Brackets denote significant difference between groups, p ≤ 0.0125. (C) Same as in B, but for P12.
Figure 5

M1, M2, and mPFC neural responses to sensory input in P8 and P12 rats.
(A) Methodology for determining sensory responsiveness of individual units. Left: Perievent time histogram (PETH) of unit firing rate (blue line) relative to a sensory event, showing the baseline window (BLW) and response window (RW). Event onset denoted by dotted line at Te. Middle: Bar graph showing mean unit activity during the BLW and RW, response threshold (dotted line), and the threshold calculation. Right: Stacked plot showing the percentage of units that exceeded the response threshold (blue) and percentage of units that did not (gray). (B) Stacked plots showing mean percentage of responsive (colored) and unresponsive (gray) units across pups at P8. Top: Data from M1 (blue) and M2 (magenta) recordings. Bottom: Data from M1 (blue) and mPFC (gold) recordings. Means + standard error of the mean (SEM). Asterisks denote significant difference between cortical areas, p ≤ 0.017. PETHs to the right of each stacked plot show normalized unit firing rates for responsive units only in each cortical area. (C) Same as in B, but at P12.
Figure 6 with 1 supplement
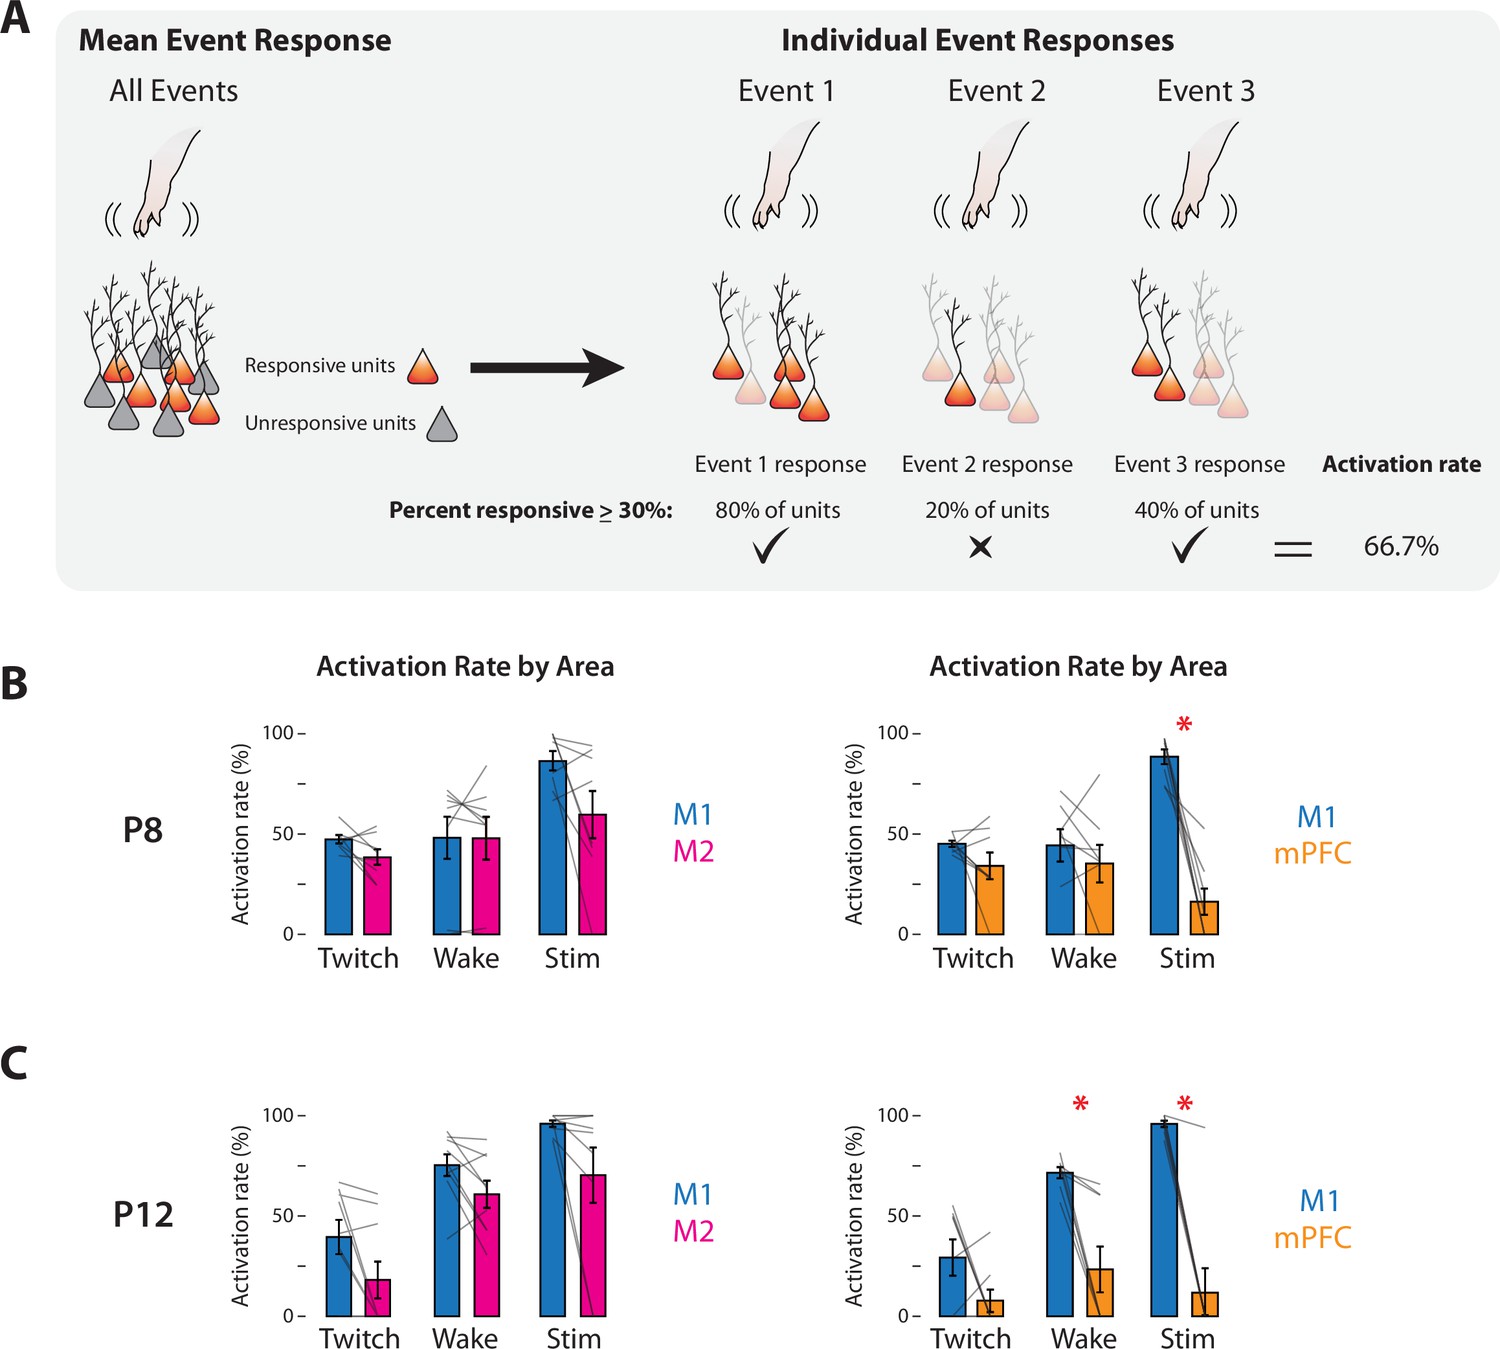
Response rates of M1, M2, and mPFC to sensory events in P8 and P12 rats.
(A) Methodology for determining the activation rate of cortical areas to sensory events. Left: Illustration of responsive (orange) and unresponsive (gray) units within an area. Right: Illustration of activity of responsive neurons (opaque) to individual sensory events. For each of the three sensory events indicated, the percentage of responsive units is determined. Based on the percentage of events that exceeds threshold (>30%; check marks), the activation rate is calculated. (B) Activation rates in M1, M2, and mPFC at P8 to twitches (Twitch), wake movements (Wake), and stimulations (Stim). Left: Bar graphs showing percentage of sensory events that evoked a response in M1 and M2. Right: Same as at left, but for M1 and mPFC. Mean activation rates for individual pups are shown as gray lines. Means ± standard error of the mean (SEM). Asterisks denote significant difference between areas, p ≤ 0.017. (C) Same as in B, but at P12.
Figure 6—figure supplement 1

Spindle bursts rates in M1, M2, and mPFC in response to sensory events in P8 rats.
(A) Method for detecting spindles bursts in the local field potential (LFP) and relating them to sensory events (tick marks). Spindle bursts were defined when the median LFP amplitude exceeded, for at least 100 ms, an established threshold (horizontal dashed lines). This analysis was performed separately for twitches (left), wake movements (middle), and stimulations (right). (B) Left: Illustration of a spindle burst preceded by a sensory event. Right: Graphs showing the probability that, given a spindle burst, there was a preceding sensory event for M1, M2, and mPFC to twitches (Twitch), wake movements (Wake), and stimulations (Stim). Mean probabilities for individual pups are shown as gray lines. Means ± standard error of the mean (SEM). Orange dotted lines denote the chance conditional probability of a sensory event given a spindle burst. Vertical brackets denote significant difference from chance; horizontal brackets denote significant difference between cortical areas, p ≤ 0.017.
Figure 7 with 1 supplement
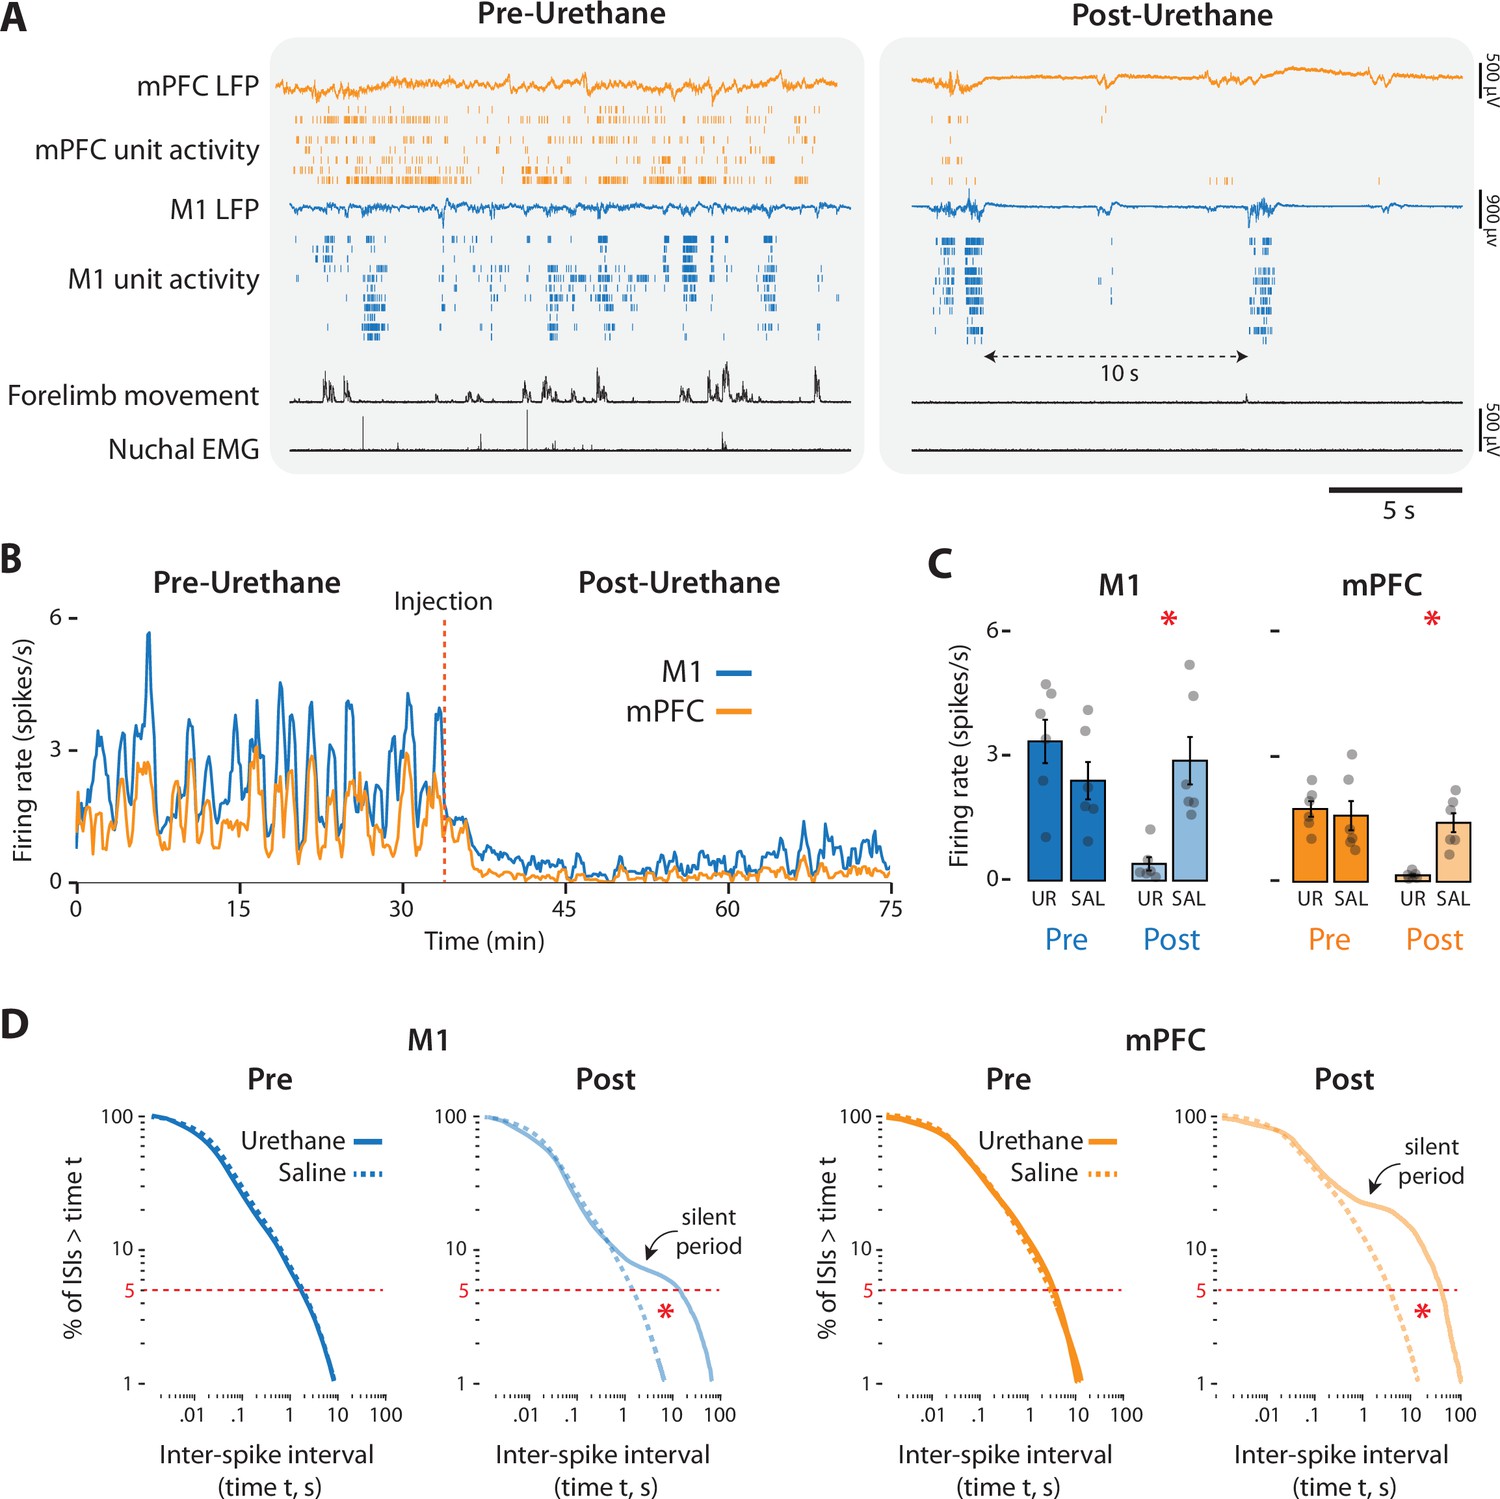
Urethane anesthesia suppresses unit activity in M1 and mPFC in P8 rats.
(A) Representative 20-s segments of data from recordings in M1 and mPFC before (left) and after (right) injection of urethane (1.0 mg/g b.w.). For each record from the top, data are presented as follows: mPFC local field potential (LFP) (gold trace), mPFC unit activity (gold ticks), M1 LFP (blue trace), M1 unit activity (blue ticks), forelimb movement, and nuchal electromyography (EMG). (B) Representative 75-min segment of data showing mean unit firing rate (in 2-s bins) in M1 (blue) and mPFC (gold) before and after injection of urethane (vertical dashed line). (C) Bar graphs showing mean firing rates of neurons across pups in M1 (left) and mPFC (right) during the pre-injection (Pre) and post-injection (Post) periods for the urethane (UR) and saline (SAL) groups. Mean firing rates for individual pups are shown as gray circles. Means ± standard error of the mean (SEM). (D) Left: Survivor plots of pooled interspike intervals (ISIs) for M1 units during the pre- and post-injection periods for pups in the urethane (solid blue line) and saline (dashed blue line). Right: Same as at left but for mPFC during the pre-injection (dark gold) and post-injection (light gold) periods. Asterisks denote significant difference (p ≤ 0.025) between urethane and saline groups for ISI values at the bottom fifth percentile (dashed horizontal lines).
Figure 7—figure supplement 1

Urethane anesthesia reduces the rate of spindle bursts in M1 and mPFC in P8 rats.
(A) Representative spectrograms showing 20 s of data pre- and post-urethane administration in M1 (top) and mPFC (bottom). Forelimb movements are shown at the bottom. (B) Bar graphs showing mean rate of spindle bursts across pups in M1 (left) and mPFC (right) during the pre-injection (Pre) and post-injection (Post) periods in the urethane (UR) and saline (SAL) groups. Mean rates of spindle bursts for individual pups are shown as gray circles. Means ± standard error of the mean (SEM). Asterisks denote significant difference between groups, p ≤ 0.025.
Figure 8
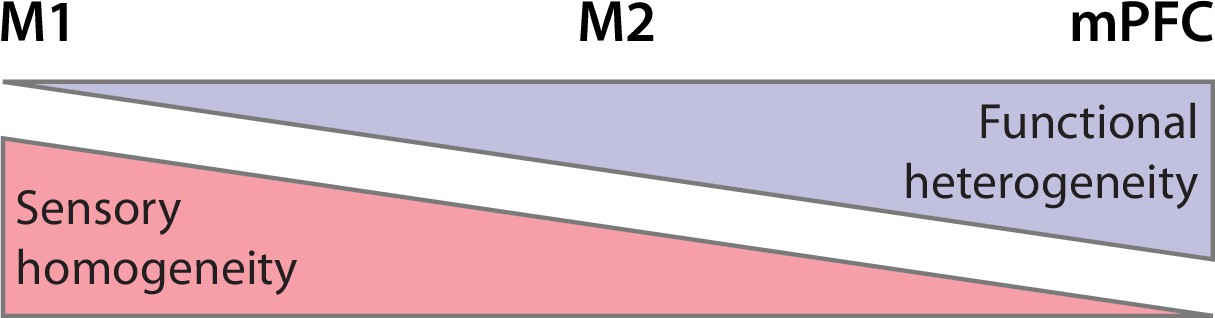
Summary illustration of sensory and functional gradients across M1, M2, and mPFC.
Somatotopic organization (red) is more homogeneous in M1 than in M2 and mPFC. In contrast, functional organization (lavender) is more heterogeneous in mPFC than in M2 and M1.
Tables
Key resources table
| Reagent type (species) or resource | Designation | Source or reference | Identifiers | Additional information |
|---|---|---|---|---|
| Strain, strain background (Rattus norvegicus) | Sprague-Dawley Norway Rats | Envigo | ||
| Commercial assay or kit | Vybrant Dil Cell-Labeling Solution | Life Technologies | Cat #: V22885 | |
| Chemical compound, drug | 3,3′-Diaminobenzidine Tetrahydrochloride (DAB) | Spectrum | TCI-D0078-5G | |
| Chemical compound, drug | Isoflurane | Phoenix Pharmaceuticals | Item #: 0010250 | 3–5% |
| Chemical compound, drug | Ketamine hydrochloride | Akorn Animal Health | NDC: 59399-114-10 | 10:1 with xylazine (cocktail: >0.08 mg/kg, IP) |
| Chemical compound, drug | Xylazine | Lloyd Laboratories | sc-362949Rx | 1:10 with ketamine (cocktail: >0.08 mg/kg, IP) |
| Chemical compound, drug | Catalase from bovine liver | Sigma-Aldrich | C9322 | |
| Chemical compound, drug | Cytochrome c from equine heart | Sigma-Aldrich | C2506 | |
| Chemical compound, drug | Carprofen | Putney | #200-522 | 0.1 mg/kg |
| Chemical compound, drug | Bupivacaine | Pfizer | NDC 0409-1162-19 | 0.25% |
| Chemical compound, drug | Urethane | Sigma-Aldrich | CAS #: 51-79-6 | 1.0 mg/g b.w. |
| Software, algorithm | MATLAB, version 2020a | Mathworks | RRID: SCR_001622 | |
| Software, algorithm | Spike2, version 8 | Cambridge Electronic Design | RRID: SCR_000903 | |
| Software, algorithm | Adobe Illustrator | Adobe | RRID:SCR_010279 | |
| Software, algorithm | Adobe Photoshop | Adobe | RRID:SCR_014199 | |
| Software, algorithm | Spinview | FLIR | https://www.flir.com/products/spinnaker-sdk/ | |
| Software, algorithm | Kilosort | Marius Pachitariu | https://github.com/MouseLand/Kilosort; Pachitariu, 2023 | |
| Software, algorithm | Phy2 | The Cortical Processing Laboratory at UCL | https://github.com/cortex-lab/phy; Rossant and Harris, 2022 | |
| Software, algorithm | SPSS | IBM | RRID:SCR_019096 | |
| Software, algorithm | Synapse | Tucker Davis Technologies | https://www.tdt.com/component/synapse-software/ | |
| Other | Vetbond | 3M | https://www.3m.com/ | Tissue adhesive |
Additional files
Download links
A two-part list of links to download the article, or parts of the article, in various formats.
Downloads (link to download the article as PDF)
Open citations (links to open the citations from this article in various online reference manager services)
Cite this article (links to download the citations from this article in formats compatible with various reference manager tools)
Activity in developing prefrontal cortex is shaped by sleep and sensory experience
eLife 12:e82103.
https://doi.org/10.7554/eLife.82103


