Generating colorblind-friendly scatter plots for single-cell data
- Department of Electrical and Computer Engineering, A. James Clark School of Engineering, The University of Maryland, United States
- Department of Oncology, Sidney Kimmel Comprehensive Cancer Center, Johns Hopkins University School of Medicine, United States
- Convergence Institute, Johns Hopkins University, United States
- Bloomberg-Kimmel Immunotherapy Institute, Johns Hopkins University School of Medicine, United States
- Department of Applied Mathematics and Statistics, Johns Hopkins University, United States
- Department of Biomedical Engineering, Johns Hopkins University School of Medicine, United States
Figures
Figure 1
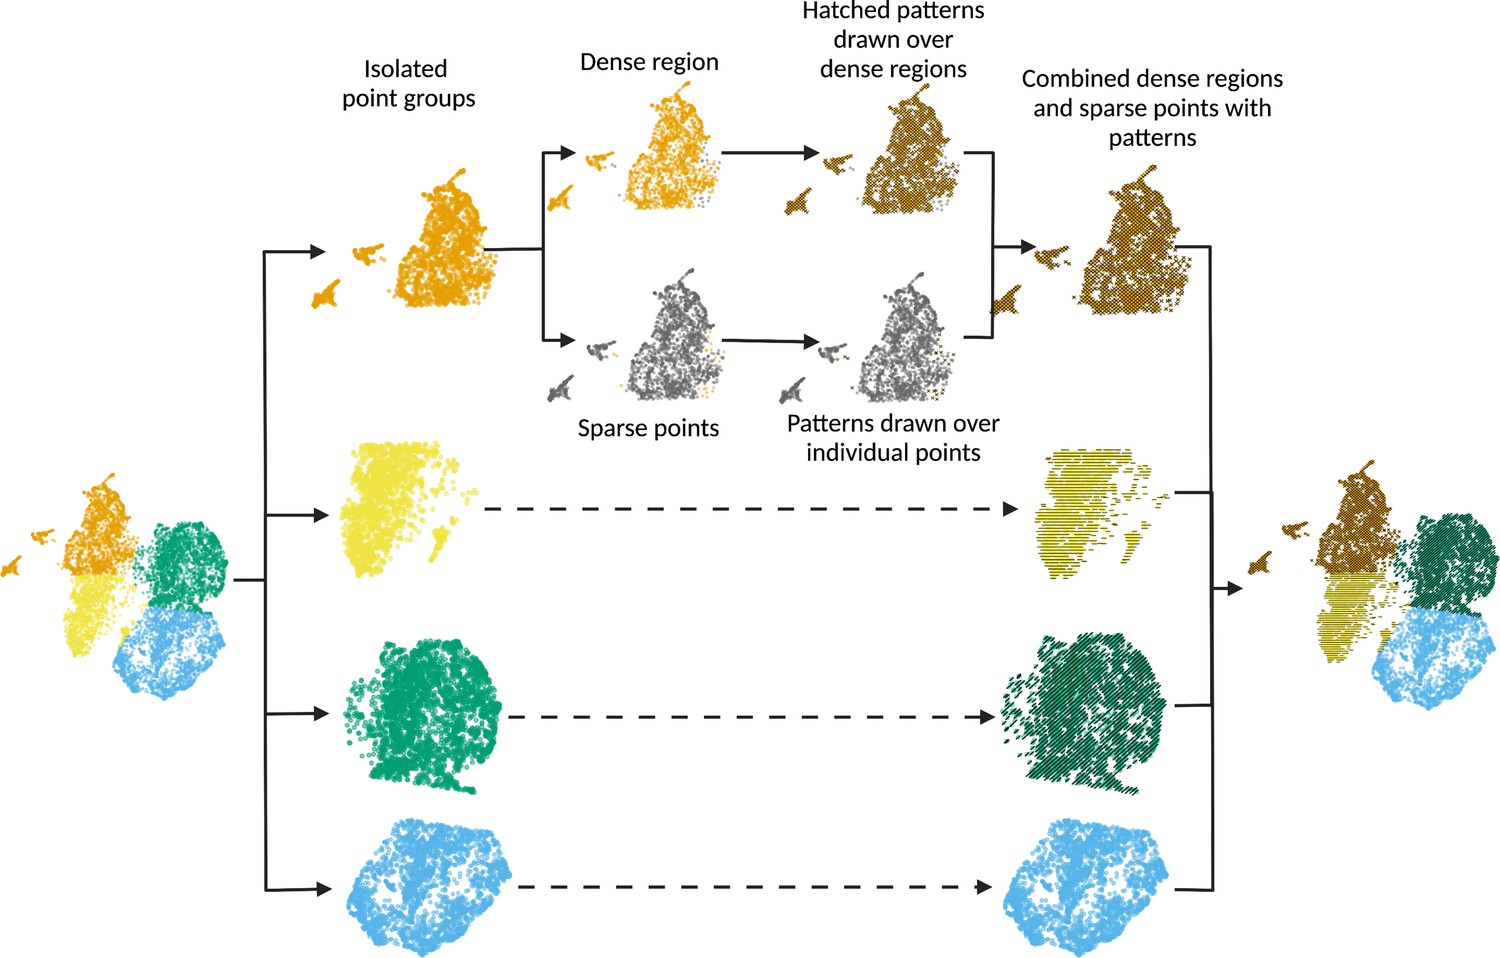
scatterHatch generates accessible scatter plots by redundant coding of point groups using colors and patterns.
For every point group, scatterHatch separates sparsely distributed points from the dense clusters. scatterHatch plots coarse patterns over the dense clusters and individually plots patterns over the sparse points. Created using Biorender.com.
Figure 2
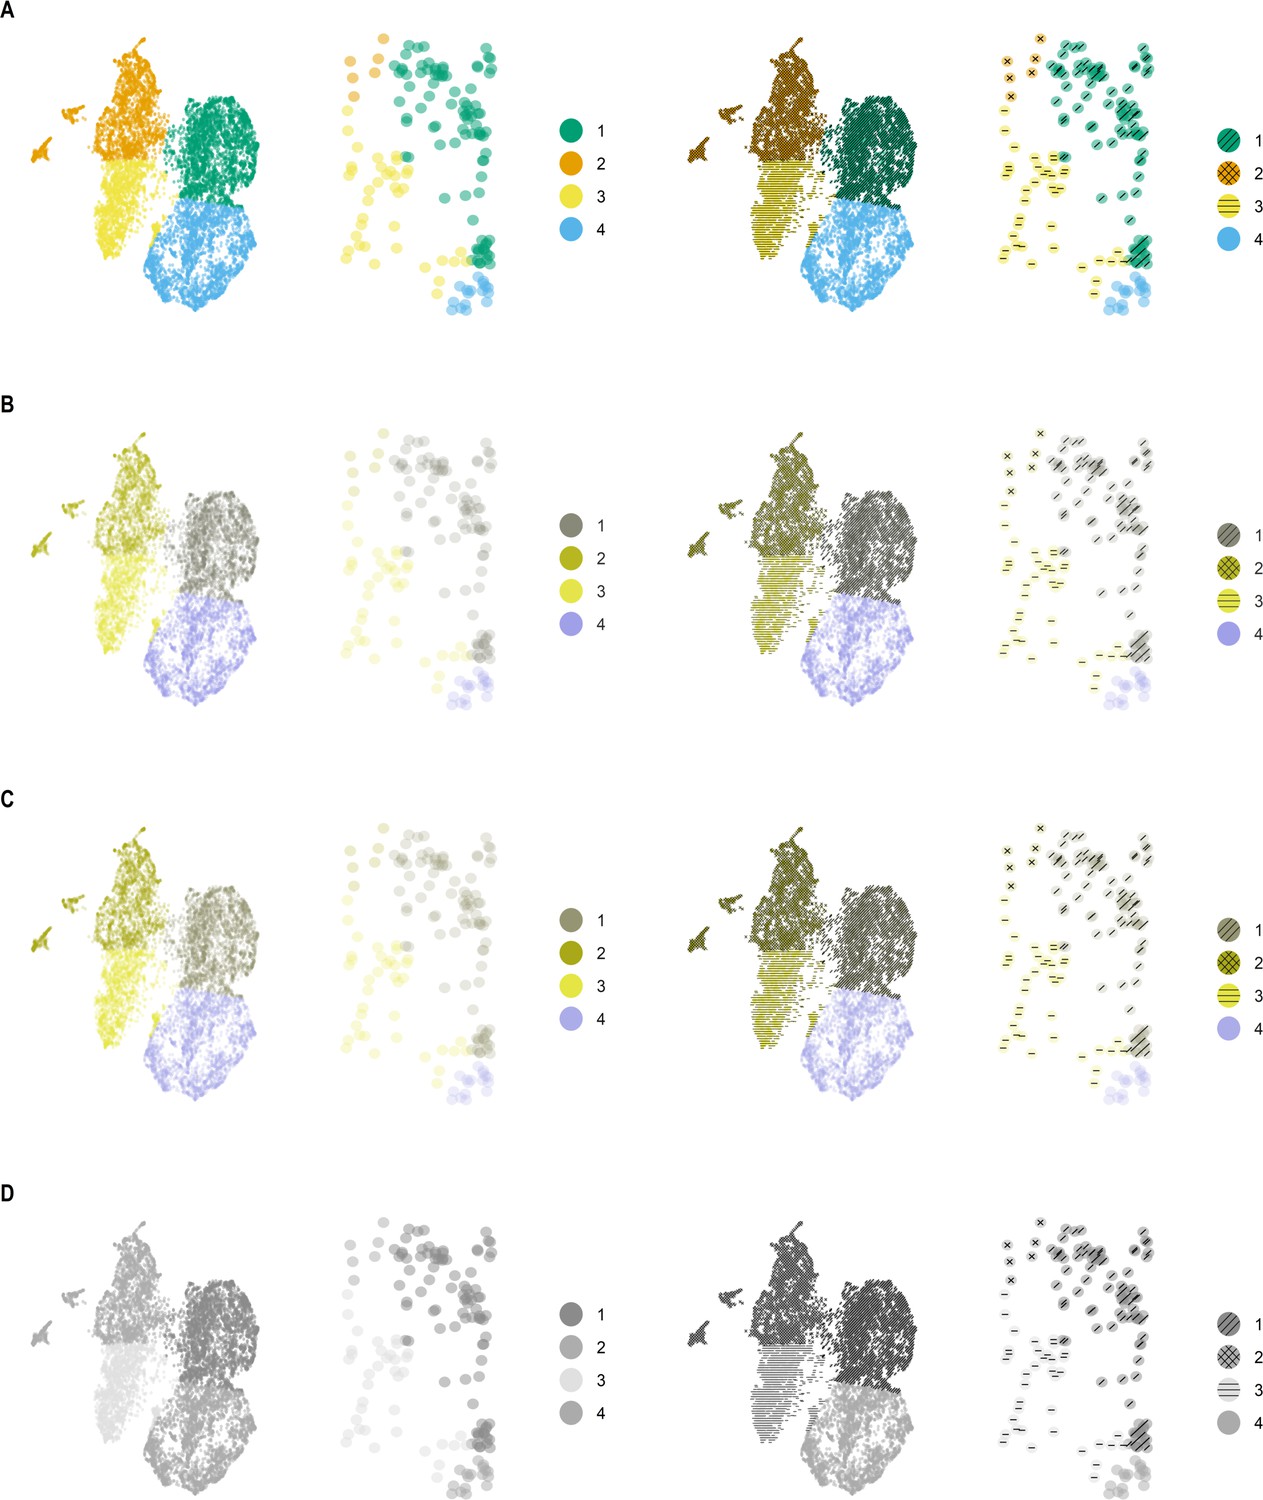
scatterHatch plots are more accessible compared to scatter plots to individuals with CVD.
Simulated perception of a UMAP scatter plot compared with a scatterHatch plot by individuals with (A) normal color vision, (B) deuteranomaly, (C) protanomaly, and (D) monochromacy, with the insets showing a magnified sparse region showing patterns assigned to individual cells. Despite the change in color perception, readers have access to secondary visual information in the form of patterns to help interpret the data. CVD, color-vision deficiency.
Figure 3
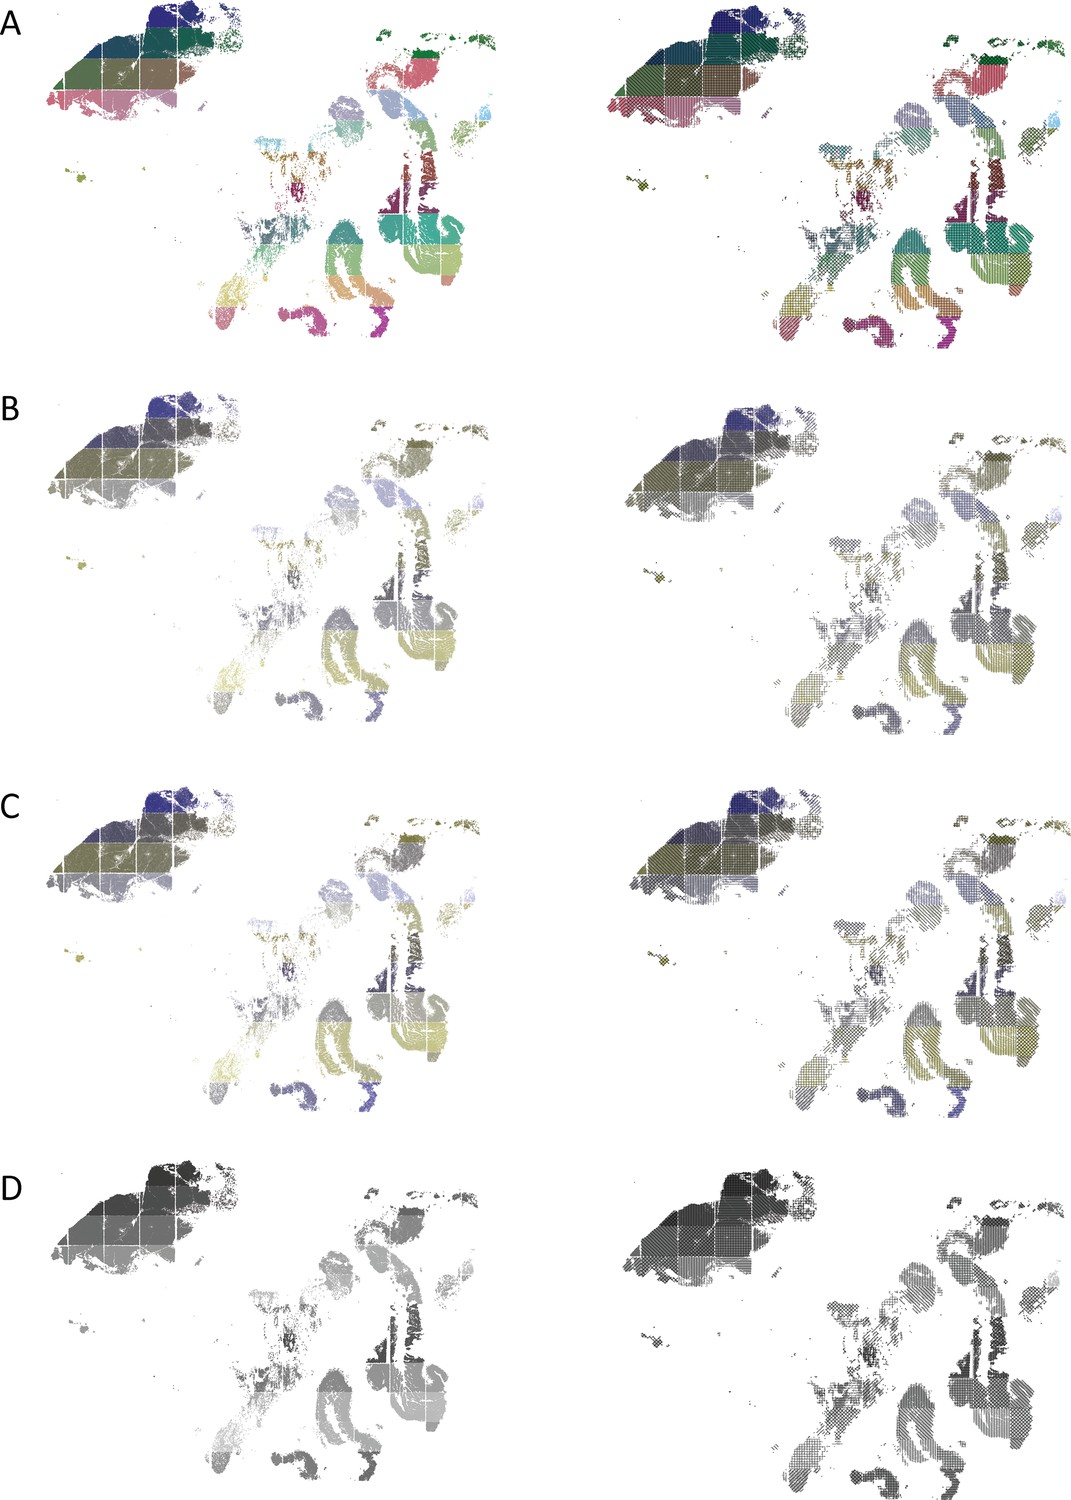
scatterHatch plots are more accessible than scatter plots for all readers when number of cell groups is high.
Perception of a spatial plot of the PDAC data set with 82-cell groups compared with a corresponding scatterHatch plot as simulated for (A) normal color vision, (B) deuteranomaly, (C) protanomaly, and (D) monochromacy. As the number of colors in the scatter plot increases, its interpretability reduces even for normal color vision. The redundant coding used in scatterHatch plots results in increased accessibility. PDAC, Pancreatic Ductal Carcinoma.
Figure 4
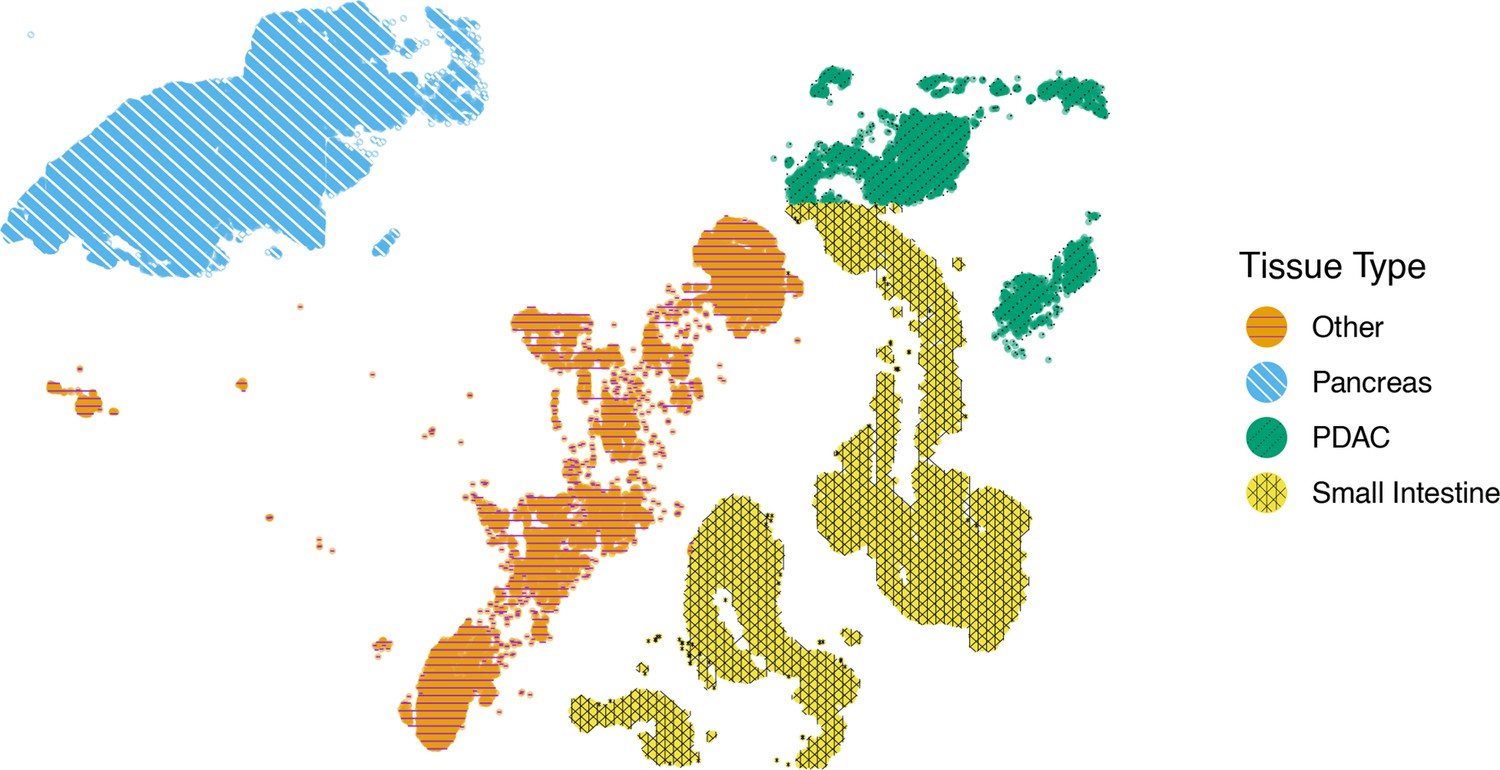
scatterHatch enables users to customize patterns.
Spatial scatterHatch plot of the PDAC data set showing four tissue regions using customized patterns with a custom line type (PDAC), custom line colors (Other and Pancreas), and a completely new pattern (Small Intestine).
Tables
Table 1
Parameters to enable users to customize pattern aesthetics or to create new patterns.
| Name | Description | Options |
|---|---|---|
| pattern | Specifies the pattern type | Default options are ‘horizontal’, ‘vertical’, ‘positiveDiagonal’, ‘negativeDiagonal’, ‘cross’, ‘checkers’, ‘blank’ E.g.: pattern=‘checkers” |
| angle | Allows users to specify line angles to be included in the pattern (enables users to create new patterns) | Numeric array with values from 0 to 180. E.g.: angle=c(45, 90, 135) |
| lineWidth | Width of the lines in a pattern | Numeric - default value based on point size E.g.: lineWidth=0.1 |
| lineColor | Color of the lines in a pattern | Character string specifying a color E.g.: lineColor=‘white’ |
| lineType | Type of the lines in a pattern | Character string to specify the line type from the ggplot2 package. E.g.: lineType=‘dotted’ |
| LineAlpha | Transparency of the lines in a pattern | Numeric value from 0 to 1. Default is 1. Ex: lineAlpha=0.1 |
Additional files
-
MDAR checklist
- https://cdn.elifesciences.org/articles/82128/elife-82128-mdarchecklist1-v2.pdf
-
Supplementary file 1
'scatterHatch user guide'.
- https://cdn.elifesciences.org/articles/82128/elife-82128-supp1-v2.pdf
Download links
A two-part list of links to download the article, or parts of the article, in various formats.
Downloads (link to download the article as PDF)
Open citations (links to open the citations from this article in various online reference manager services)
Cite this article (links to download the citations from this article in formats compatible with various reference manager tools)
Generating colorblind-friendly scatter plots for single-cell data
eLife 11:e82128.
https://doi.org/10.7554/eLife.82128


