Emergent dynamics of adult stem cell lineages from single nucleus and single cell RNA-Seq of Drosophila testes
- Whitehead Institute for Biomedical Research and Department of Biology, Massachusetts Institute of Technology, Howard Hughes Medical Institute, United States
- Department of Cell and Developmental Biology, The Perelman School of Medicine and The Penn Institute for Regenerative Medicine, United States
- Department of Developmental Biology, Stanford University School of Medicine, United States
- National Institute of Diabetes and Digestive and Kidney Diseases, National Institutes of Health, United States
- Department of Cell Biology, Johns Hopkins University School of Medicine, United States
- National Center for Biotechnology Information, National Library of Medicine, National Institutes of Health, United States
- Huffington Center on Aging and Department of Molecular and Human Genetics, Baylor College of Medicine, United States
- JVIB Center for Brain & Disease Research, and the Department of Human Genetics, KU Leuven, Belgium
- Data Mining and Modeling for Biomedicine, VIB Center for Inflammation Research, and Department of Applied Mathematics, Computer Science and Statistics, Ghent University, Belgium
- Donnelly Centre for Cellular and Biomolecular Research, University of Toronto, Canada
- Cell Biology Program, The Hospital for Sick Children, Canada
- Department of Molecular Genetics, University of Toronto, Canada
- Institute of Medical Science, University of Toronto, Canada
- School of Biosciences, Cardiff University, United Kingdom
- Department of Genetics, Stanford University, United States
Figures
Figure 1 with 1 supplement
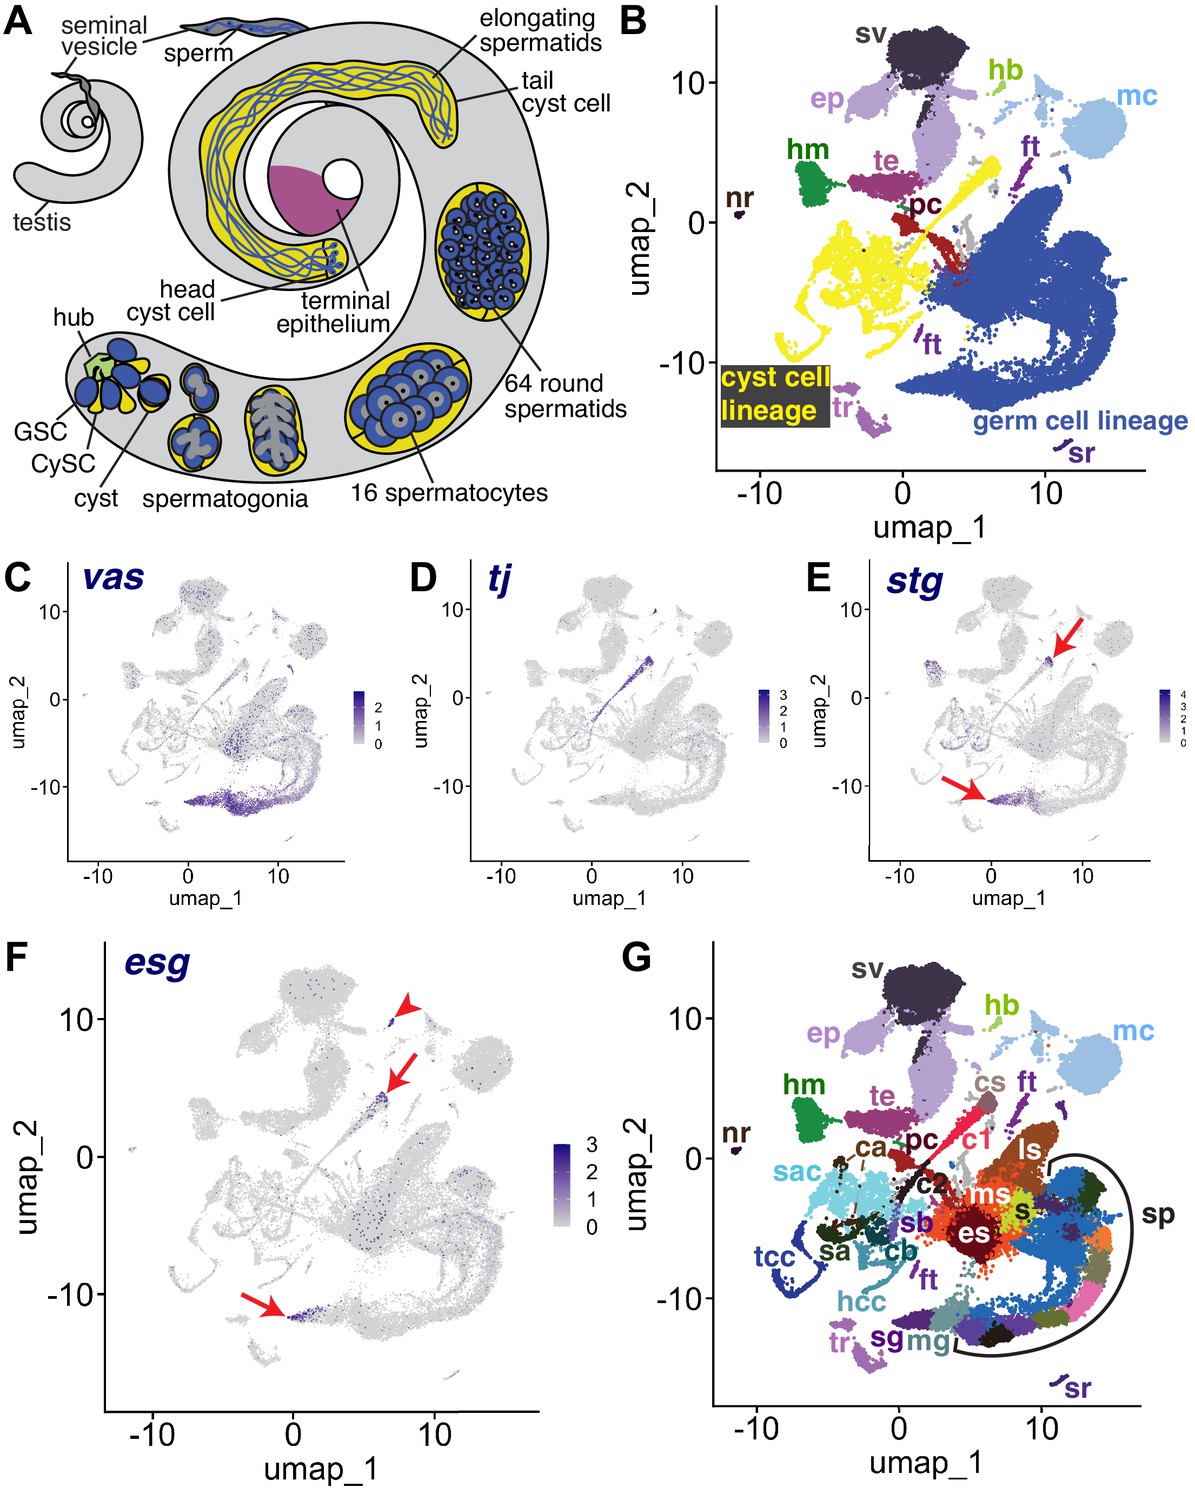
The snRNA-seq landscape of the testis.
(A) Illustration of adult Drosophila testis showing hub (green), germ cell lineage (blue), cyst cell lineage (yellow), terminal epithelium (pink), and seminal vesicle (dark gray). (B) UMAP of FCA snRNAseq data from the testis plus seminal vesicle (relaxed version). Blue: germ cell lineage; Yellow: cyst cell lineage; Pink: terminal epithelial cells of testis (te); Dark gray: seminal vesicle (sv). Other cell types as listed in (G). (C–F) UMAP plots of snRNA-seq data showing expression of: (C) vasa (vas), (D) traffic jam (tj), (E) string (stg), (F) escargot (esg). Red arrows: proliferating cells. Red arrowhead: hub. (G) UMAP (as in B) with Leiden 6.0 clusters of germ and cyst cell lineages labeled (sg: Spermatogonia; mg: Mid-late proliferating spermatogonia; sp: Spermatocytes; s: Spermatids; es: Early elongation-stage spermatids; ms: Early-mid elongation stage spermatids; ls: Mid-late elongation-stage spermatids; hb: Germinal proliferation center hub; cs: Cyst stem cells, c1: Early cyst cells 1; c2: Early cyst cells 2; sa: Cyst cell with spermatocytes branch A; sb: Cyst cell with spermatocytes branch B; ca: Cyst cell branch a; cb: Cyst cell branch b; sac: Elongating spermatid-associated cyst cells; hcc: Head cyst cells; tcc: Tail cyst cells; te: Terminal epithelial cells of testis; sv: Seminal vesicle; ep: Male gonad associated epithelium; sr: Secretory cells of the male reproductive tract; mc: Muscle cells; hm: Hemocytes; nr: Neurons; pc: Pigment cells;, tr: Trachea; ft: Fat body).
Figure 1—figure supplement 1
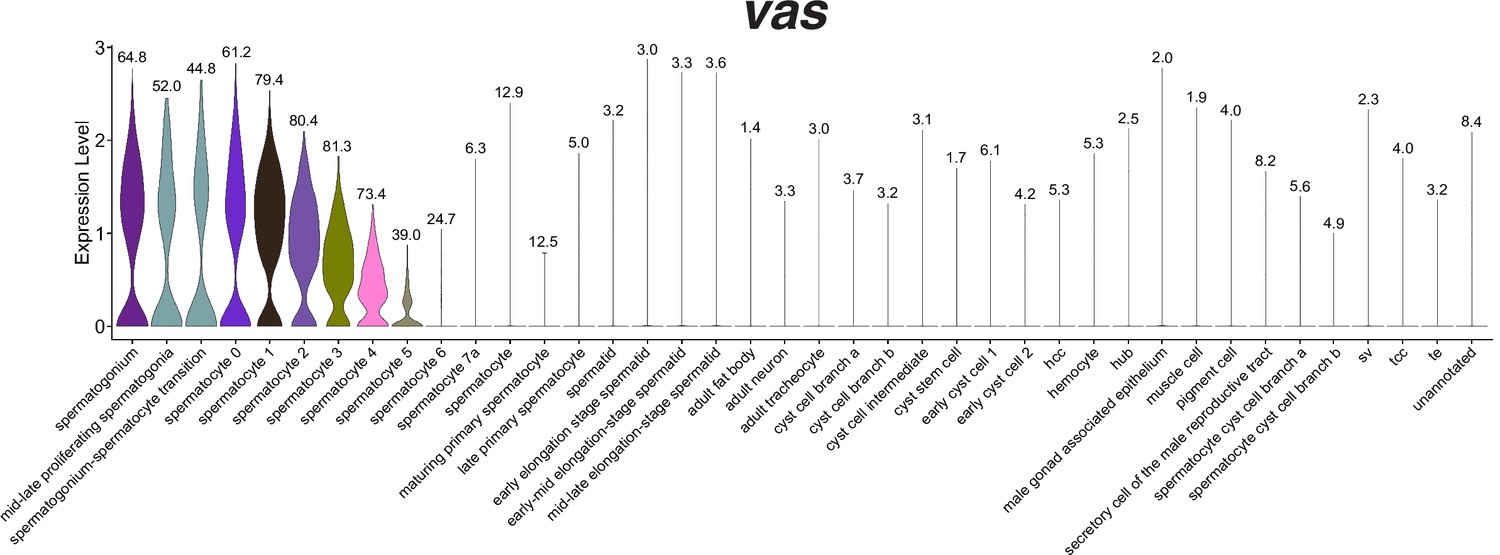
Expression of vasa in the snRNA-seq dataset.
Violin plot of vasa expression in nuclei grouped and colored by annotation, sorted so that all germ line nuclei are on the left half of the plot. Numbers at the point for each cell type reflect the proportion of nuclei that expressed vasa at a level greater than 0.
Figure 2 with 1 supplement
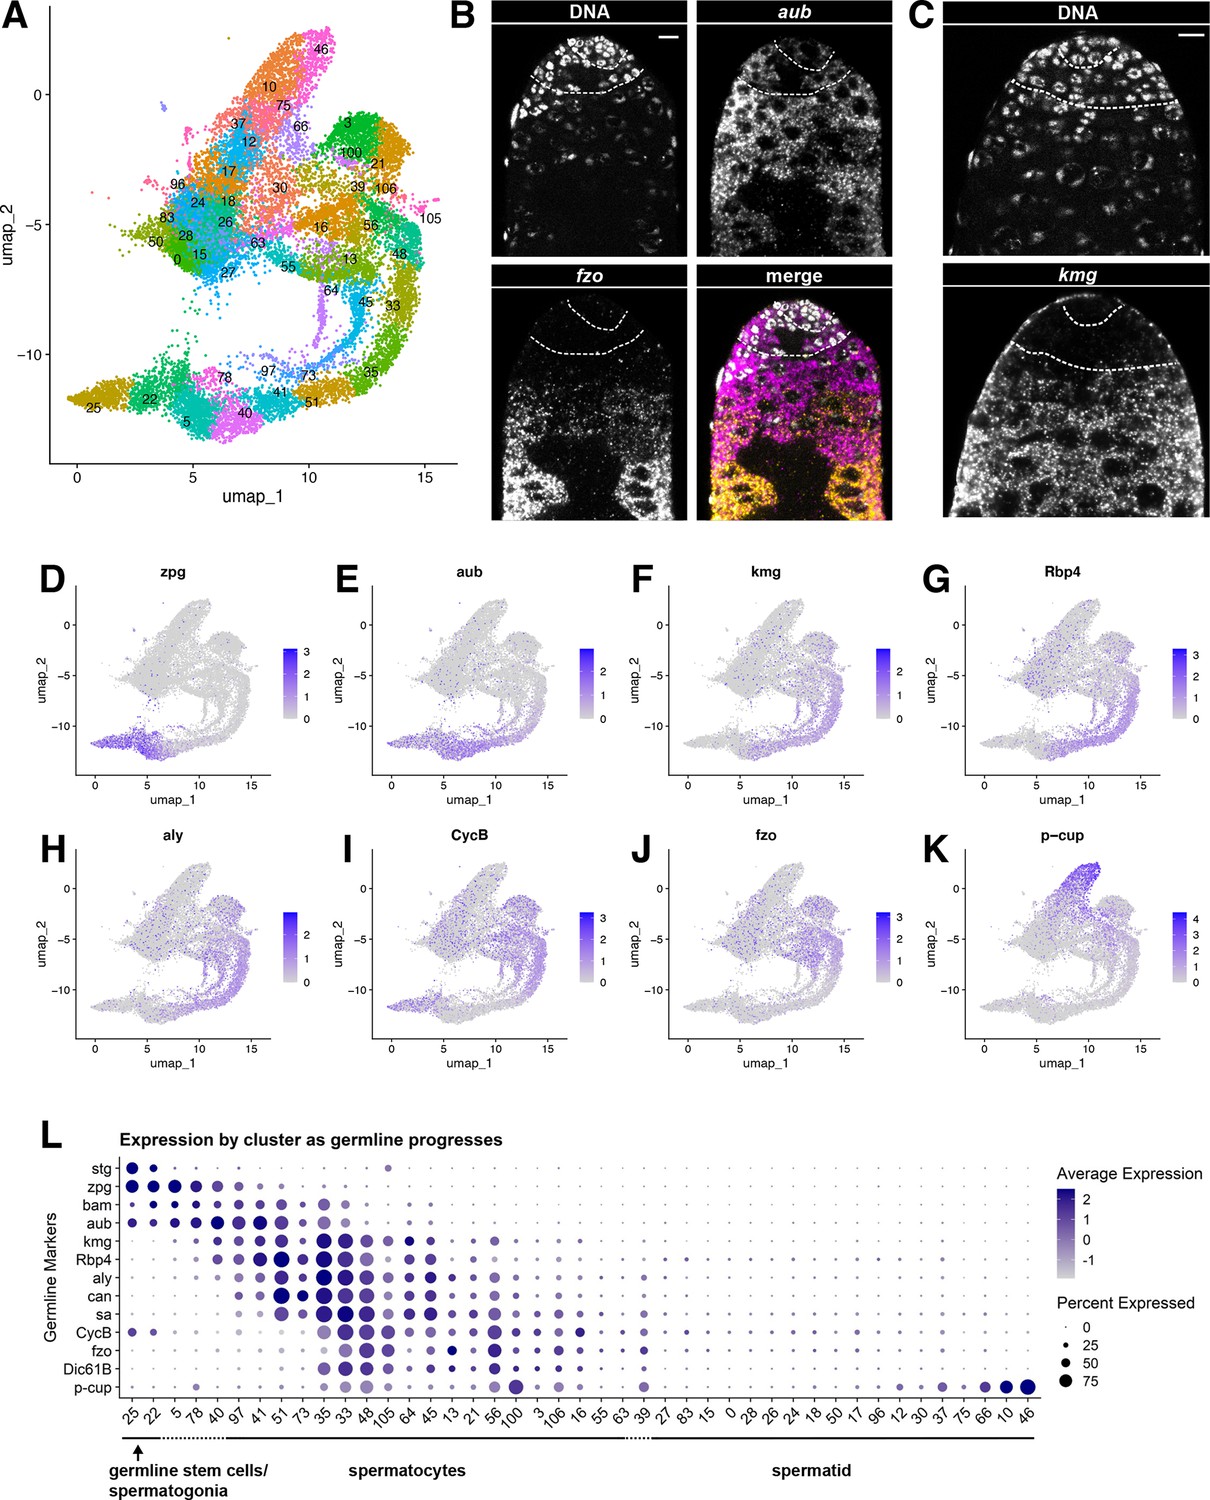
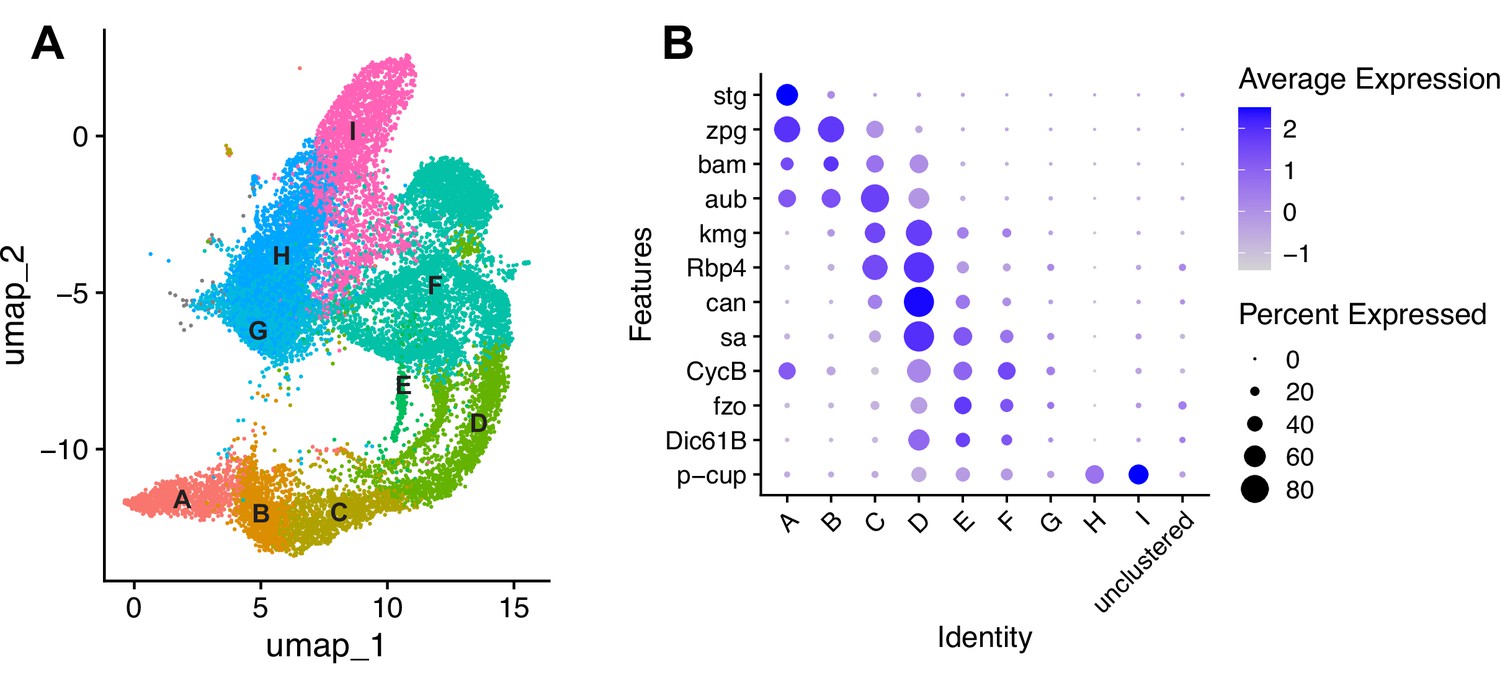
Characteristics of the germline lineage.
(A) Germline portion of the UMAP generated by Seurat from clustering of the full testis plus seminal vesicle dataset at Leiden 6.0 resolution. (B–C) Apical tips of testes showing localized expression of (B) aub (magenta) and fzo (yellow) mRNA and (C) kmg mRNA visualized by in situ hybridization. Apical-most dotted line demarcates germ line stem cells (GSCs) around the hub from spermatogonia. Lower dotted line demarcates spermatogonia and cells in premeiotic S phase from young spermatocytes. Scale bars, 10 µm. (D–K) Feature plots generated by Seurat showing expression levels of zpg, aub, kmg, rbp4, aly, CycB, fzo, and p-cup in the germline UMAP. Navy blue gradient bars: relative expression level for the indicated gene. (L) Dot plot generated by Seurat showing expression levels of selected germline markers by cluster as nuclei progress from spermatogonia to spermatid. Color intensity: level of expression of the indicated gene averaged over all the nuclei in a given cluster relative to the level for that gene in other germline clusters. Size of dots: percent of nuclei in specified cluster in which expression of the gene was detected (see also Figure 2—figure supplement 1).
Figure 2—figure supplement 1
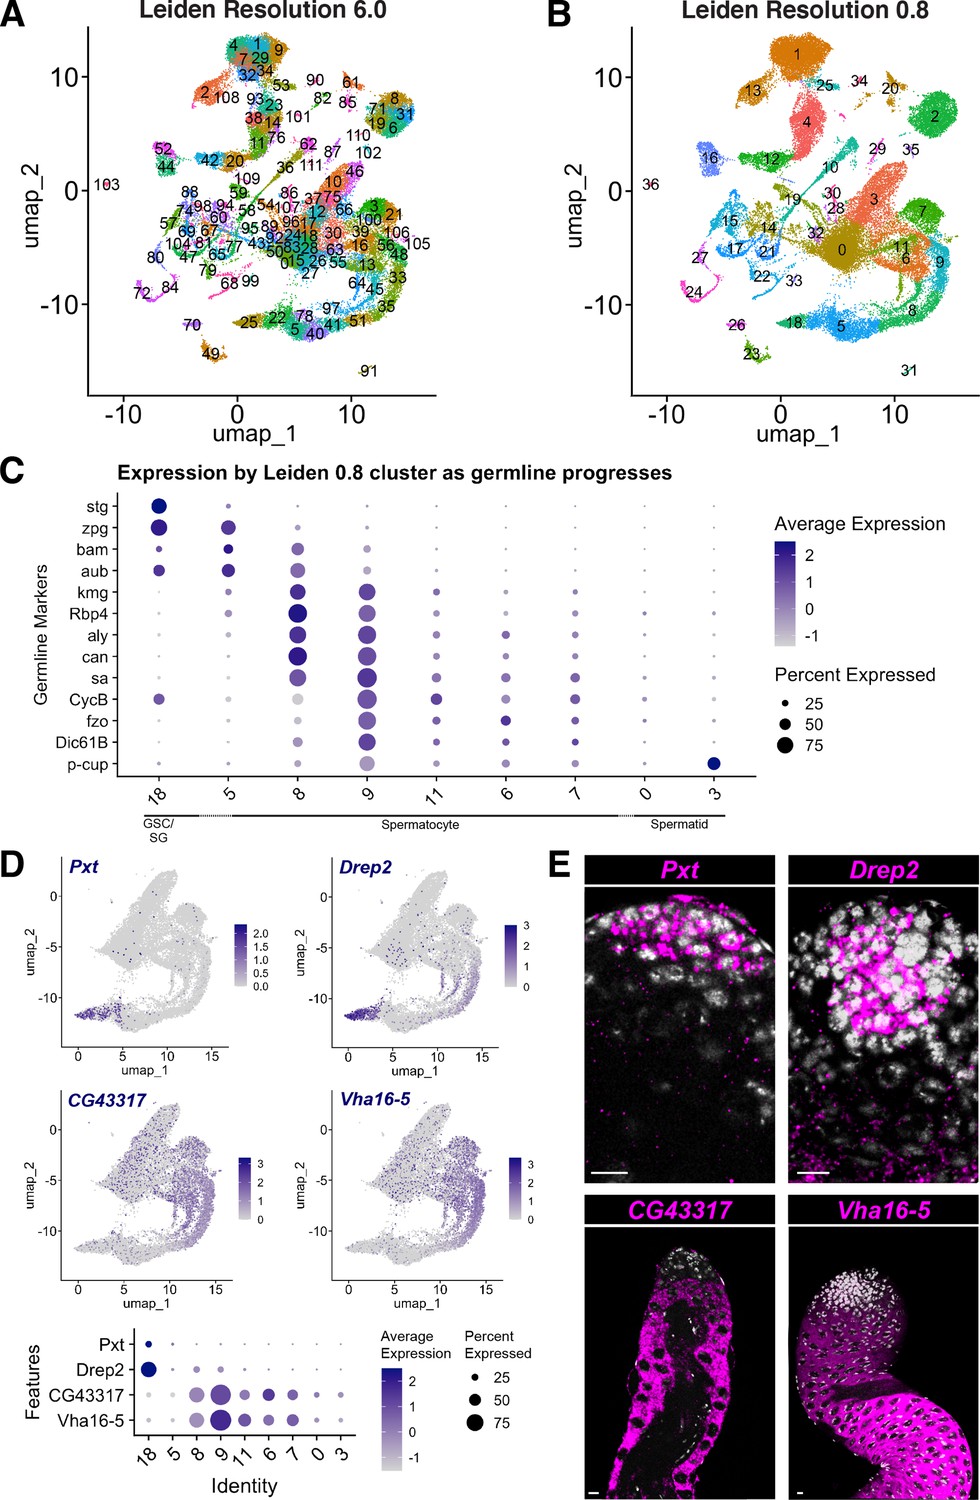
Comparison of snRNA-seq data clustered at Leiden 6.0 vs. lower resolution and new marker genes.
(A,B) UMAP clustered at (A) Leiden 6.0 and (B) Leiden 0.8. (C) Dot Plot of selected marker gene expression per Leiden 0.8 cluster (compare to Leiden 6.0 in Figure 2L). Dot color intensity: Average expression level in all nuclei of cluster. Dot size: percent of cells in the cluster expressing the marker. (D) Novel markers of early germ cells (top panels) and spermatocytes (middle panels), represented on UMAP of the germline-annotated nuclei. These four genes are marked with black squares in Figure 4G and H. Dot Plot (bottom panel) of novel marker gene expression per Leiden 0.8 cluster as in C. (E) FISH of markers in (D) confirms expression patterns. Pxt and Drep2 are expressed in early germ cells; CG43317 and Vha16-5 are expressed in spermatocytes. Scale bar, 10 µm.
Figure 3 with 2 supplements
Features of the spermatocyte transcription program.
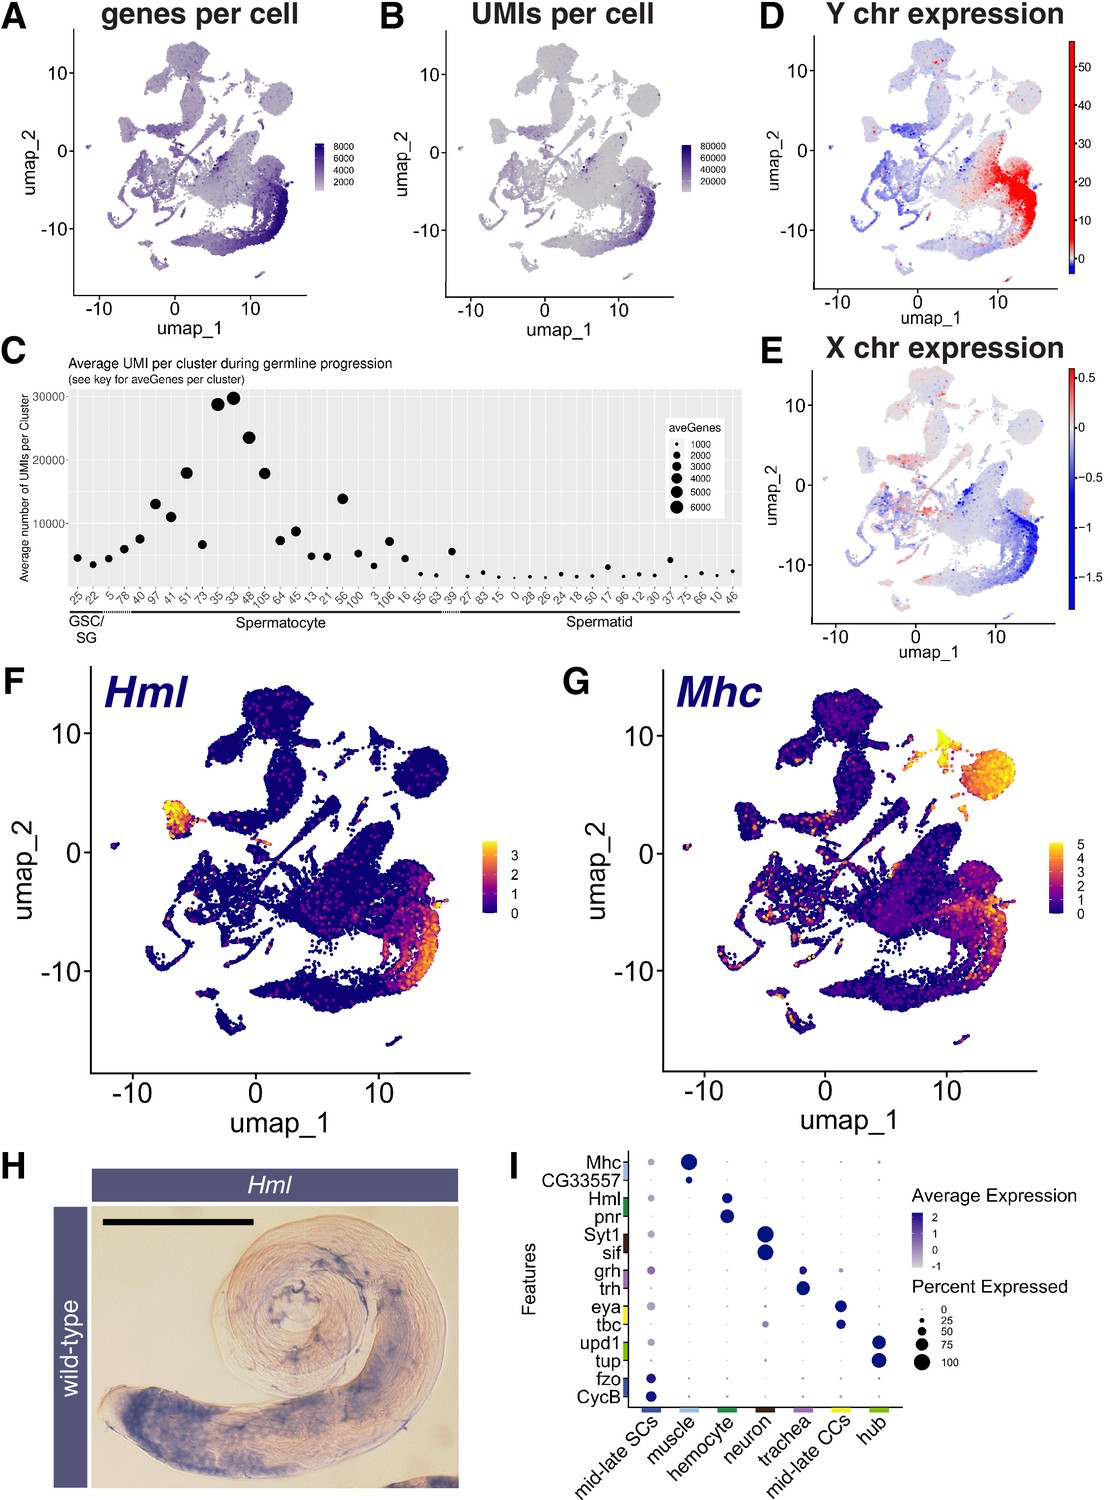
(A, B) UMAPs of snRNA-seq data showing: (A) number of genes detected as expressed and (B) Number of unique molecular identifiers (UMIs) detected per nucleus. (C) Plot of average number of genes expressed (dot size) and UMIs detected per nucleus per germline-annotated Leiden 6.0 cluster, ordered by estimated progression of germ line differentiation. (D, E) UMAPs of snRNA-seq data showing average expression of: (D) Y chromosome tor (E) X chromosome encoded transcripts relative to an expression-matched control set (gene sets with binned expression matching transcript lists). Note the dramatically different relative expression scales in (D) vs (E) UMAPs taken directly from ASAP (Li et al., 2022; Gardeux et al., 2017). (F, G) UMAP plots of snRNA-seq raw counts (log-transformed) showing expression of: (F) Hemolectin (Hml) in hemocytes and late spermatocytes and (G) Myosin heavy chain (Mhc) in muscle and late spermatocytes. Yellow: relative expression high. (H) Testis hybridized in situ with biotinylated antisense RNA probe to Hml, showing expression (blue) in spermatocytes. Scale bar, 200 µm. (I) Dot Plot showing expression of pairs of tissue specific markers across cell types in the testis plus seminal vesicle snRNA-seq sample. Average expression of each gene in a given cell type (here, a cluster at Leiden 0.4 resolution) denoted by color intensity. Percent of nuclei of the given cell type scored as expressing each gene denoted by dot size. Colors along axes (see Figure 1B) indicate the relevant cell type for tissue-specific marker pairs. (see also Figure 3—figure supplements 1 and 2 and Figure 3—source data 1).
-
Figure 3—source data 1
Average expression of 496 transcription factors in Leiden 0.4 clusters from Li et al., 2022.
- https://cdn.elifesciences.org/articles/82201/elife-82201-fig3-data1-v2.xlsx
Figure 3—figure supplement 1
Magnitude of the mid-to-late spermatocytes transcription program.
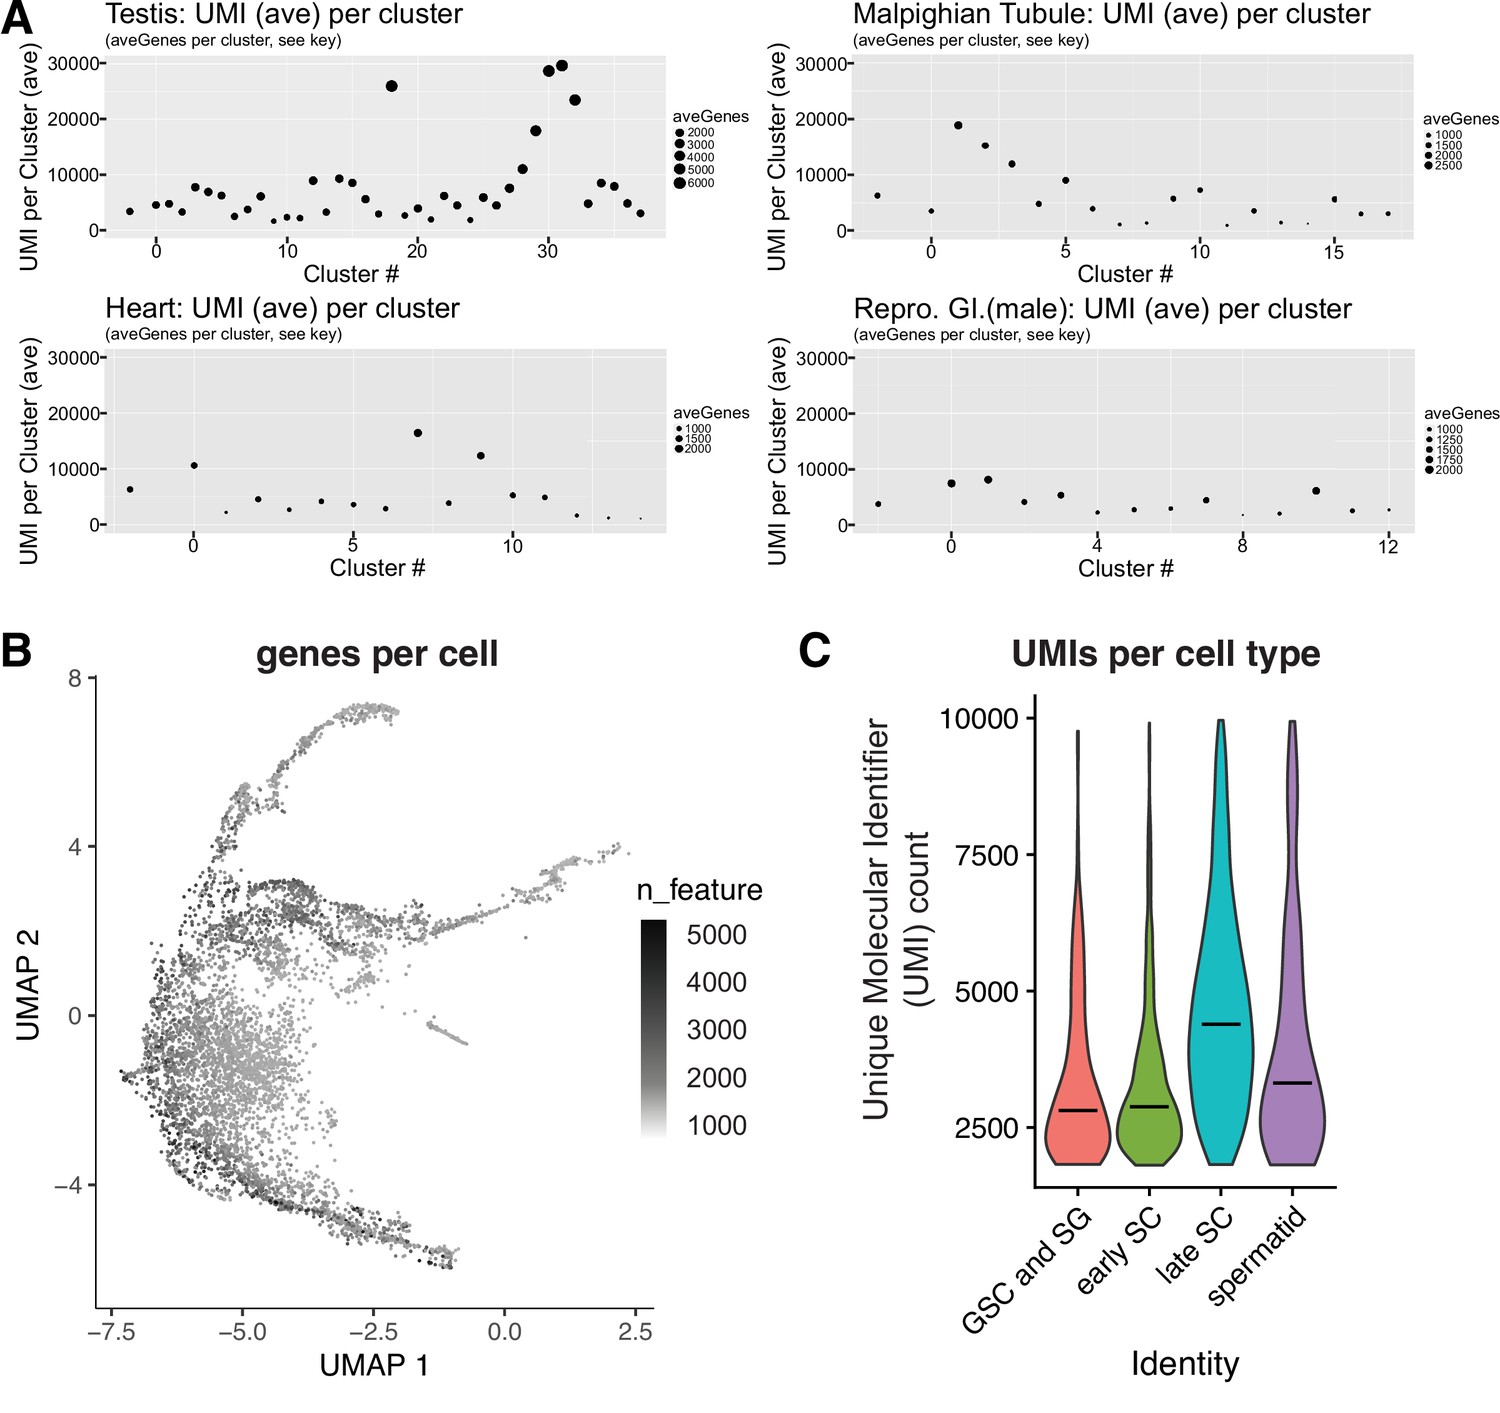
(A) Average UMI and numbers of genes expressed per cluster (ordered by cluster number In Li et al., 2022) inFCA snRNA-seq data from testis, malpighian tubules, heart, and male reproductive tract. Dot size proportional to the number of genes detected as expressed (aveGenes). Note difference between panels in dot size scale bars. Across these tissues, Mid-to-late spermatocytes had the highest average UMI and number of genes expressed per cluster. The highest fat body signal was found to be due to contaminating spermatocytes, and is therefore not relevant here. In the FCA dataset from Li et al., 2022, Mid-to-late spermatocytes are represented by clusters 18, 29, 30, 31, 32; in our dataset, these correspond to clusters 51, 35, 33, 48, and some of 105 (Figure 2A and Figure 2—figure supplement 1A). (B) Germ line portion of UMAP from single cell sequencing (scRNAseq) of adult testes showing number of genes detected as expressed per cell. (C) Violin plot of average number of UMIs per cell type for scRNA-seq data.
Figure 3—figure supplement 2
Markers of other tissues also expressed in mid-to-late spermatocytes.
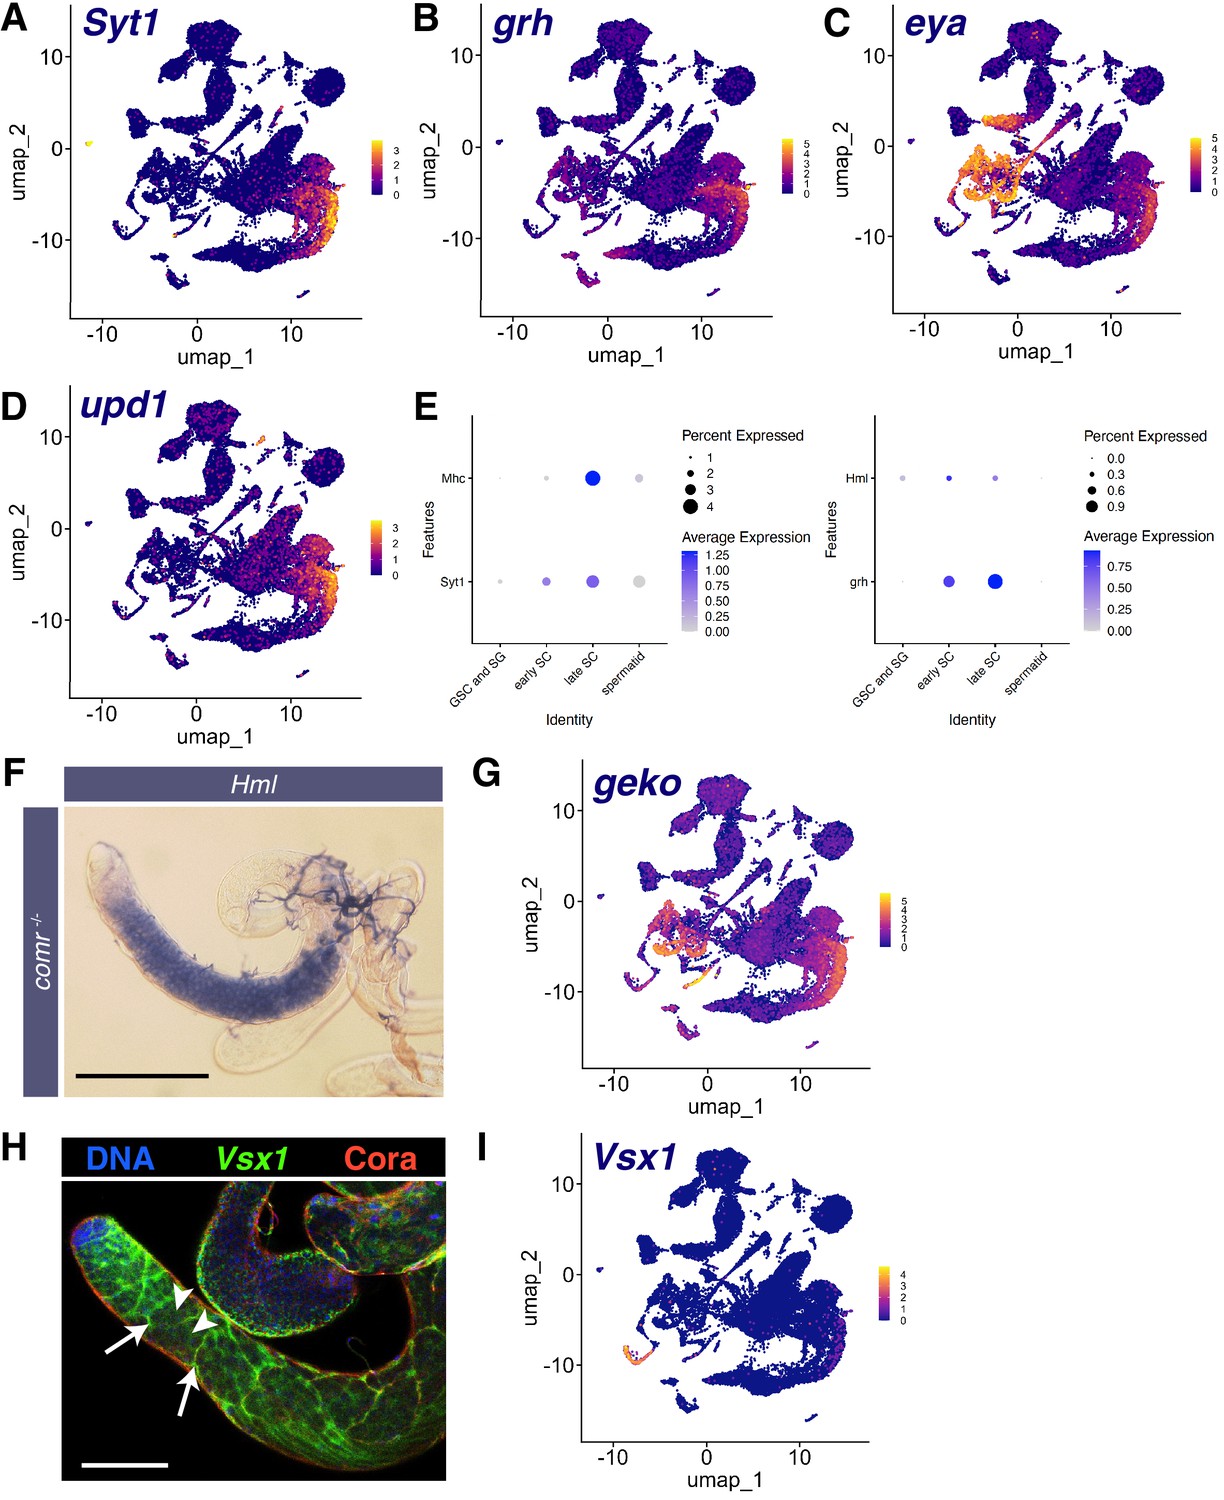
(A–D) UMAPs of snRNA-seq raw counts (log-transformed) showing expression of: (A) Synaptotagmin 1 (Syt1); (B) grainy head (grh); (C) eyes absent (eya); (D) unpaired 1 (upd1). Yellow: relative expression high. (E) Dot Plots showing expression of Mhc, Hml, Syt1, and grh in spermatocytes detected in single cell RNA-seq (scRNA-seq) analysis of adult testes. (F) Testis from a male mutant for the tMAC subunit comr hybridized in situ with biotinylated antisense RNA probe to Hml, showing expression in spermatocytes. Scale bar, 200 µm. (G) UMAP of snRNA-seq raw counts (log-transformed) showing expression of geko. (H) Testis showing Visual system homeobox 1 (Vsx1) mRNA (FISH, green), Coracle (Cora) protein (red), and DNA (blue). White arrows: somatic cyst cells, white arrowheads: spermatocytes. Scale bar, 100 µm. (I) UMAP of snRNA-seq raw counts (log-transformed) showing expression of Vsx1.
Figure 4 with 1 supplement
Developmental transitions revealed by comparing sn and scRNA-seq.
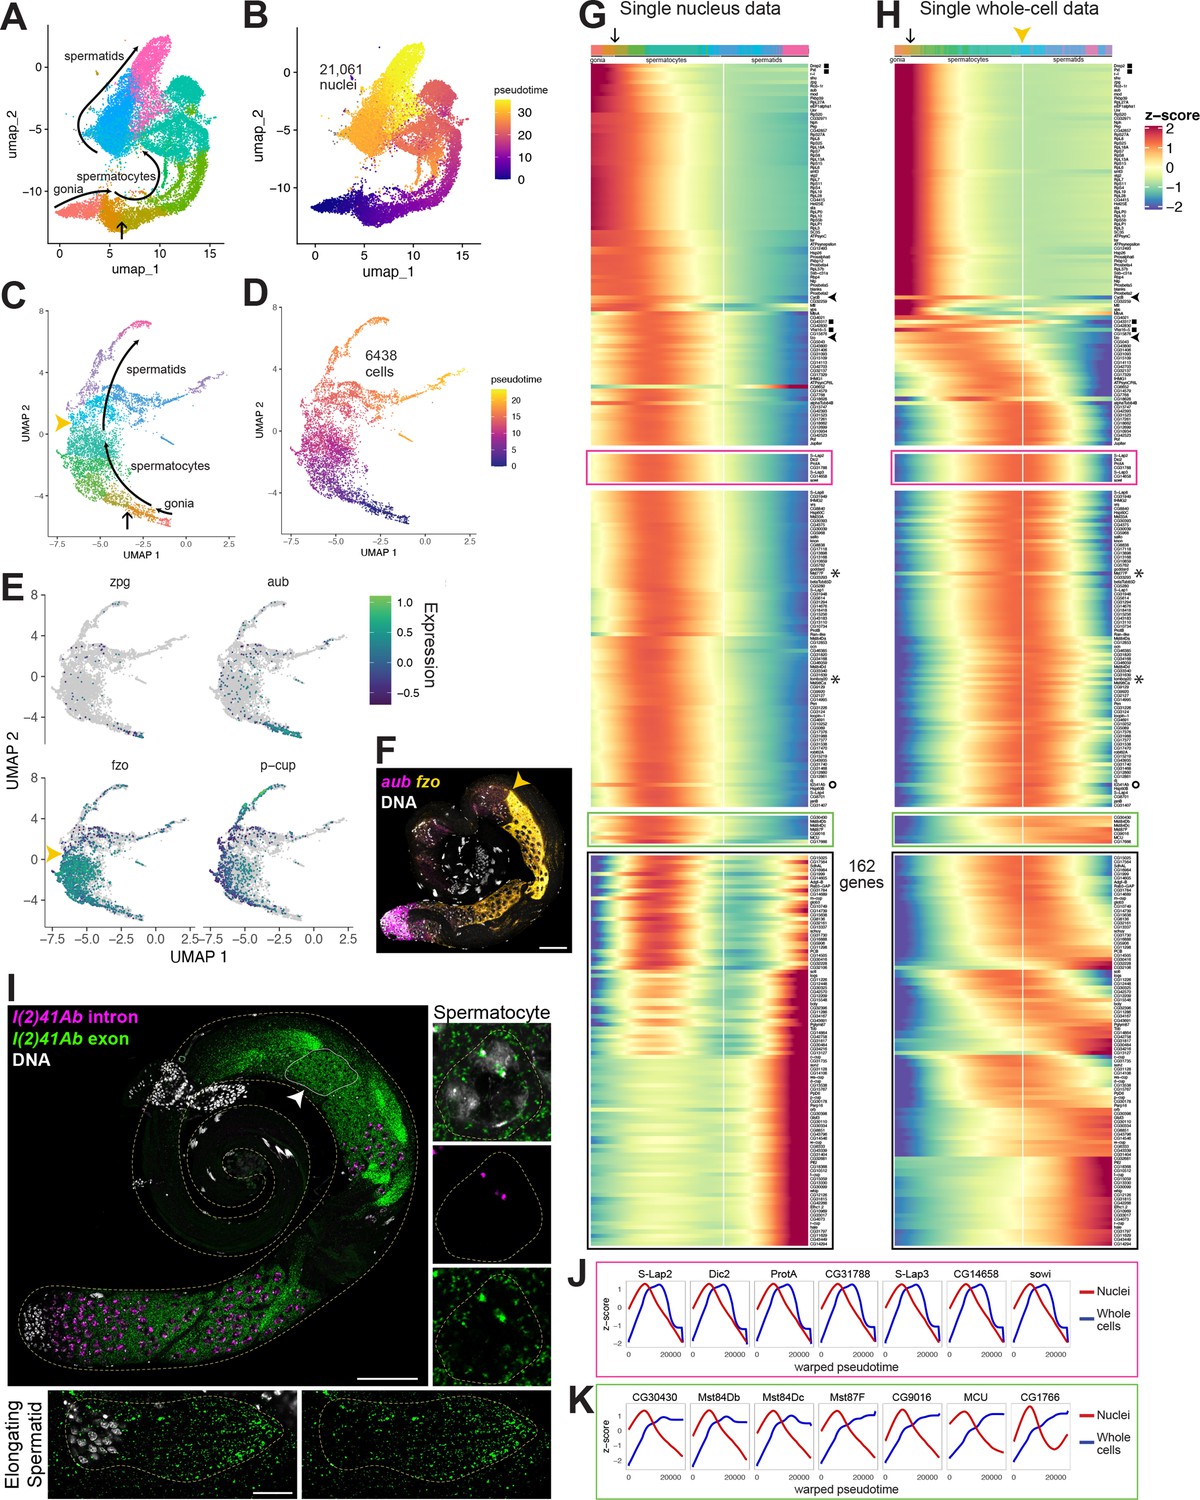
(A–D) UMAP plots of germline-annotated data from (A, B) FCA snRNA-seq of adult testis plus seminal vesicle and (C, D) whole-cell scRNA-seq of adult testis. (A, C) Color denotes germline differentiation stage, with clustering in A as in Figure 4—figure supplement 1. (B, D) Color denotes pseudotime, with the few nuclei lacking a calculable pseudotime value colored gray. (E) UMAPs of scRNA-seq data showing log10(Expression) levels of cell-stage diagnostic markers zpg, aub, fzo, and p-cup. (F) FISH of diagnostic genes aub and fzo. Scale bar, 50 µm. Yellow arrowhead in (C, F, H) marks the point at which fzo transcript drops, annotated as early round spermatids based on (F). (G–H) Heatmaps of row-normalized (z-score) gene expression over pseudotime for: (G) all germline-annotated single nuclei from panel A, (H) all germline-annotated single whole cells from panel C, with genes in same order as in G. X axes, pseudotime; Y axes, genes. Vertical white line: nuclei (G) or cells (H) where level of fzo mRNA has dropped 50% from peak to nadir (0 on Z score). Fzo transcript drop validated in the cell data, and marked with yellow arrowhead. Top bars: cell identity for each column, colored as in panels A,C. Arrow points to transition between clusters dominated by expression of genes up in spermatogonia to clusters dominated by expression of genes upregulated in early spermatocytes (see Figure 4—figure supplement 1A and B). Gene markers as follows: black filled squares, transcripts validated in Figure 2—figure supplement 1. Arrowheads, CycB and fzo. Asterisks, Mst77F and tomboy20. Circle, l(2)41Ab, validated in panel I. Black boxes: genes transcribed post-meiotically (see Figure 5). (I) FISH of l(2)41Ab intron (magenta) and l(2)41Ab exon (green). Arrowhead on whole testis points to a round spermatid cyst, which lacks intronic signal. High magnification insets: Side - Spermatocyte nucleus showing intronic and exonic probe signal. Bottom - elongating spermatid cyst showing exonic probe signal only. Scalebars: whole testis, 50 µm; spermatocyte, 5 µm; spermatid, 20 µm. (J-K) Comparison of gene expression over warped pseudotime for: (J) genes outlined by pink boxes in G,H; (K) genes outlined by green boxes in G,H. (see also Figure 4—figure supplement 1).
Figure 4—figure supplement 1
Developmental transitions revealed by trajectory analysis.
Figure 5 with 1 supplement
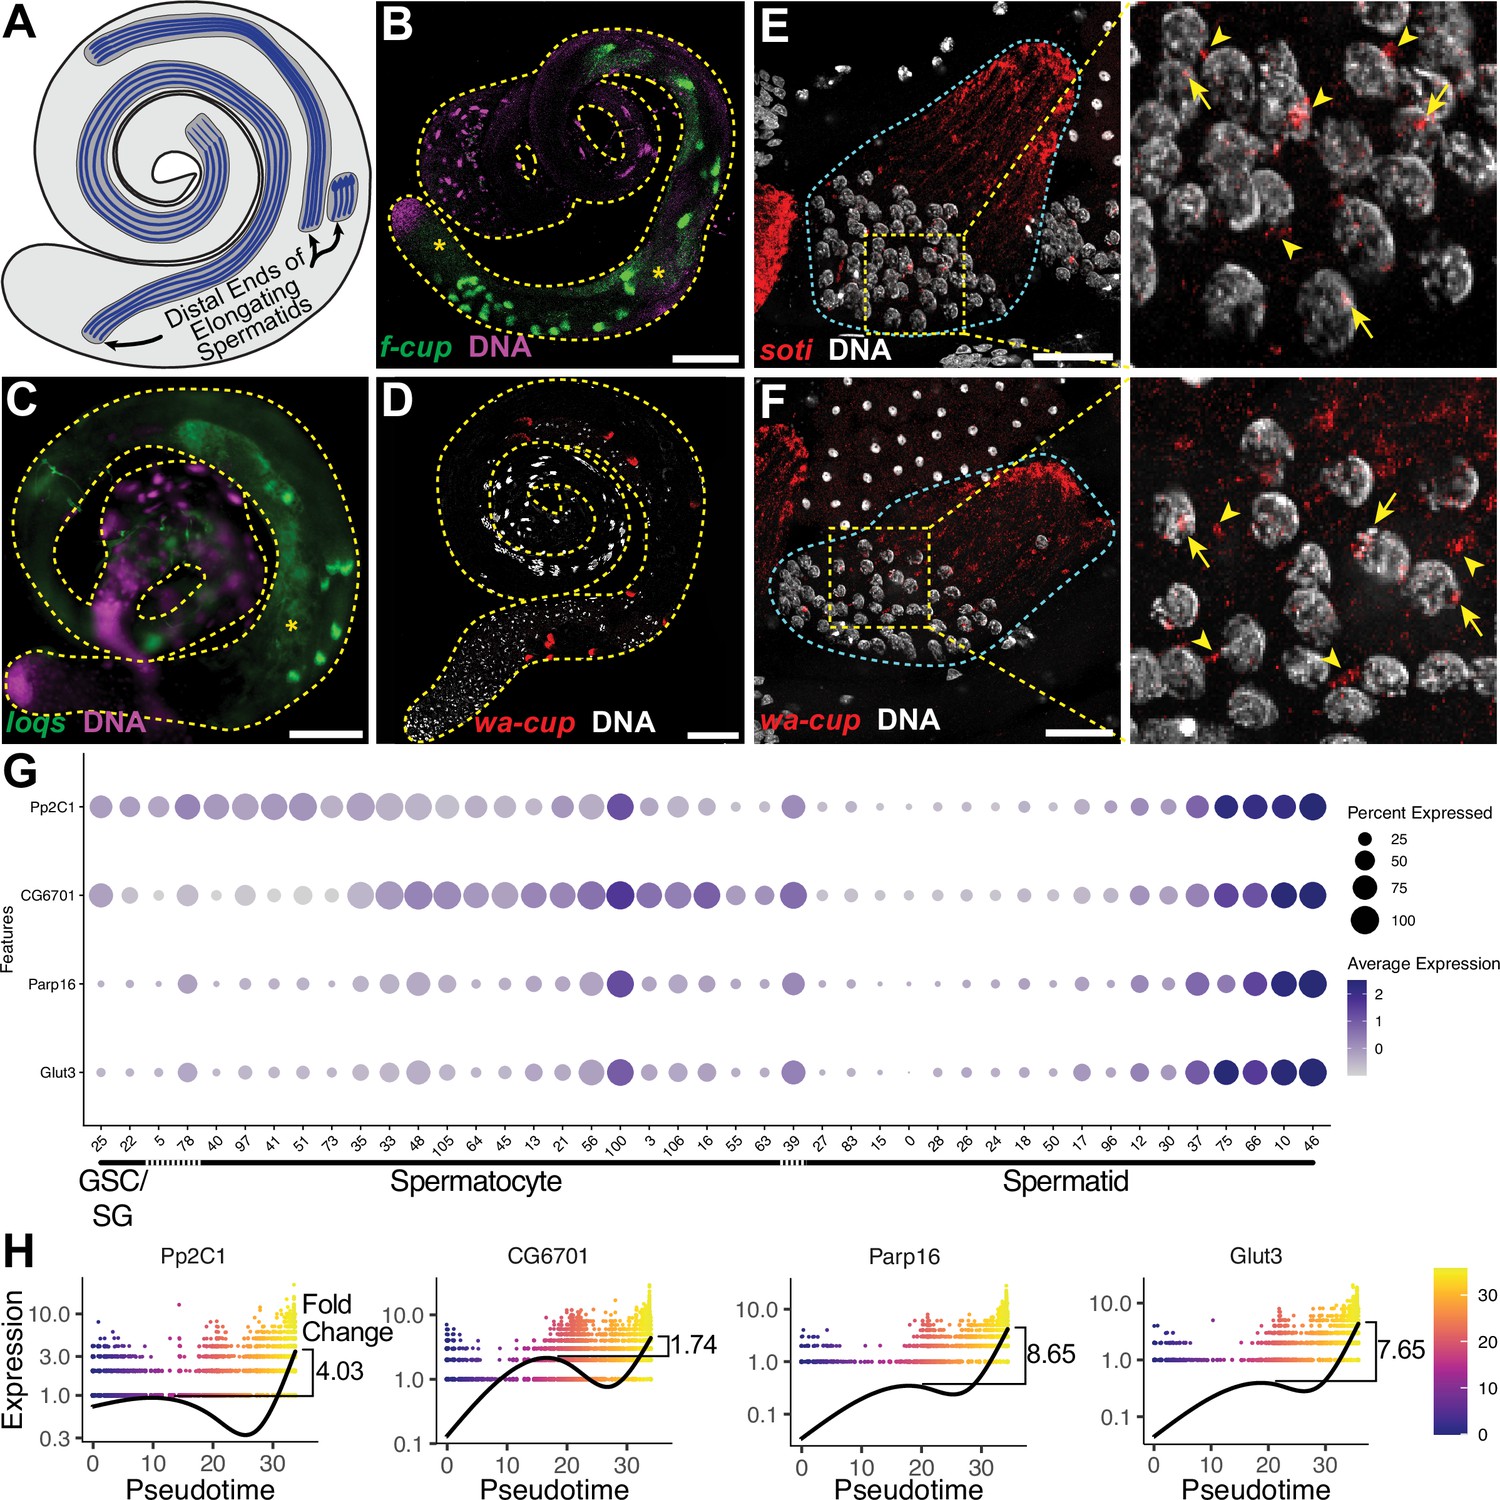
The transcript landscape of haploid spermatids.
(A) Diagram of spermatid orientation in the testis at different stages of spermatid elongation. Arrows: distal ends of spermatid cysts. (B, C) RNA FISH of representative transcripts (B): f-cup, (C): loqs in whole testes showing different patterns of mRNA localization for post-meiotically transcribed genes. DNA (magenta), target RNA (green). Asterisk: signal in spermatocytes as surmised by relatively large nuclear profile revealed by absence of signal. Bar: 100μm. (D) smFISH for wa-cup (red) in whole testes. DNA (white). Bar: 100μm. (E, F) Left: smFISH for soti (E) or wa-cup (F) in a single early elongating spermatid cyst (cyan dashed outline). RNA (red) and DNA (white). Bar: 25 μm. Right: Enlarged image of yellow dashed box showing spermatid nuclei. Arrows: nuclear transcripts. Arrowheads: perinuclear granules. (G) Dot plot for selected spermatid transcribed genes showing expression levels in each germ cell cluster. (H) Expression over pseudotime for selected spermatid transcribed genes and fold change between late pseudotime and previous expression maxima in early/mid pseudotime (see also Figure 5—figure supplement 1).
-
Figure 5—source data 1
List of 162 spermatid transcribed genes.
- https://cdn.elifesciences.org/articles/82201/elife-82201-fig5-data1-v2.xlsx
Figure 5—figure supplement 1
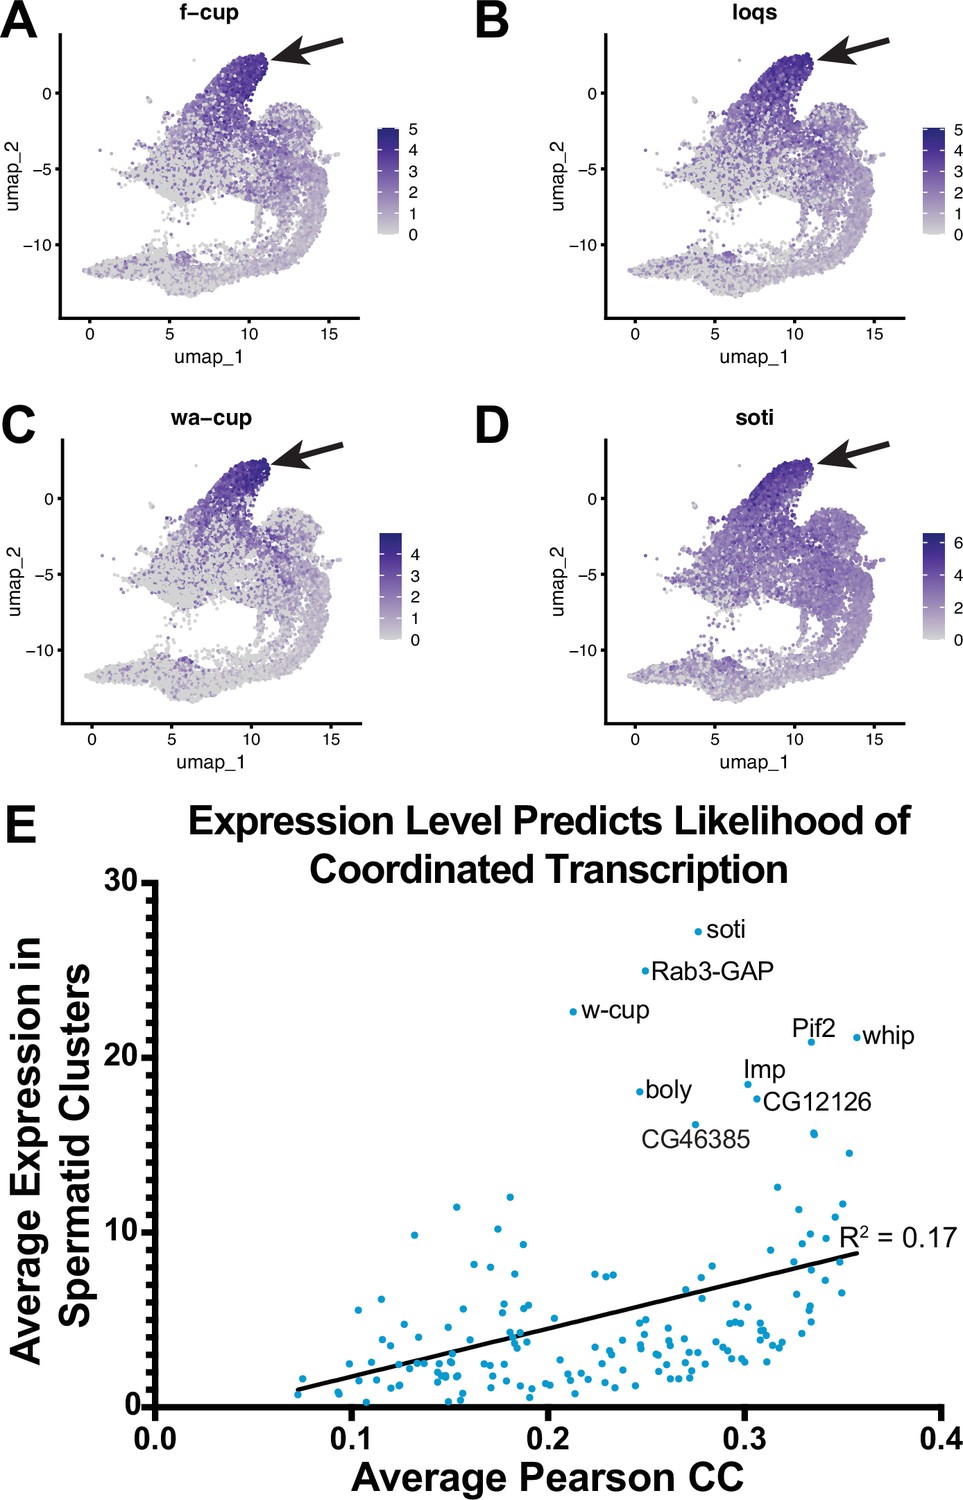
Reactivation of transcription in spermatids.
(A–D) UMAP plots of f-cup, loqs, wa-cup and soti. Arrow: latest point in pseudotime. (E) Scatter plot showing that average Pearson correlation coefficient (measurement of how likely each spermatid transcribed gene is to be expressed with every other spermatid transcribed gene) is positively correlated with the average expression level (average expression of each spermatid transcribed gene among spermatid clusters).
Figure 6 with 1 supplement

Differentiation in the somatic cyst cell lineage.
(A) Cyst cell lineage portion of the UMAP from snRNA-seq data with Leiden 6.0 cluster numbering. (B) Expression of tj (blue), eya (orange), and so (red) projected on the UMAP (heatmaps in Figure 6—figure supplement 1C and D). (C) 2D UMAP of cyst cell clusters newly reprojected in their own gene expression space (Materials and methods; note different axis coordinates relative to panel A). Cluster colors correspond to panel A except for unidentifiable clusters with low UMIs (gray). (D) Schematic of cyst cell cluster progression from CySC, to spermatogonia-associated (SgCC) to spermatocyte-associated (ScCC) to spermatid-associated (SpCC) inferred from the 3D UMAP in panel C. Cluster numbers and colors as in A. Note two splits, one earlier and one later in cyst lineage progression. (E) Plot of average number of genes (dot size) and average number of UMIs per cyst lineage-annotated cluster; with clusters ordered by deduced progression of differentiation. Dotted and dashed lines under cluster numbers represent the early split shown in D, while single (HCC) and double (TCC) solid lines represent the later split. (F - T) UMAPs compared to FISH (RNA), IF or live GFP emission (from tagged protein) images. For each gene comparison, arrows, dashed arrows and/or arrowheads point out the same cell type in the UMAP and its corresponding FISH and/ or GFP fluorescence image. (F) piwi mRNA expression projected on the UMAP. (G, H) piwi mRNA (FISH; green) and DNA (magenta). (G) whole testis, (H) testis apical tip. (I) Apical tip of testis expressing GFP tagged Piwi protein. (J) eya mRNA expression projected on the UMAP. (K, L) eya mRNA (FISH; green) and DNA (magenta). (K) Testis apical tip. (L) Whole testis. Outline demarcates cyst of spermatocytes showing eya transcript expression (see Figure 3 and its supplement). (M) Amph expression projected on the UMAP. (N) Apical third of a testis expressing GFP-tagged Amph protein. (O) Schematic of head cyst cells (HCC, green solid outline) embedded (left) or not embedded (right) in the terminal epithelium (TE, gray), with the tail cyst cell (TCC, green dashed outline) extending away, containing either a pre-coiled (right) or coiled (left) spermatid bundle (Sperm nuclei, magenta). Coracle (Cora, blue) marks the septate junction (SJ) between TCC and HCC. (P) Nep4 mRNA expression projected on the UMAP. (Q) Testis base showing Nep4 mRNA (FISH, green), DNA (magenta), and Cora (septate junctions, cyan). Arrowhead points to TCCs associated with coiled sperm. (R) UMAP of geko mRNA expression. (S, T) geko mRNA (FISH, green), DNA (magenta), and Cora (septate junctions, cyan). (S) Whole testis. (T) Testis base. Arrowhead points to TCCs associated with coiled sperm. (U) Dotplot of gene expression (Y axis) by cluster as cyst lineage progresses through differentiation (X axis, left to right). Averaged expression in each cluster indicated by color scale. Percent of cells within a cluster expressing the gene indicated by size of dot. Lines under cluster numbers as in E. Asterisk denotes hub. Bars: 20 μm (see also Figure 6—figure supplement 1).
Figure 6—figure supplement 1
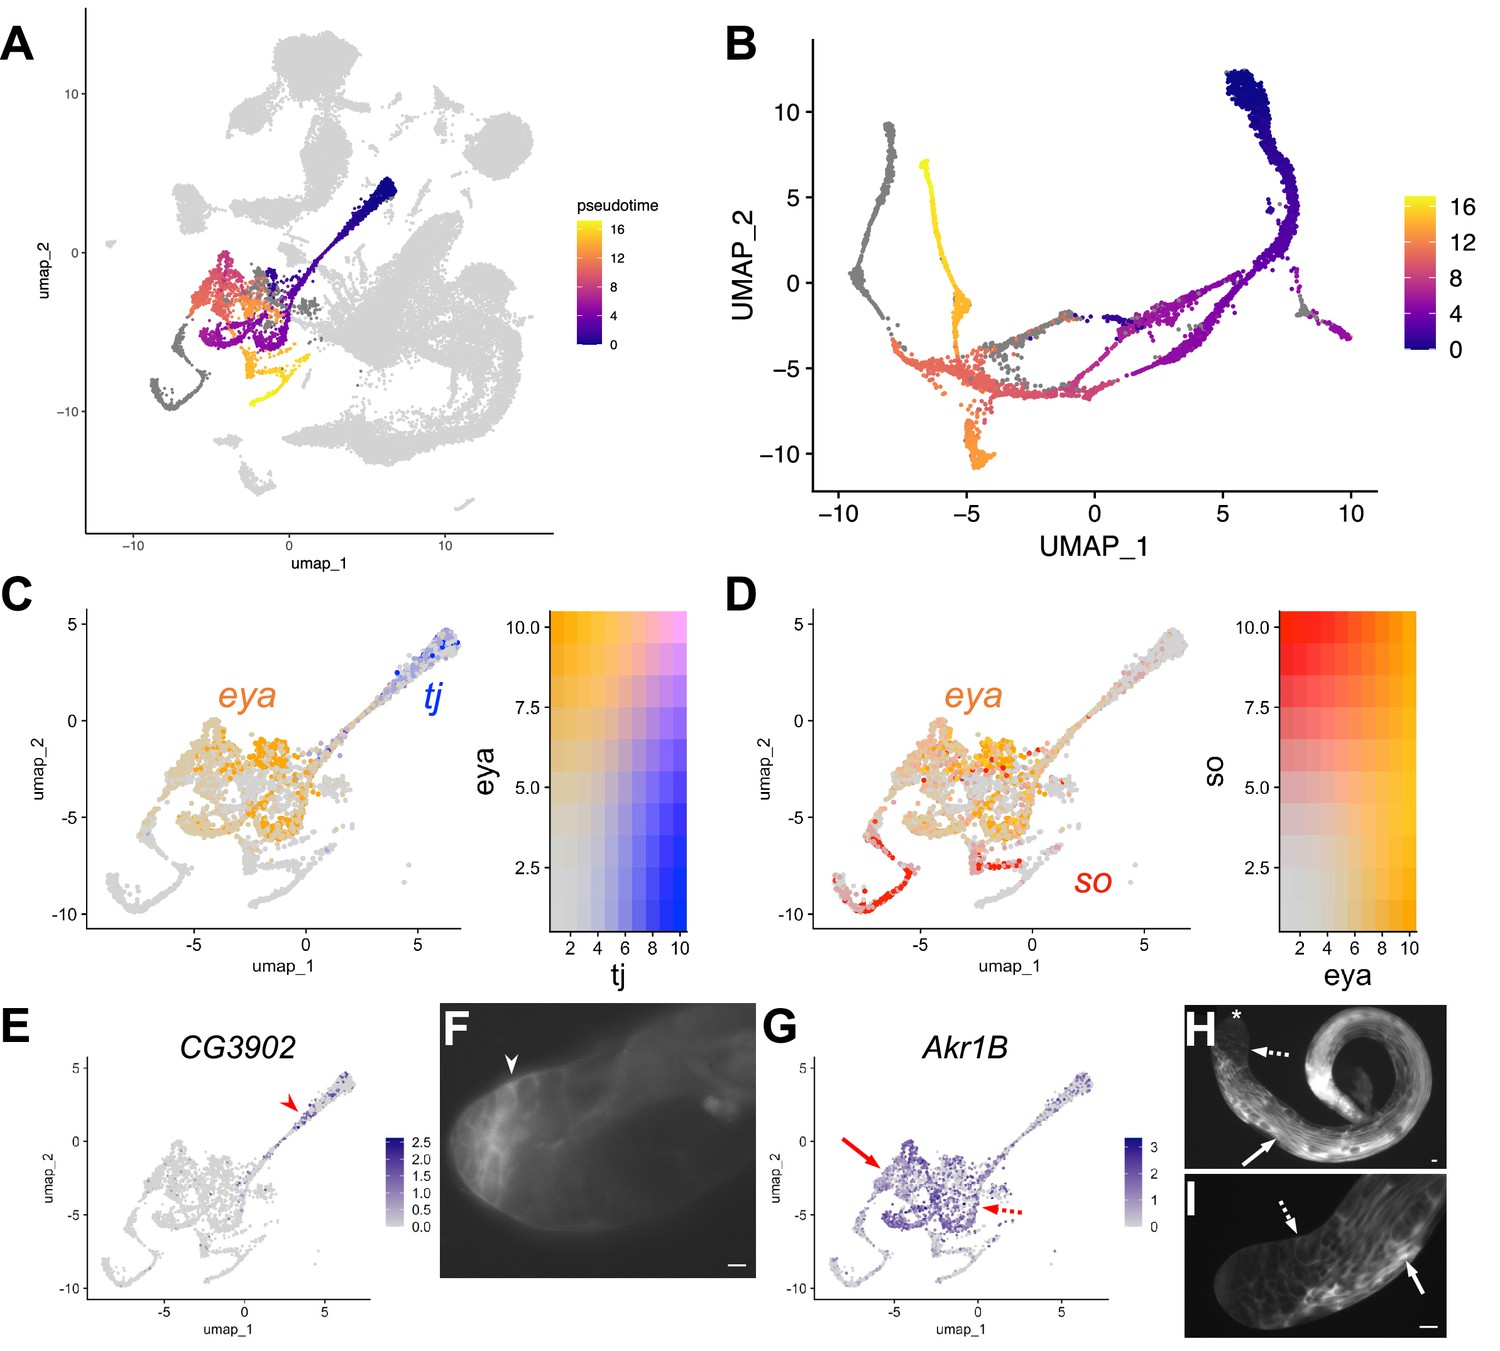
Cyst Lineage pseudotime and re-projection.
(A) UMAP of FCA testis plus seminal vesicle snRNA-seq data with cyst cell lineage colored by pseudotime (scale: origin (purple) to end (yellow)). Nuclei in dark gray have been determined to be a part of the cyst lineage, but did not have a calculable pseudotime value (see main text). Nuclei in light gray are not a part of the cyst cell lineage and did not have a calculable pseudotime value related to cyst cells. (B) UMAP of cyst cell clusters re-projected in their own gene expression space (3D representation available at https://doi.org/10.5061/dryad.m63xsj454). Color denotes pseudotime (scale on right). Nuclei in gray were designated as part of the cyst cell lineage but did not have a calculable pseudotime value. (C) tj (blue) and eya (orange) mRNA expression projected on the UMAP with corresponding heatmap (refer to Figure 6B). (D) eya (orange) and so (red) mRNA expression projected on the UMAP with corresponding heatmap (refer to Figure 6B). (E - I) UMAPs compared to IF images. For each gene comparison, arrows, dashed arrows and/or arrowheads point out the same cell type in the UMAP and its corresponding IF image. (E) CG3902 mRNA expression projected on the UMAP. (F) Apical tip of testis expressing GFP protein trap of CG3902. (G) Akr1B mRNA expression projected on the UMAP. (H–I) GFP protein trap of Akr1B. (H) whole testis, and (I) testis apical third view. Asterisk denotes hub. Bars: 20μm.
Figure 7 with 2 supplements
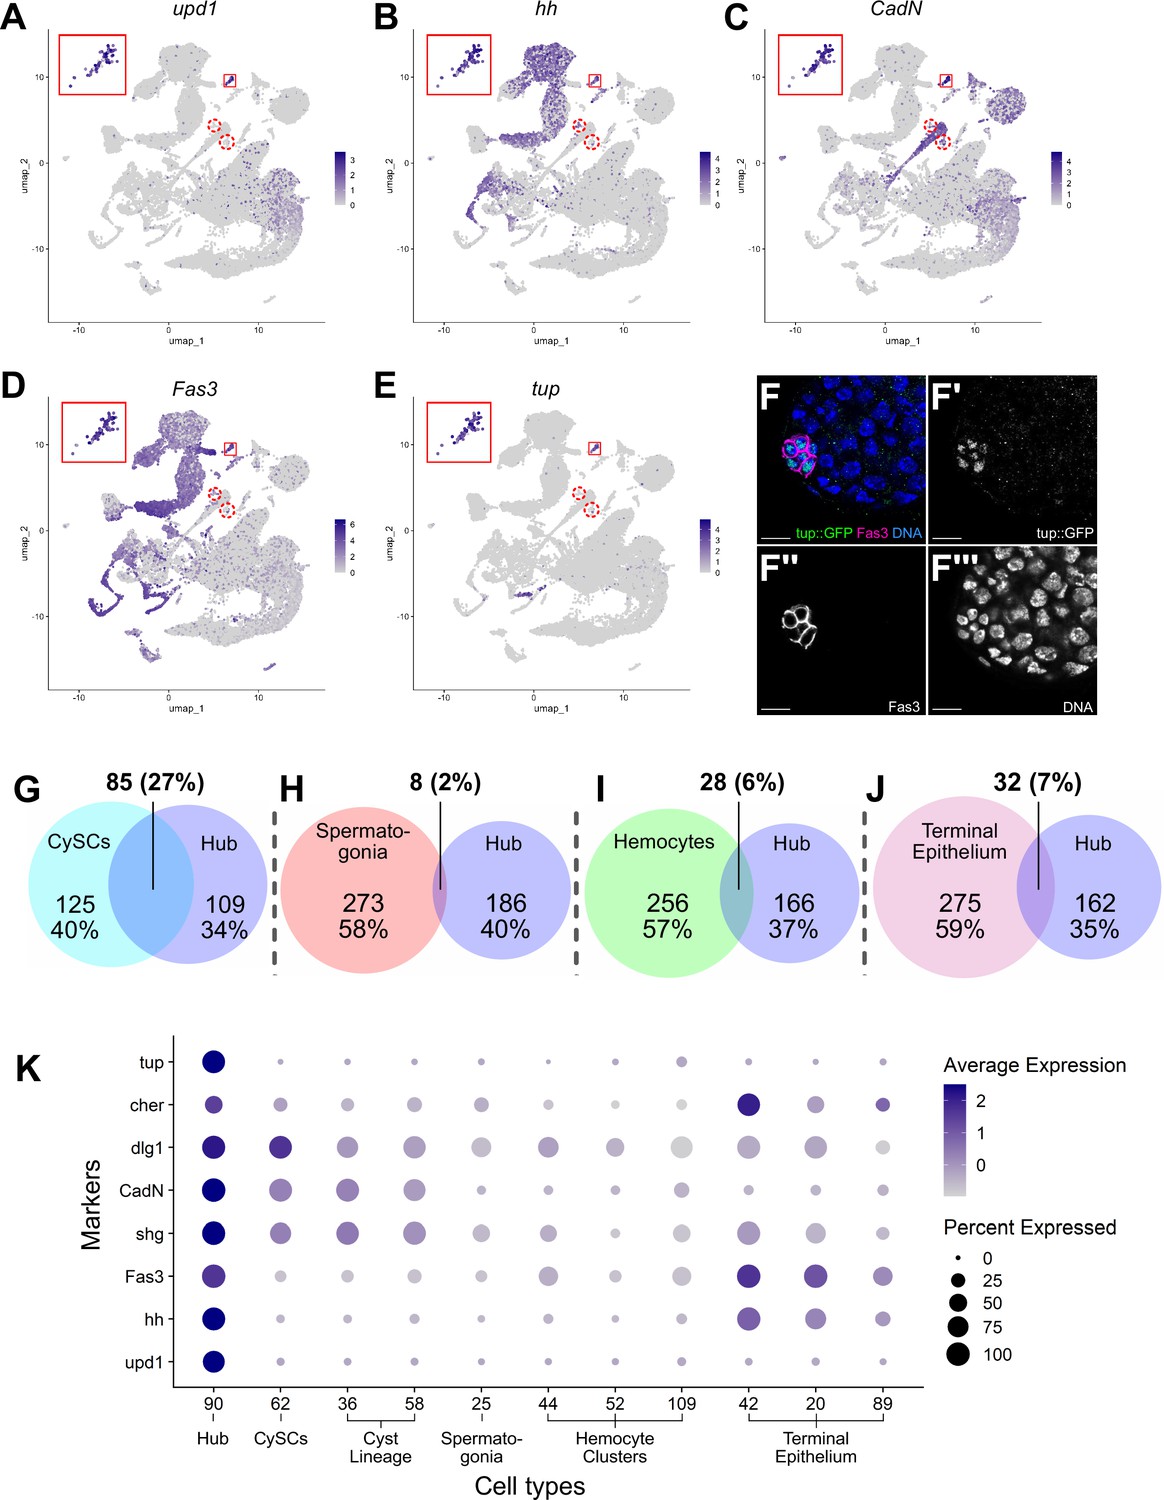
Characteristics of the Hub.
(A–E) Expression of the indicated genes (upd1, hh, CadN, Fas3, tup) projected onto the testis snRNA-seq UMAP with the 79 definitive hub nuclei outlined (small red box), with reprojection of hub nuclei (larger red box). Color intensity corresponds to expression level, shown as normalized average logFC. Red dashed circles contain non-hub nuclei of cluster 90 (see text and Figure 5). (F-F’’’) Apical tip of adult testis carrying a Tup::GFP fusion transgene revealing protein expression largely restricted to hub nuclei delimited by Fas3 (magenta). Nuclei (blue). Scale bar: 10 μm. (G–J) Paired Venn diagrams, comparing up-regulated genes in the hub vs. clusters containing either CySCs, spermatogonia, hemocytes, or terminal epithelial cells. Overlap in upregulated genes was greatest between Hub and CySCs. In each pairing, circle size reflects the number of genes compared for each cluster. Genes are listed in Figure 7—source data 1; the specific genes for hub vs. CySCs in Figure 7—source data 2. (K) Dot plot of expression of selected genes comparing hub to CySCs, the early Cyst lineage, Spermatogonia, Hemocytes, and Terminal epithelium (see also Figure 7—figure supplements 1 and 2).
-
Figure 7—source data 1
Differentially expressed genes in Hub, CySCs, spermatogonia, terminal epithelium, or hemocytes.
- https://cdn.elifesciences.org/articles/82201/elife-82201-fig7-data1-v2.xlsx
-
Figure 7—source data 2
Differentially expressed gene comparison between Hub and CySC.
- https://cdn.elifesciences.org/articles/82201/elife-82201-fig7-data2-v2.xlsx
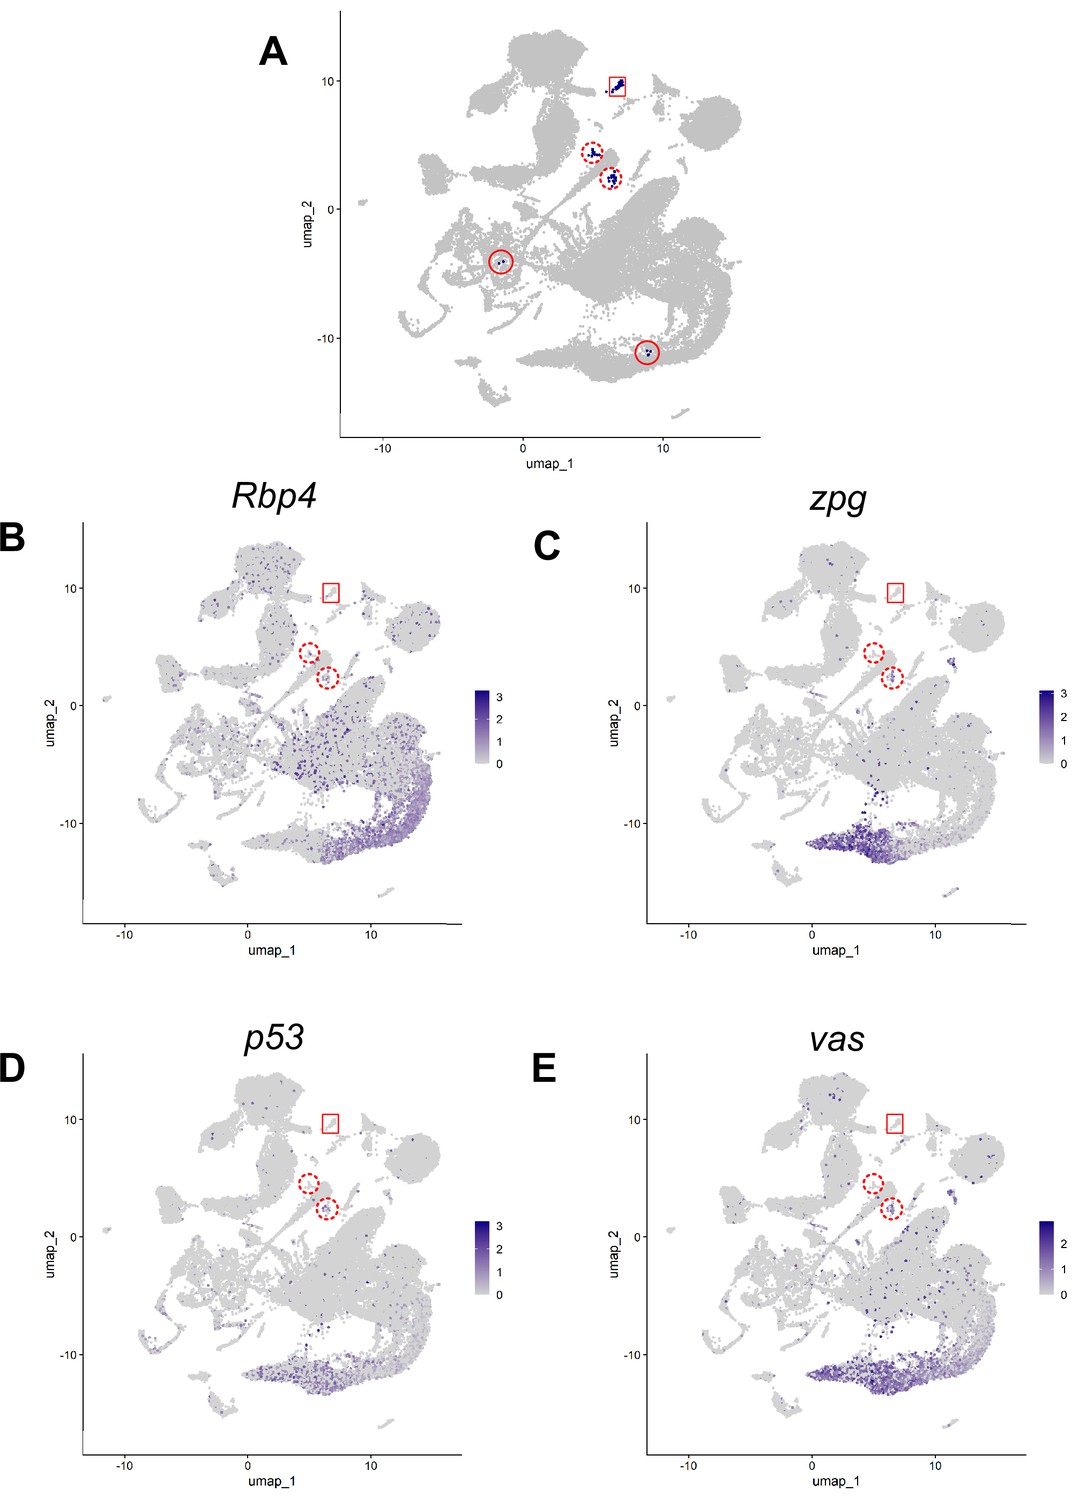
Figure 7—figure supplement 1
Hub justification using markers.
Justification for excluding 41 nuclei originally assigned to cluster 90. (A) Cluster 90 nuclei (blue). Red box: 79 nuclei of the definitive hub. Solid and dashed red circles: 4 other spatially separate domains of original cluster 90. Dashed circles: left wing (14 nuclei), right wing (21 nuclei). (B) Expression of Rbp4, a gene highly expressed in the germline, and in both wings but barely detected in the definitive hub. (C–E) Expression of three genes (C) zpg, (D) p53, (E) vas, all highly expressed in the germ line, detected in the right wing but barely detected in the definitive hub. Scale bar: normalized logFC values.
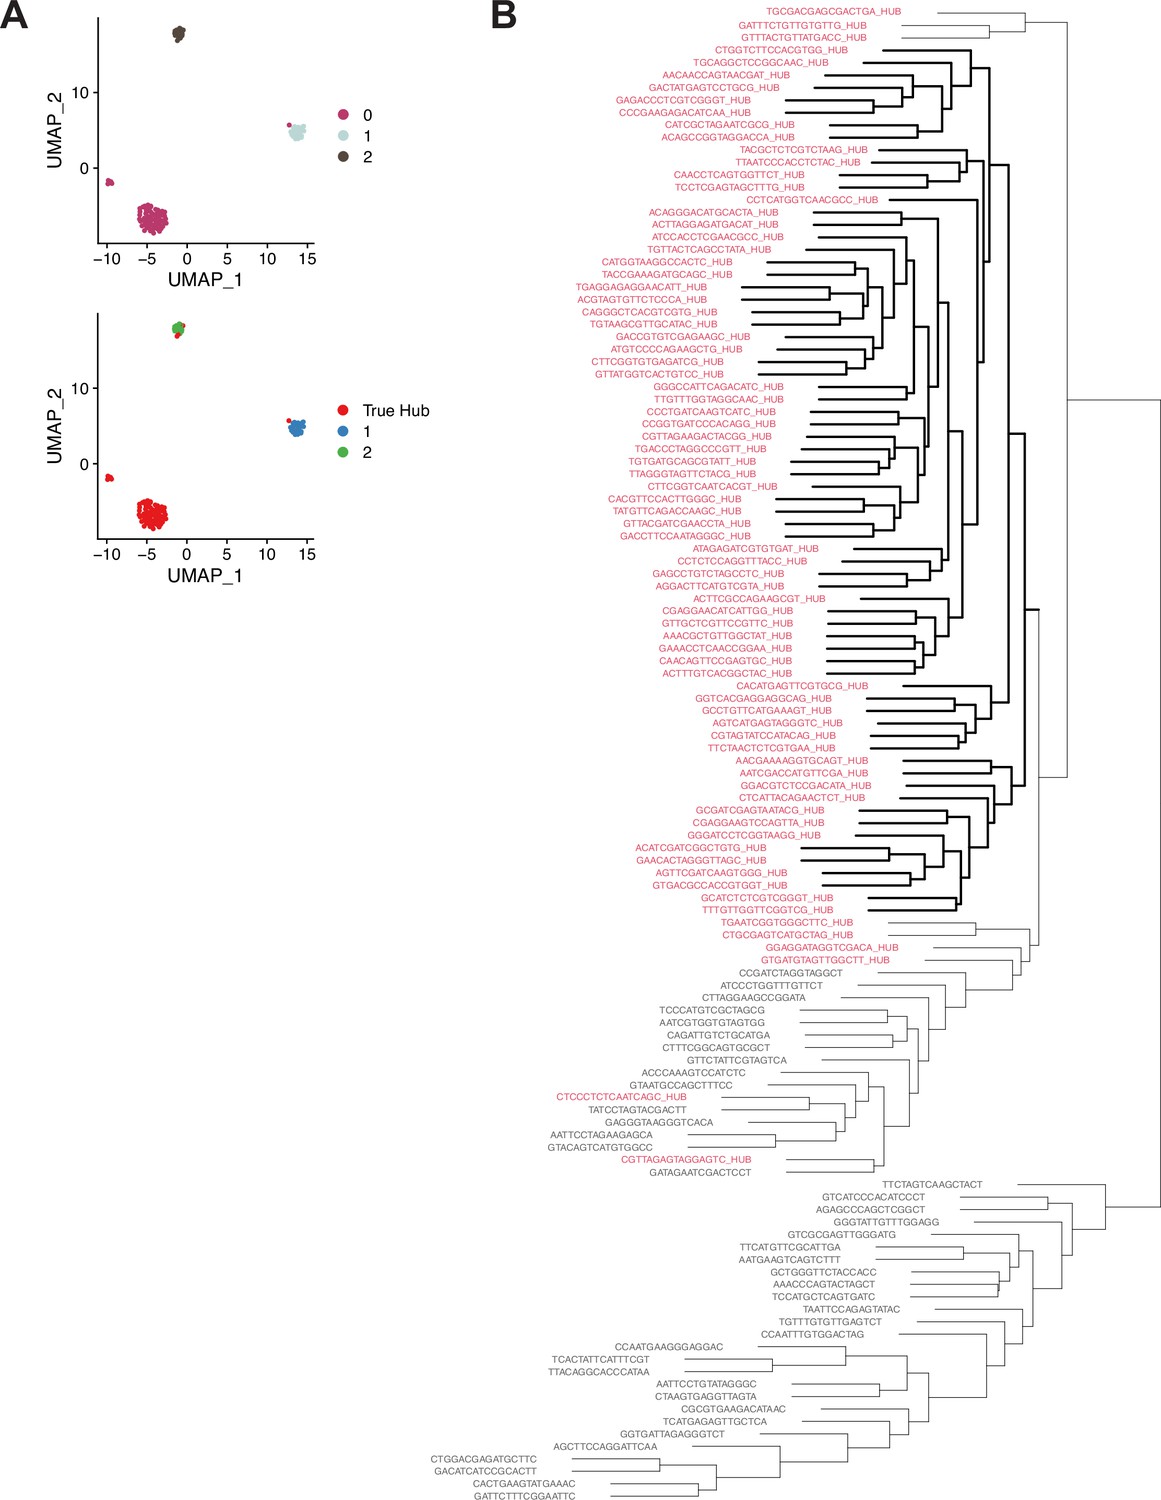
Figure 7—figure supplement 2
Further support for Hub identity using alternate clustering methodology.
(A) Graph-based subclustering of the 120 nuclei originally assigned to cluster 90. (Top) Nuclei colored according to cluster identity, based on highly expressed and highly variable genes in those 120 nuclei. (Bottom) ‘True Hub’ (i.e. the 79 definitive hub nuclei) are colored in red. ‘True Hub’ annotation almost perfectly overlaps with cluster 0 in the graph-based subclustering. (B) A dendrogram derided from hierarchical clustering of the 120 nuclei originally assigned to cluster 90. The 79 definitive hub nuclei largely cluster together (red text). Nuclei are named by their cell barcode, with the suffix ‘_HUB’ added to the 79 hub nuclei. The bolded lines indicate a single clade composed entirely of definitive hub nuclei.
Figure 8 with 1 supplement
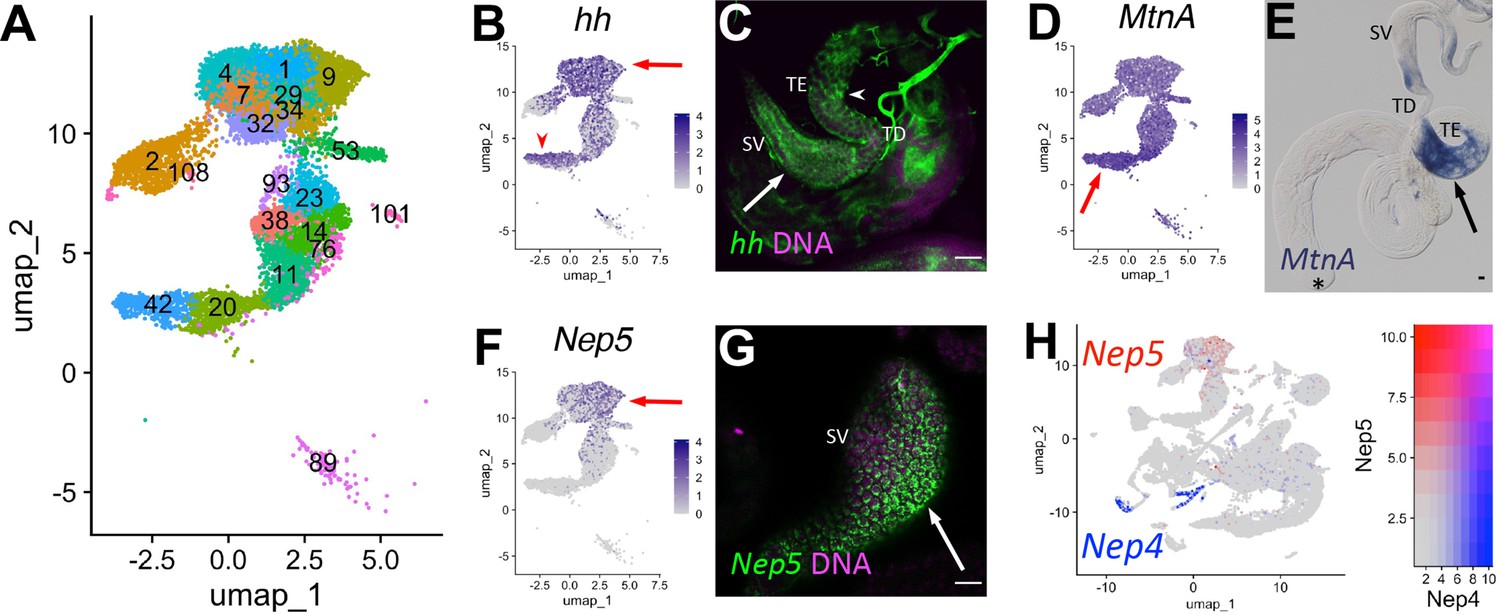
Characteristics of supporting epithelia.
(A) UMAP of non cyst cell lineage epithelial cells of the testis from the FCA snRNA-seq data with Leiden 6.0 clusters. Note: identity of cluster 89 remains undefined. (B - G) UMAPs compared to ISH images. For each comparison, arrows and/or arrowheads point out the same cell type in the UMAP and its corresponding ISH image. (B) hh mRNA expression projected on the UMAP. (C) FISH of hh mRNA (green) and DNA (magenta) showing the base of the testis including the TE (arrowhead), testicular duct (TD), and SV (arrow). (D) MtnA mRNA expression projected on the UMAP. (E) Colorimetric in situ hybridization of MtnA mRNA (blue) in an entire testis plus seminal vesicle. Asterisk denotes hub. (F) Nep5 mRNA expression projected on the UMAP. (G) FISH of Nep5 mRNA (green) and DNA (magenta) showing the SV. (H) Nep4 (blue) and Nep5 (red) mRNA expression projected on the UMAP with corresponding heatmap. Arrows and arrowheads point to corresponding cell types in UMAPs and stained tissues. Bars: 20μm. (see also Figure 8—figure supplement 1).
Figure 8—figure supplement 1
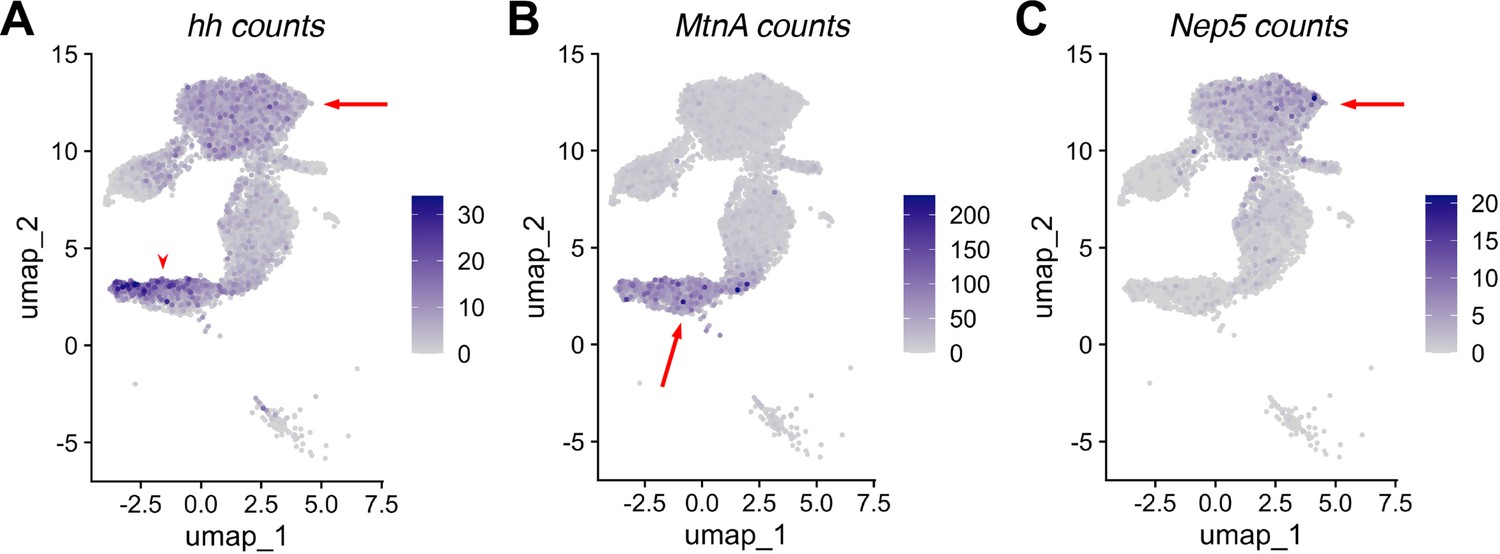
RNA expression in non cyst cell testis epithelia.
(A–C) UMAP of ‘mermaid’ showing RNA counts (rather than normalized expression) for the indicated marker genes: (A) hh, (B) MtnA, (C) Nep5. Arrows and arrowheads point to the same region on the corresponding UMAP in Figure 8B, D and F.
Tables
Table 1
List of identifying genes.
Key resources table
| Reagent type (species) or resource | Designation | Source or reference | Identifiers | Additional information |
|---|---|---|---|---|
| Genetic reagent (D. melanogaster; male) | w1118 | BDSC | ||
| Genetic reagent (D. melanogaster; male) | Oregon-R | BDSC | ||
| Genetic reagent (D. melanogaster; male) | y1w1 | BDSC | ||
| Genetic reagent (D. melanogaster; male) | tup::GFP | BDSC | RRID:BDSC_81278 | y w; PBac{y[+mDint2] w[+mC]=tup GFP.FPTB}VK00031/TM6C, Sb |
| Genetic reagent (D. melanogaster; male) | Amph::GFP | Kyoto Stock Center | CPTI-002789 | |
| Genetic reagent (D. melanogaster; male) | piwi::GFP | Kyoto Stock Center | CPTI-003588 | |
| Genetic reagent (D. melanogaster; male) | Akr1B::GFP | Kyoto Stock Center | CPTI-002728 | |
| Genetic reagent (D. melanogaster; male) | CG3902::GFP | Kyoto Stock Center | CPTI-100001 | |
| Genetic reagent (D. melanogaster; male) | comr z2-1340 | White-Cooper | FBal0144389 | |
| Antibody | Anti-Fasciclin III, mouse monoclonal | Developmental Studies Hybridoma Bank | DSHB:7G10; RRID:AB_528238 | 1:50 |
| Antibody | Chick polyclonal anti-GFP | Abcam | ab13970 | 1:10,000 |
| Antibody | Goat anti-chicken Alexafluor 488 | Invitrogen | A11039 | 1:200' |
| Antibody | Goat anti-mouse Alexafluor 568 | Invitrogen | A11004 | 1:100' |
| Antibody | Sheep Anti-FITC, horseradish peroxidase | Roche | 11426338910 | 1:2000 |
| Antibody | Sheep Anti-Digoxygenin, horseradish peroxidase | Roche | 11207733910 | 1:1500 |
| Antibody | Sheep Anti-digoxygenin, alkaline phosophatase | Roche | 11093274910 | 1:2000 |
| Antibody | mouse anti coracle monoclonal | Developmental Studies Hybridoma Bank | DSHB: C615.16 | 1:20 |
| Recombinant DNA reagent | piwi (plasmid containing cDNA) | BDGP DGC library | GM05853 | FBcl0142639 |
| Recombinant DNA reagent | eya (plasmid containing cDNA) | BDGP DGC library | GH05272 | FBcl0108545 |
| Recombinant DNA reagent | f-cup (plasmid containing cDNA) | BDGP DGC library | GH09045 | FBcl0128895 |
| Recombinant DNA reagent | loqs (plasmid containing cDNA) | BDGP DGC library | RE14437 | FBcl0204474 |
| Recombinant DNA reagent | geko (plasmid containing cDNA) | BDGP DGC library | RE30284 | FBcl0192532 |
| Recombinant DNA reagent | Vsx1 (plasmid containing cDNA) | BDGP DGC library | SD01032 | FBcl0286608 |
| Chemical compound, drug | DAPI | Millipore Sigma | 1023627600 | 1:1000 (of 2–5 mg/ml) |
| Chemical compound, drug | Vectashield | Vector Labs | H-1000 | |
| Chemical compound, drug | GMM tissue clearing reagent | Gary Struhl | 2 g Canada Balsam in 1 ml methyl salicylate | |
| Chemical compound, drug | Rhodamine tyramide | Thermo Scientific | 46406 | 1:1000 |
| Chemical compound, drug | Fluorescein tyramide | Thermo Scientific | 46410 | 1:1500 |
| Commercial assay or kit | Stellaris RNA FISH Probe Designer | Biosearch Technologies Inc. | ||
| Commercial assay or kit | 10 X Genomics Chromium Controller; Next GEM Single Cell3’ v3.1 | https://www.10xgenomics.com/product-catalog | 1000269 | |
| Software, algorithm | Seurat 4.0.5 | Satija et al., 2015; Hao et al., 2015 | ||
| Software, algorithm | Monocle3 | https://cole-trapnell-lab.github.io/monocle3/; Trapnell et al., 2014 | ||
| Software, algorithm | Venny 2.1 | https://bioinfogp.cnb.csic.es/tools.html | ||
| Other | Olympus Bx50 microscope | Olympus | ||
| Other | 20 x/0.60 NA objective | Olympus | ||
| Other | 10 x/0.30 NA objective | Olympus | ||
| Other | 40 x/0.75 NA objective | Olympus | ||
| Other | KY F75U Camera | JVC | ||
| Other | Orca-05G Camera | Hamamatsuu | ||
| Other | 63 x/1.4 NA objective | Zeiss | ||
| Other | LSM800 confocal | Zeiss | ||
| Other | 63 x/1.4 NA objective | Leica | ||
| Other | Stellaris Confocal | Leica |
Additional files
Download links
A two-part list of links to download the article, or parts of the article, in various formats.
Downloads (link to download the article as PDF)
Open citations (links to open the citations from this article in various online reference manager services)
Cite this article (links to download the citations from this article in formats compatible with various reference manager tools)
Emergent dynamics of adult stem cell lineages from single nucleus and single cell RNA-Seq of Drosophila testes
eLife 12:e82201.
https://doi.org/10.7554/eLife.82201


