Hepatic inactivation of murine Surf4 results in marked reduction in plasma cholesterol
- Department of Molecular and Integrative Physiology, University of Michigan-Ann Arbor, United States
- Life Sciences Institute, University of Michigan-Ann Arbor, United States
- College of Future Technology, Peking University, China
- Center for Life Sciences, Peking University, China
- State Key Laboratory of Membrane Biology, Peking University, China
- Howard Hughes Medical Institute, University of Michigan, United States
- Department of Internal Medicine, University of Michigan-Ann Arbor, United States
- Department of Cell and Developmental Biology, University of Michigan, United States
- Department of Human Genetics, University of Michigan, United States
- Department of Pediatrics and Communicable Diseases, University of Michigan, United States
Figures
Figure 1 with 1 supplement
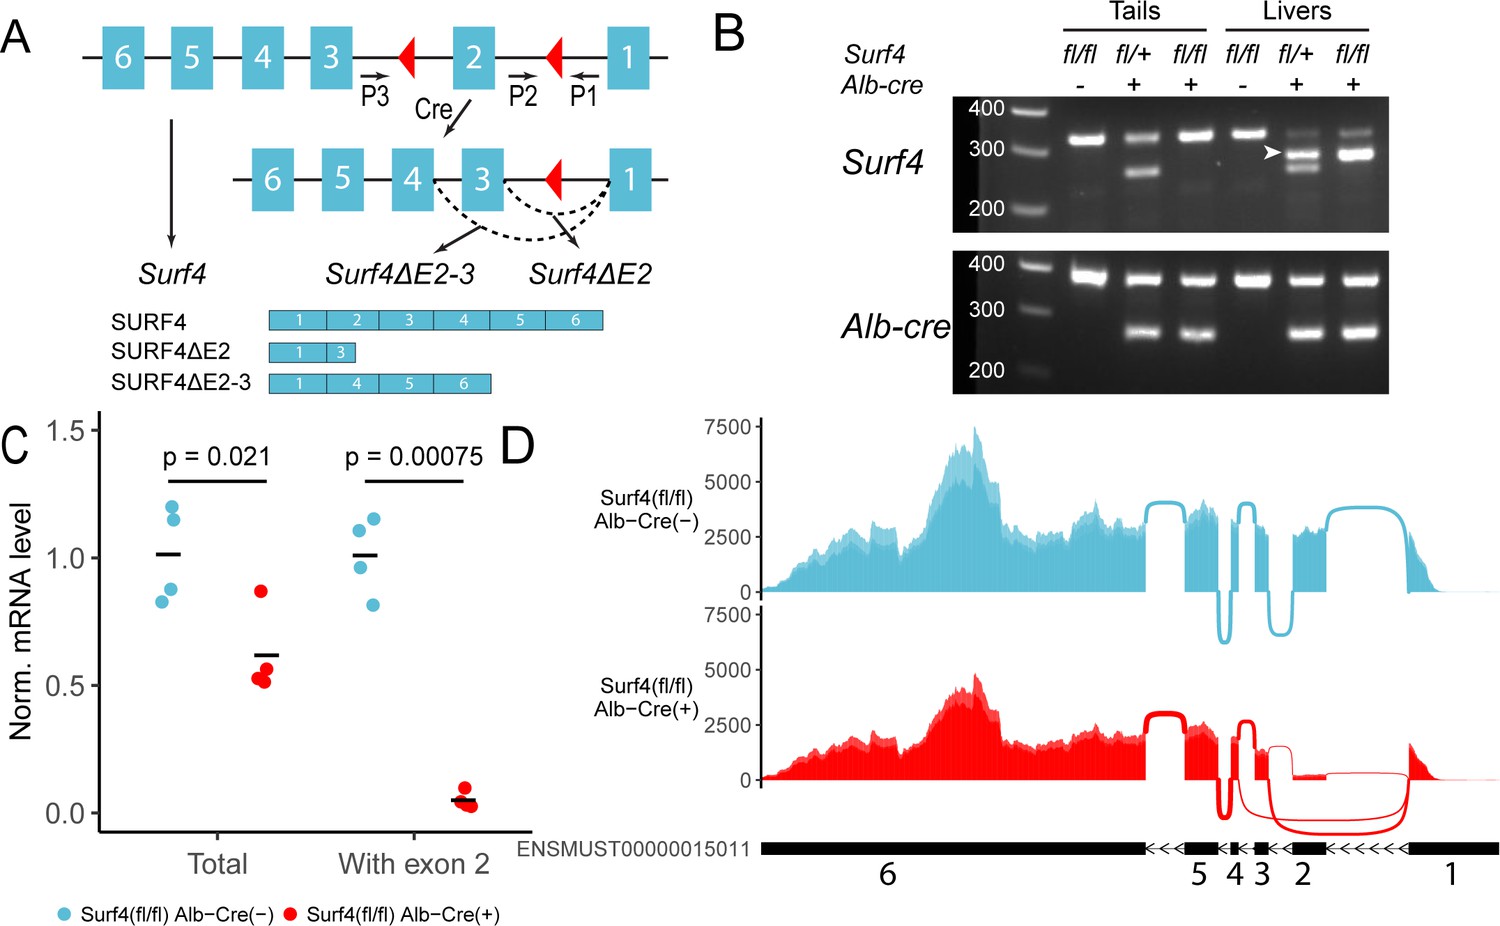
Generation of hepatocyte-specific Surf4 deficient mice.
(A) Schematic presentation of the Surf4 conditional allele. Blue rectangles represent exons and black line segments represent introns. Red triangles denote loxP sites. Expression of a Cre recombinase leads to excision of exon 2, which results in the generation of a Surf4 mRNA lacking exon 2 (Surf4ΔE2) or both exon 2 and 3 (Surf4ΔE2-3). Surf4ΔE2 mRNA is translated into a truncated SURF4 that is only 22 amino acids in length. Surf4ΔE2-3 mRNA restores the reading frame, producing an internally truncated protein missing the 88 amino acids encoded by exon 2 and 3. P1, P2, P3 indicate the positions for Surf4 genotyping primers (Supplementary file 1). Dashed arcs represent splicing events. Exons and introns are not drawn to scale. (B) Agarose gel electrophoresis of PCR products generated using genomic DNA (gDNA) isolated from mouse tails and livers and primers P1-3 shown in (A) (Figure 1—source data 1). For Surf4 genotyping, the wild type allele produces a smaller PCR product whereas the conditional allele produces a larger amplicon. Excision of exon 2 results in the generation of a PCR product of intermediate size (white arrowhead) that is present in gDNA isolated from the livers of Alb-Cre+ mice only. For Alb-Cre genotyping, presence of the Cre transgene results in a smaller PCR product. The upper band represents the amplification of an internal control (Supplementary file 1). (C) Quantification of normalized (Norm.) Surf4 mRNA abundance by quantitative PCR of liver cDNA from control (Surf4fl/fl Alb-Cre-) and Surf4fl/fl Alb-Cre+ mice (n=4 per genotype). Crossbars represent the mean normalized abundance in each group. The denoted p-values were calculated by two-sided Student’s t-test. (D) Density plots of RNA-seq reads mapping along exons and exon-exon junctions of Surf4 mRNA. Surf4fl/fl Alb-Cre+ mice have lower overall read counts due to incomplete nonsense mediated mRNA decay. Arcs between exons represent splicing events and line thickness is proportional to read count. Exact read count for each junction is presented in Figure 1—figure supplement 1.
-
Figure 1—source data 1
Uncropped and unedited gel shown in Figure 1B.
- https://cdn.elifesciences.org/articles/82269/elife-82269-fig1-data1-v2.zip
Figure 1—figure supplement 1
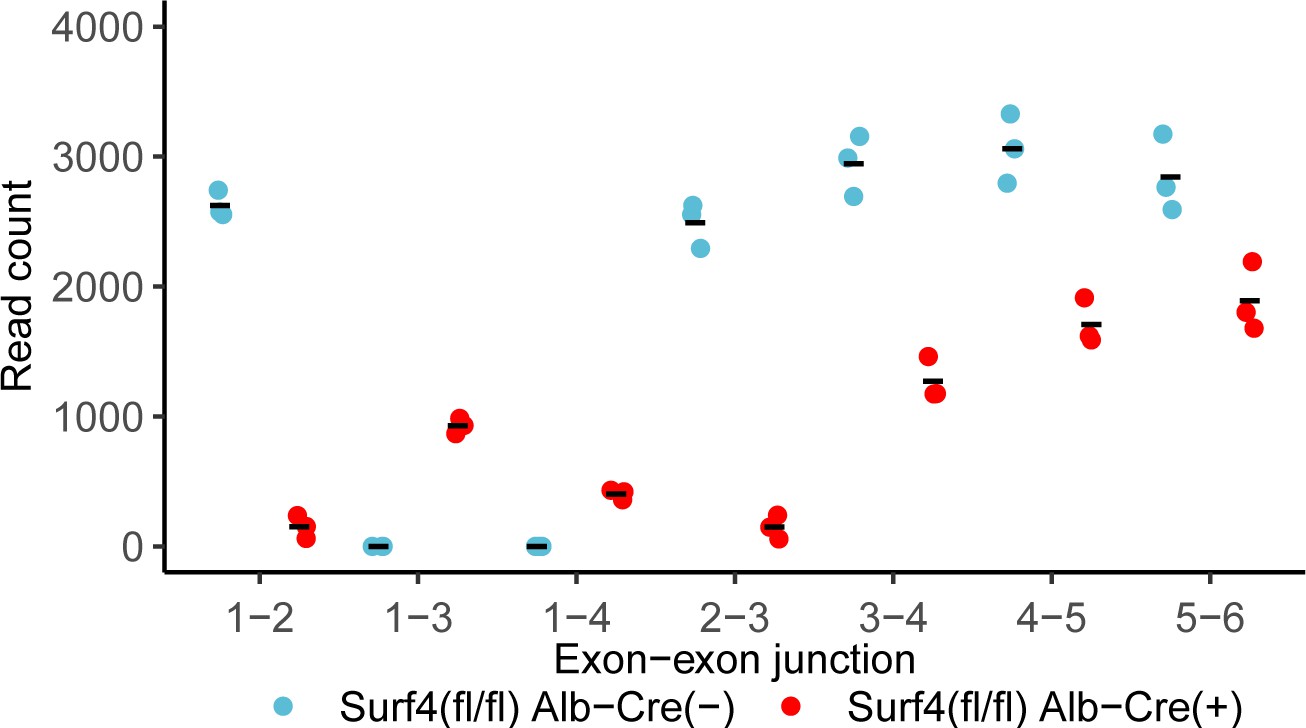
Read counts mapping to exon-exon junctions along the Surf4 transcript based on RNA-sequencing data.
n=3 per genotype. Crossbars represent the mean read count in each sample.
Figure 2 with 2 supplements
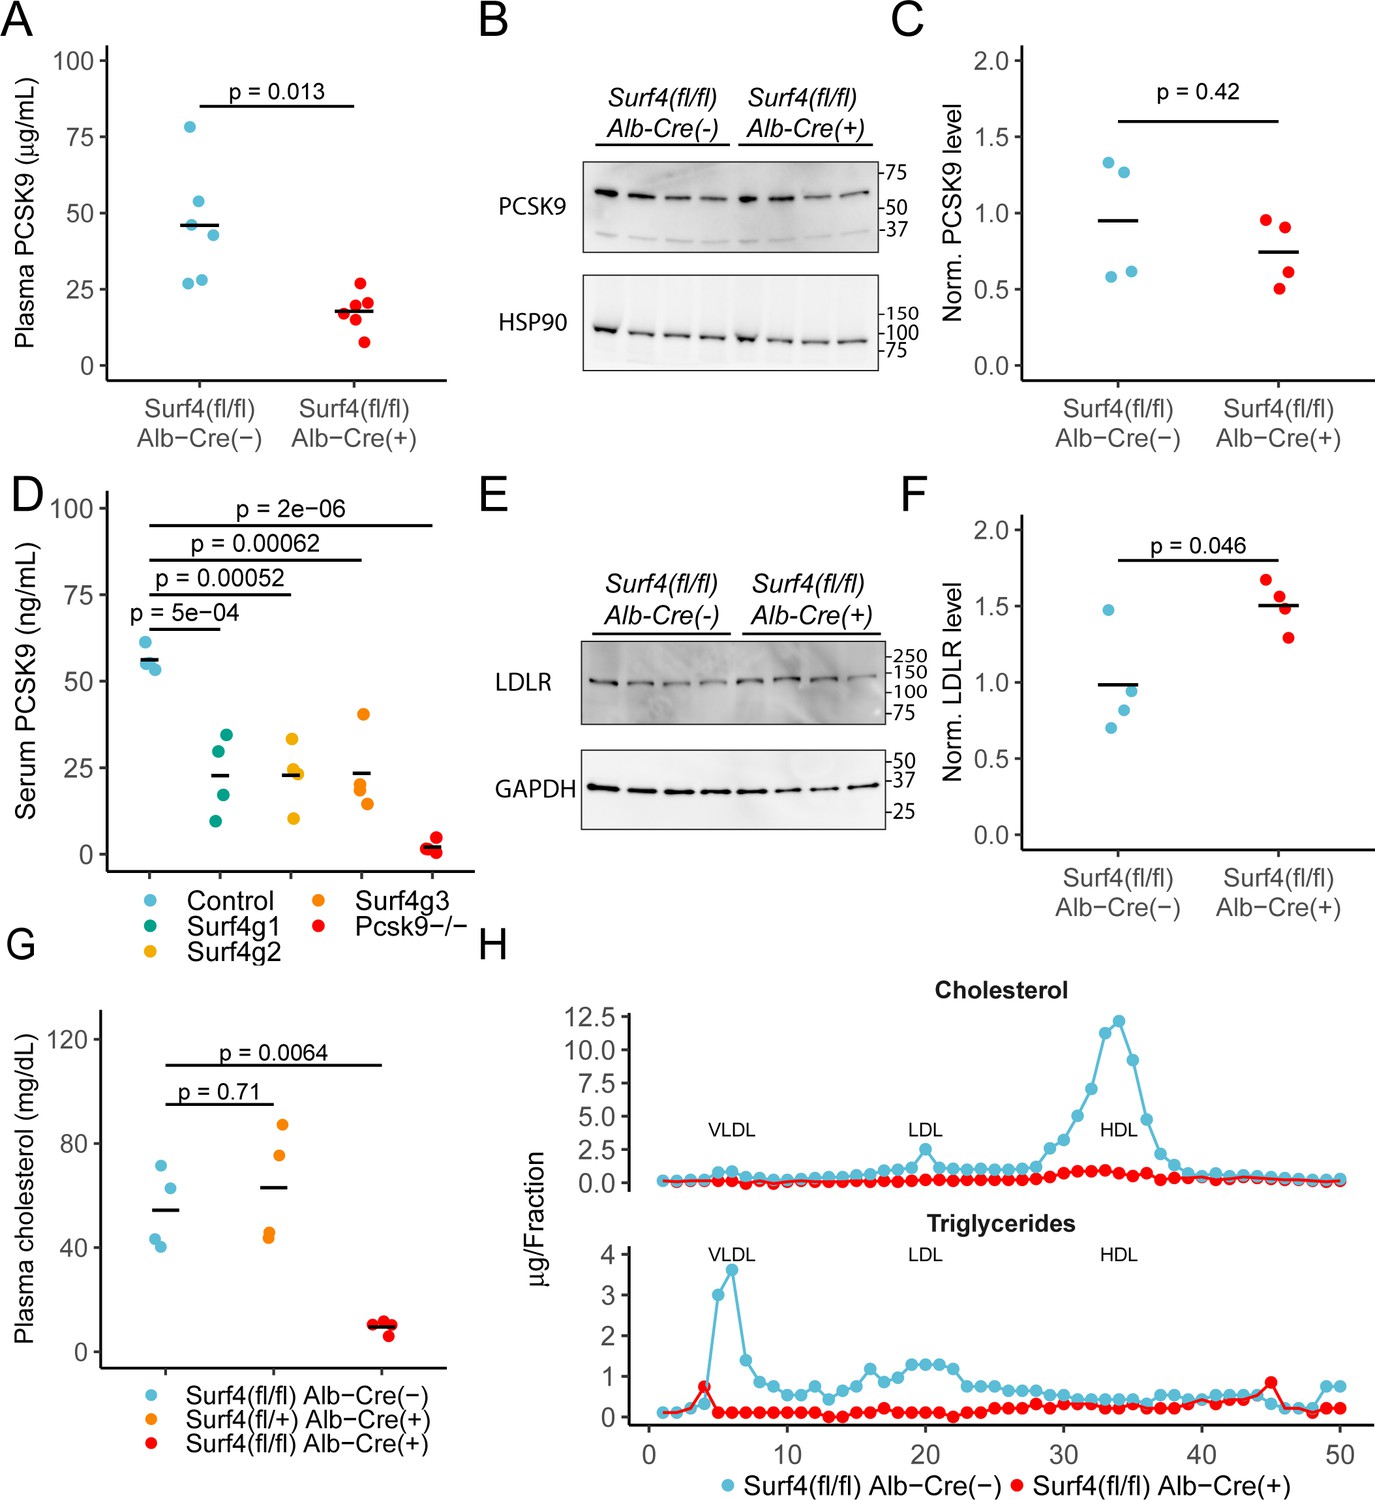
Deletion of hepatic Surf4 results in decreased serum PCSK9 level and profound hypocholesterolemia in mice.
(A) Serum PCSK9 levels measured by ELISA in Surf4fl/fl Alb-Cre+ mice and Surf4fl/fl Alb-Cre- littermate controls (n=6 per genotype). (B) Immunoblot for PCSK9 and HSP90 (loading control) in liver lysates collected from control and Surf4fl/fl Alb-Cre+ mice (n=4 per genotype) (Figure 2—source data 1). (C) Quantification of liver PCSK9 levels presented in (B) (n=4 per genotype). (D) Serum PCSK9 levels in mice in which hepatic Surf4 was acutely inactivated by CRISPR/Cas9 (n=4 per group). (E) Immunoblot of liver lysates collected from control and Surf4fl/fl Alb-Cre+ mice (n=4 per genotype) for LDLR and GAPDH (loading control) (Figure 2—source data 1). (F) Quantification of liver LDLR levels presented in (E). (G) Steady-state plasma cholesterol levels in 2 months old control (Surf4fl/fl Alb-Cre-), heterozygous (Surf4fl/+ Alb-Cre+), and homozygous (Surf4fl/fl Alb-Cre+) Surf4 deleted mice. (H) Fractionation of lipoproteins in mouse serum by fast protein liquid chromatography (FPLC). Cholesterol and triglyceride levels were measured in each fraction. Each control and Surf4fl/fl Alb-Cre+ sample was pooled from sera of 5 mice. Fractions corresponding to VLDL, LDL, and HDL are annotated. Crossbars represent the mean in all plots. For comparisons between control and Surf4fl/fl Alb-Cre+, p-values were calculated by two-sided Student’s t-test. For comparison between control, heterozygous, and Surf4fl/fl Alb-Cre+ mice, p-values were obtained by one-way ANOVA test followed by Tukey’s post hoc test. Molecular weight markers notated are in kDa.
-
Figure 2—source data 1
Uncropped and unedited blots shown in Figure 2.
- https://cdn.elifesciences.org/articles/82269/elife-82269-fig2-data1-v2.zip
Figure 2—figure supplement 1
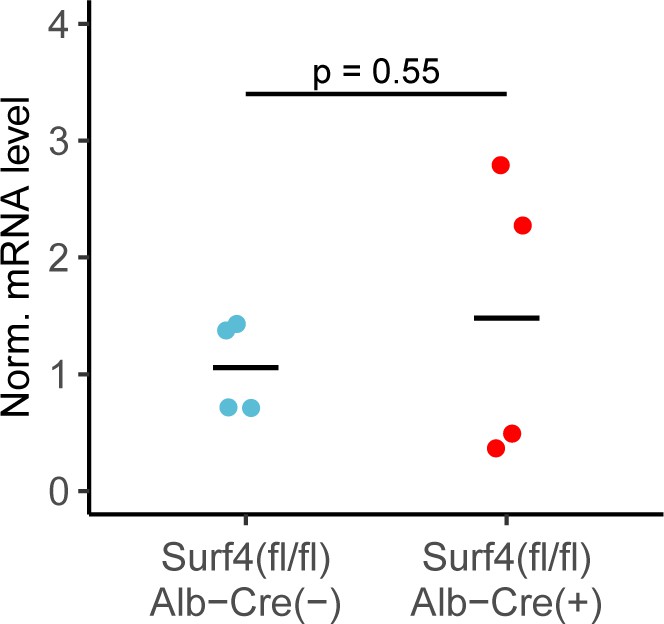
Normalized (Norm) Pcsk9 mRNA levels in Surf4fl/fl Alb-Cre-.and Surf4fl/fl Alb-Cre+ mice.
n=4 per genotype. Crossbars represent the mean, p-values were obtained from a two-sided Student’s t-test.
Figure 2—figure supplement 2
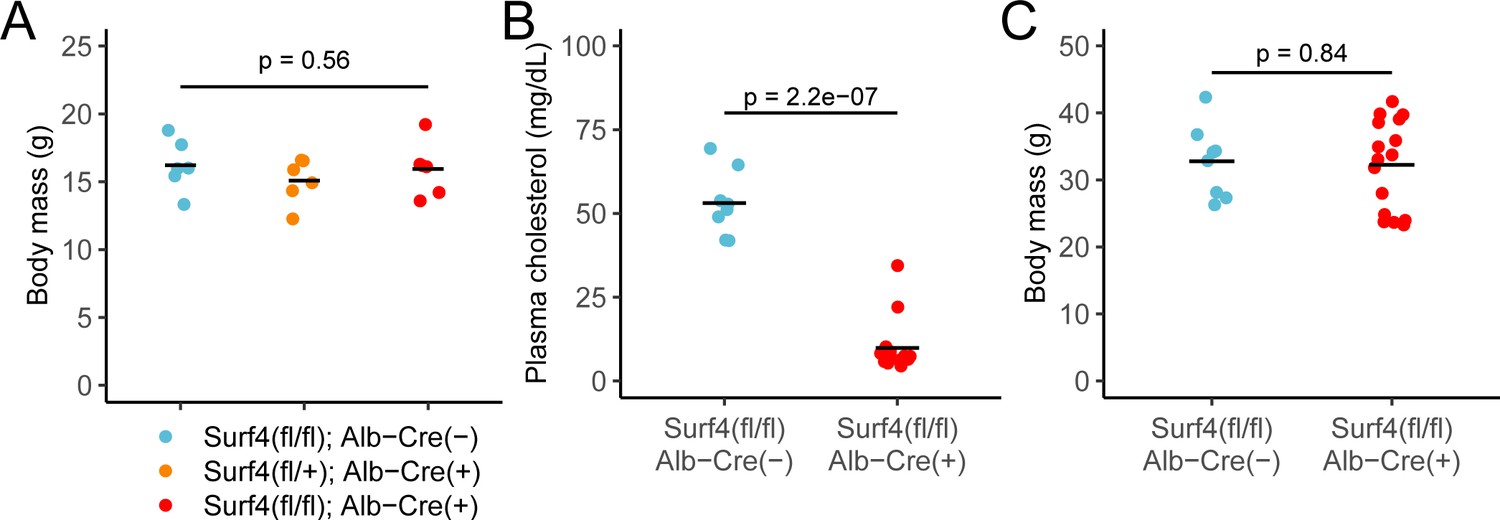
Hepatic Surf4 inactiavtion does not affect body mass while hypocholestrolemia is sustained through at least 1 year of age.
(A) Body mass of control (Surf4fl/fl Alb-Cre-), heterozygous (Surf4fl/+ Alb-Cre+), and homozygous (Surf4fl/fl Alb-Cre+) mice at 2 months of age (n=6 per genotype). p-value was obtained by a one-way ANOVA test. (B–C) Serum cholesterol and body mass of 1-year-old control (n=8) and Surf4fl/fl Alb-Cre+ mice. p-values were obtained from a two-sided Student’s t-test. For all panels: crossbars represent the mean.
Figure 3
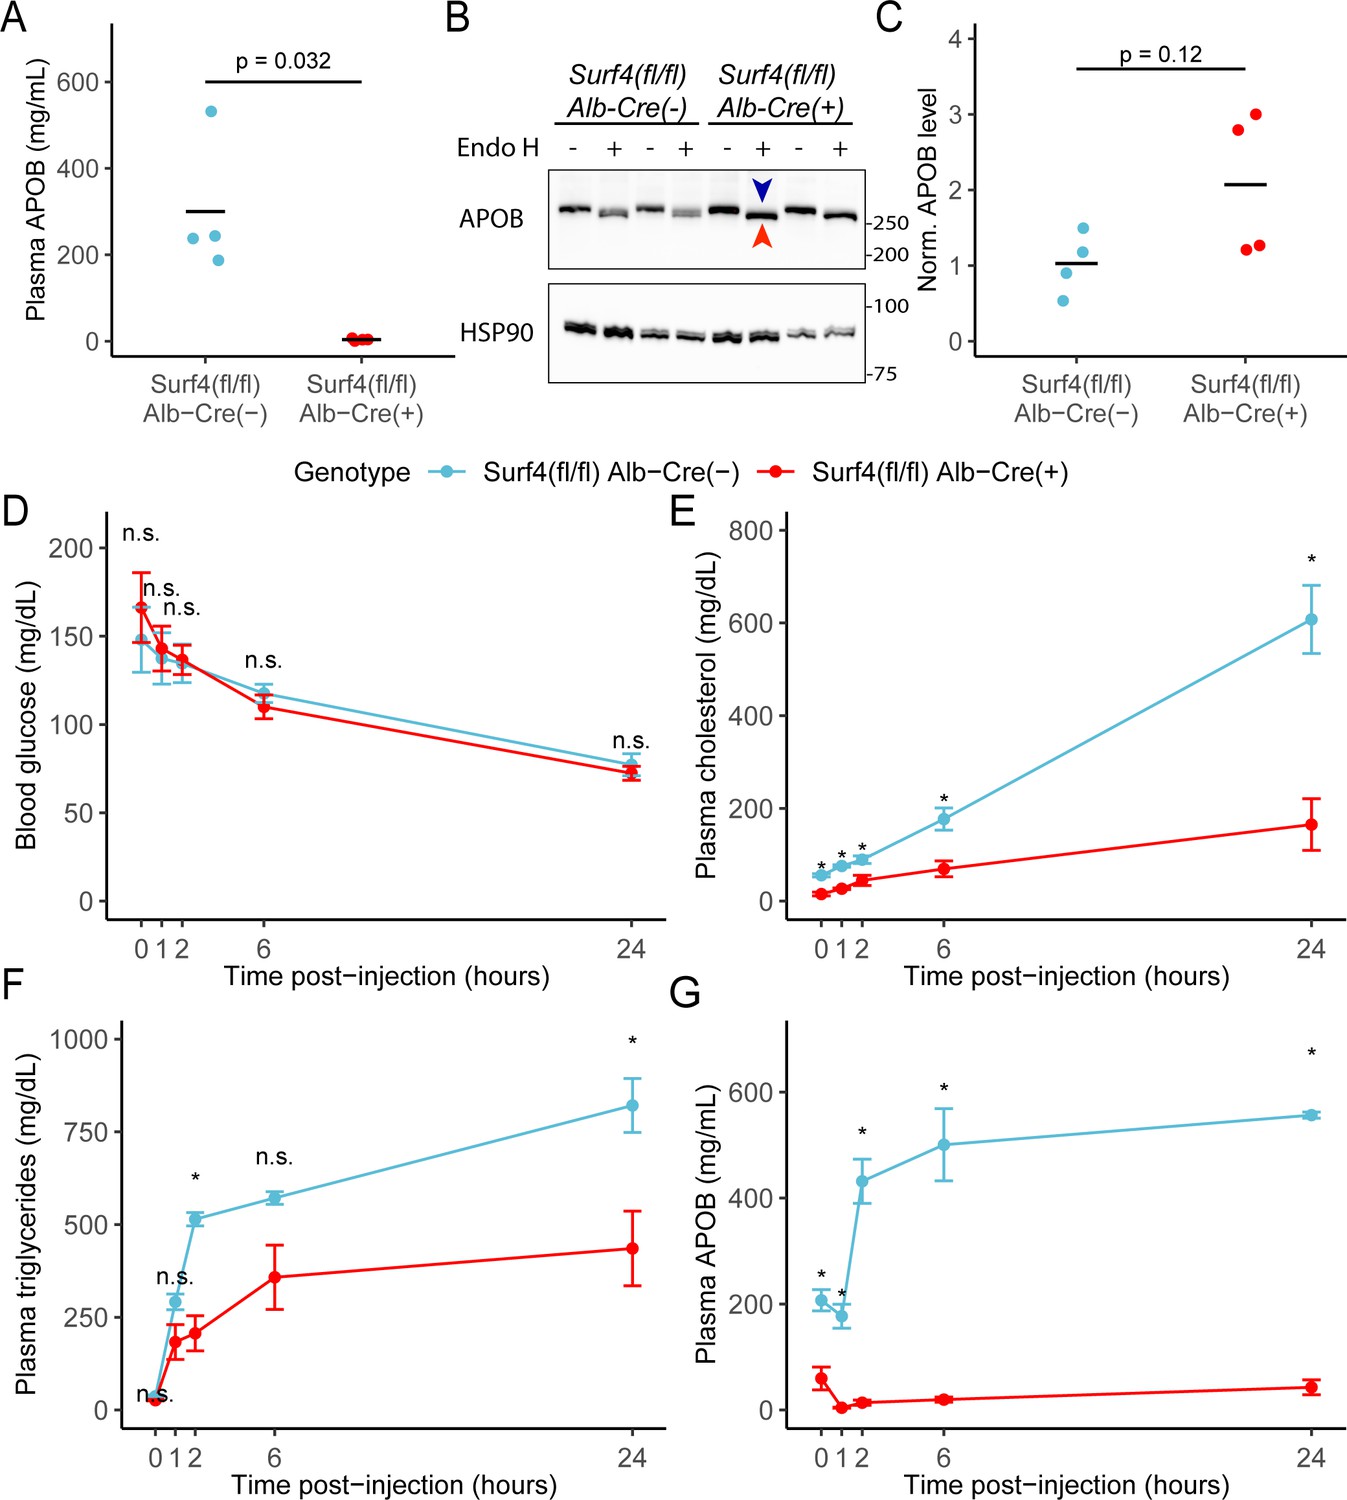
Hepatic lipoprotein and APOB secretion defect in Surf4fl/fl Alb-Cre+ mice.
(A) Steady-state serum APOB levels in control and Surf4fl/fl Alb-Cre+ mice at 2 months of age (n=4 per genotype). (B) Representative immunoblot for APOB and HSP90 in liver lysates with and without endoglycosidase H (endo H) treatment. Proteins in the pre-Golgi compartments are expected to be sensitive to endo H cleavage, resulting in an electrophoretic shift on an immunoblot. Blue arrowhead indicates the endo H resistant band whereas the red arrowhead indicates the endo H sensitive band. Molecular weight markers notated are in kDa. Accumulation of endo H sensitive APOB in the absence of SURF4 suggests accumulation in the ER (Figure 3—source data 1). (C) Quantification of APOB abundance in control and Surf4fl/fl Alb-Cre+ liver lysates, without endo H treatment (n=4 per genotype). For panel A and C, crossbars represent the mean, with statistical significance determined by two-sided Student’s t-test. (D–G) Surf4fl/fl Alb-Cre+ and littermate control mice were injected with a lipoprotein lipase inhibitor to block triglyceride hydrolysis. Blood was sampled prior to and following injection over 24 hr and assayed for (D) glucose, (E) cholesterol, (F) triglycerides, and (G) APOB levels. Data are presented as mean ± SEM for each time point (n=5 per genotype). Asterisks denote p<0.05 obtained from two-sided Student’s t-test with Benjamini-Hochberg adjustment for multiple hypothesis testing, n.s., not significant.
-
Figure 3—source data 1
Uncropped and unedited blots shown in Figure 3.
- https://cdn.elifesciences.org/articles/82269/elife-82269-fig3-data1-v2.zip
Figure 4
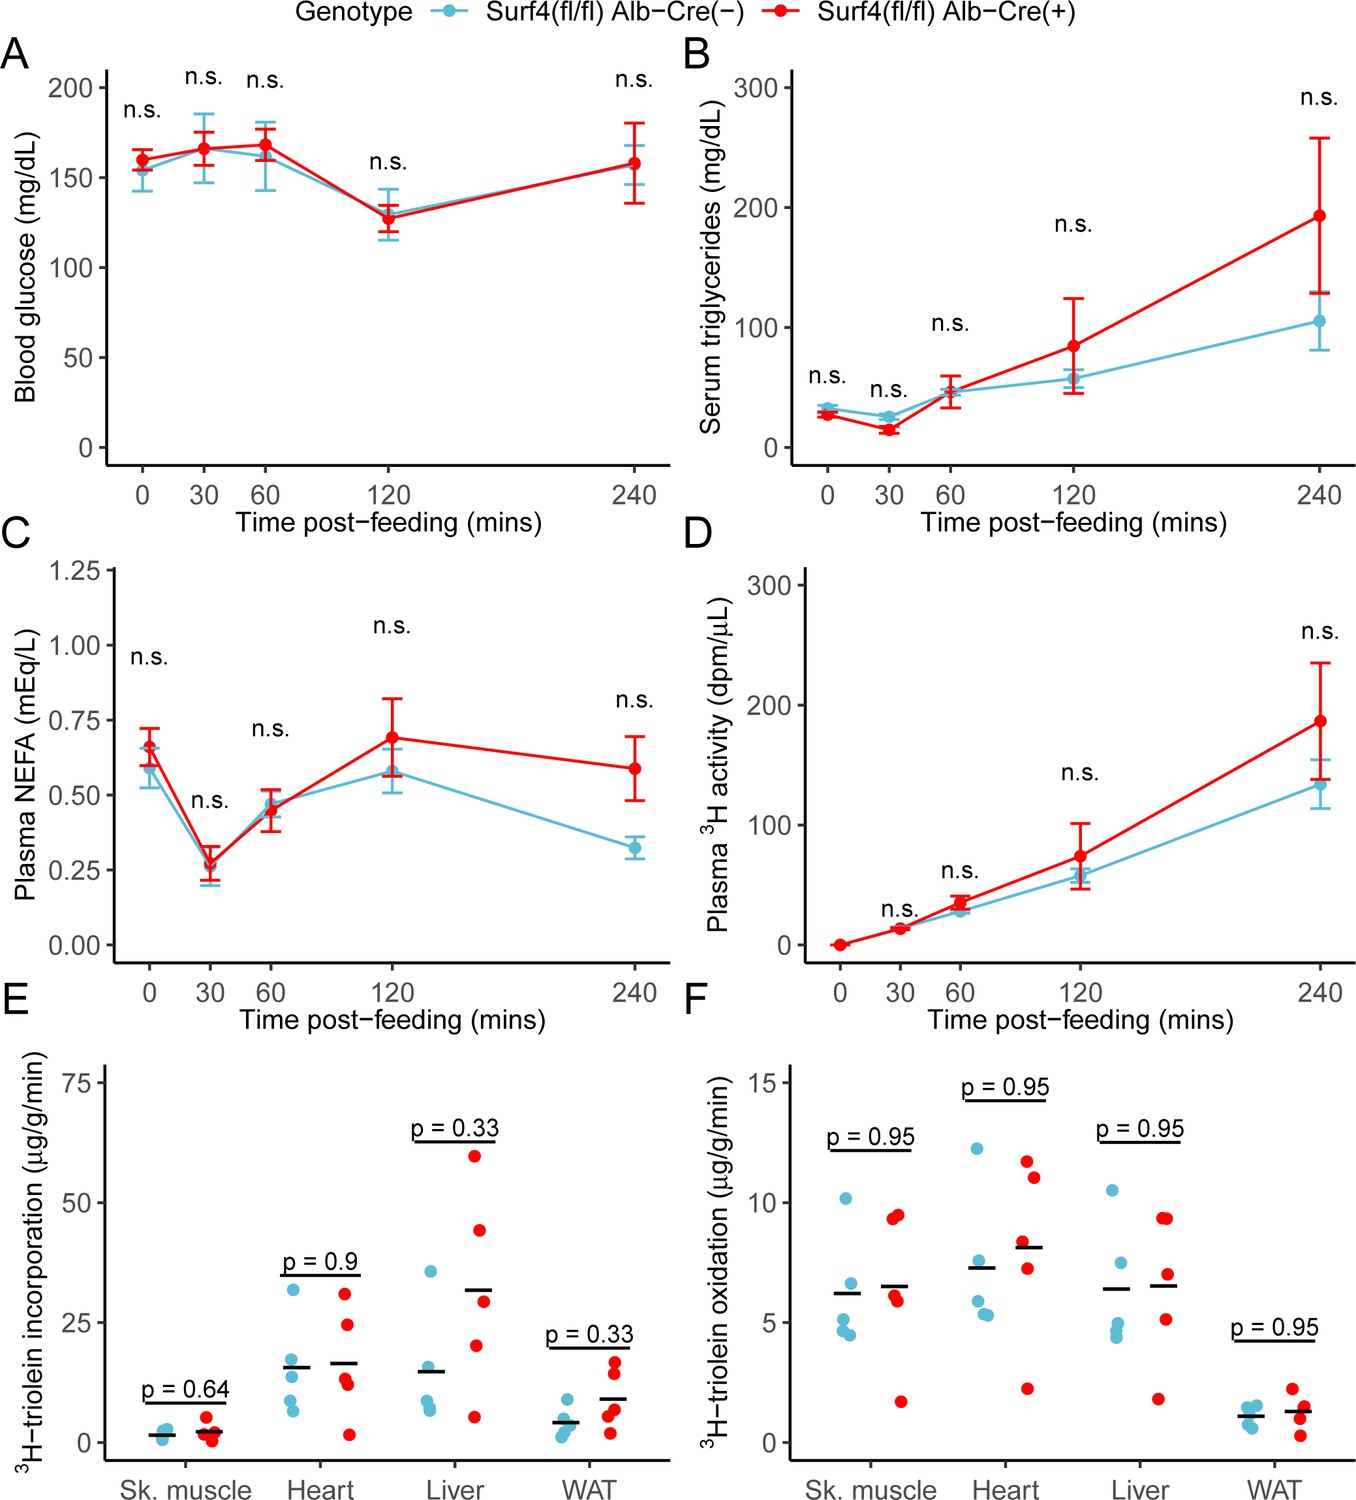
Inactivation of hepatic Surf4 does not impact dietary lipid absorption, incorporation, and oxidation.
Mice were administered 3H-labelled triolein by oral gavage. Blood samples were collected over 4 hr and assayed for (A) glucose, (B) triglycerides, (C) non-esterified fatty acids (NEFA), and (D) 3H radioactivity. Data are presented as mean ± SEM for each time point (n=5 per genotype), n.s., not significant. (E–F) Tissues were collected at the 4 hr time point and lipids were extracted by the Folch’s method. 3H radioactivity was measured in the hydrophobic phase, which represents incorporated triolein (E) and hydrophilic phase, which represents oxidized triolein (F) (n=5 per genotype). All crossbars represent the mean. The denoted p-values were obtained by two-sided Student’s t-test with Benjamini-Hochberg adjustment for multiple hypothesis testing.
Figure 5 with 1 supplement
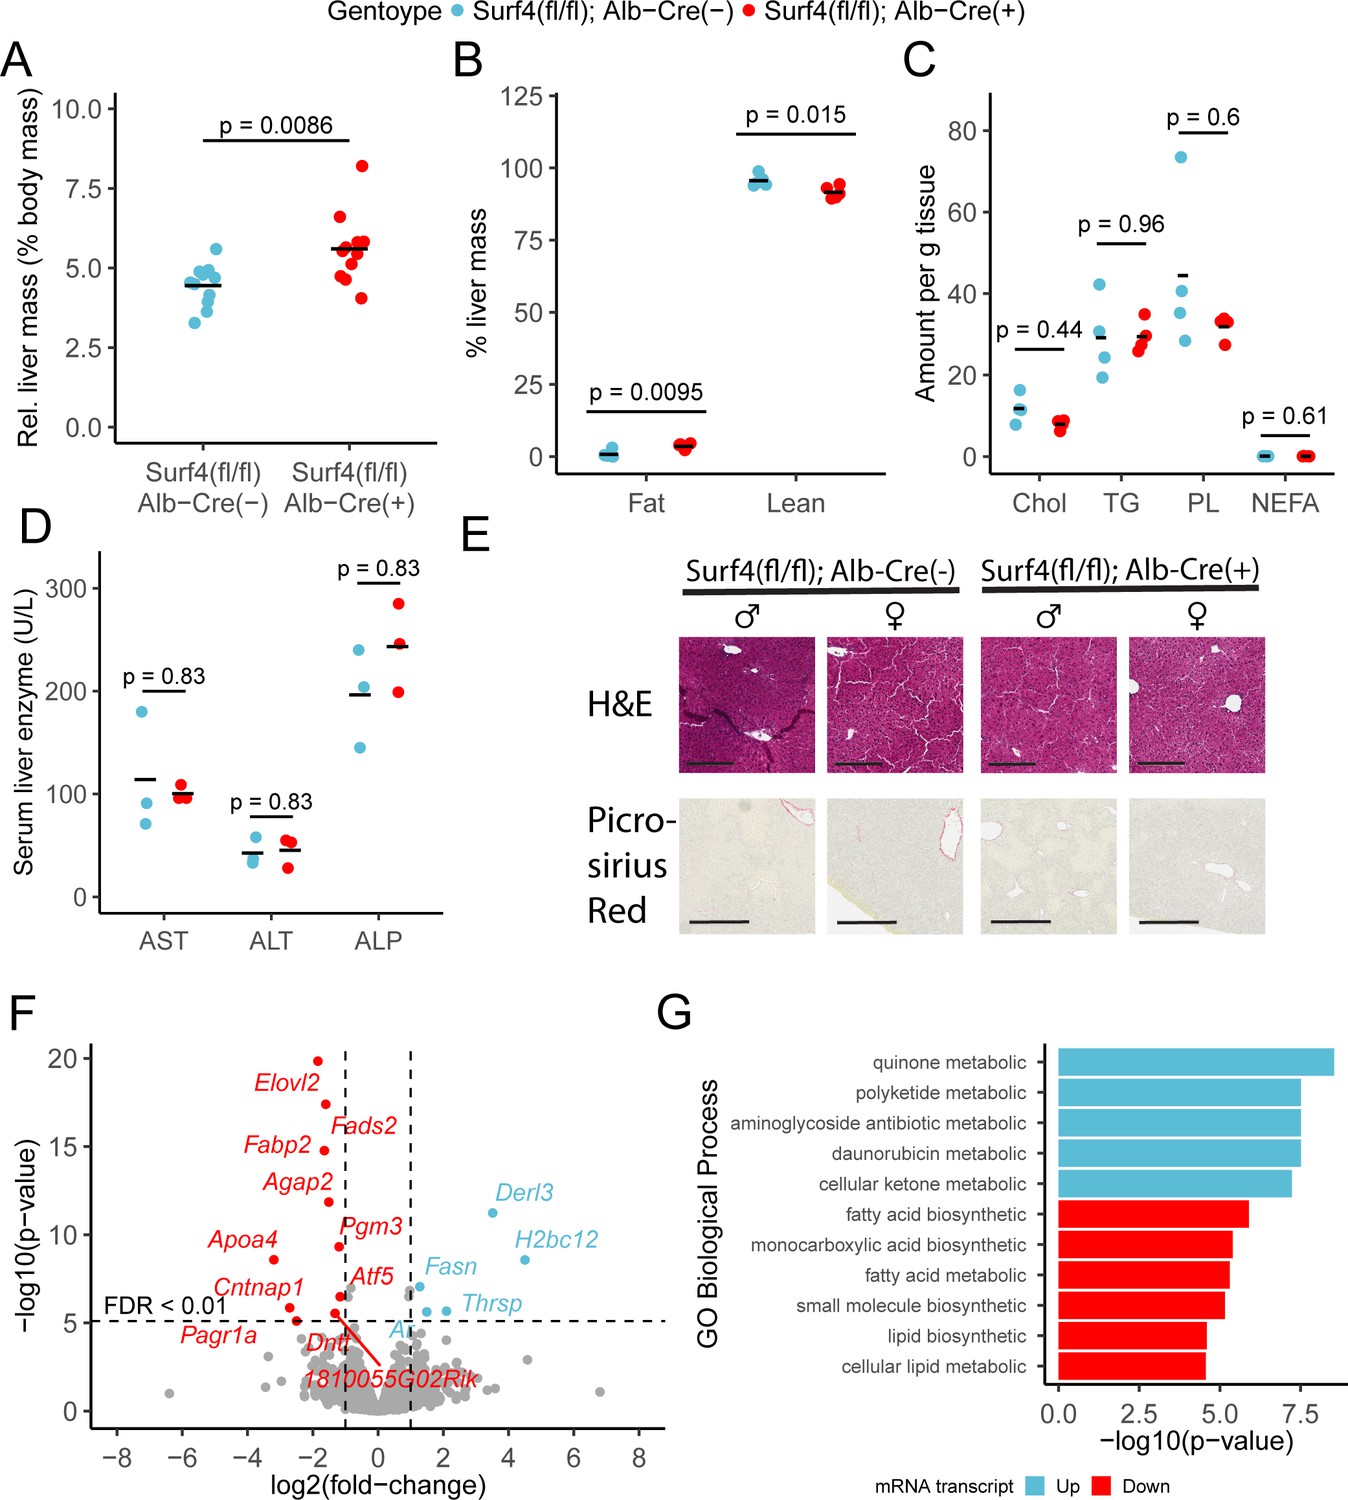
Hepatic Surf4 deletion results in mild hepatomegaly and an increase in liver lipid content, without apparent liver dysfunction or steatohepatitis.
(A) Relative liver mass in control and Surf4fl/fl Alb-Cre+ mice presented as percentage of total body mass (n=11 per genotype). (B) Relative fat and lean mass in the livers of control and Surf4fl/fl Alb-Cre+ mice measured by EchoMRI and presented as percentage of liver mass (n=5 per group). (C) Levels of cholesterol (Chol, mg/g tissue), triglycerides (TG, mg/g tissue), phospholipids (PL, mg/g tissue), and nonesterified fatty acid (NEFA, mEq/g tissue) in lipids extracted from the livers (n=4 per genotype). (D) Serum levels of asparate aminotransferase (AST), alanine transaminase (ALT), and alkaline phosphatase (ALP) (n=4 per genotype). (E) Hematoxylin and eosin (H&E) and picrosirius red stained liver sections from control and Surf4fl/fl Alb-Cre+ mice (n=4 per genotype). Scale bars represent 200 µm in H&E images and 300 µm in picrosirius red images. (F) Changes in mRNA transcript levels in Surf4fl/fl Alb-Cre+ mice compared to littermate controls (n=3 per genotype). Horizontal line represents the p-value above which the false discovery rate (FDR) is less than 0.01. Significantly up (blue) or down (red) regulated transcripts are labelled. (G) Significantly overrepresented Gene Ontology (GO) terms for biological processes in up and downregulated gene lists. For panels A-D: All crossbars represent the mean. p-values were obtained by two-sided Student’s t-test with Benjamini-Hochberg adjustment for multiple hypothesis testing where appropriate.
Figure 5—figure supplement 1
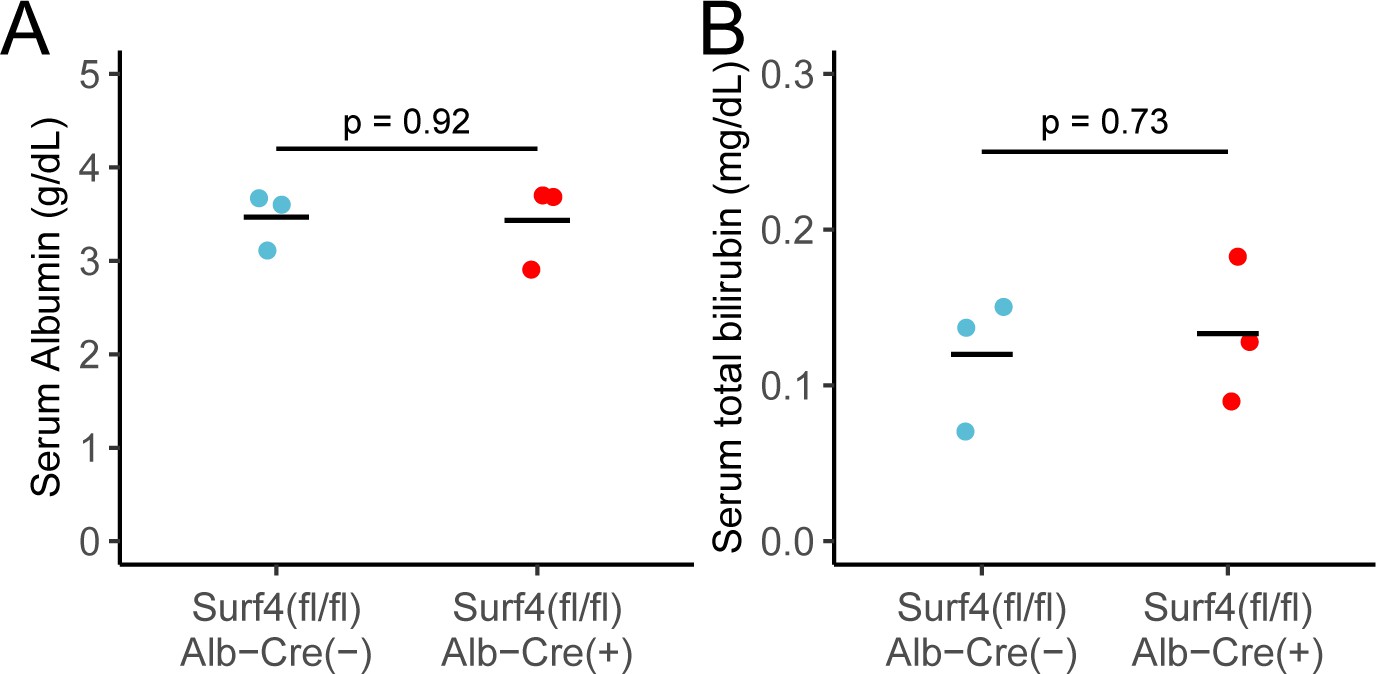
Serum (A) albumin and (B) bilirubin levels in Surf4fl/fl Alb-Cre- and Surf4fl/fl Alb-Cre+ mice.
Crossbars represent the mean. p-values were obtained from two-sided Student’s t-test.
Figure 6 with 1 supplement
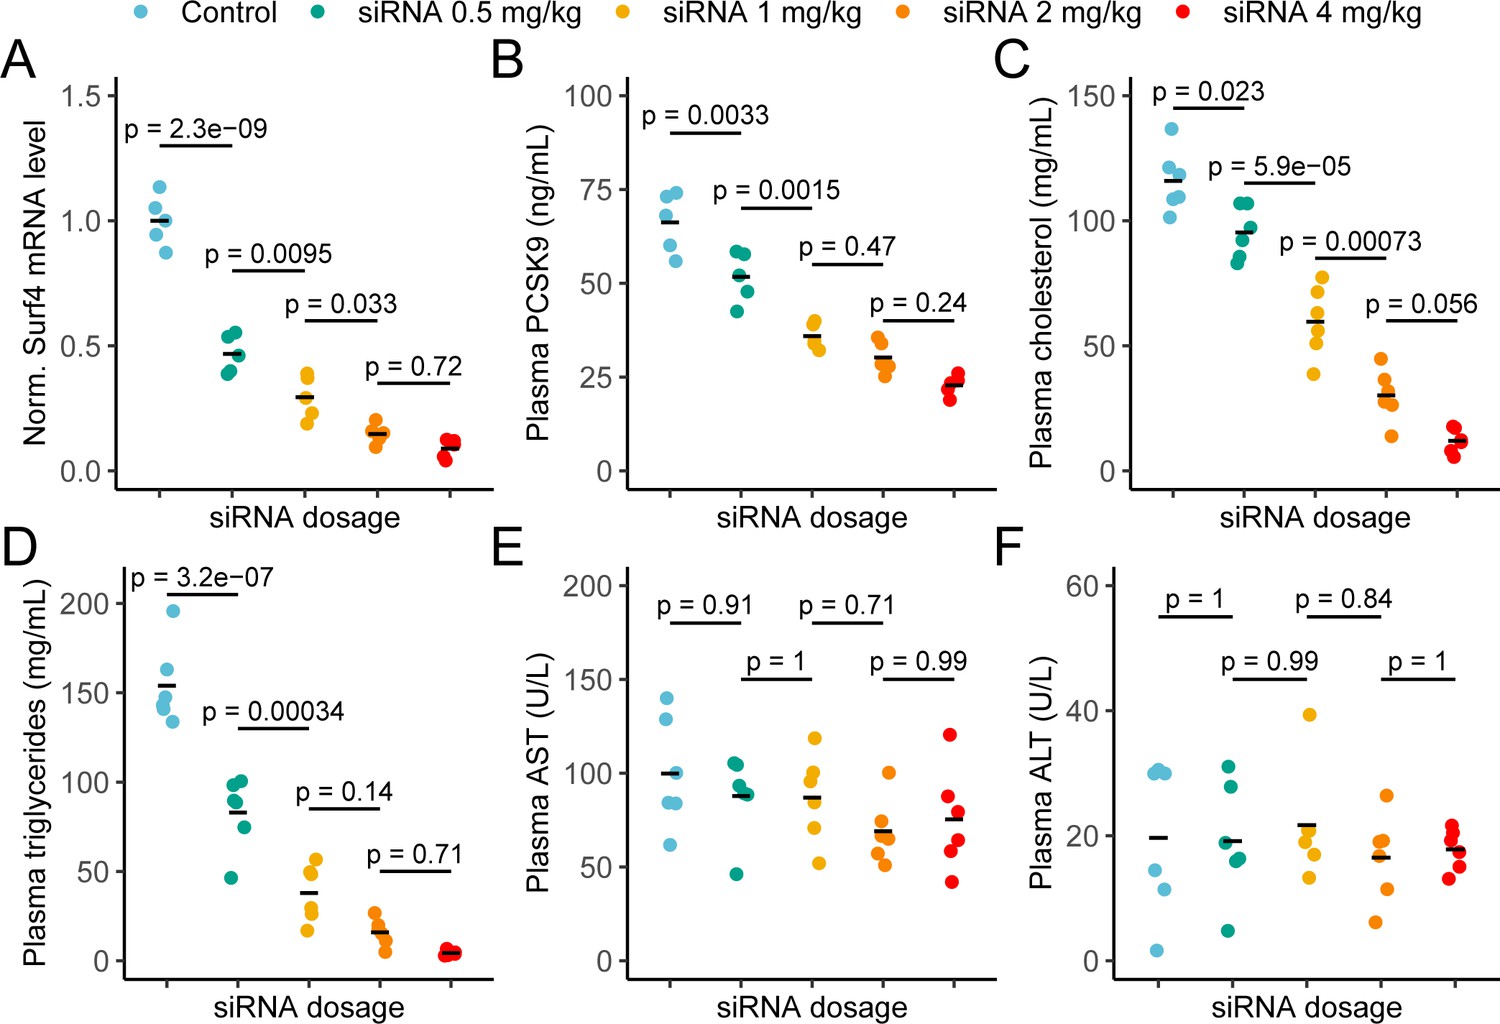
Depletion of hepatic Surf4 by siRNA recapitulates the hypolipidemia seen in Surf4fl/fl Alb-Cre+ mice.
(A) Normalized (Norm.) liver Surf4 mRNA levels in mice treated with scrambled siRNA (control) or varying concentrations of Surf4 targeting siRNA (n=5 per group). (B–D) Plasma PCSK9, cholesterol, and triglyceride levels in control and siRNA treated mice. (E–F) Plasma levels of asparate aminotransferase (AST) and alanine transaminase (ALT) in mice treated with control or increasing doses of Surf4 targeting siRNA. Statistical significance was computed by one-way ANOVA test followed by Tukey’s post hoc test.
Figure 6—figure supplement 1
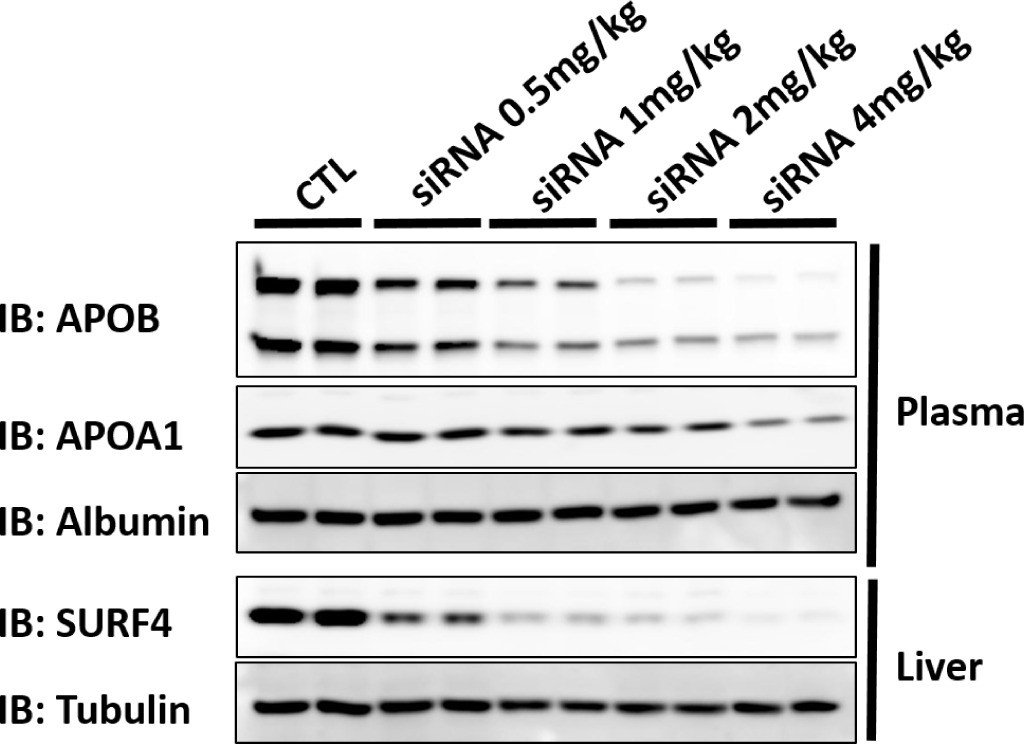
Immunoblots of plasma and liver lysates collected from mice treated with control or increasing doses of Surf4 targeting siRNA (Figure 6—figure supplement 1—source data 1).
-
Figure 6—figure supplement 1—source data 1
Uncropped and unedited blots shown in Figure 6—figure supplement 1.
- https://cdn.elifesciences.org/articles/82269/elife-82269-fig6-figsupp1-data1-v2.zip
Tables
Table 1
Genotype distribution of offspring of Surf4fl/fl Alb-Cre+and Surf4fl/+ Alb-Cre- intercrosses.
| Genotype(Expected) | Surf4fl/+ Alb-Cre-(25%) | Surf4fl/+ Alb-Cre+(25%) | Surf4fl/fl Alb-Cre-(25%) | Surf4fl/fl Alb-Cre+(25%) | p (χ2) |
|---|---|---|---|---|---|
| Mating | ♂ Surf4fl/fl Alb-Cre- X ♀ Surf4fl/+ Alb-Cre+ | ||||
| 61 (25.8%) | 71 (30.1%) | 60 (25.4%) | 44 (18.6%) | 0.096 | |
| Mating | ♂ Surf4fl/+ Alb Cre - X ♀ Surf4fl/fl Alb-Cre+ | ||||
| 8 (18.6%) | 9 (20.9%) | 12 (27.9%) | 14 (32.6%) | 0.549 | |
Key resources table
| Reagent type (species) or resource | Designation | Source or reference | Identifiers | Additional information |
|---|---|---|---|---|
| Strain, strain background (M. musculus) | Surf4fl mice (C57BL/6 J) | Wang et al., 2021b | ||
| Strain, strain background (M. musculus) | Albumin-Cre mice (C57BL/6 J) | Adams et al., 2014 | JAX 003574 | |
| Strain, strain background (M. musculus) | Surf4fl/fl Alb-Cre+ mice (C57BL/6 J) | This paper | ||
| Strain, strain background (M. musculus) | SpCas9 mice | Platt et al., 2014 | JAX 026556 | |
| Strain, strain background (M. musculus) | C57BL/6 J mice | Jackson lab | JAX 0006640 | |
| Genetic reagent (include species here) | AAV-Cre-sgRNA | This paper | ||
| Antibody | Anti-APOB - rabbit polyclonal | Fitzgerald Industries Internationa | 70 R-15771 | WB(1:1000) |
| Antibody | Anti-PCSK9 – rabbit polyclonal | Abcam | ab31762 | WB (1:1000) |
| Antibody | Anti-LDLR – rabbit monoclonal | Abcam | ab52818 | WB (1:1000) |
| Antibody | Anti-HSP90 – rabbit monoclonal | Cell Signaling Technology | 4877 | WB (1:1000) |
| Antibody | Anti-SURF4 – rabbit polyclonal | Wang et al., 2021b | WB (1:1000) | |
| Antibody | Anti-APOA1 – rabbit polyclonal | Fitzgerald Industries Internationa | 70 R-15769 | WB (1:1000) |
| Antibody | Anti-Albumin – mouse monoclonal | Proteintech | 66051 | WB (1:1000) |
| Antibody | Anti-Tubulin – rabbit polyclonal | Proteintech | 10094–1-AP | WB (1:1000) |
| Antibody | Anti-GAPDH – rabbit monoclonal | Abcam | ab181602 | WB (1:1000) |
| Sequence-based reagent | Primers | IDT | Sequences are listed in Supplement File 1 | |
| Sequence-based reagent | CRISPR-gRNA | IDT | Sequences are listed in Supplement File 2 | |
| Sequence-based reagent | SURF4-targeting siRNA | This paper | Sequences are listed in Supplement File 3 | |
| Commercial assay or kit | Cholesterol assay kit | SB-1010–225 | Fisher Scientific | |
| Commercial assay or kit | PCSK9 ELSIA | MPC900 | R&D Systems | |
| Commercial assay or kit | APOB ELISA | ab230932 | Abcam | |
| Commercial assay or kit | Triglycerides assay | 10010303 | Cayman Chemical | |
| Commercial assay or kit | RNeasy Plus Mini Kit | 74134 | Qiagen | |
| Commercial assay or kit | Power SYBR Green PCR Master Mix | 4367659 | Invitrogen |
Additional files
-
MDAR checklist
- https://cdn.elifesciences.org/articles/82269/elife-82269-mdarchecklist1-v2.pdf
-
Supplementary file 1
Primer sequences used in this study.
- https://cdn.elifesciences.org/articles/82269/elife-82269-supp1-v2.docx
-
Supplementary file 2
Guide RNA (gRNA) sequence used for AAV-CRISPR mediated hepatic Surf4 inactivation.
- https://cdn.elifesciences.org/articles/82269/elife-82269-supp2-v2.docx
-
Supplementary file 3
siRNA sequences used to target hepatic Surf4 in this study.
- https://cdn.elifesciences.org/articles/82269/elife-82269-supp3-v2.docx
-
Supplementary file 4
DESeq2 output for differential gene expression analysis of RNA-seq data.
- https://cdn.elifesciences.org/articles/82269/elife-82269-supp4-v2.csv
Download links
A two-part list of links to download the article, or parts of the article, in various formats.
Downloads (link to download the article as PDF)
Open citations (links to open the citations from this article in various online reference manager services)
Cite this article (links to download the citations from this article in formats compatible with various reference manager tools)
Hepatic inactivation of murine Surf4 results in marked reduction in plasma cholesterol
eLife 11:e82269.
https://doi.org/10.7554/eLife.82269


