The impact of local genomic properties on the evolutionary fate of genes
- Research Center for Genome & Medical Sciences, Tokyo Metropolitan Institute of Medical Science, Japan
- Molecular Life History Laboratory, Department of Genomics and Evolutionary Biology, National Institute of Genetics, Japan
- Department of Genetics, Sokendai (Graduate University for Advanced Studies), Japan
- RIKEN Center for Biosystems Dynamics Research, Japan
Figures
Figure 1
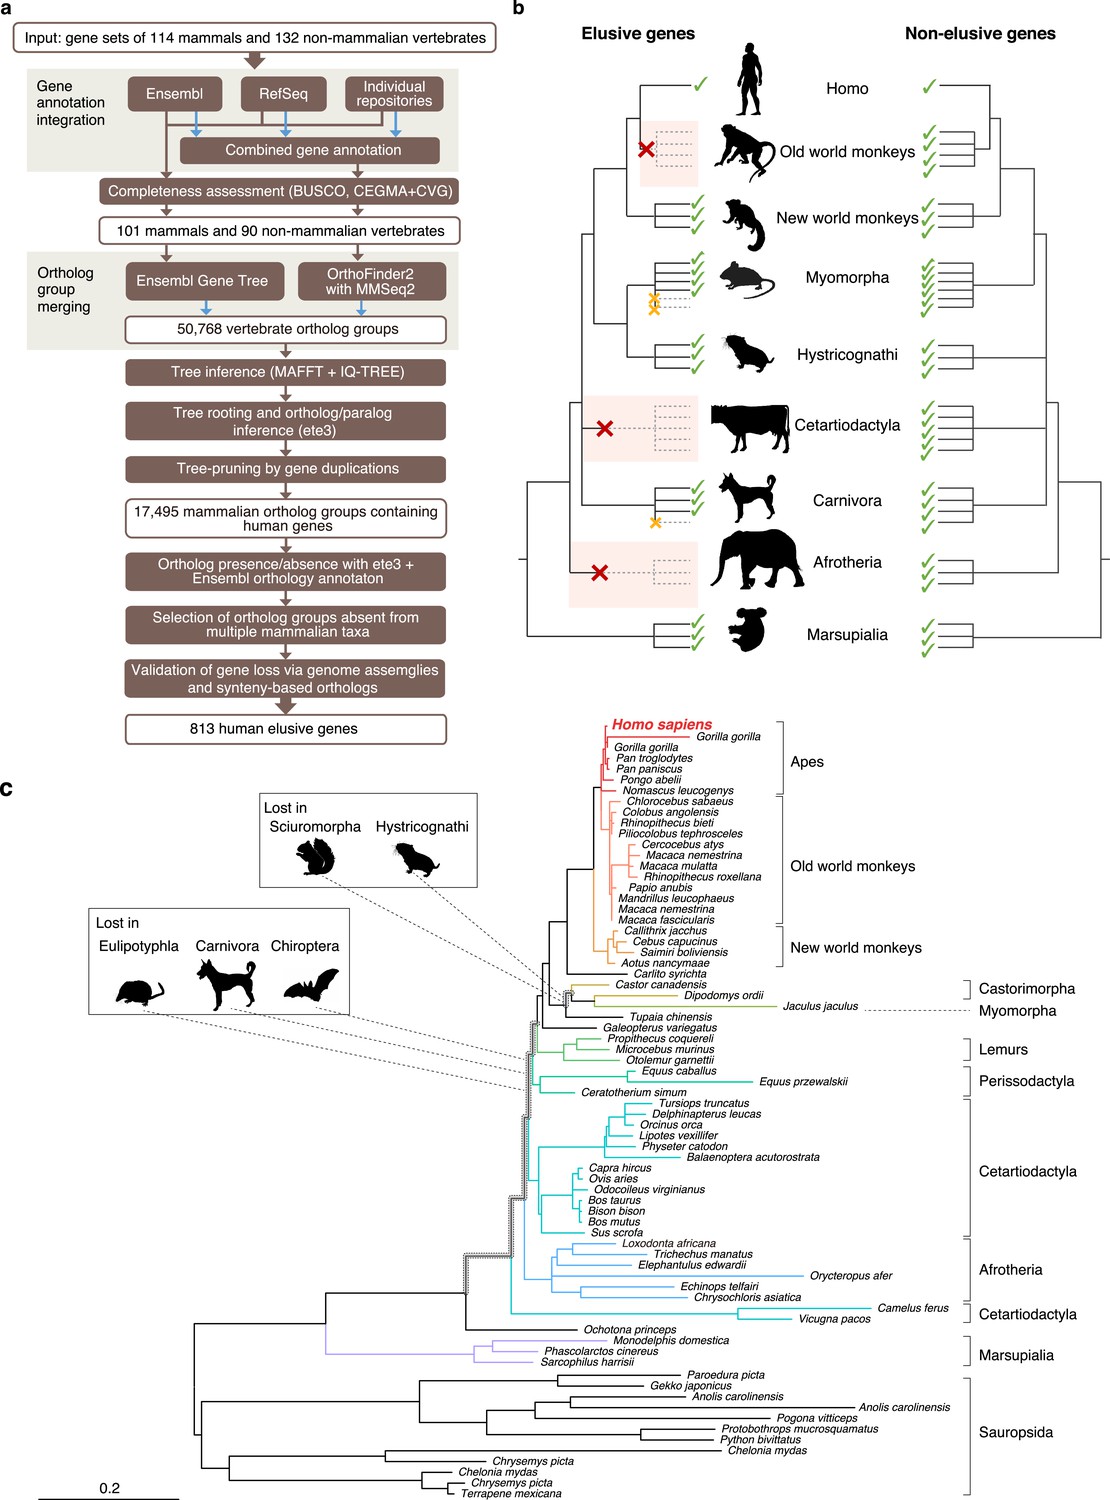
Detection of ‘elusive’ genes.
(a) Pipeline of ortholog group clustering and gene loss detection. (b) Definition of an elusive gene schematized with ortholog presence/absence pattern referring to a taxonomic hierarchy. Red and orange crosses denote the gene loss in the common ancestor of a taxon and the loss specific to a single species, respectively. (c) A representative phylogeny of the elusive gene encoding Chitinase 3-like 2 (CHI3L2). Taxa shown in the tree were used to investigate the presence or absence of orthologs. The Sciuromorpha, Hystricognathi, Eulipotyphla, Carnivora, and Chiroptera are absent from the tree, indicating that the CHI3L2 orthologs were lost somewhere along the branches framed in gray in the tree. In addition, the orthologs of many members of the Myomorpha were not found, suggesting that gene loss occurred in this lineage.
Figure 2 with 1 supplement
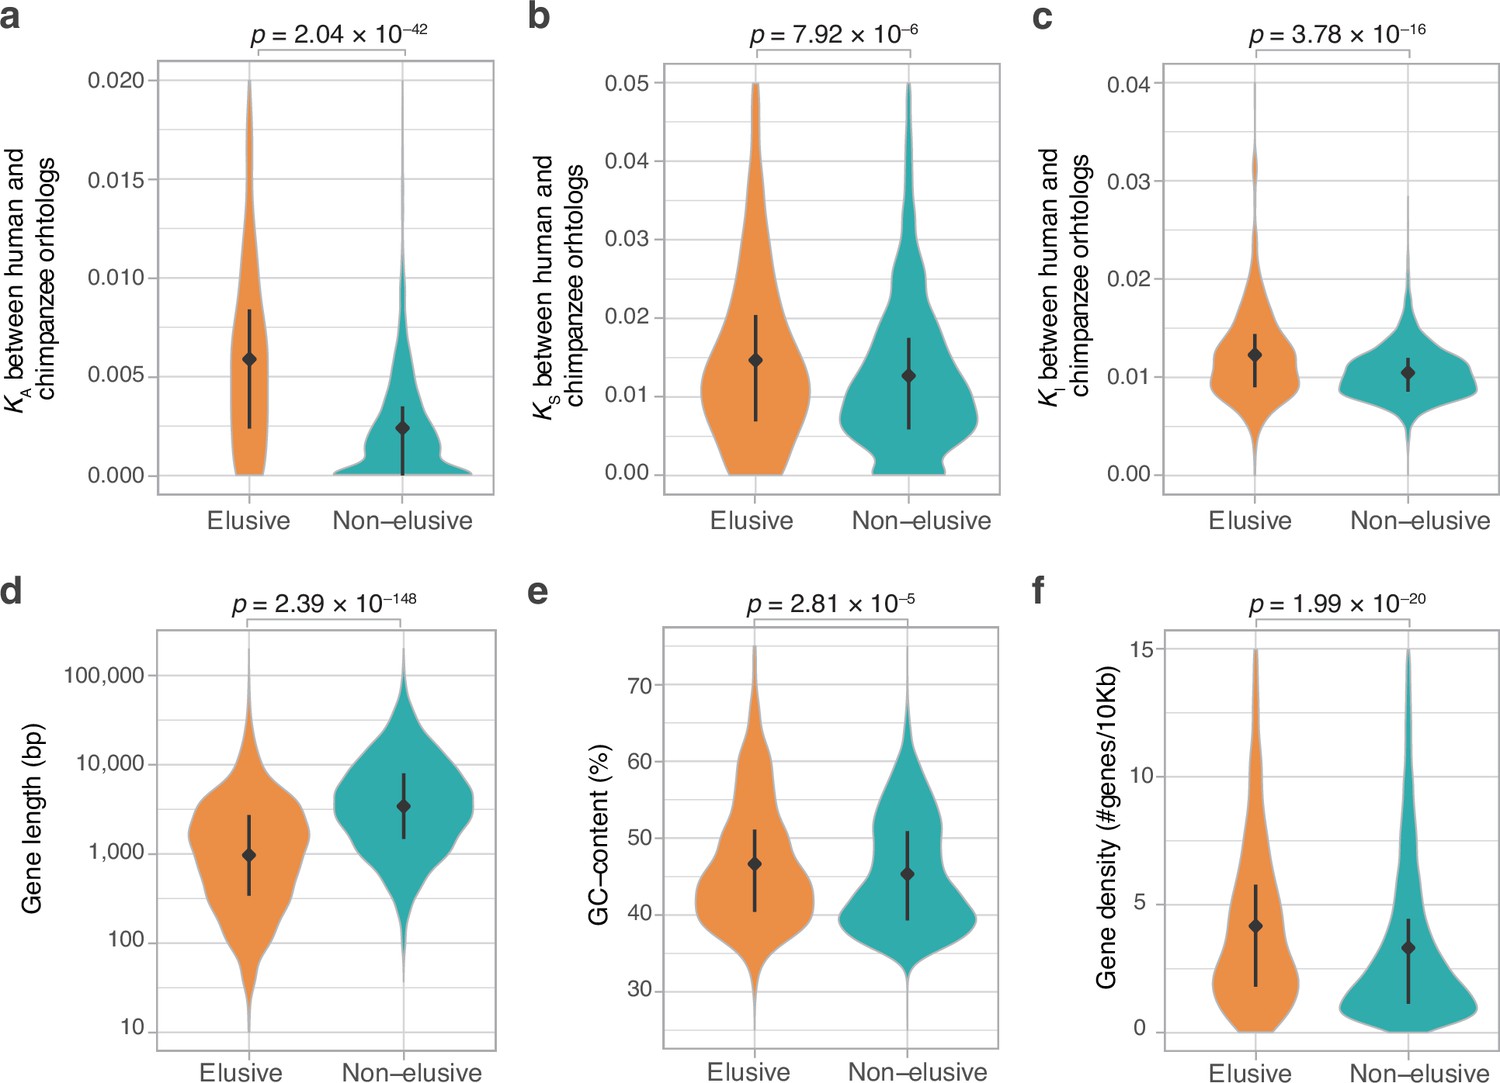
Genomic and evolutionary characteristics of elusive genes.
Distributions of non-synonymous, synonymous, and intronic nucleotide substitution rates, namely KA (a), KS (b), and KI (c) values, respectively, between the human–chimpanzee orthologs of the elusive and non-elusive genes. Distribution of gene length (d) and GC content (e) of the human elusive and non-elusive genes. (f) Distribution of gene density in the genomic regions where the human elusive and non-elusive genes are located. The plots consist of 249 elusive and 5145 non-elusive genes that retained chimpanzee orthologs (a, b), 473 and 4626 of those which harbored introns aligned with the chimpanzee genome (c; see ‘Materials and methods’), and all of the 813 elusive and 8050 non-elusive genes (d–f). Diamonds and bars within violin plots indicate the median and range from the 25th to 75th percentile, respectively.
Figure 2—figure supplement 1
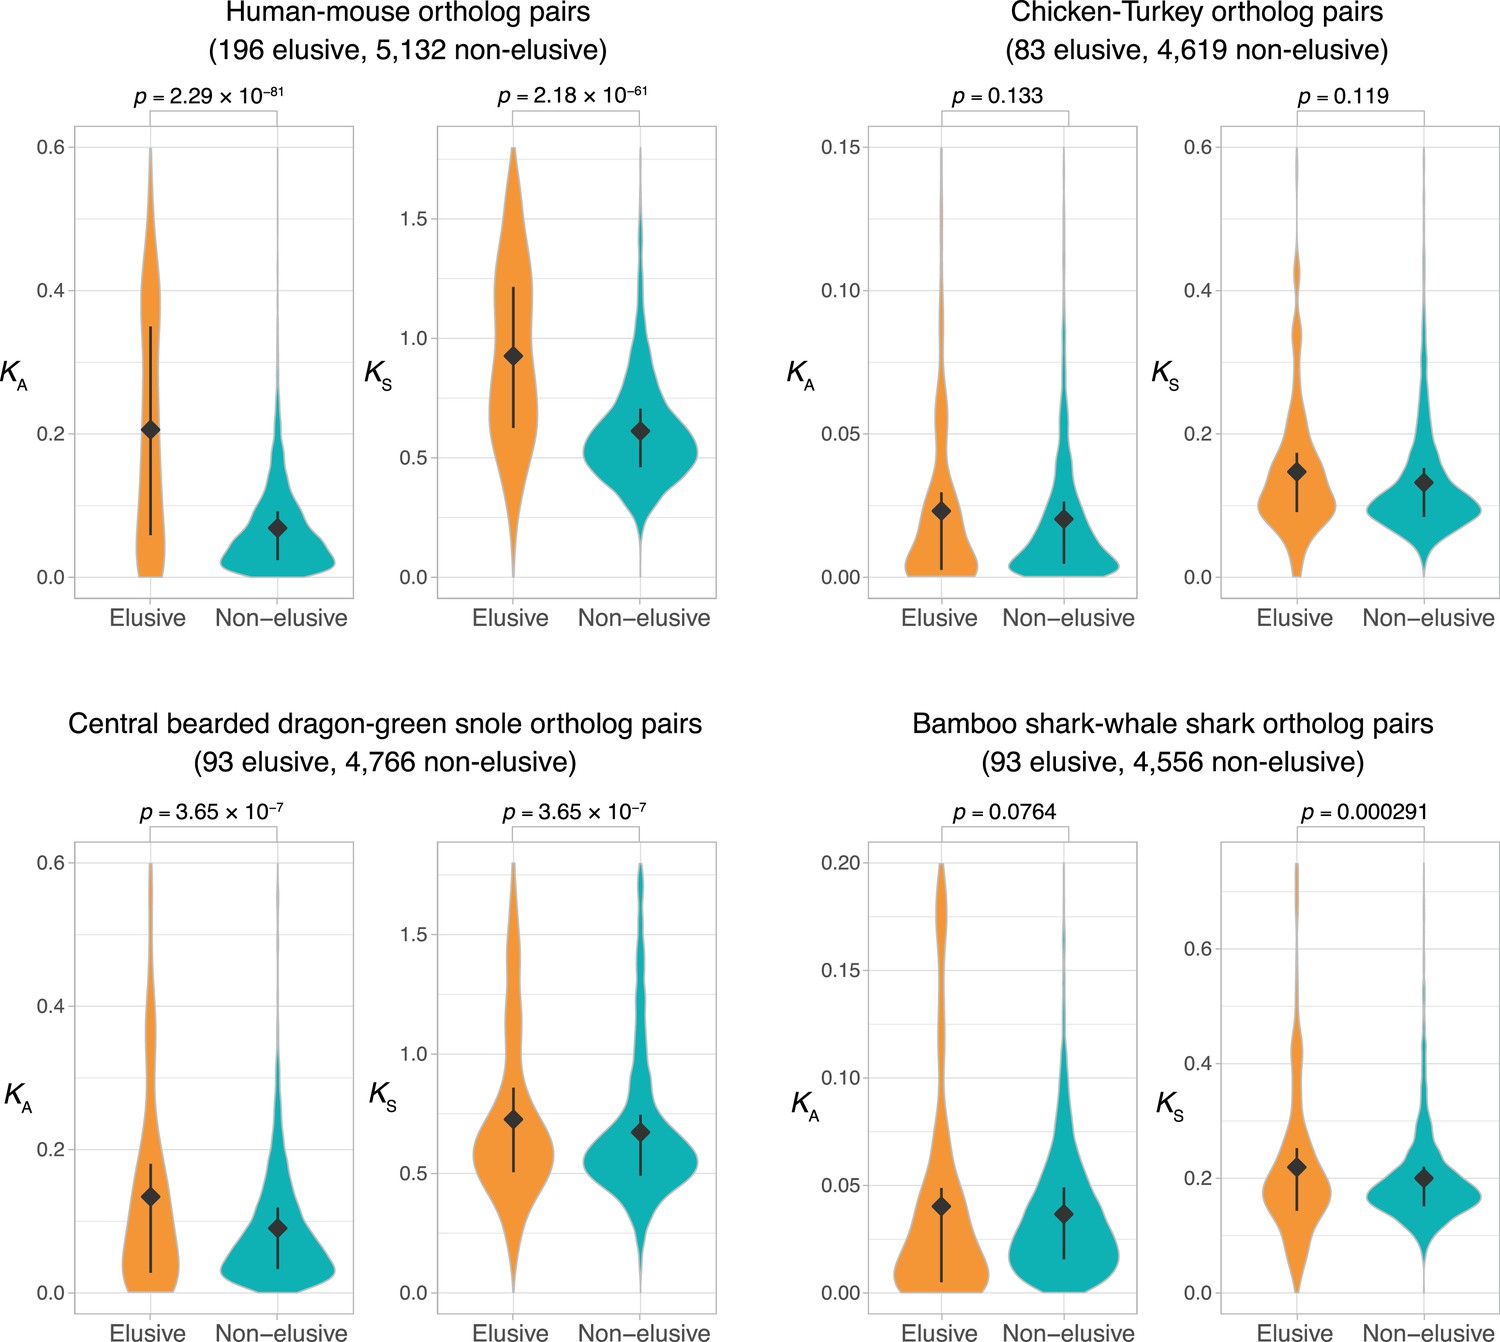
Comparison of KA and KS values between orthologs of the elusive and non-elusive genes.
Distributions of KA and KS values between the orthologs of human elusive and non-elusive genes of closely related vertebrates. Correction for multiple testing was performed for comparison in each species pair. Diamonds and bars within violin plots indicate the median and range from 25th to 75th percentile, respectively.
Figure 3 with 2 supplements
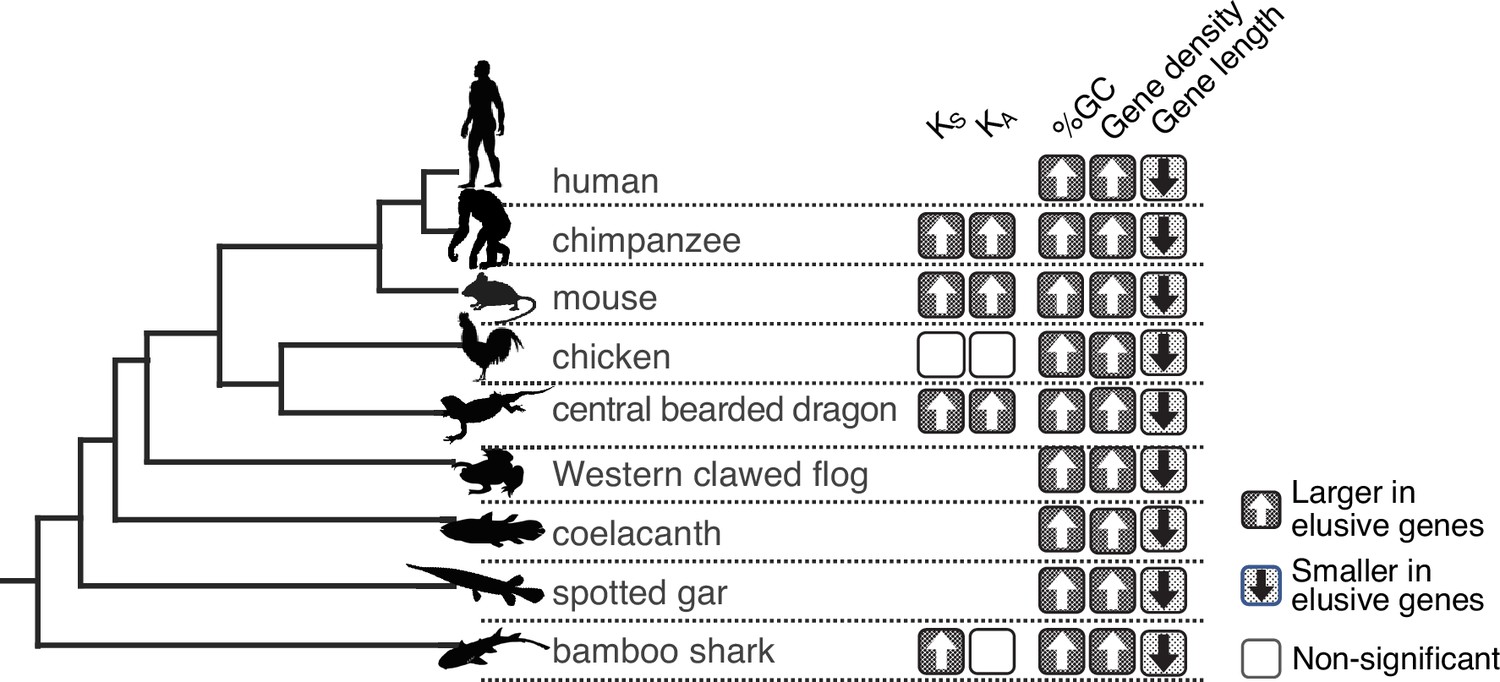
Long-standing characteristics of elusive genes.
Retention of the genomic and evolutionary characteristics of the human elusive genes across vertebrates. The individual round squares with arrows indicate significant increases or decreases of the distribution of particular characteristics in the orthologs of the human elusive genes and their flanking regions compared with those of the non-elusive genes in these selected vertebrate genomes. For the chimpanzee and mouse genomes, KA and KS values were computed between the human elusive genes and the orthologs of these mammals. For non-mammalian species, these values were computed with ortholog pairs for the elusive/non-elusive genes between the corresponding species and their closely related species: turkey for chicken, green anole for central bearded dragon, and whale shark for bamboo shark. Distributions of these metrics for non-human species are shown in Figure 2—figure supplement 1 and Figure 3—figure supplement 2. Species name: mouse, Mus musculus; chicken, Gallus gallus; central bearded dragon, Pogona vitticeps; Western clawed frog, Xenopus tropicalis; coelacanth, Latimeria chalumnae; spotted gar, Lepisosteus oculatus; bamboo shark, Chiloscyllium plagiosum.
Figure 3—figure supplement 1
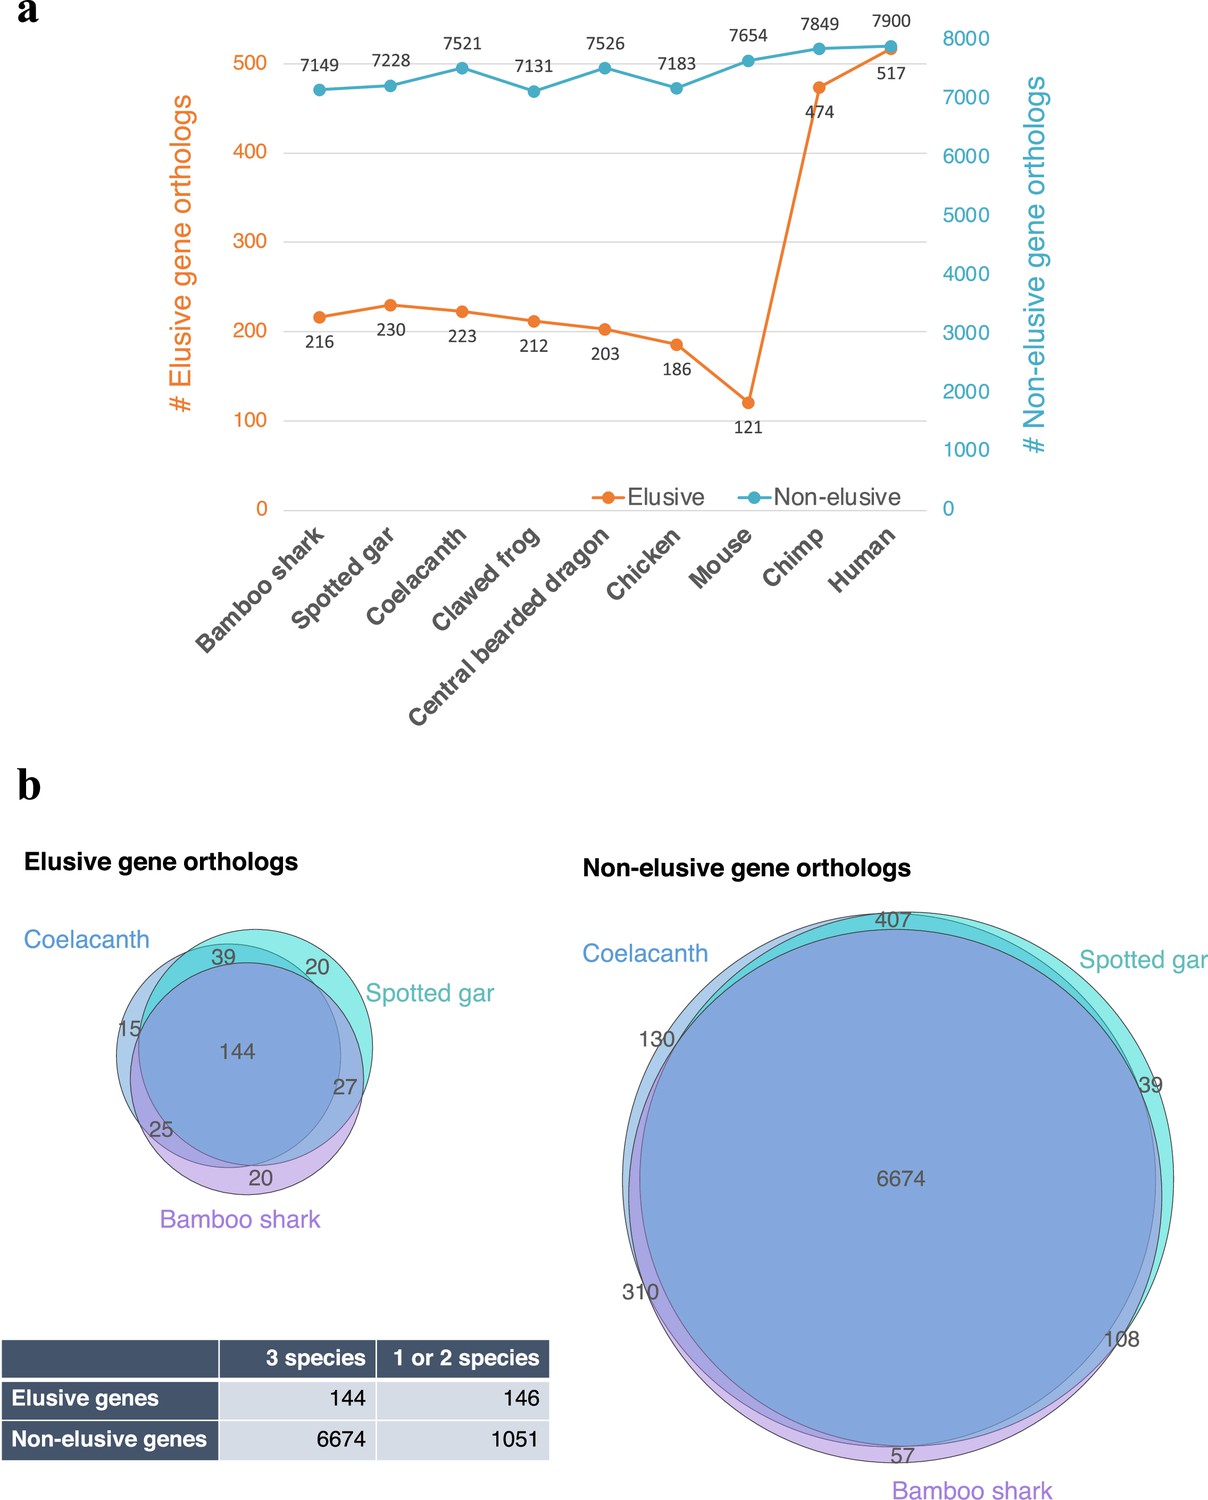
Asymmetric ortholog retention across the vertebrates.
(a) Number of retained orthologs of the human elusive and non-elusive genes that originated in the common ancestors of the gnathostomes or older age. (b) Intersections of the retained orthologs across three vertebrates distantly related to modern humans (b). The p-value of the 2×2 contingency table given by Fisher’s exact test is 9.70×10–48.
-
Figure 3—figure supplement 1—source data 1
A 2×2 contingency table in Figure 3—figure supplement 1.
- https://cdn.elifesciences.org/articles/82290/elife-82290-fig3-figsupp1-data1-v1.xlsx
Figure 3—figure supplement 2
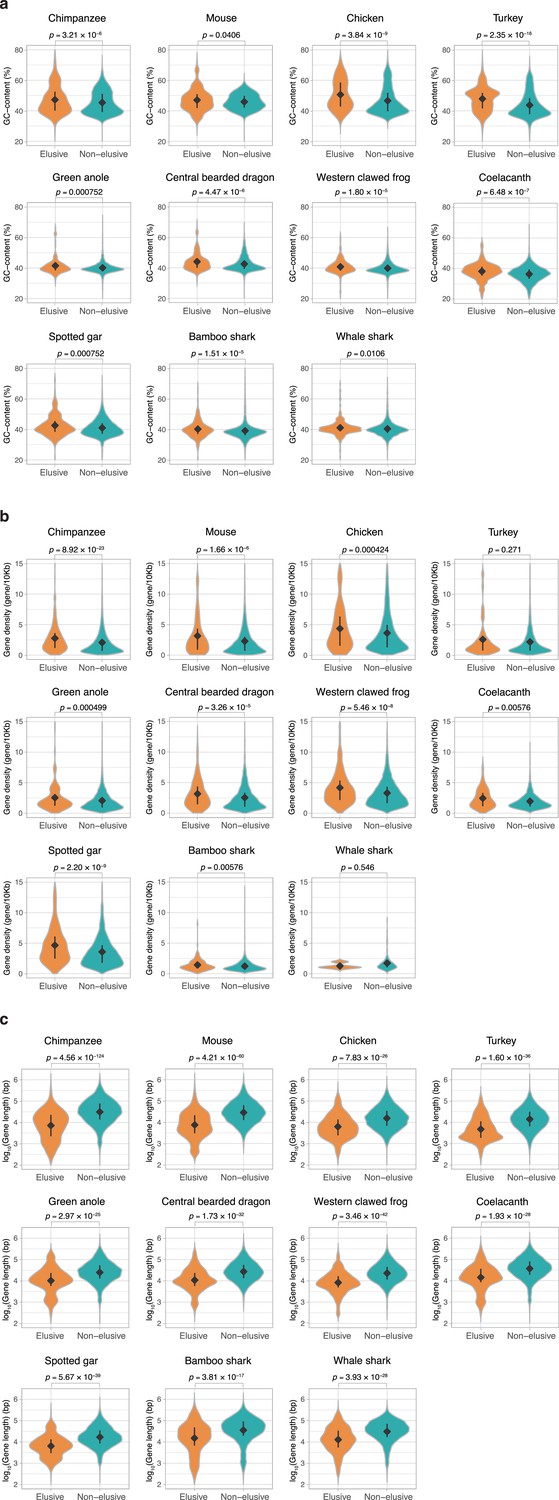
Genomic characteristics of the orthologs of elusive and non-elusive genes.
Distribution of (a) gene length and (b) GC content of the orthologs of the human elusive and non-elusive genes and (c) distribution of the gene density of the genomic regions where the orthologs of the human elusive and non-elusive genes are located. For the individual genomic characteristics, correction for multiple testing was performed for comparison in each species. Numbers of the orthologs of the elusive and non-elusive genes re indicated in Figure 3—figure supplement 1. Diamonds and bars within violin plots indicate the median and range from the 25th to 75th percentile, respectively.
Figure 4
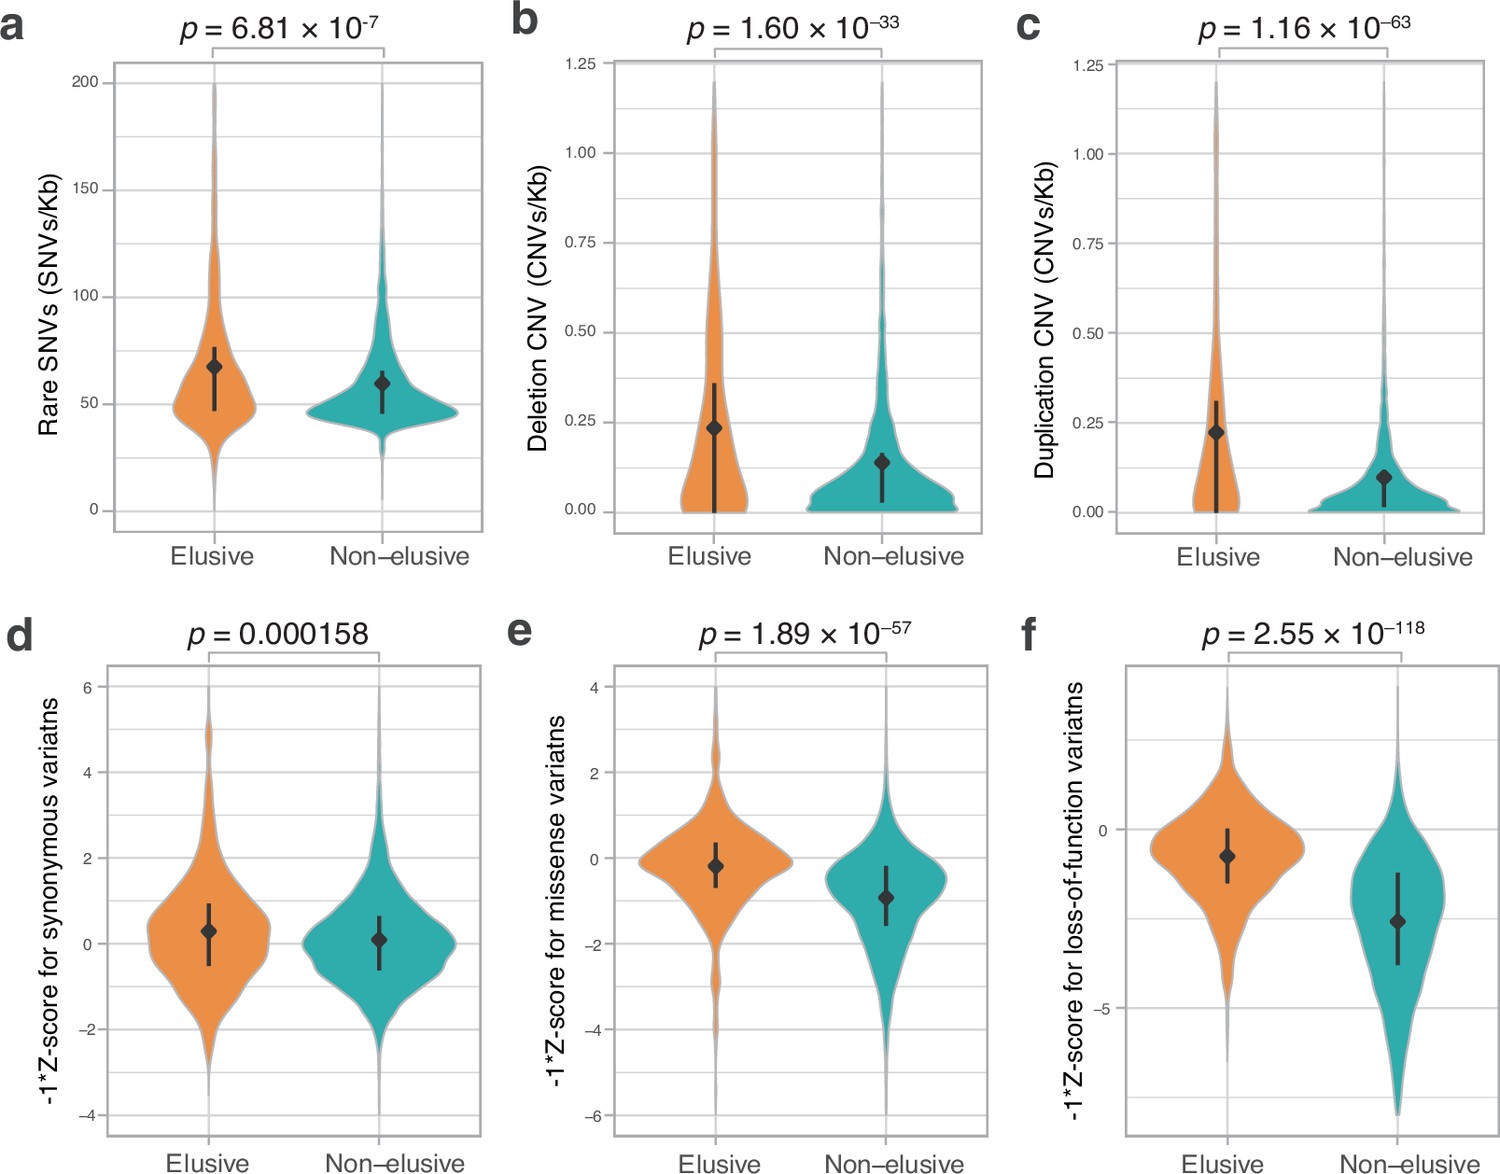
Genetic variations of the elusive and non-elusive genes within human populations.
Comparison of the density of rare single-nucleotide variants (SNVs) (a), deletion copy number variants (CNVs) (b), duplication CNVs (c), and Z-scores of synonymous (d), missense (e), and loss-of-function variants (f). We used opposite numbers of the Z-scores in d–f so that the elusive genes have higher values than non-elusive genes as in Figure 2a, b, c, e, f and Figure 3a–c. (a–c) 813 elusive genes and 8050 non-elusive genes were used. (d–f) 544 elusive genes and 7303 non-elusive genes for which genetic variants were available in GnomAD were used. Diamonds and bars within violin plots indicate the median and range from 25th to 75th percentile, respectively.
Figure 5 with 1 supplement
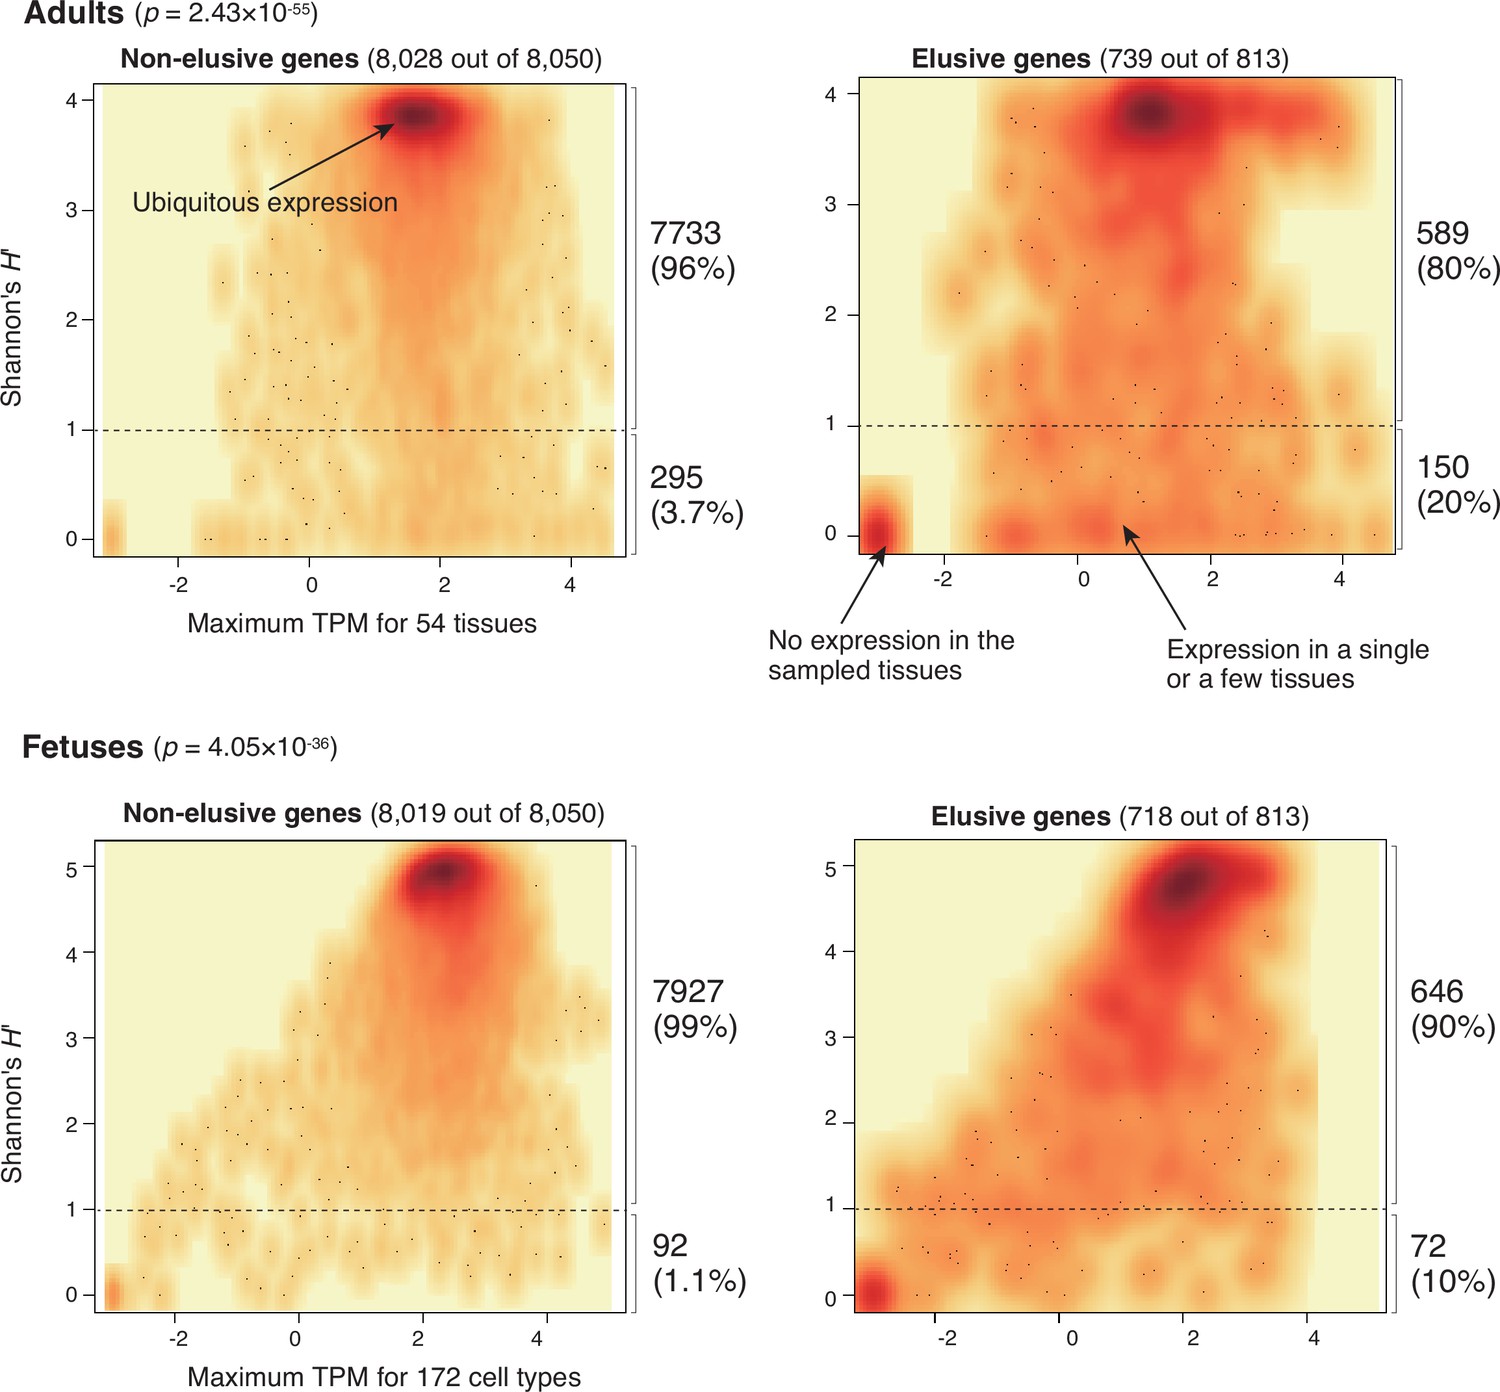
Expression profiles of elusive and non-elusive genes.
The figure shows density scatter plots of the expression quantity and divergence of elusive and non-elusive genes. The numbers of the elusive/non-elusive genes and those for which the expression quantities were available are indicated in each panel. p-values were computed via 2 × 2 contingency tables presenting numbers of elusive and non-elusive genes with H′ < 1 and H′ ≥ 1. The median transcription per million (TPM) value of each of the adult tissue across individuals was retrieved from the GTEx database (The GTEx Consortium et al., 2020), and normalized TPM values of the fetal cell types were retrieved from the Descartes database (Cao et al., 2020). For the individual genes, maximum TPM and Shannon’s H′ values were computed using these processed TPM values.
Figure 5—figure supplement 1
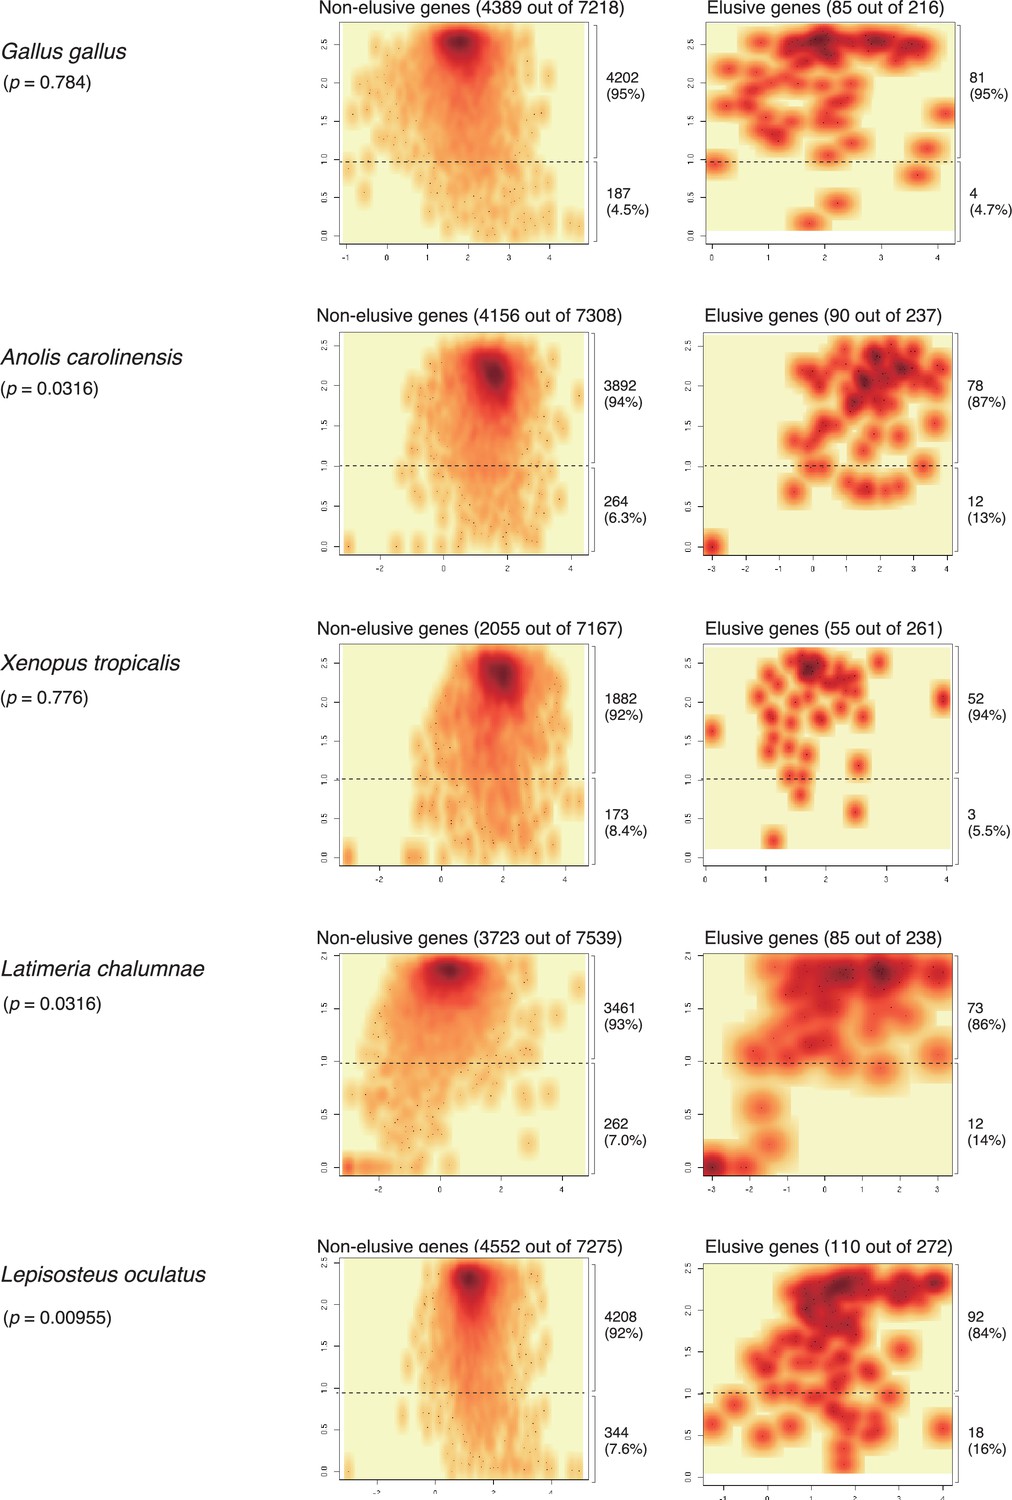
Expression profiles of the orthologs of the elusive and non-elusive genes for non-mammalian vertebrates.
Density scatter plots of the expression quantity and divergence of elusive and non-elusive genes. The total numbers of the elusive/non-elusive genes and the number of them for which expression data were available are indicated in each panel. p-values were computed via 2 × 2 contingency tables presenting numbers of elusive and non-elusive genes with H′ < 1 and H′ ≥ 1. Correction for multiple testing was performed for comparison in each species. The transcription per million (TPM) values of the fetal cell types were retrieved from the Bgee database (Bastian et al., 2021). See the details in Figure 5.
Figure 6 with 5 supplements
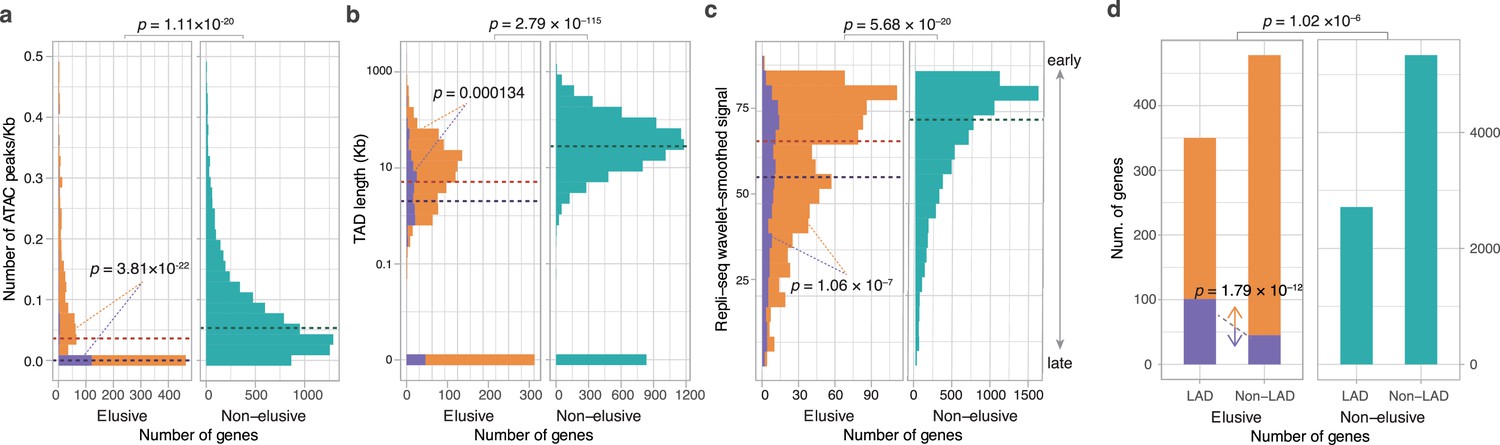
Epigenetic features of the elusive genes.
Comparison of the distribution of ATAC-seq peak density (a), length of the topologically associating domains (TADs) including the elusive or non-elusive genes (b), the replication timing indicator based on Repli-seq (c), and overlap with the lamina-associated domains (LADs) computed from Lamin B1 ChIP-seq data. All of the analyses were performed by using the processed sequencing data publicly available (Table S3; Supplementary file 1b). (d) ATAC-seq and Hi-C were performed with A549 cells, Repli-seq was performed with HepG2 cells, and Lamin B1 ChIP-seq was performed with HAP-1 cells. In the elusive gene panels (orange bar), purple bar indicates the elusive genes with restricted expressions (H′ < 1; Figure 5). p-values for individual panels indicate the comparison between the elusive (813) and non-elusive (8050) genes and the one between the elusive genes with H′ < 1 (150) and those with H′ ≥ 1 (589). The results for other cells are shown in Figure 6—figure supplements 1–4 For the individual epigenetic characteristics, correction for multiple testing was performed for comparison in each cell cultures.
Figure 6—figure supplement 1
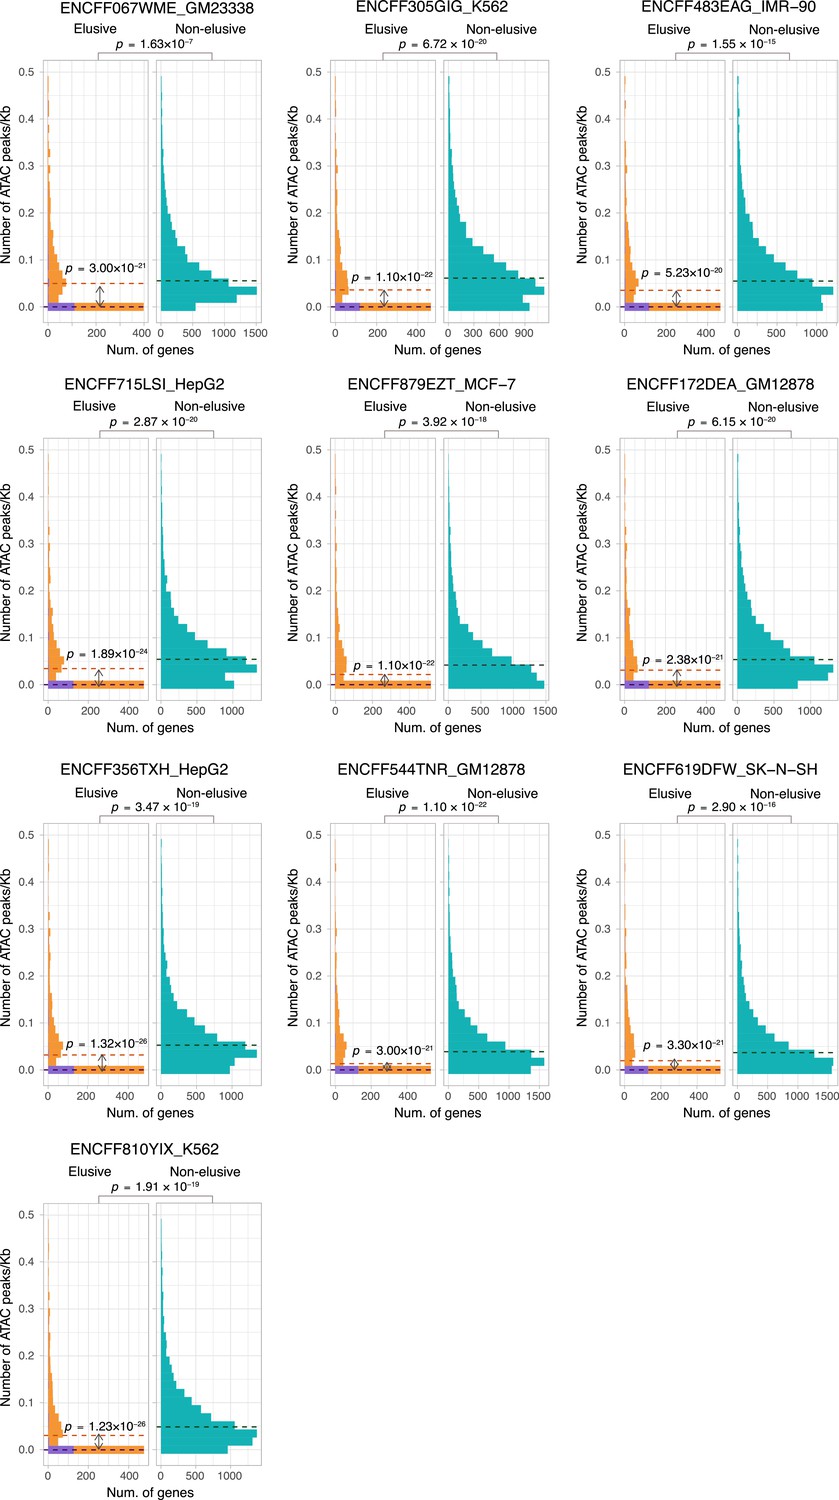
ATAC-seq peak density of the elusive and non-elusive gene regions.
Comparison of the distribution of ATAC-seq peak density between the elusive and non-elusive genes across multiple cell types. In the elusive gene panels (orange bar), purple bar indicates the elusive genes with restricted expressions (H′ < 1; Figure 5). p-values for individual panels indicate the comparison between the elusive (813) and non-elusive (8,050) genes and the one between the elusive genes with H′ < 1 (150) and those with H ′ ≥1 (589). Correction for multiple testing was performed for comparison in each cell culture.
Figure 6—figure supplement 2
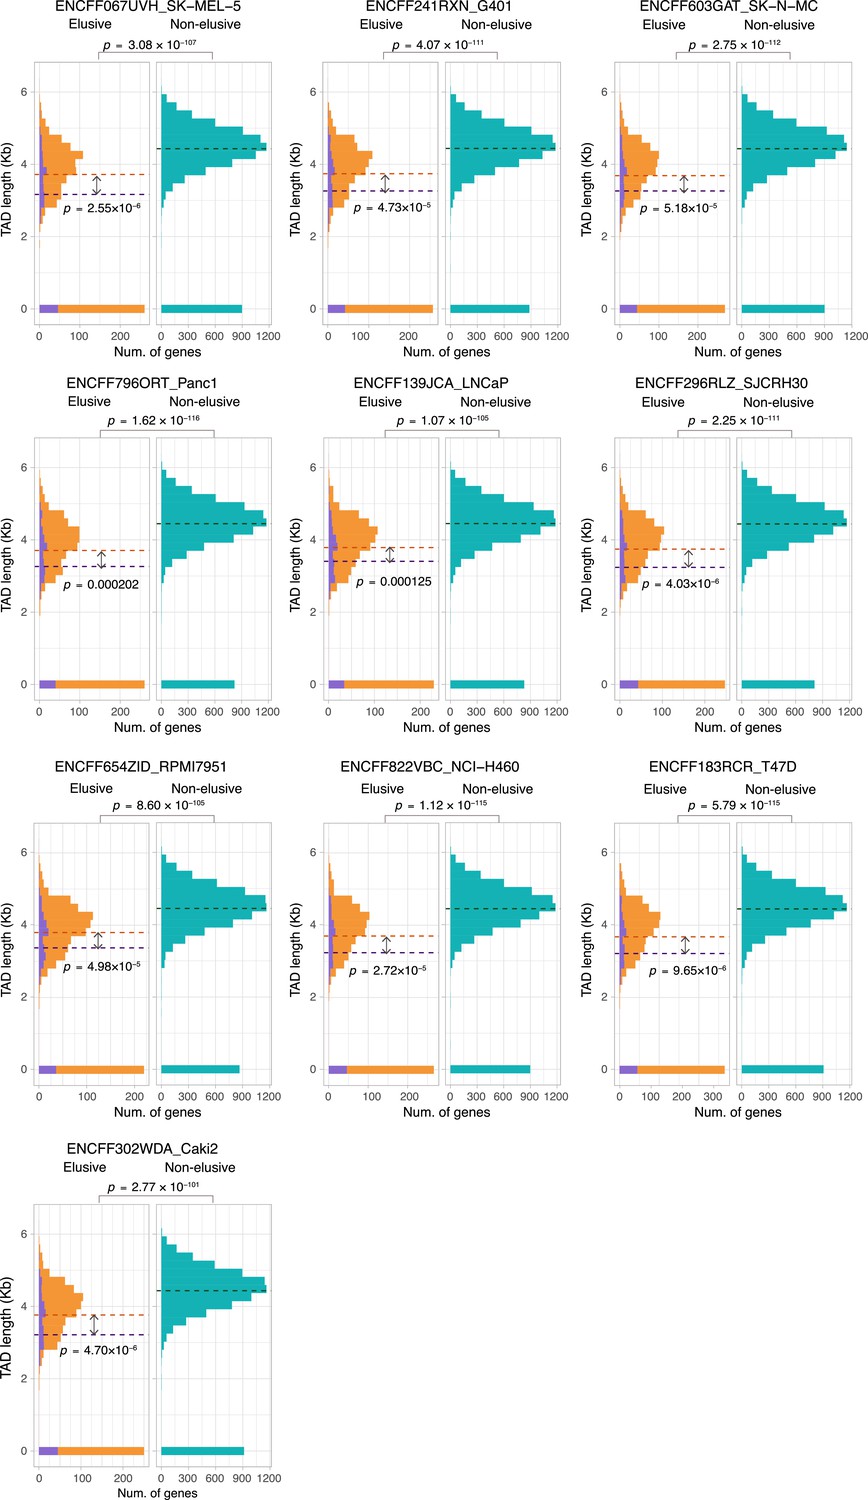
Sequence lengths of the topologically associating domains (TADs) containing elusive or non-elusive genes.
Comparison of the distribution of length of TADs including the elusive or non-elusive genes across multiple cell types. In the elusive gene panels (orange bar), purple bar indicates the elusive genes with restricted expressions (H′ < 1; Figure 5). p-values for individual panels indicate the comparison between the elusive (813) and non-elusive (8050) genes and the one between the elusive genes with H′ < 1 (150) and those with H′ ≥1 (589). Correction for multiple testing was performed for comparison in each cell culture.
Figure 6—figure supplement 3
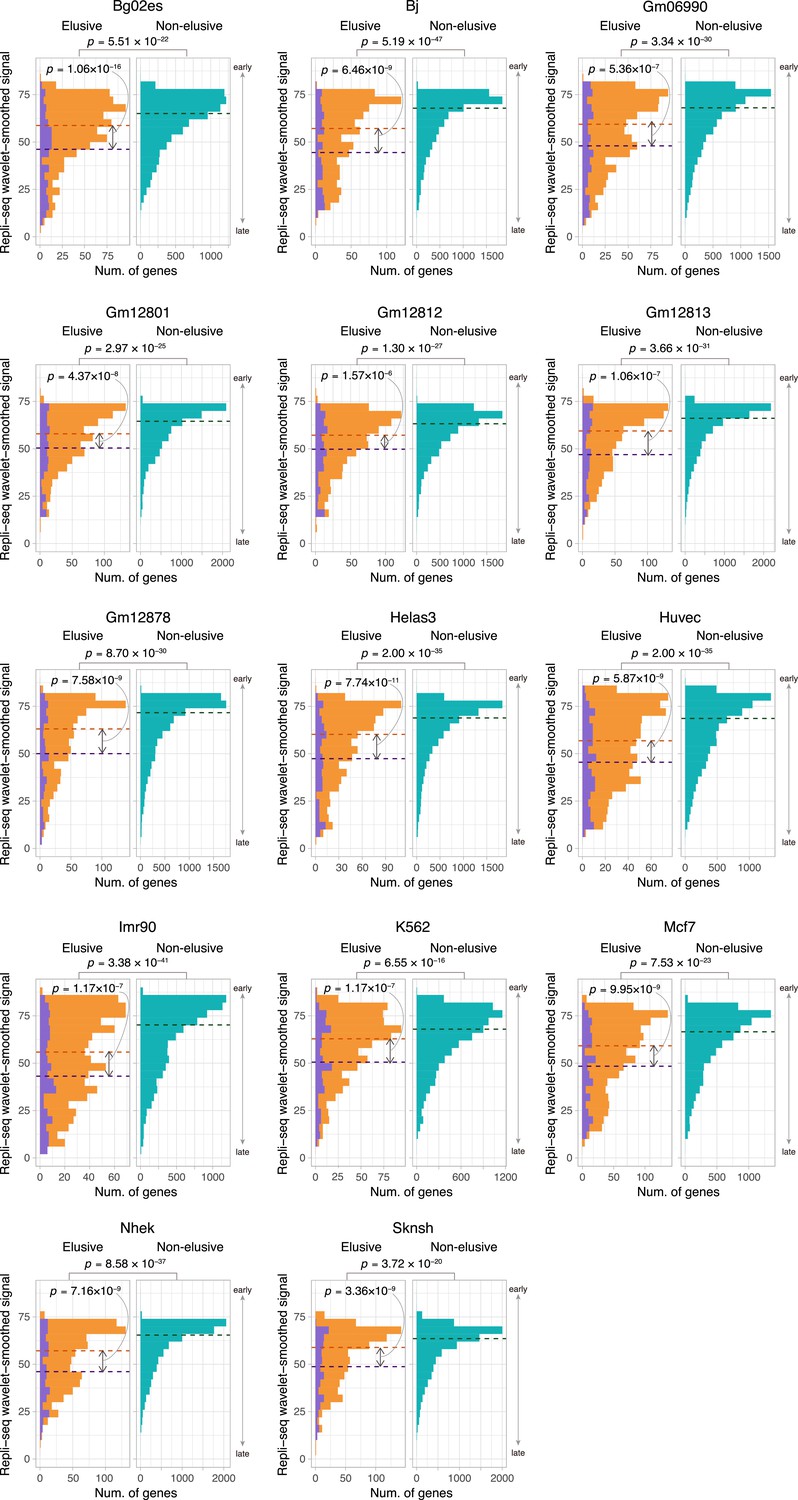
Comparison of the replication timing indicator based on Repli-seq between the elusive and non-elusive genes.
Comparison of the distribution of replication timing indicator based on Repli-seq between the elusive and non-elusive genes across multiple cell types. In the elusive gene panels (orange bar), purple bar indicates the elusive genes with restricted expressions (H′ < 1; Figure 5). p-values for individual panels indicate the comparison between the elusive (813) and non-elusive (8050) genes and the one between the elusive genes with H′ < 1 (150) and those with H′ ≥ 1 (589). Correction for multiple testing was performed for comparison in each cell culture.
Figure 6—figure supplement 4
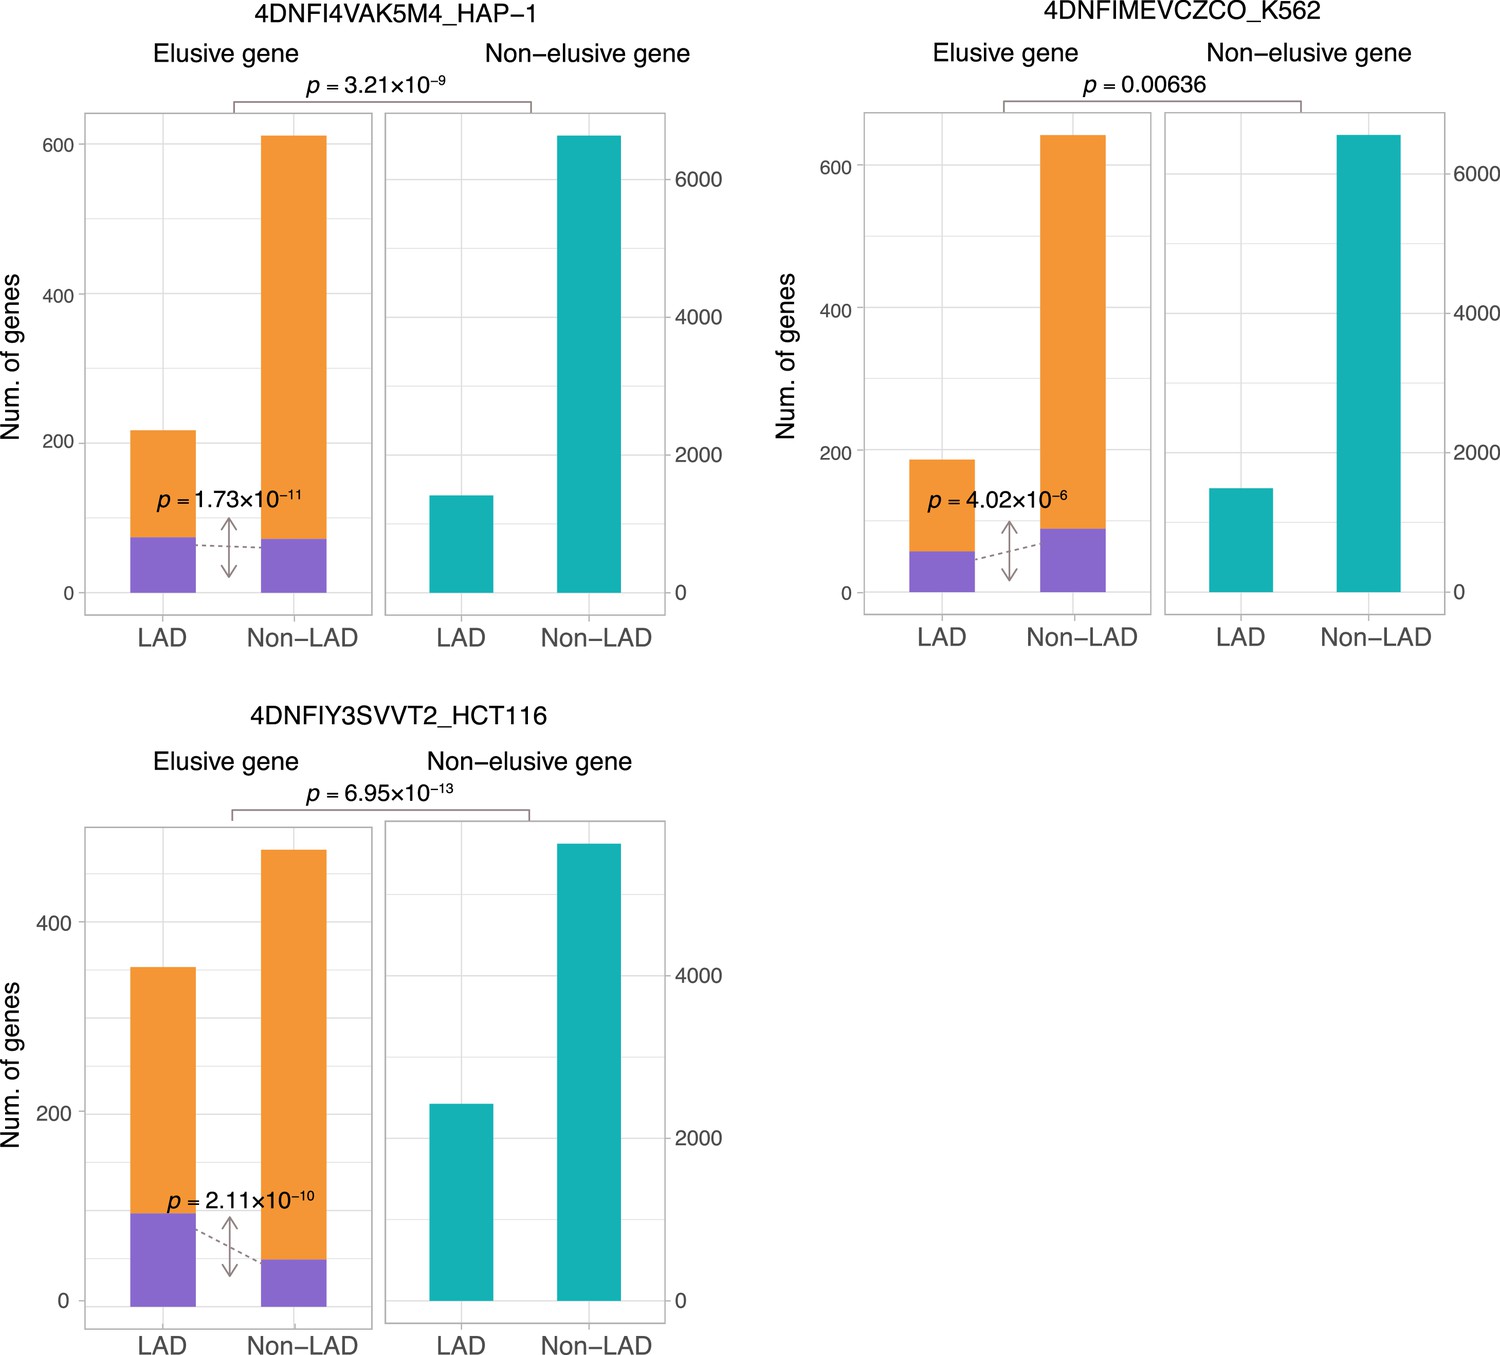
The fraction of elusive and non-elusive genes that overlap with lamina-associated domains (LADs).
Comparison of frequency of overlap with LADs computed from Lamin B1 ChIP-seq data between the elusive and non-elusive genes across multiple data. In the elusive gene panels (orange bar), purple bar indicates the elusive genes with restricted expressions (H′ < 1; Figure 5). p-values for individual panels indicate the comparison between the elusive (813) and non-elusive (8050) genes and the one between the elusive genes with H′ < 1 (150) and those with H′ ≥ 1 (589).
Figure 6—figure supplement 5
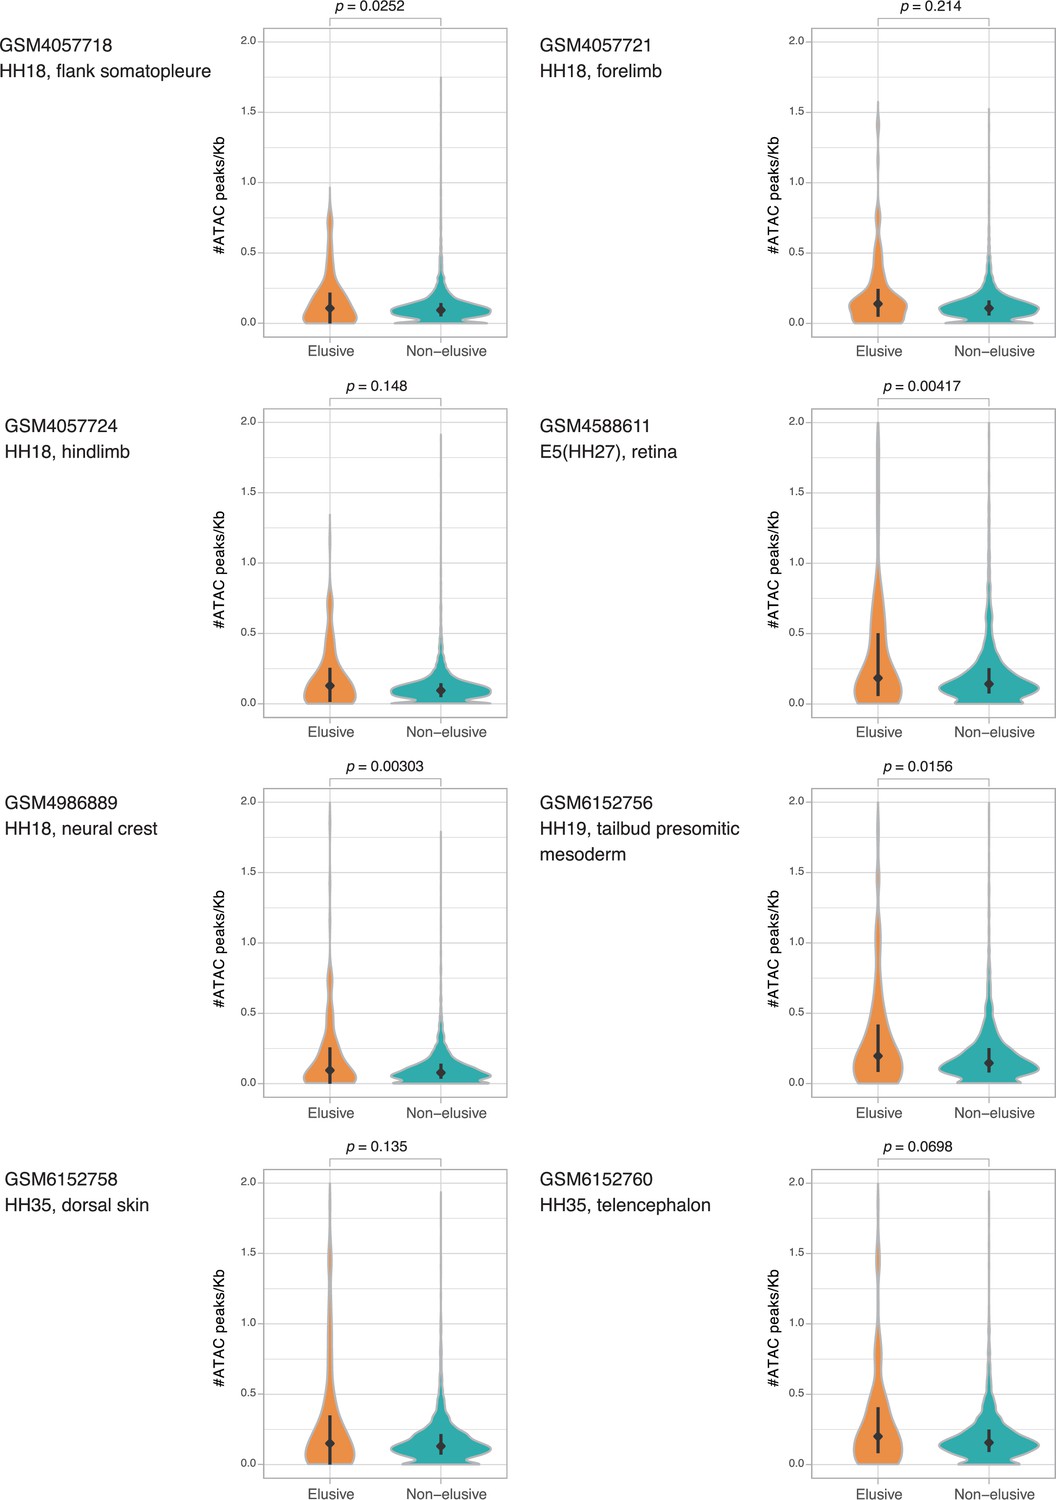
ATAC-seq peak density of the chicken orthologs of the elusive and non-elusive gene regions.
Comparison of the distribution of ATAC-seq peak density between the orthologs of elusive (210) and non-elusive (7218) genes in the chicken genome. Correction for multiple testing was performed for comparison in each cell cultures. Diamonds and bars within violin plots indicate the median and range from the 25th to 75th percentile, respectively.
Figure 7 with 1 supplement
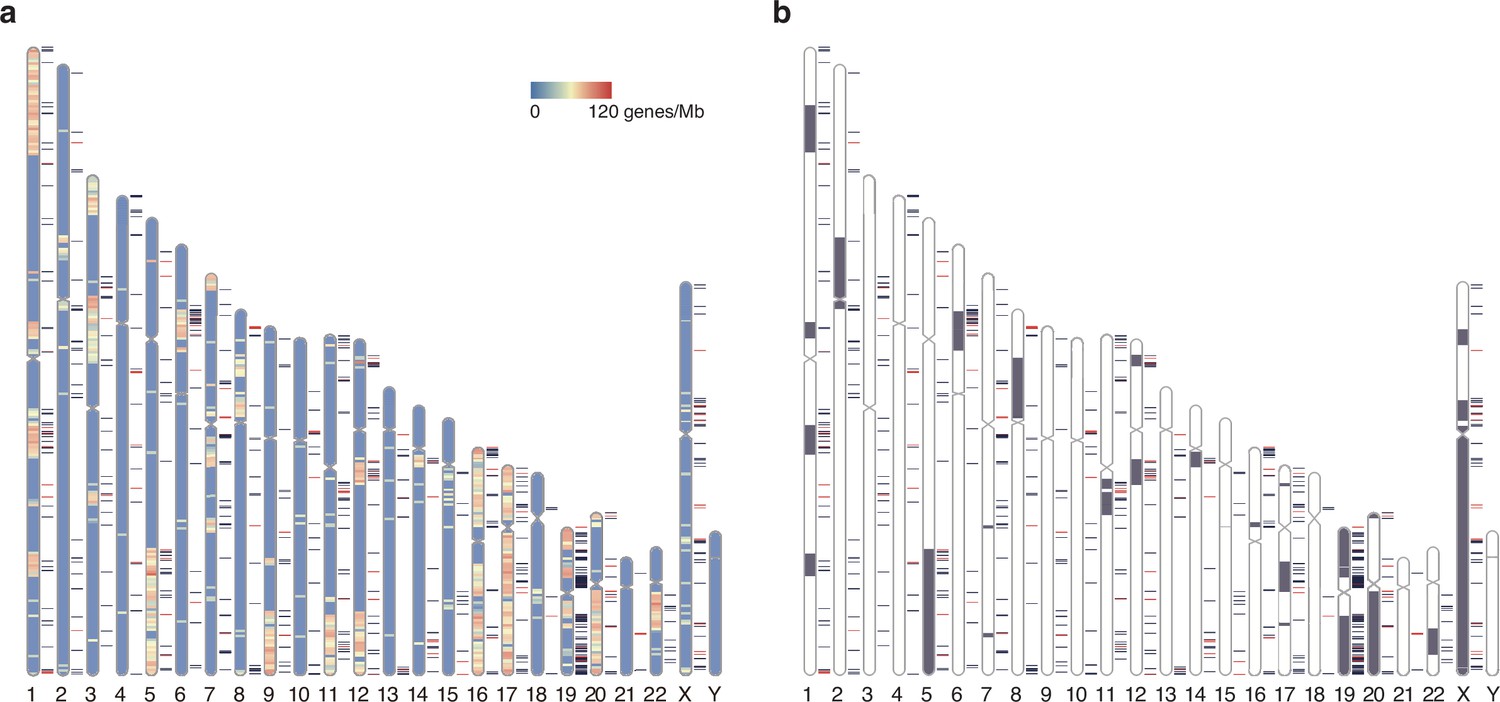
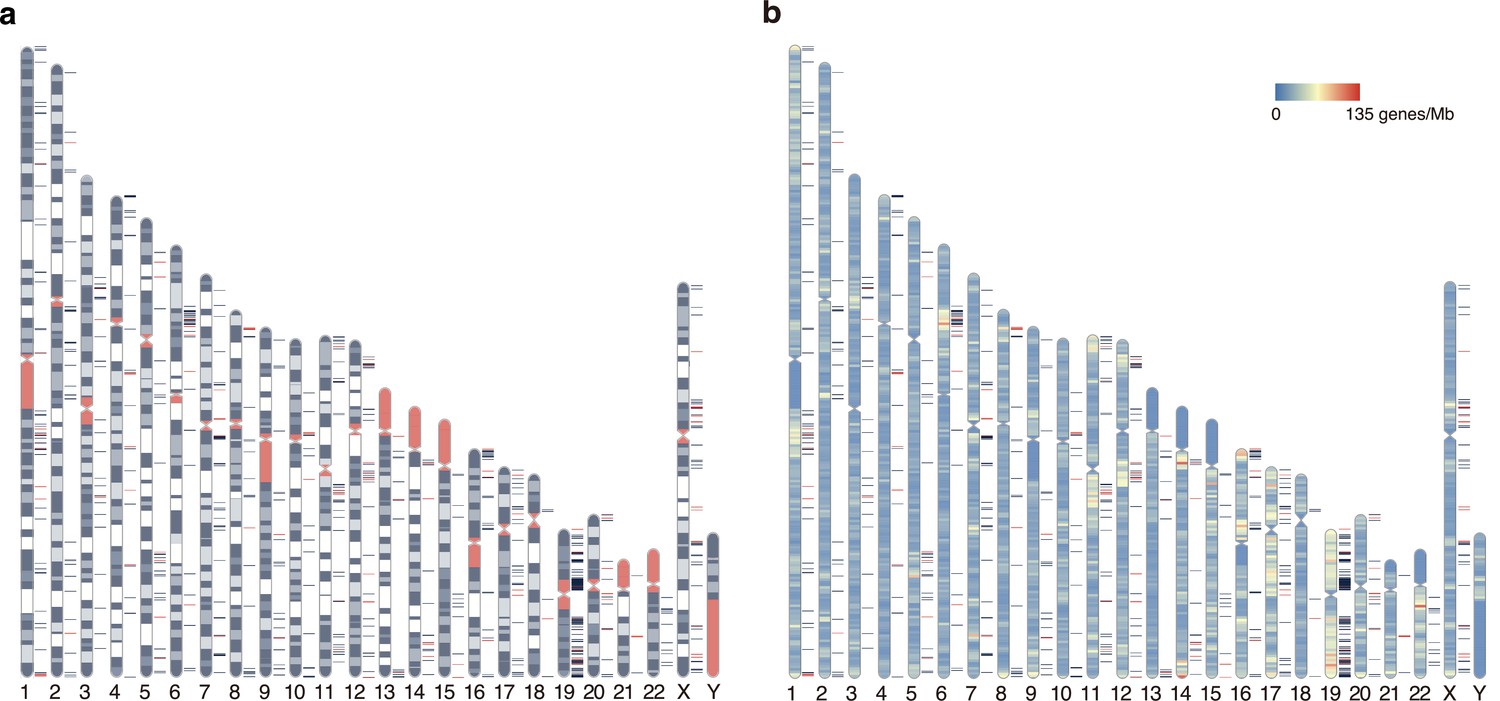
Chromosomal distribution of human elusive genes.
Red and dark blue horizontal bars beside the chromosome ideogram represent the location of elusive genes with restricted expression (Shannon’s H′ < 1) and the other elusive genes, respectively. (a) The chromosome diagrams are colored according to the density of the genes that harbor chicken orthologs in microchromosomes (number of genes/Mb). 93 and 68 elusive genes were orthologous to the chicken genes in macro- and microchromosomes, respectively, and 4211 and 2078 non-elusive genes were orthologous to the chicken genes in macro- and microchromosomes, respectively. This indicates that the chicken orthologs of the elusive genes are abundant in microchromosomes compared with those of the non-elusive genes (p=0.0175). (b) Gray regions in the diagram indicate orthologous regions of microchromosomes in the ancestors of gnathostomes (Nakatani et al., 2021). 395 and 296 elusive genes were located in the genomic regions corresponding to ancient macro- and microchromosomes, respectively, and 5950 and 1929 non-elusive genes were located in the genomic regions corresponding to these ancient chromosomes. The result recapitulates the biased localization of the elusive genes on microchromosomes (p=9.50 × 10⁻²⁴). The chromosome diagrams were drawn using RIdeogram (Hao et al., 2020).
Figure 7—figure supplement 1
Distribution of elusive genes across human chromosomes.
Red and dark blue horizontal bars on the side of the chromosome diagram represent the location of elusive genes with restricted expression (Shannon’s H′ < 1) and the other elusive genes, respectively. (a) Karyotypes are shown by G-banding. Red regions indicate centromeres, acrocentric regions, and variable-length regions. (b) The chromosome diagrams are colored according to gene density (number of genes/Mb). The chromosome diagrams were drawn using RIdeogram (Hao et al., 2020).
Tables
Author response table 1
Difference in statistical significances across different elusive gene sets.
| Features | Non-significant in theinitial gene set(1,081 elusive genes) | Non-significant in thecurrent gene set(813) | Non-significant in the current gene setexcluding chr19(669) |
|---|---|---|---|
| Gene density in the turkey genome | ✓ | ✓ | ✓ |
| Gene density in the green anole genome | ✓ | ||
| Gene density in the bamboo shark genome | ✓ | ||
| Gene density in the whale shark genome | ✓ | ✓ | ✓ |
| KS in avians | ✓ | ✓ | |
| KA in avians | ✓ | ✓ | ✓ |
| KA in sharks | ✓ | ✓ | ✓ |
| ATAC-seq peak density for GM23338 | ✓ | ||
| Lamin B1 ChIP-seq peak density for K562 | ✓ |
-
The other features showed significantly different trends between the elusive and non-elusive genes for all of the elusive gene sets and thus are not included in this table.
Author response table 2
Number of chicken orthologs of elusive and non-elusive genes locating in macro- and microchromosomes.
| Elusive | Non-elusive | |
|---|---|---|
| Macrochromosome (chr1-10, Z) | 93 | 4211 |
| Microchromosome (chr11-, W) | 68 | 2078 |
-
Genes in non-chromosome scaffolds and mitochondrial genome were excluded Fisher's exact test p=0.0175, odds ratio=1.48
Author response table 3
Number of elusive and non-elusive genes locating in the genomic regions derived from ancestral macro- and microchromosomes.
| Elusive | Non-elusive | |
|---|---|---|
| Ancestral macrochromosome | 395 | 5950 |
| Ancestral microchromosome | 296 | 1929 |
-
Genes in the genomic regions that did not correspond to the ancestral macro/microchromsomes were excluded. Fisher's exact test p=9.50x10⁻²⁴, odds ratio=2.31.
Additional files
-
Supplementary file 1
Supplementary Tables S1, S3, S4.
(a) Supplementary Table S1. Vertebrate species used for creating gene phylogenies. (b) Supplementary Table S3. ENCODE accession ID list used for epigenomic analyses. (c) Supplementary Table S4. RNA-seq and ATAC-seq samples of non-mammalian vertebrates.
- https://cdn.elifesciences.org/articles/82290/elife-82290-supp1-v1.xlsx
-
Supplementary file 2
Supplementary Table S2.
Characteristics of the elusive and non-elusive genes in the human genome.
- https://cdn.elifesciences.org/articles/82290/elife-82290-supp2-v1.zip
-
MDAR checklist
- https://cdn.elifesciences.org/articles/82290/elife-82290-mdarchecklist1-v1.docx
Download links
A two-part list of links to download the article, or parts of the article, in various formats.
Downloads (link to download the article as PDF)
Open citations (links to open the citations from this article in various online reference manager services)
Cite this article (links to download the citations from this article in formats compatible with various reference manager tools)
The impact of local genomic properties on the evolutionary fate of genes
eLife 12:e82290.
https://doi.org/10.7554/eLife.82290


