Caveolae couple mechanical stress to integrin recycling and activation
- Mechanoadaptation and Caveolae Biology Laboratory, Cell and developmental Biology Area, Centro Nacional de Investigaciones Cardiovasculares, Spain
- Institute for Bioengineering of Catalonia, Spain
Figures
Figure 1
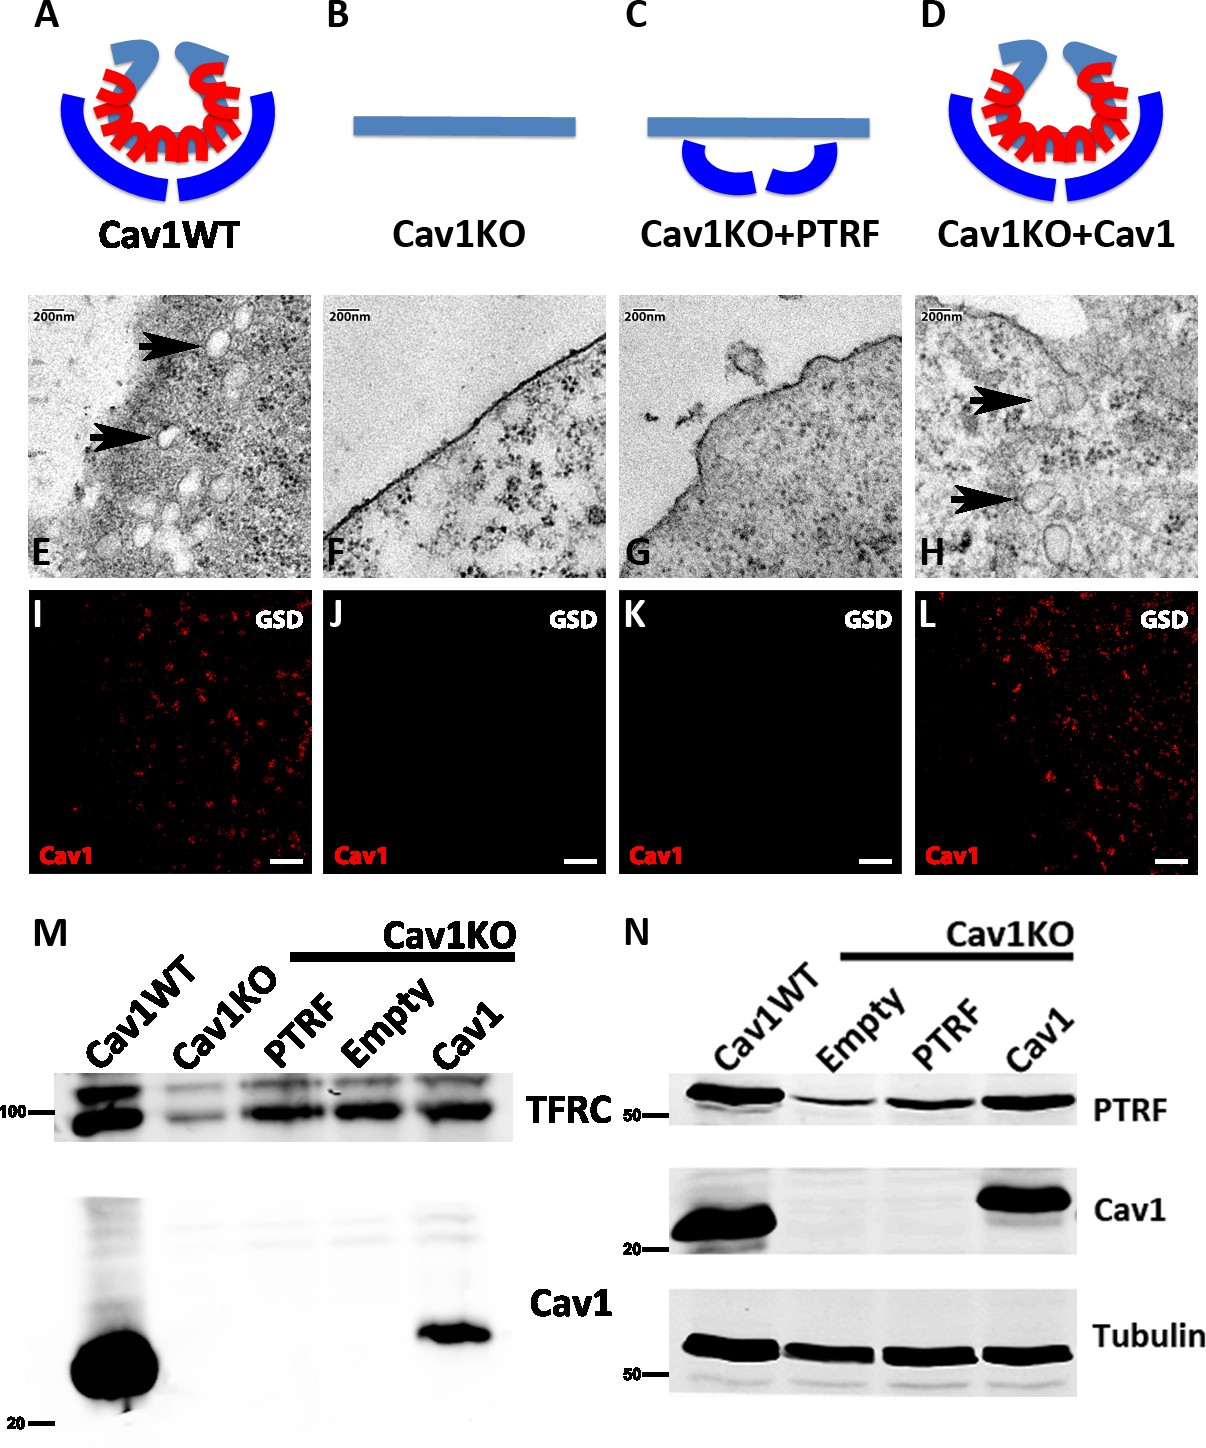
Caveolin-1-based genetic model characterization.
(A–D) Mouse embryonic fibroblast (MEF) caveolae-related phenotypes: PTRF is depicted in dark blue, Cav1 in red, and plasma membrane (PM) in light blue. (E–H) Electron microscopy images of MEF PM regions, showing the presence of caveolae only in (E) wild type MEFs and (H) Cav1-reconstituted Cav1KO MEFs (black arrows). (I–L) Ground State Depletion (GSD)-super-resolution MEF images. Cav1 is shown in red. Scale bar = 1 µm. (M) Biochemical PM fractionation of wild type and Cav1KO MEFs and Cav1KO MEFs reconstituted with PTRF, empty vector, and Cav1. Samples were immunoblotted for Cav1 and transferrin receptor (as both PM marker and loading control). (N) Western blot of total lysates from wild type, Cav1KO, and reconstituted Cav1KO MEFs. Samples were immunoblotted for PTRF, Cav1, and tubulin (loading control).
-
Figure 1—source data 1
Full raw unedited blot corresponding to Figure 1M.
- https://cdn.elifesciences.org/articles/82348/elife-82348-fig1-data1-v4.pdf
-
Figure 1—source data 2
Uncropped blot with the relevant bands labeled, corresponding to Figure 1M.
- https://cdn.elifesciences.org/articles/82348/elife-82348-fig1-data2-v4.pdf
-
Figure 1—source data 3
Full raw unedited blot corresponding to Figure 1N.
- https://cdn.elifesciences.org/articles/82348/elife-82348-fig1-data3-v4.pdf
-
Figure 1—source data 4
Uncropped blot with the relevant bands labeled, corresponding to Figure 1N.
- https://cdn.elifesciences.org/articles/82348/elife-82348-fig1-data4-v4.pdf
Figure 2 with 3 supplements
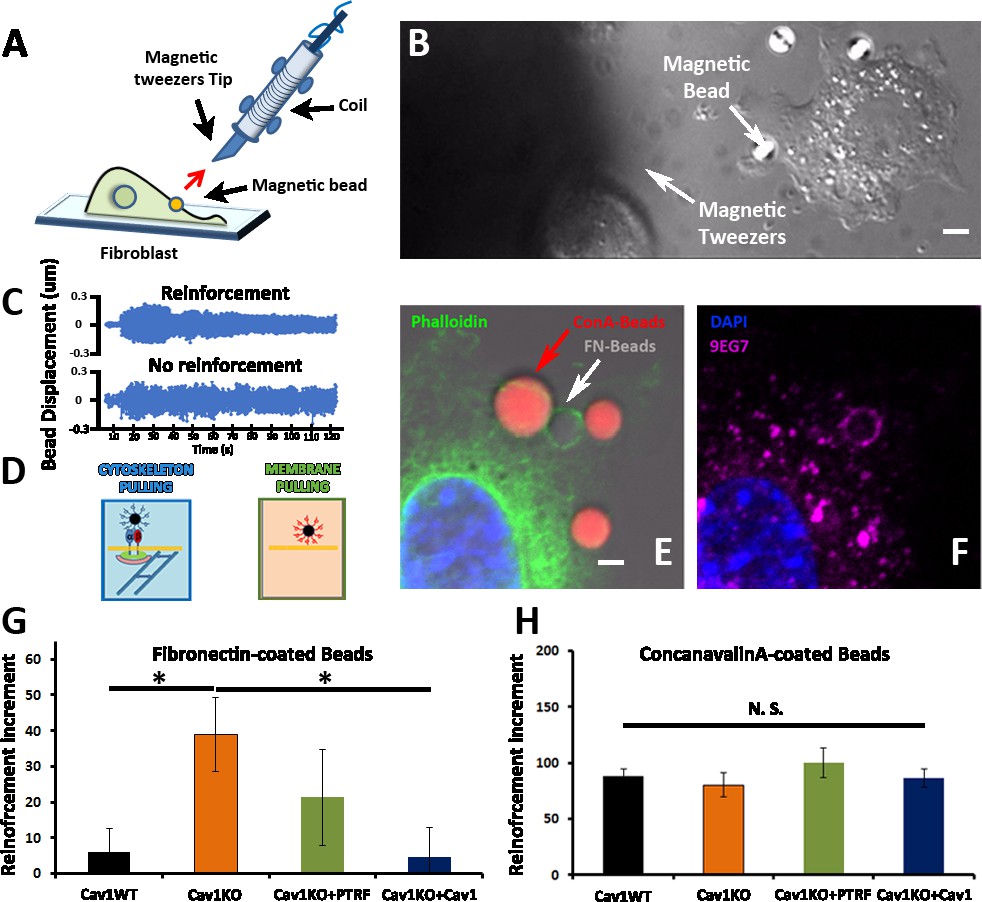
Cav1KO Mouse embryonic fibroblasts (MEFs) show reinforced attachment to magnetic tweezers.
(A) Reinforcement experiment scheme, indicating the fibroblast, the magnetic bead, and the magnetic tweezers apparatus. The red arrow represents the magnetic force exerted on the bead by the magnet. (B) Differential interference contrast (DIC) image showing a MEF, the tip of the magnetic tweezers, and a magnetic bead (white arrows). Scale bar = 3 µm. (C) Examples of bead oscillation as a function of time in two conditions: with and without reinforcement. (D) Representation of the two magnetic beads coatings used: fibronectin (FN), which binds integrins, and ConA, which binds the bulk plasma membrane (PM). (E and F) Confocal microscopy images showing a MEF attached to concanavalin A-coated beads (red) and FN-coated beads (gray). Actin staining is shown in green (phalloidin), active β1-integrin in magenta (9EG7 antibody), and 4′,6-diamidino-2-phenylindole (DAPI) in blue. Note how only FN-coated beads present both phalloidin and 9EG7 staining. Scale bar = 2 µm. (G and H) Reinforcement increment (relative change in reinforcement over the entire experiment, calculated as the difference between the last and initial measurements) of different MEF genotypes for FN-coated beads (G) or ConA-coated beads (H); n≥20 beads per genotype. Statistical comparisons were by t-test, with significance assigned at *p<0.05. N. S., non-significant. Data are presented as mean values +/- SEM.
-
Figure 2—source data 1
Traces of beads movement shown in Figure 2C.
They represent two examples of the data used to generate the reinforcement increment shown in Figure 2G.
- https://cdn.elifesciences.org/articles/82348/elife-82348-fig2-data1-v4.xlsx
-
Figure 2—source data 2
Raw data of experiments from Figure 2G and 2H.
- https://cdn.elifesciences.org/articles/82348/elife-82348-fig2-data2-v4.xlsx
Figure 2—video 1
Example magnetic tweezers experiment.
Application of a pulsed magnetic force (1 Hz and 1 nN) causes the tip of the magnetic tweezers (black shadow to the right) to pull a magnetic bead attached to the cell surface (observed by differential interference contrast [DIC] microscopy).
Figure 2—video 2
Molecular representation video of the type of forces generated by concanavalin A-coated beads.
Force is exerted on the plasma membrane.
Figure 2—video 3
Molecular representation video of the type of forces generated by fibronectin (FN)-coated beads.
Force is exerted on integrins.
Figure 3 with 1 supplement
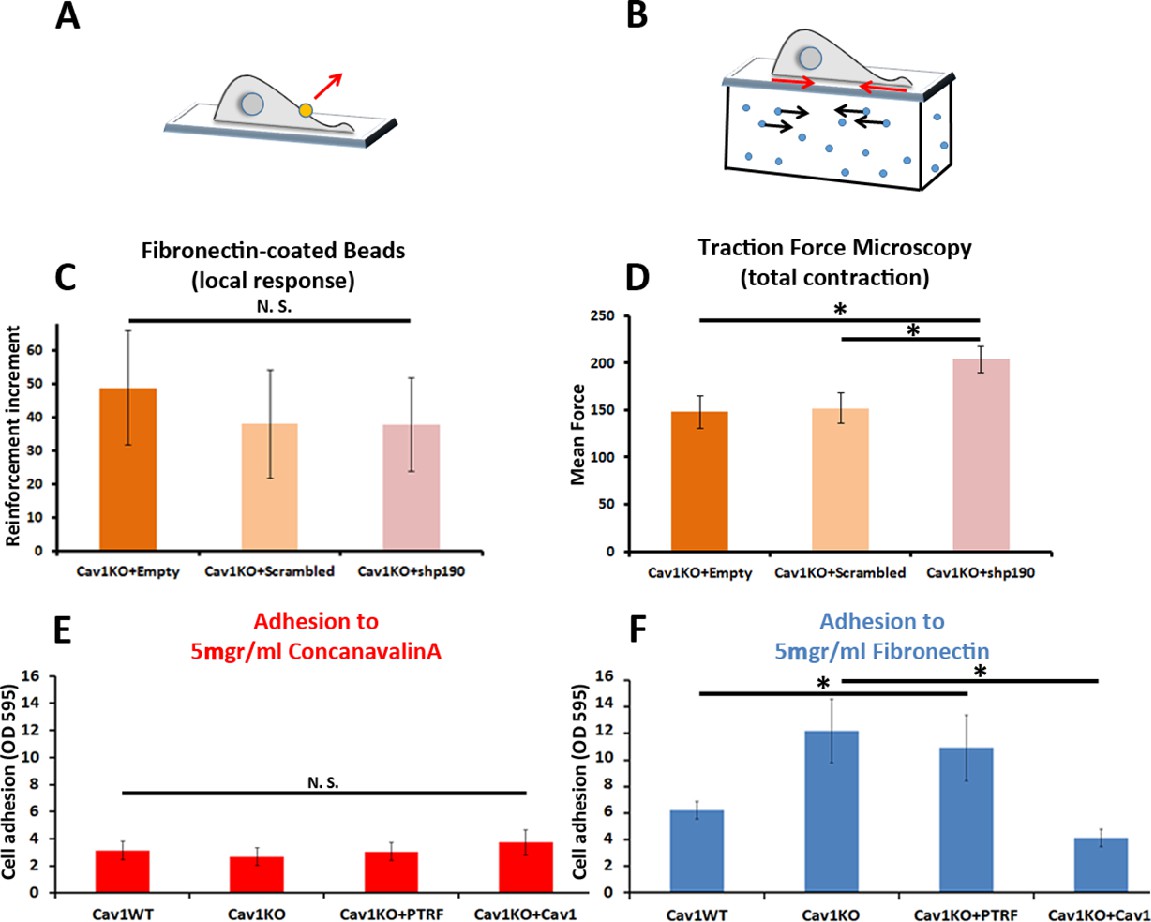
Cav1KO Mouse embryonic fibroblasts (MEFs) show Rho-independent reinforcement and increased fibronectin (FN) adhesion.
(A and B) Experimental schemes for (A) local force measurement (magnetic tweezers experiment, reinforcement) and (B) total force measurement (traction force microscopy, total cell contraction). (C) Effect of transfection with scrambled or shp190RhoGAP small hairpin RNA (shRNA) on the reinforcement increment in Cav1KO MEFs (magnetic tweezers assay). Reinforcement increment refers to the relative change in reinforcement over the entire experiment, calculated as the difference between the last and initial measurements; n≥20 beads per condition. (D) Effect of transfection with scrambled or shp190RhoGAP shRNA on mean total force contraction in Cav1KO MEFs (traction force microscopy); n≥12 cells per condition. (E and F) Relative adhesion of the indicated genotypes to plates coated with (E) 5 µg/ml ConA or (F) 5 µg/ml of FN. Measurements (absorbance, optical density, OD, at 595 nm from retained crystal violet dye, see Materials and methods) were normalized to values from adhesion to BSA-coated plates; n≥9 adhesion independent experiments. Data are presented as mean values +/- SEM. Statistical comparisons were by t-test, with significance assigned at *p<0.05. N. S., non-significant.
-
Figure 3—source data 1
Raw data of experiments from Figures 3C–F.
- https://cdn.elifesciences.org/articles/82348/elife-82348-fig3-data1-v4.xlsx
Figure 3—figure supplement 1
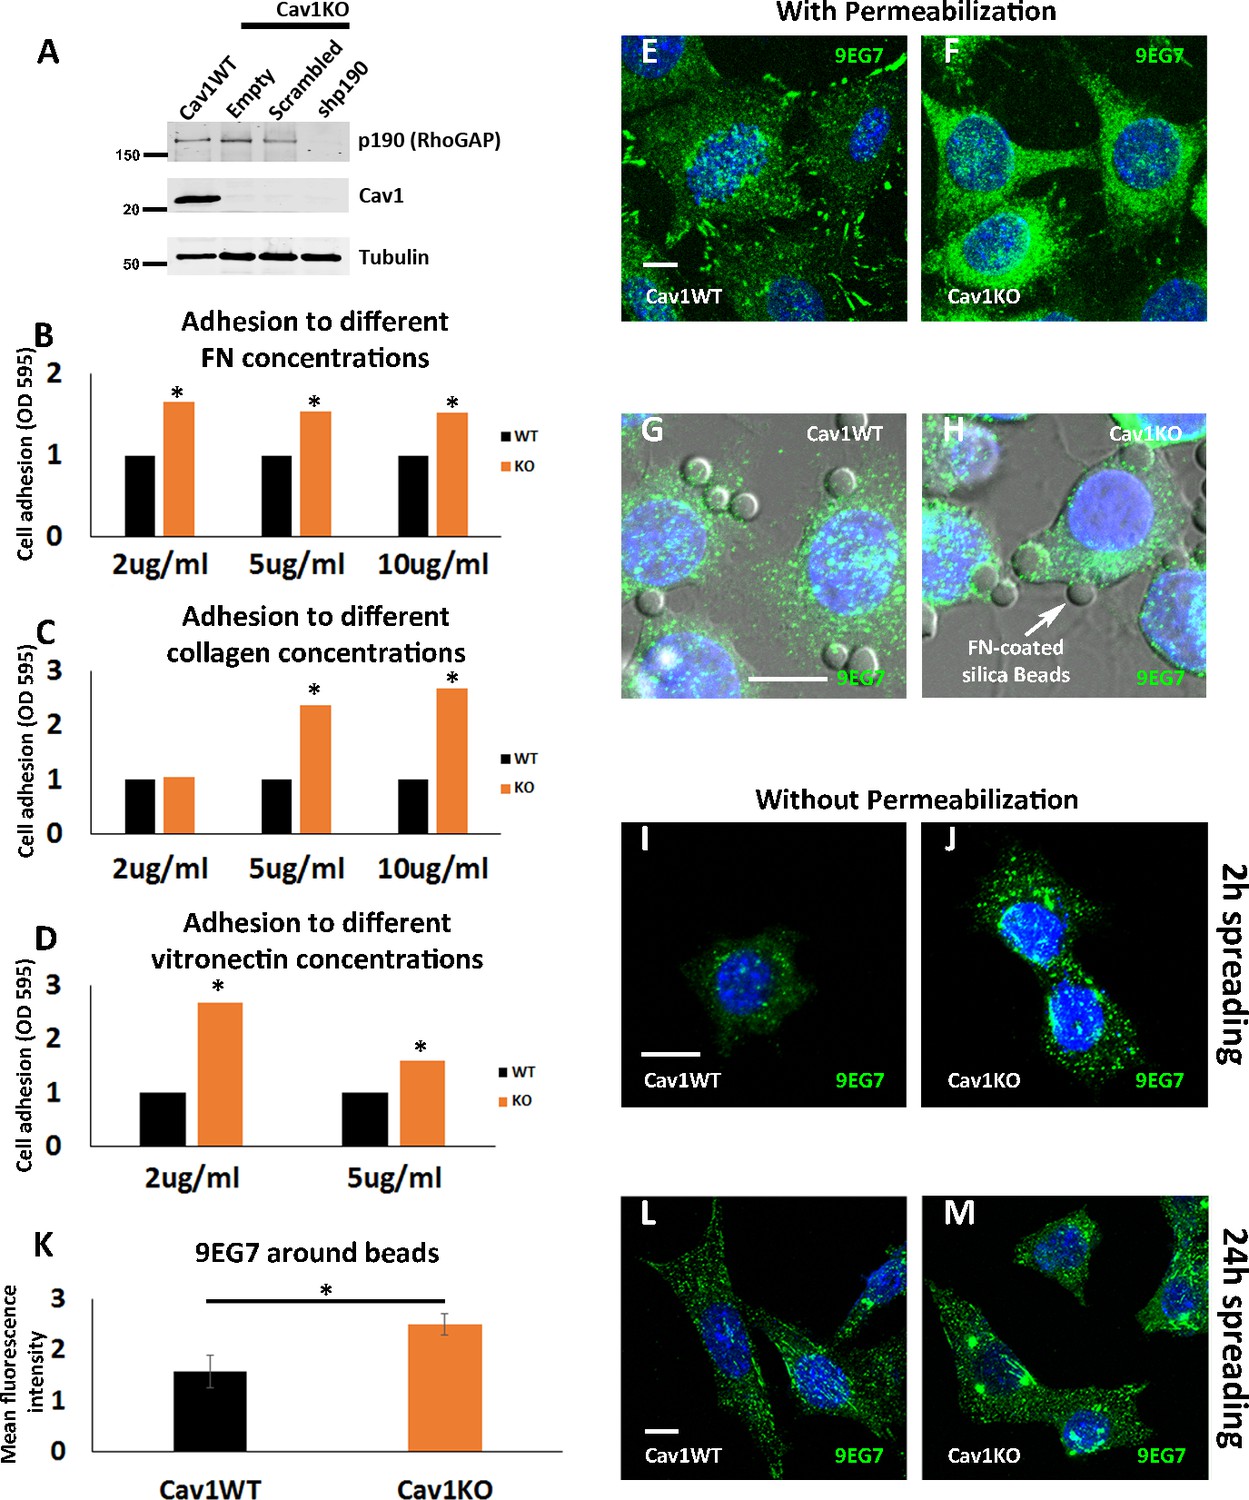
Cav1KO Mouse embryonic fibroblasts (MEFs) show increased adhesion to different substrates and increased active β1 integrin.
(A) Western blot of total lysates from wild type cells, and Cav1KO cells reconstituted with either empty vector, scrambled shRNA or shRNA against p190RhoGAP. Samples were immunoblotted for p190RhoGAP, Cav1, and tubulin (loading control, 50 kDa). (B, C, and D) Relative adhesion of wild type and Cav1KO mouse embryonic fibroblasts (MEFs) to different concentrations of fibronectin (FN) (B), collagen (C), and vitronectin (D). Measurements (absorbance, optical density, OD, at 595 nm from retained crystal violet dye, see Materials and methods) were normalized to values from wild type counterparts. (E and F) Confocal microscopy images of active β1-integrin immunostaining (9EG7 antibody, green) in permeabilized wild type (E) MEFs or Cav1KO (F) MEFs. DAPI counterstain is shown in blue. Scale bar = 10 µm. (G and H) Confocal microscopy images of active β1-integrin immunostaining (9EG7 antibody, green) in wild type (G) or Cav1KO (H) MEFs incubated with FN-coated silica beads (arrow). DAPI counterstain is shown in blue. Scale bar = 10 µm. (I, J, L, and M) Confocal microscopy images of active β1-integrin immunostaining (9EG7 antibody, green) in non-permeabilized wild type MEFs (I and L) and Cav1KO MEFs (J and M) after the indicated spreading times. DAPI is shown in blue. Scale bar = 10 µm. (K) Normalized mean bead-bound 9EG7 fluorescence intensity in wild type and Cav1KO MEFs; n≥40 beads per genotype. Data are presented as mean values +/- SEM. Statistical comparisons were by t-test, with significant between-group differences denoted *p<0.05.
-
Figure 3—figure supplement 1—source data 1
Full raw unedited blot corresponding to Figure 3—figure supplement 1A.
- https://cdn.elifesciences.org/articles/82348/elife-82348-fig3-figsupp1-data1-v4.pdf
-
Figure 3—figure supplement 1—source data 2
Uncropped blot with the relevant bands labeled, corresponding to Figure 3—figure supplement 1A.
- https://cdn.elifesciences.org/articles/82348/elife-82348-fig3-figsupp1-data2-v4.pdf
-
Figure 3—figure supplement 1—source data 3
Raw data of experiments from Figure 3–figure supplement 1.
- https://cdn.elifesciences.org/articles/82348/elife-82348-fig3-figsupp1-data3-v4.xlsx
Figure 4 with 7 supplements
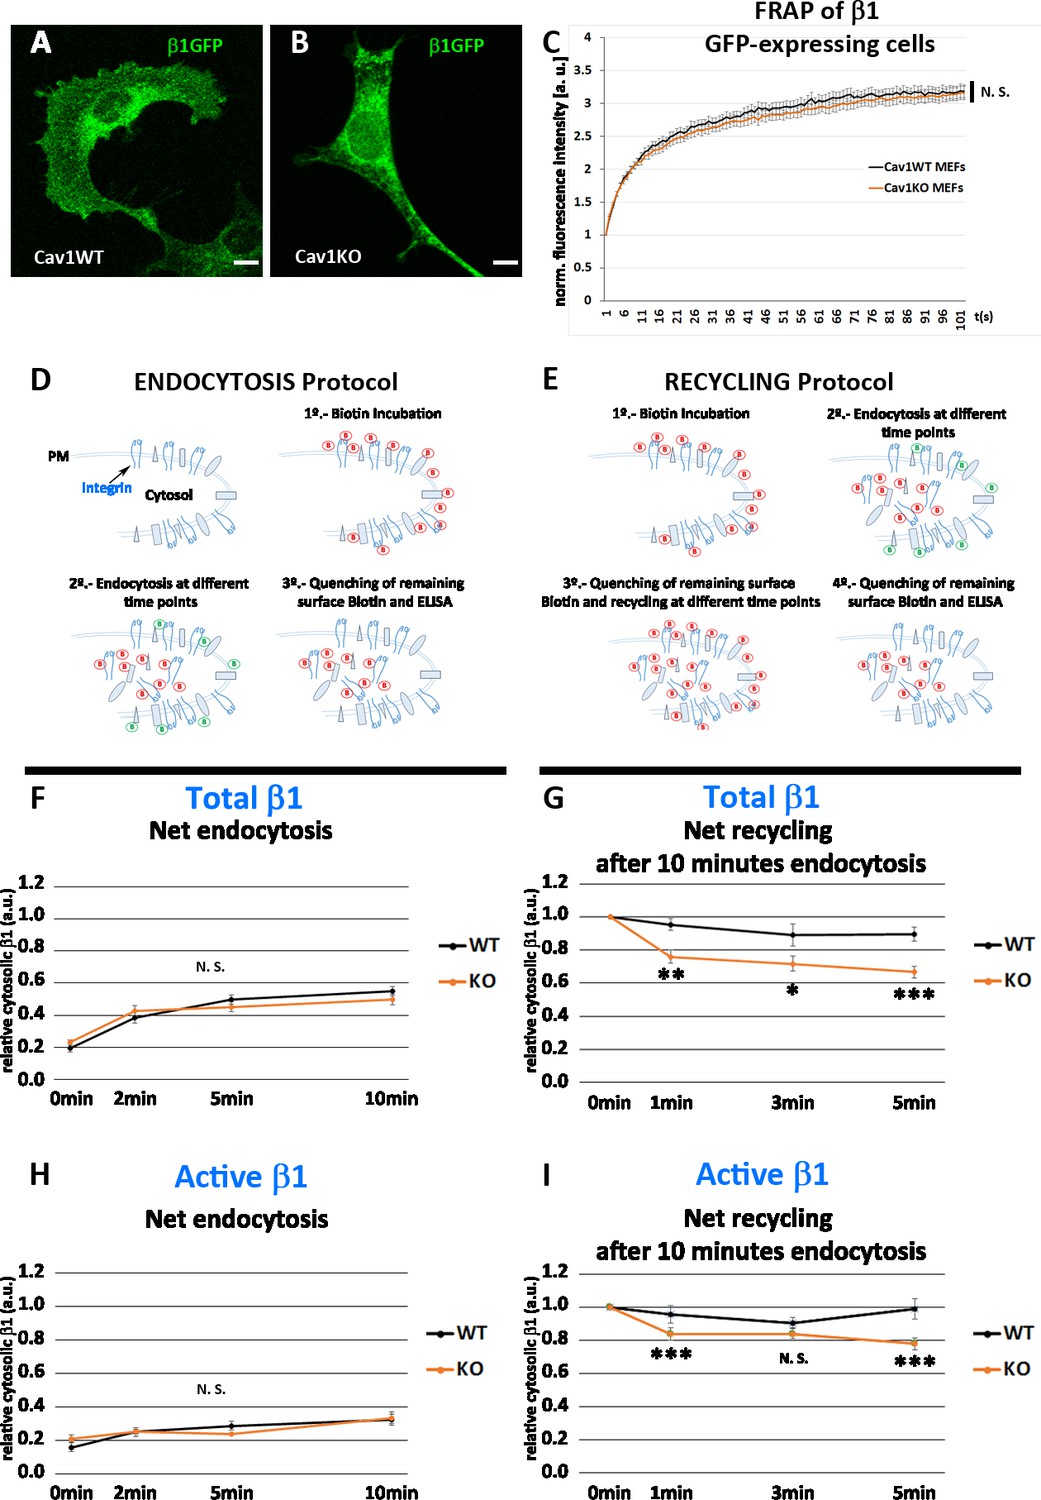
Cav1KO mouse embryonic fibroblasts (MEFs) show faster β1-integrin recycling.
(A and B) Confocal microscopy images of wild type and Cav1KO MEFs transfected with β1-integrin-GFP expression vector. Scale bar = 10 µm. (C) Normalized fluorescence intensity recovery after photo bleaching of wild type MEFs (black line) and Cav1KO MEFs (red line) at the indicated time points (the graph is representative of a minimum of nine independent experiments in which between 8 and 10 cells were bleached per genotype). Statistical significance of between time point differences was estimated by t-test; N. S., non-significant. (D and E) Experimental schemes for the analysis of endocytosis and recycling followed by ELISA (according to Li et al., 2016). (F and H) Net endocytosis of (F) total β1 integrin and (H) active β1-integrin in wild type and Cav1KO MEFs at the time points indicated. Net endocytosis is expressed as internalized biotinylated β1 integrin (cytosolic) at each time point normalized to total biotinylated β1-integrin (internal and surface bound; see Materials and methods); n≥6 endocytosis assays per genotype. (G and I) Net recycling after 10 min endocytosis of (G) total and (I) active β1-integrin in wild type and Cav1KO MEFs at the time points indicated. Net recycling is expressed as internal biotinylated β1 integrin (cytosolic) at each time point normalized to time point 0 (which contains all the biotinylated β1 integrin internalized after 10 min of endocytosis, see Materials and methods); then, decreasing values mean increased recycling; n=10 recycling assays per genotype. Data are presented as mean values +/- SEM. Statistical comparisons were by t-test, with significance of between-group differences denoted *p<0.05, **p<0.01, or ***p<0.001. N. S., non-significant.
-
Figure 4—source data 1
Raw data of experiments from Figure 4.
- https://cdn.elifesciences.org/articles/82348/elife-82348-fig4-data1-v4.xlsx
Figure 4—figure supplement 1
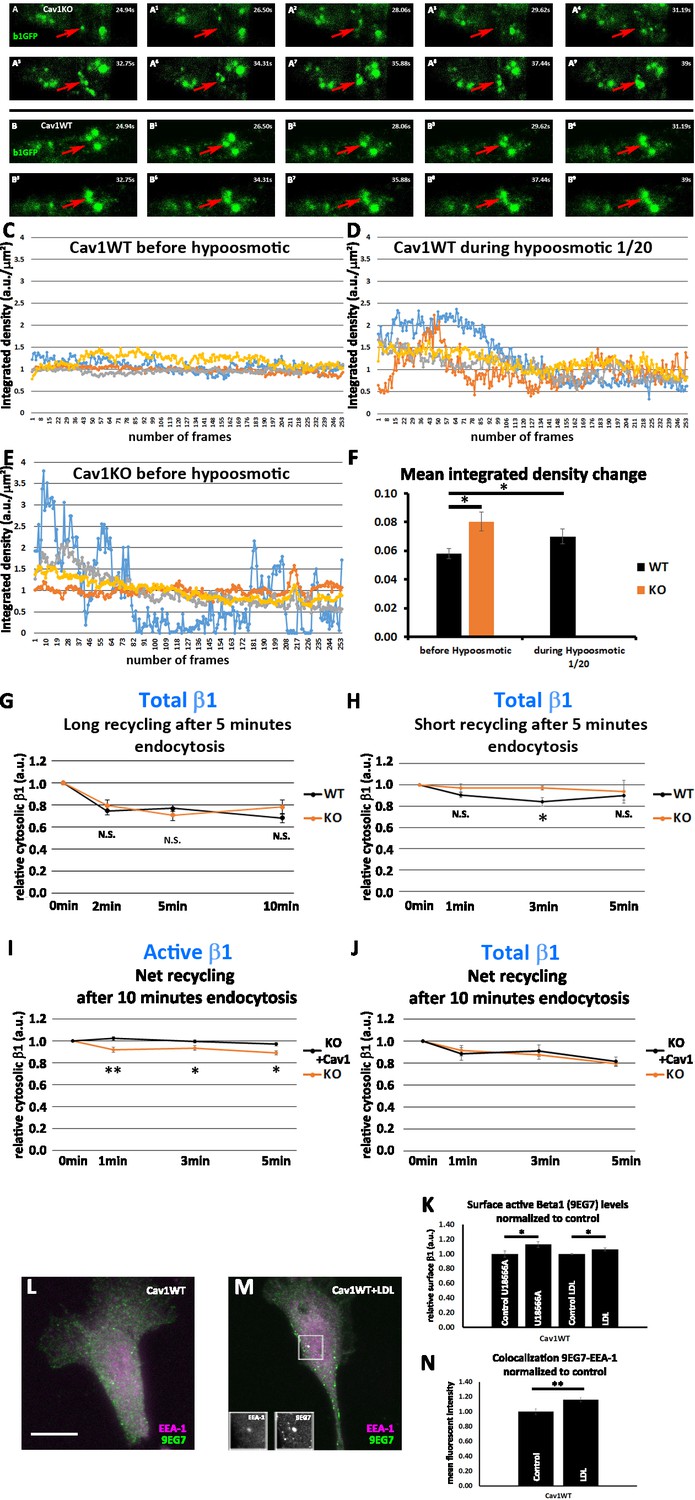
Cav1KO mouse embryonic fibroblasts (MEFs) show faster β1-integrin dynamics.
(A–A9) TIRFm image sequence (~1.5 s intervals) of Cav1KO mouse embryonic fibroblasts (MEFs) transfected with β1-integrin-GFP (green). Arrows indicate the dynamic behavior of GFP-positive vesicles in the TIRF plane. (B–B9) TIRFm image sequence (~1.5 s intervals) of wild type MEFs transfected with β1-integrin-GFP (green). Arrows indicate the stability of GFP-positive vesicles in the TIRF plane. (C–F) Quantification of TIRFm videos, represented as the change in normalized fluorescence integrated density, a measure of the mean fluorescence intensity in each video frame (see Materials and methods for details). (G and H) Net recycling after 5 min endocytosis of total β1-integrin in wild type and Cav1KO MEFs over (G) long time point set or (H) short time point set net recycling is expressed as internal biotinylated β1 integrin at each time point normalized to time point 0 (which contains all the biotinylated β1 integrin internalized after 5 min of endocytosis, see Materials and methods); n≥6 recycling assays per genotype. (I) Net recycling after 10 min endocytosis of active β1-integrin in Cav1KO and Cav1KO reconstituted with Cav1 MEFs at the time points indicated. Net recycling is expressed as internal biotinylated β1 integrin at each time point normalized to time point 0 (which contains all the biotinylated β1 integrin internalized after 10 min of endocytosis, see Materials and methods); n=6 recycling assays per genotype. (J) Net recycling after 10 min endocytosis of total β1-integrin in Cav1KO and Cav1KO reconstituted with Cav1 MEFs at the time points indicated. Net recycling is expressed as internal biotinylated β1 integrin at each time point normalized to time point 0 (which contains all the biotinylated β1 integrin internalized after 10 min of endocytosis, see Materials and methods); n=6 recycling assays per genotype. (K) Quantification of the impact on surface active β1-integrin levels in wild type MEFs of treatment with U18666A 2 µg/ml or low-density lipoprotein (LDL) 100 µg/ml for 24 hr. Values are expressed as normalized to control conditions across experiments; n≥18 replicates from at least six independent experiments. (L and M) Confocal microscopy images of wild type MEFs, stained for active β1-integrin (9EG7 antibody, green) and EEA1 (magenta), either non-treated (L) or treated with 100 µg/ml LDL for 24 hr (M). Insets show colocalizing structures. Scale bar = 10 µm. (N) Quantification of colocalization between EEA1 and 9EG7, expressed as Pearson’s correlation coefficient normalized by the mean of the control condition as indicated; n≥25 cells per condition. Data are presented as mean values +/- SEM. Statistical significance of differences across indicated conditions was assessed by t-test: *p<0.05; **p<0.01; N. S., non-significant.
-
Figure 4—figure supplement 1—source data 1
Raw data of experiments from Figure 4-figure supplement 1.
- https://cdn.elifesciences.org/articles/82348/elife-82348-fig4-figsupp1-data1-v4.xlsx
Figure 4—video 1
TIRFm video of a Cav1WT mouse embryonic fibroblast (MEF) transfected with β1-gfp expression vector.
Figure 4—video 2
TIRFm video of a Cav1KO mouse embryonic fibroblast (MEF) transfected with β1-gfp expression vector.
Figure 4—video 3
TIRFm video of a Cav1WT mouse embryonic fibroblast (MEF) transfected with β1-gfp expression vector, before hypoosmotic treatment.
Figure 4—video 4
TIRFm video of another Cav1WT mouse embryonic fibroblast (MEF) transfected with β1-gfp expression vector, before hypoosmotic treatment.
Figure 4—video 5
TIRFm video of Cav1WT mouse embryonic fibroblast (MEF) transfected with β1-gfp expression vector from Figure 4-video 3, during hypoosmotic treatment (1:20 DMEM dilution).
Figure 4—video 6
TIRFm video of a Cav1WT mouse embryonic fibroblast (MEF) transfected with β1-gfp expression vector from Figure 4-video 4, during hypoosmotic treatment (1:20 DMEM dilution).
Figure 5 with 1 supplement
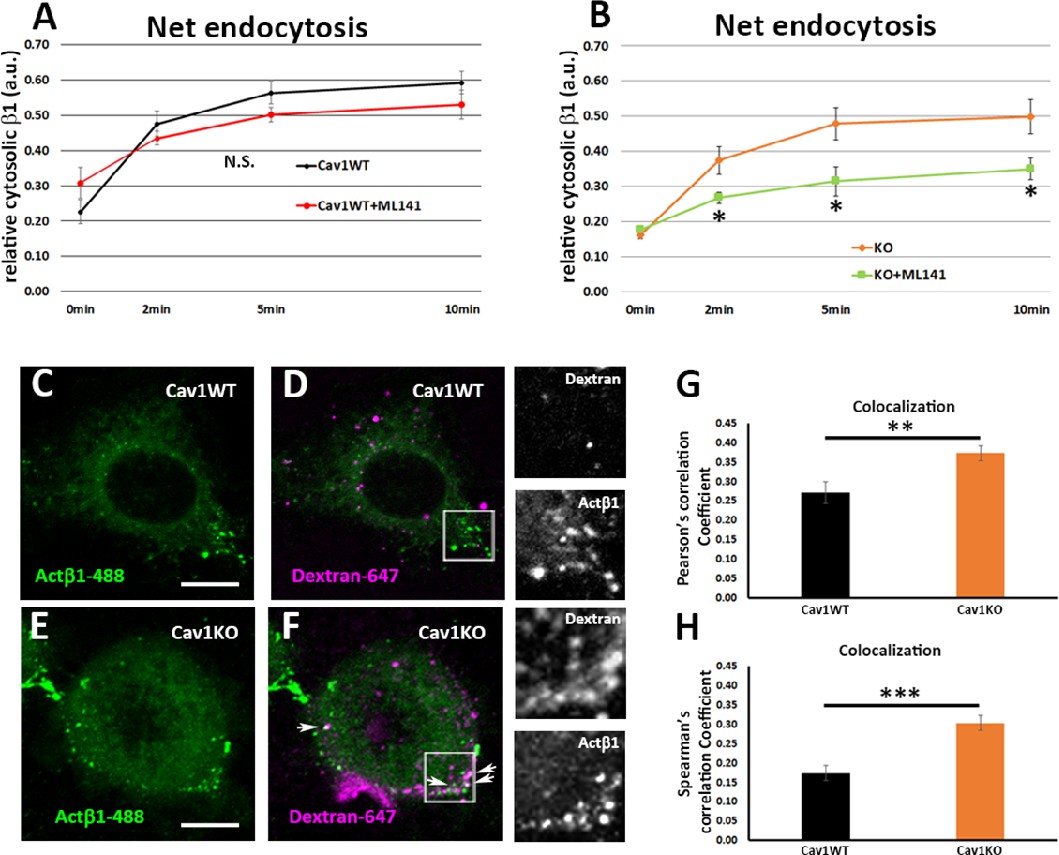
Cav1KO mouse embryonic fibroblasts (MEFs) take up β1-integrin by clathrin independent carrier (CLIC) endocytosis.
(A and B) Net endocytosis (normalized to Total biotinylated β1-integrin) at the time points indicated. (A) wild type MEFs treated with ML141 (red line) and untreated controls (black line). (B) Cav1KO MEFs treated with ML141 (green line) and untreated controls (orange line); n≥5 endocytosis assays per genotype. (C–F) Confocal microscopy images of wild type MEFs (C and D) and Cav1KO MEFs (E and F) incubated with anti-active β1-Alexa 488 antibody (green) for 1 hr at 4°C followed by incubation with dextran-Alexa 647 (magenta) for 3 min at 37°C. White arrows in F mark colocalization between β1–488–positive particles and dextran-647–positive particles in Cav1KO MEFs. Insets of both Cav1WT and Cav1KO (right side of each panel) show colocalizing structures. Scale bar = 10 µm. (G and H) Quantification of colocalization between active β1-Alexa 488 and dextran-647, expressed as Pearson’s correlation coefficient (G) or Spearman’s correlation coefficient normalized by the mean of Cav1WT MEFs (H); n≥18 cells per genotype. Data are presented as mean values +/- SEM. Statistical significance of differences across indicated conditions was assessed by t-test: *p<0.05 P**p<0.01; ***p<0.001 N. S., non-significant.
-
Figure 5—source data 1
Raw data of experiments from Figure 5.
- https://cdn.elifesciences.org/articles/82348/elife-82348-fig5-data1-v4.xlsx
Figure 5—figure supplement 1
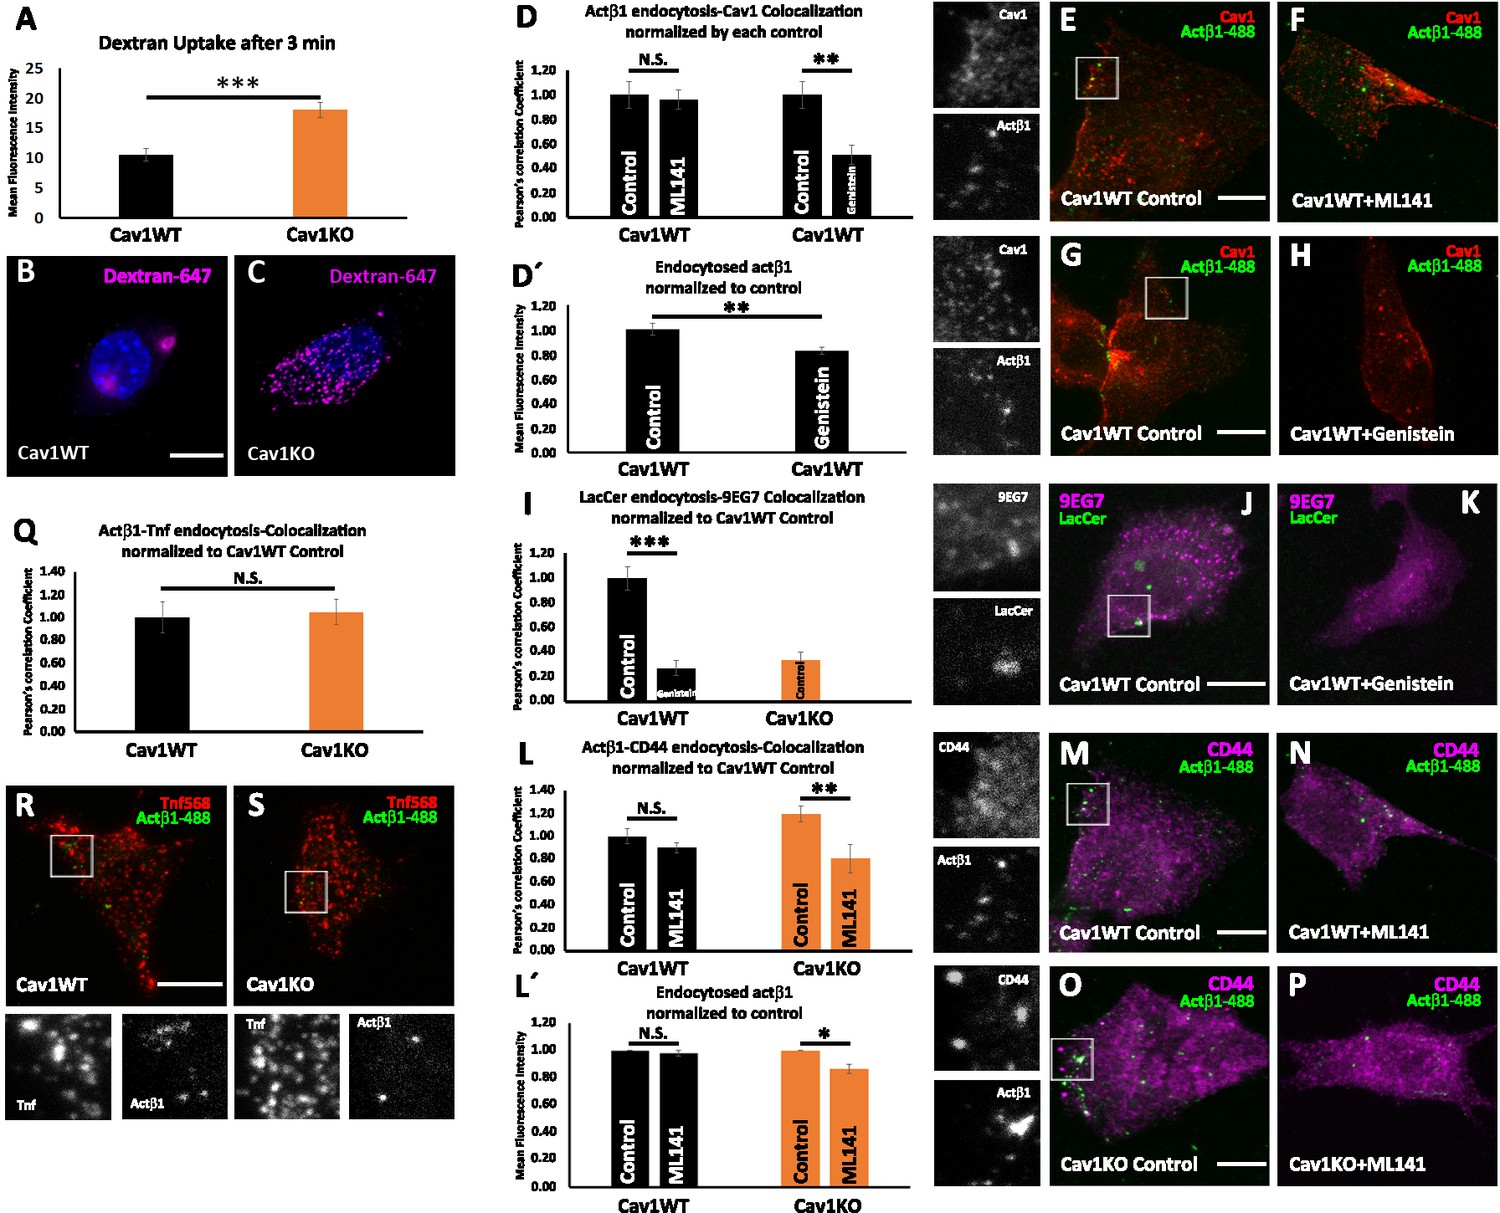
Cav1KO mouse embryonic fibroblasts (MEFs) show increased CLIC-dependent β1 integrin endocytosis.
(A) Quantification of Dextran-647 mean fluorescent intensity after 3 min of endocytosis at 37°C in wild type and Cav1KO mouse embryonic fibroblasts (MEFs); n≥25 cells per genotype. (B and C) Representative confocal microscopy images of (B) wild type MEFs and (C) Cav1KO MEFs after 3 min of Dextran-647 endocytosis. DAPI counterstain in shown in blue. Scale bar = 10 µm. (D) Quantification of colocalization between active β1-Alexa 488 and Caveolin1 in wild type MEFs either non-treated (control) or treated with ML141 inhibitor 10 uM for 30 min or genistein 200 uM for 2 hr followed by 3 min of endocytosis at 37°C, expressed as Pearson’s correlation coefficient normalized by the mean of the corresponding control condition as indicated; n≥10 cells per genotype. (D’) Quantification of mean fluorescence intensity of endocytosed active β1-integrin in Cav1WT either non-treated (control) or treated with genistein 200 uM for 2 hr. Values were normalized to mean fluorescence intensity of control; n≥9 cells per genotype and condition. (E–H) Representative confocal microscopy images of wild type MEFs either non-treated (E and G, control) or treated with ML141 10 uM for 30 min (F) or genistein 200 uM for 2 hr (H) before incubation with anti-active β1-Alexa 488 antibody (green) for 1 hr at 4°C followed by 3 min endocytosis at 37°C. Caveolin1 staining is shown in red (Cav1). Insets (left side) show colocalizing structures. Scale bar = 10 µm. (I) Quantification of colocalization between BODIPY-LacCer and active β1-integrin (9EG7) in wild type MEFs either non-treated (control) or treated with genistein 200 uM for 2 hr and Cav1KO MEFs non-treated, expressed as Pearson’s correlation coefficient normalized by the mean of the control condition as indicated; n=15 cells per genotype. (J and K) Representative confocal microscopy images of wild type MEFs either non-treated (J, control) or treated with genistein 200 uM for 2 hr before incubation with BODIPY-LacCer 5 uM (green) for 1 hr at 4°C followed by 3 min endocytosis at 37°C. BODIPY-LacCer remaining at the plasma membrane (PM) was then removed by back exchange at 4°C (see Materials and methods for more details). Active β1-integrin staining is shown in magenta (9EG7). Insets (left side) show colocalizing structures. Scale bar = 10 µm. (L) Quantification of colocalization between active β1-Alexa 488 and CD44 in wild type and Cav1KO MEFs either non-treated (control) or treated with ML141 inhibitor, expressed as Pearson’s correlation coefficient normalized by the mean of the control condition as indicated; n≥30 cells per genotype. (L’) Quantification of mean fluorescence intensity of endocytosed active β1-integrin in Cav1WT or Cav1KO MEFs either non-treated (control) or treated with ML141 inhibitor 10 uM for 30 min. Values were normalized to mean fluorescence intensity of control; n≥27 cells per genotype and condition of two independent replicates. (M–P) Representative confocal microscopy images of wild type and Cav1KO MEFs either non-treated (M and O, control) or treated with ML141 inhibitor 10 uM for 30 min before incubation with anti-active β1-Alexa 488 antibody (green) and anti-CD44 antibody (magenta) for 1 hr at 4°C followed by 3 min endocytosis at 37°C. Insets (left side) show colocalizing structures. Scale bar = 10 µm. (Q) Quantification of colocalization between active β1-Alexa 488 and Transferrin-568 (Tnf) in wild type and Cav1KO MEFs after 3 min endocytosis at 37°C, expressed as Pearson’s correlation coefficient normalized by the mean of the control condition as indicated; n=20 cells per genotype. (R and S) Representative confocal microscopy images of wild type and Cav1KO MEFs incubated with anti-active β1-Alexa 488 antibody (green) and Tnf-568 (magenta) for 1 hr at 4°C followed by 3 min endocytosis at 37°C. Insets (below) show colocalizing structures. Scale bar = 10 µm. Data are presented as mean values +/- SEM. Statistical significance of differences across indicated conditions was assessed by t-test: *p<0.05; **p<0.01; ***p<0.001 N. S., non-significant.
-
Figure 5—figure supplement 1—source data 1
Raw data of experiments from Figure 5—figure supplement 1.
- https://cdn.elifesciences.org/articles/82348/elife-82348-fig5-figsupp1-data1-v4.xlsx
Figure 6 with 1 supplement
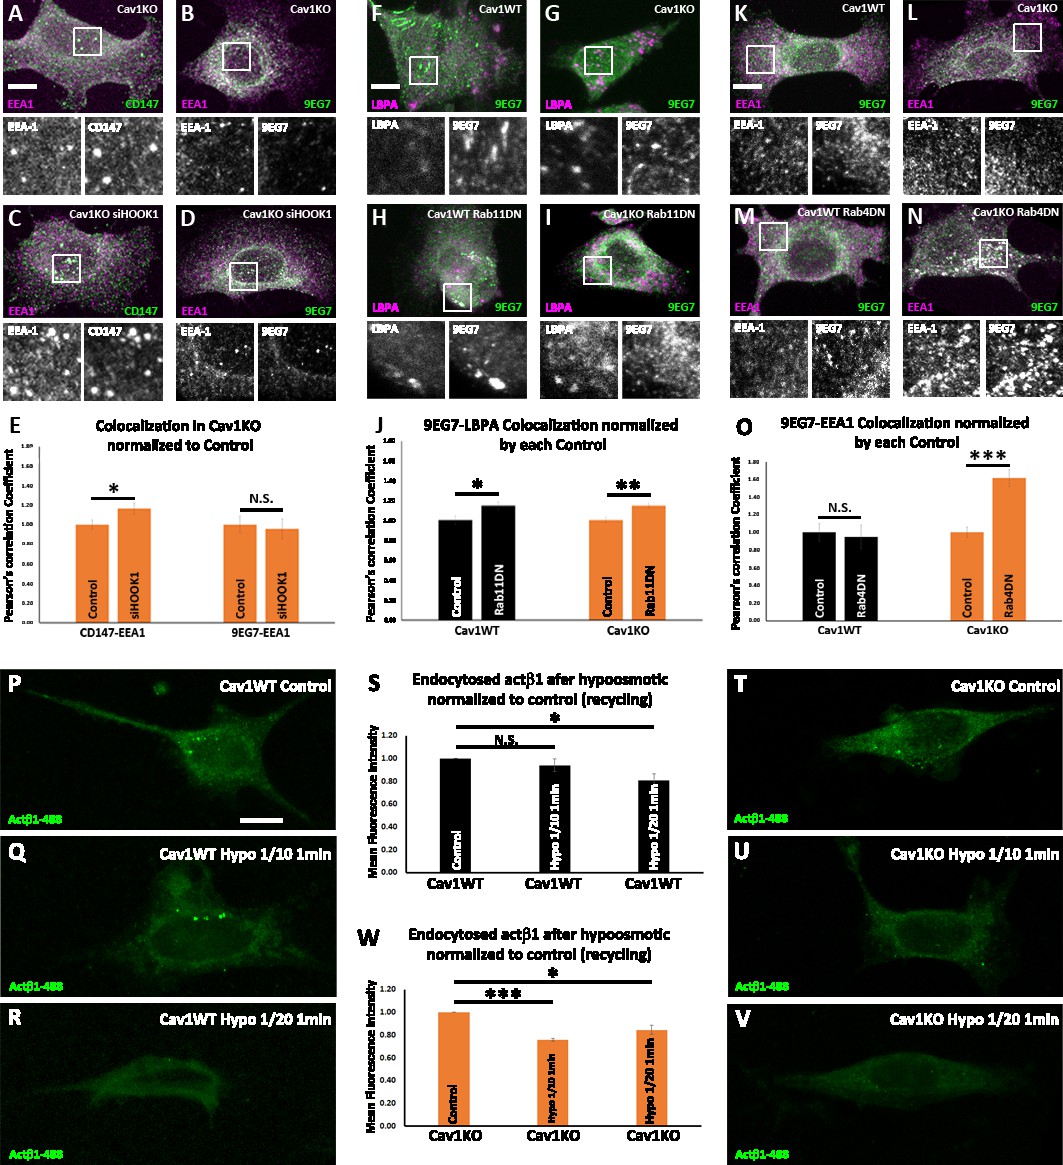
Cav1 is required for β1-integrin Rab11-dependent recycling.
(A–D) Confocal microscopy images of Cav1KO mouse embryonic fibroblasts (MEFs) stained for CD147 (green in A and C), active β1-integrin (9EG7 antibody, green in B and D) and EEA1 (magenta), either non-treated (A and B) or treated with siRNA against HOOK1 for 48 hr (C and D). Insets (below each panel) show colocalizing structures. Scale bar = 10 µm. (E) Quantification of colocalization between EEA1 and CD147 or 9EG7 normalized to control, expressed as Pearson’s correlation coefficient normalized by the mean of the corresponding control condition as indicated; n≥20 cells per condition. (F–I) Confocal microscopy images of wild type (F and H) or Cav1KO MEFs (G and I), stained for active β1-integrin (9EG7 antibody, green) and lysobisphosphatidic acid (LBPA) (magenta), either non-transfected (F and G) or transfected with Rab11 N124I dominant negative mutant for 48 hr (H and I). Insets (below each panel) show colocalizing structures. Scale bar = 10 µm. (J) Quantification of colocalization between LBPA and 9EG7 normalized by each control, expressed as Pearson’s correlation coefficient normalized by the mean of the corresponding control condition as indicated; n≥20 cells per condition. (K–N) Confocal microscopy images of wild type (K and M) or Cav1KO MEFs (L and N), stained for active β1-integrin (9EG7 antibody, green) and EEA-1 (magenta), either non-transfected (K and L) or transfected with Rab4 S22N dominant negative mutant for 48 hr (M and N). Insets (below each panel) show colocalizing structures. Scale bar = 10 µm. (O) Quantification of colocalization between EEA-1 and 9EG7 normalized to each control, expressed as Pearson’s correlation coefficient normalized by the mean of the corresponding control condition as indicated; n≥30 cells per condition. Colocalization was analyzed using the plugin intensity correlation analysis (Fiji Li et al., 2004). (P–V) Confocal microscopy images of wild type MEFs (P–R) and Cav1KO MEFs (T–V) incubated with anti-active β1-Alexa 488 antibody (green) for 1 hr at 4°C followed by 3 min endocytosis at 37°C. Remaining surface fluorescence was removed by acid stripping prior to fixation with paraformaldehyde (PFA) at 4%. Scale bar = 10 µm. Quantification of mean fluorescence intensity of endocytosed active β1-integrin in Cav1WT (S) or Cav1KO MEFs (W). Values were normalized to mean fluorescence intensity of control; n≥30 cells per genotype and condition. Data are presented as mean values +/- SEM. Statistical significance of differences across indicated conditions was assessed by t-test: * p<0.05; P**p<0.01; ***p<0.001 N. S., non-significant.
-
Figure 6—source data 1
Raw data of experiments from Figure 6.
- https://cdn.elifesciences.org/articles/82348/elife-82348-fig6-data1-v4.xlsx
Figure 6—figure supplement 1
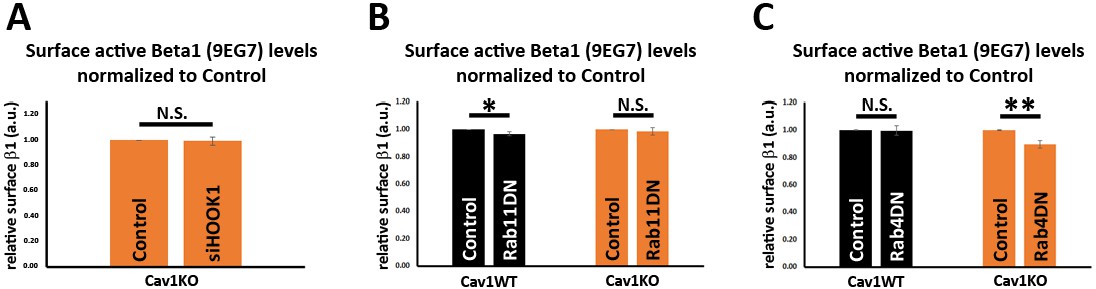
β1 integrin surface levels.
(A–C) Quantification of the impact on surface active β1-integrin levels in wild type or Cav1KO cells of: siRNA-mediated depletion against HOOK1 for 72 hr (A); expression of Rab4 S22N dominant negative mutant for 48 hr (B); expression of Rab11 N124I dominant negative mutant for 48 hr (C). Values are expressed as normalized to control conditions across experiments; n≥5 independent experiments. Statistical significance of differences across indicated conditions was assessed by t-test: * p<0.05; **p<0.01; ***p<0.001 N. S., non-significant.
-
Figure 6—figure supplement 1—source data 1
Raw data of experiments from Figure 6-figure supplement 1.
- https://cdn.elifesciences.org/articles/82348/elife-82348-fig6-figsupp1-data1-v4.xlsx
Figure 7 with 3 supplements
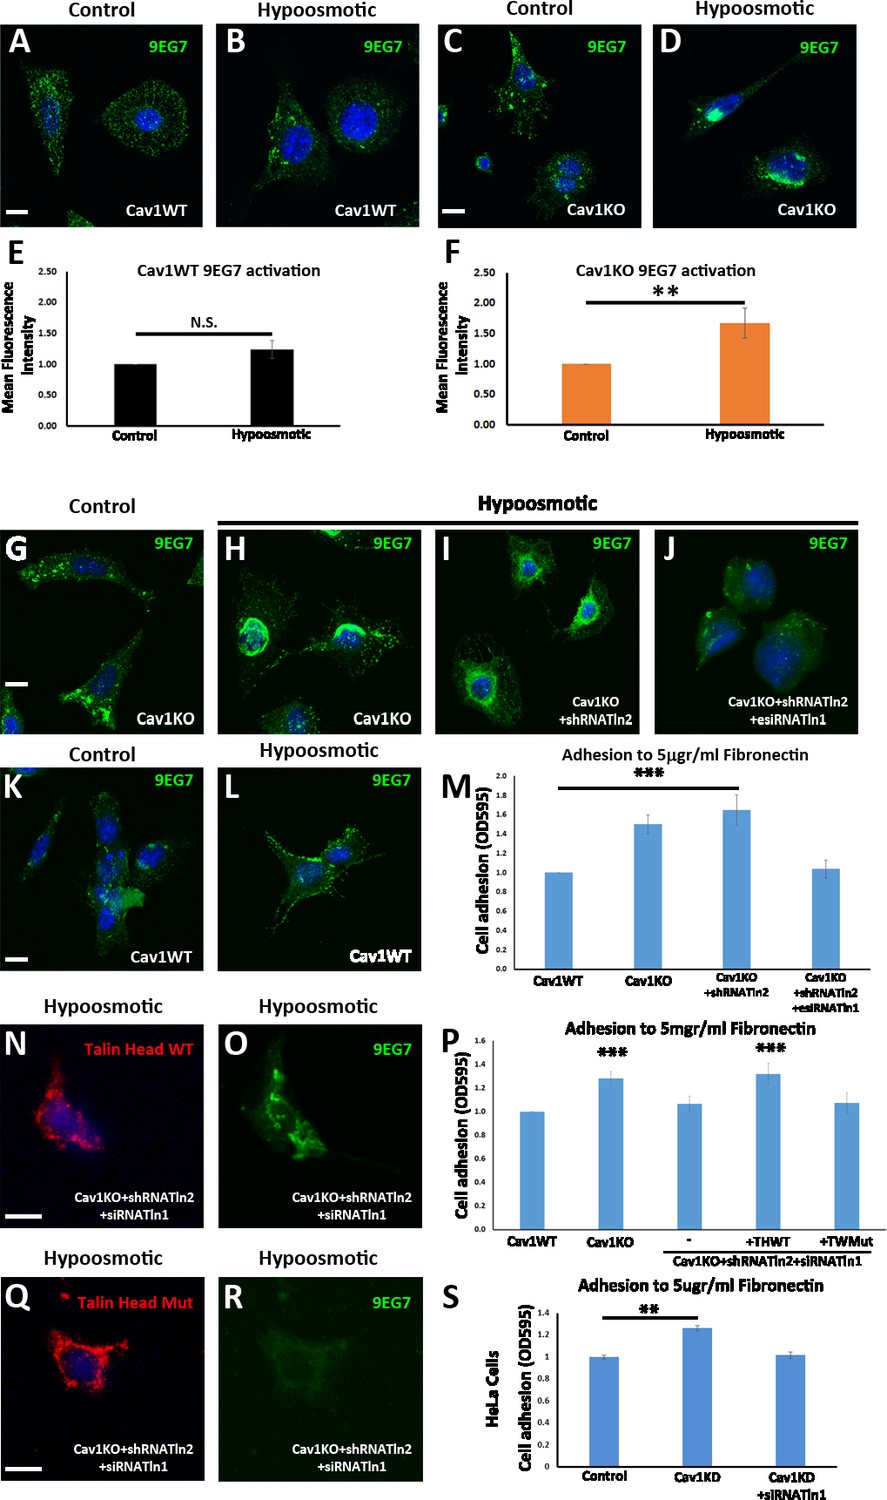
Talin is required for the enhanced adhesion and β1-integrin activation phenotype of Cav1KO mouse embryonic fibroblasts (MEFs).
(A–D) Confocal microscopy images of wild type MEFs (A and B) and Cav1KO MEFs (C and D) stained for active β1-integrin (9EG7 antibody, green) after culture in standard medium (control in A and C) or hypoosmotic medium (diluted 1:10; B and D) for 10 min at 37°C. DAPI is shown in blue. Scale bar = 10 µm. (E and F) Quantification of 9EG7 mean fluorescence intensity in control and hypoosmotic shock-exposed wild type (E) or Cav1KO MEFs (F). Values were normalized by each analyzed area and finally referred to area control; n≥35 cells per genotype. (G–J) Confocal microscopy images of active β1-integrin staining (9EG7 antibody, green) in Cav1KO MEFs subject to indicated RNAi treatments and cultured for 10 min at 37°C in standard medium (control) or hypoosmotic medium (diluted 1:10). Scale bar = 10 µm. (K and L) Active β1-integrin immunostaining in wild type MEFs cultured in standard (control) or hypoosmotic medium. DAPI counterstain is shown in blue. Scale bar = 10 µm. (M, P, and S) Relative adhesion of MEFs of the indicated genotypes (M and P) or HeLa Cells (S, wild type – control -; knocking down Cav1 -Cav1KD-; and knocking down both Cav1 and Talin1 -Cav1KD + siTnl1) to plates coated with 5 µg/ml fibronectin (FN). Values were normalized to control condition; n≥18 cells in three independent adhesion experiments. THWT: Talin head wild type; THMut: Talin head mutant. (N, O, Q, and R) Confocal microscopy images of talin head domain (N and Q) and active β1-integrin (9EG7 antibody; O and R) in Cav1KO MEFs transfected with Tln2 shRNA and Tln1 siRNA plus either WT Talin head (N and O) or mutant Talin head (Q and R). Before immunostaining, cells were cultured for 10 min at 37°C in hypoosmotic medium (diluted 1:10). DAPI is shown in blue. Scale bar = 10 µm. All immunostainings in this figure were performed following the extracellular staining after fixation (see Materials and methods for more details). Data are presented as mean values +/- SEM. Statistical significance of differences across indicated conditions was assessed by t-test: * p<0.05 P**p<0.01; ***p<0.001 N. S., non-significant.
-
Figure 7—source data 1
Raw data of experiments from Figure 7.
- https://cdn.elifesciences.org/articles/82348/elife-82348-fig7-data1-v4.xlsx
Figure 7—figure supplement 1
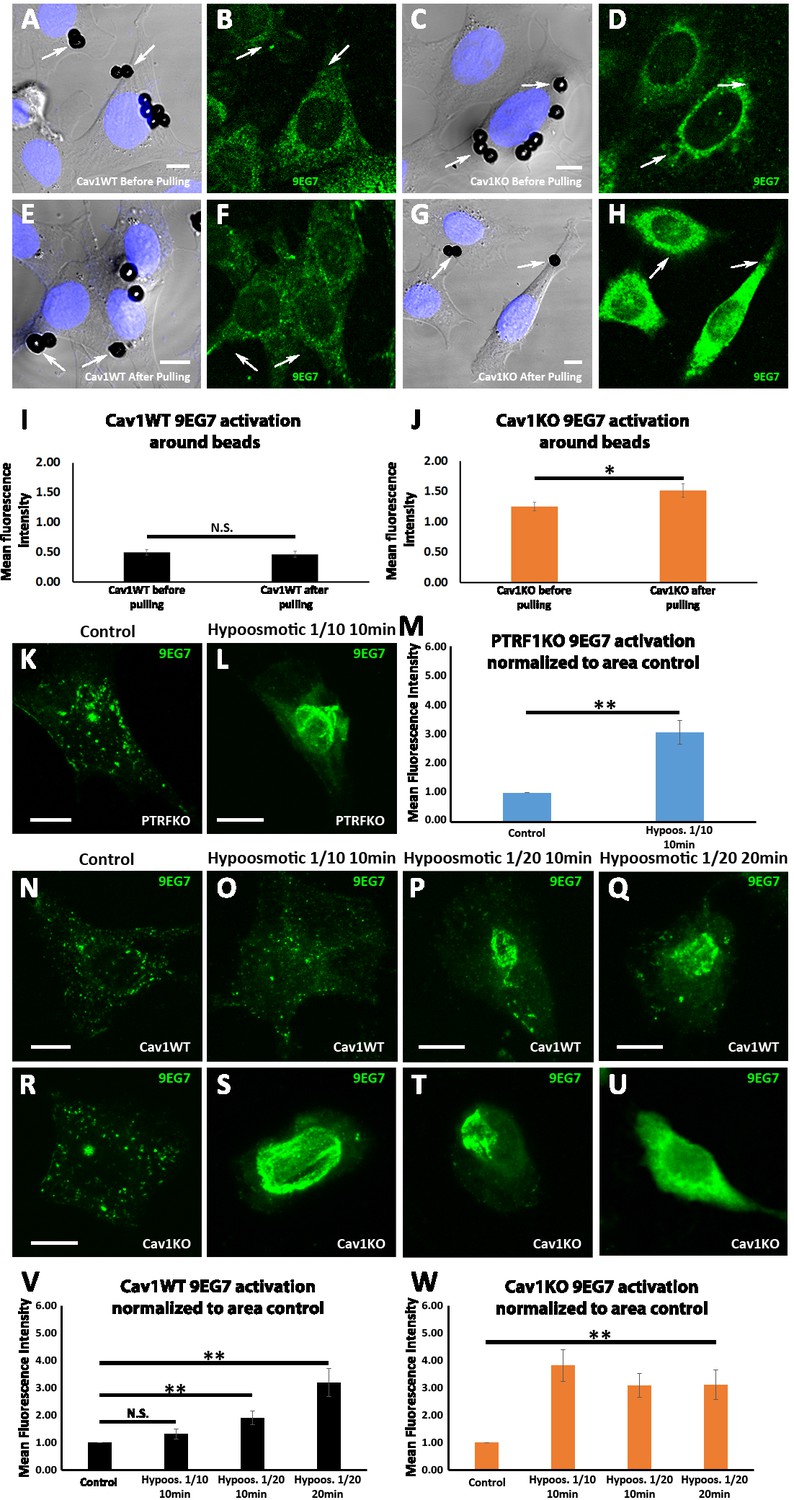
Cav1KO mouse embryonic fibroblasts (MEFs) show a lower β1 integrin activation threshold in response to mechanical stress.
(A–H) Confocal microscopy images of wild type and Cav1KO mouse embryonic fibroblasts (MEFs) before (A and B, C and D) and after (E and F, G and H) magnetic puling with fibronectin (FN)-coated ferromagnetic beads. Active β1-integrin is shown in green (9EG7 staining) and DAPI in blue. Arrows indicate staining around beads. Scale bar = 10 µm. (I and J) Mean bead-bound 9EG7 fluorescence intensity normalized by bead area of (I) wild type MEFs and (J) Cav1KO MEFs before and after magnetic pulling; n≥56 beads per genotype and condition. (K and L) Active β1-integrin immunostaining (9EG7, green) in PTRFKO MEFs cultured in standard (control) or hypoosmotic medium. Scale bar = 10 µm. (M) Quantification of 9EG7 mean fluorescence intensity in control and hypoosmotic shock-exposed PTRFKO MEFs; n≥30 cells per condition. Values were normalized by each analyzed area and finally referred to area control. (N–U) Active β1-integrin immunostaining (9EG7, green) in wild type (N–Q) or Cav1KO MEFs (R–U) cultured in standard (control) or in the different hypoosmotic conditions and time points indicated; n≥28 cells per genotype and condition. Scale bar = 10 µm. (V and W) Quantification of 9EG7 mean fluorescence intensity in control and hypoosmotic shock-exposed wild type (V) or Cav1KO (W) MEFs at the hypoosmotic and time points indicated. Values were normalized by each analyzed area and finally referred to area control. All immunostainings in this figure were performed following the extracellular staining after fixation (see Materials and methods for more details). Values were normalized to mean fluorescence intensity of control. Data are presented as mean values +/- SEM. Statistical comparisons were by t-test, with significance between groups denoted *p<0.05; **p<0.01; N. S., non-significant.
-
Figure 7—figure supplement 1—source data 1
Raw data of experiments from Figure 7-figure supplement 1I, J, M, V and W.
- https://cdn.elifesciences.org/articles/82348/elife-82348-fig7-figsupp1-data1-v4.xlsx
Figure 7—figure supplement 2
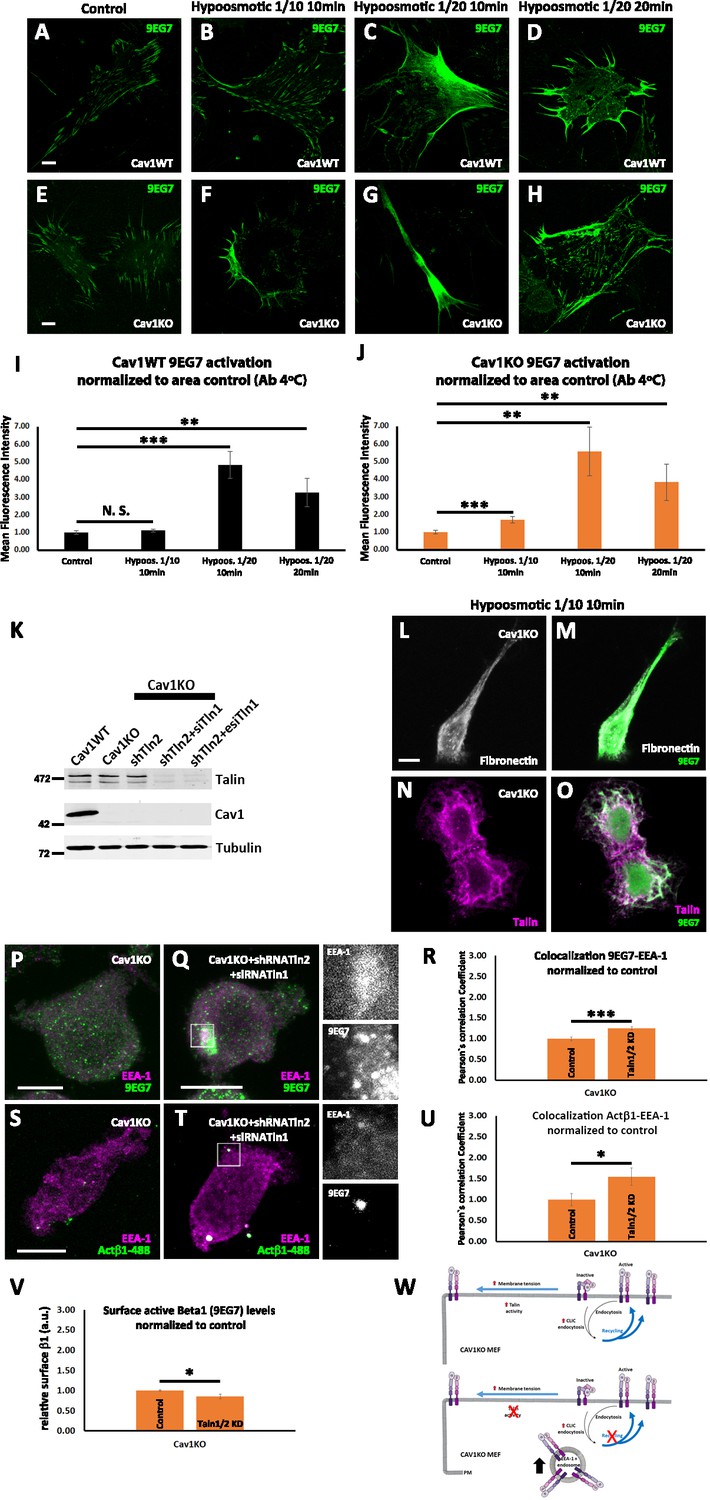
Talin regulates adhesion and β1-integrin activation in Cav1KO MEFs.
(A–H) Active β1-integrin immunostaining at 4°C for 1 hr before fixation (9EG7, green) in wild type (A–D) or Cav1KO mouse embryonic fibroblasts (MEFs) (E–H) before cultured in standard (control) or in the different hypoosmotic conditions and time points indicated; n≥28 cells per genotype and condition. Scale bar = 10 µm. (I and J) 9EG7 mean fluorescence intensity in control and hypoosmotic shock-exposed wild type (I) or Cav1KO (J) MEFs at the hypoosmotic and time points indicated. Values were normalized to mean fluorescence intensity of control. n≥33 cells per genotype and condition. (K) Western blot analysis of total lysates from wild type and Cav1KO MEFs, either non-treated (Cav1KO), or treated with either shRNA against Talin2 alone (shTln2) or a combination of shRNA against Talin2 and siRNA against Talin1 (shTln2 + siTln1 or shTln2 + esiTln1, see Materials and methods for details). Membranes were immunoblotted for Talin, Cav1, and tubulin (loading control, 50 kDa). (L–O) Confocal microscopy images of Cav1KO MEFs culture in hypoosmotic medium (diluted 1:10) for 10 min at 37°C, stained for active β1 integrin (9EG7 antibody, green) and fibronectin-FITC shown in gray, (L and M) or Talin shown in magenta, (N and O). Scale bar = 10 µm. (P and Q) Confocal microscopy images of Cav1KO MEFs, either non-treated (P), or treated with a combination of shRNA against Talin2 and siRNA against Talin1 (Q), stained for active β1 integrin (9EG7 antibody, green) and EEA-1 (shown in magenta). Scale bar = 10 µm. (R) Quantification of colocalization between 9EG7 and EEA-1 normalized to control, expressed as Pearson’s correlation coefficient normalized by the mean of the control condition as indicated; n=15 cells per condition. (S and T) Confocal microscopy images of Cav1KO MEFs, either non-treated (S), or treated with a combination of shRNA against Talin2 and siRNA against Talin1 (T) for 48 hr before incubation with anti-active β1-Alexa 488 antibody (green) for 1 hr at 4°C followed by 3 min endocytosis at 37°C. Cells were stained for EEA-1 (shown in magenta). Scale bar = 10 µm. (U) Quantification of colocalization between active β1-Alexa 488 and EEA-1 normalized to control, expressed as Pearson’s correlation coefficient normalized by the mean of the control condition as indicated; n≥14 cells per condition. (V) Quantification of the impact on surface active β1-integrin levels in Cav1KO cells of a combination of shRNA against Talin2 and siRNA against Talin1. Values are expressed as normalized to control; n=15 replicates from at least five independent experiments. Data are presented as mean values +/- SEM. Statistical comparisons were by t-test, with significance between groups denoted *p<0.05; **p<0.01; ***p<0.001; N. S., non-significant. (W) Schematic representation showing that talin activity not only regulates β1 integrin activation but also trafficking dynamics in Cav1KO MEFs.
-
Figure 7—figure supplement 2—source data 1
Raw data of experiments from Figure 7-figure supplement 2.
- https://cdn.elifesciences.org/articles/82348/elife-82348-fig7-figsupp2-data1-v4.xlsx
-
Figure 7—figure supplement 2—source data 2
Full raw unedited blot (corresponding to Figure 7—figure supplement 2K).
- https://cdn.elifesciences.org/articles/82348/elife-82348-fig7-figsupp2-data2-v4.pdf
-
Figure 7—figure supplement 2—source data 3
Uncropped blot with the relevant bands labelled (corresponding to Figure 7—figure supplement 2K).
- https://cdn.elifesciences.org/articles/82348/elife-82348-fig7-figsupp2-data3-v4.pdf
Figure 7—video 1
Example magnetic twisting experiment.
Note how beads move under the oscillating magnetic field.
Figure 8
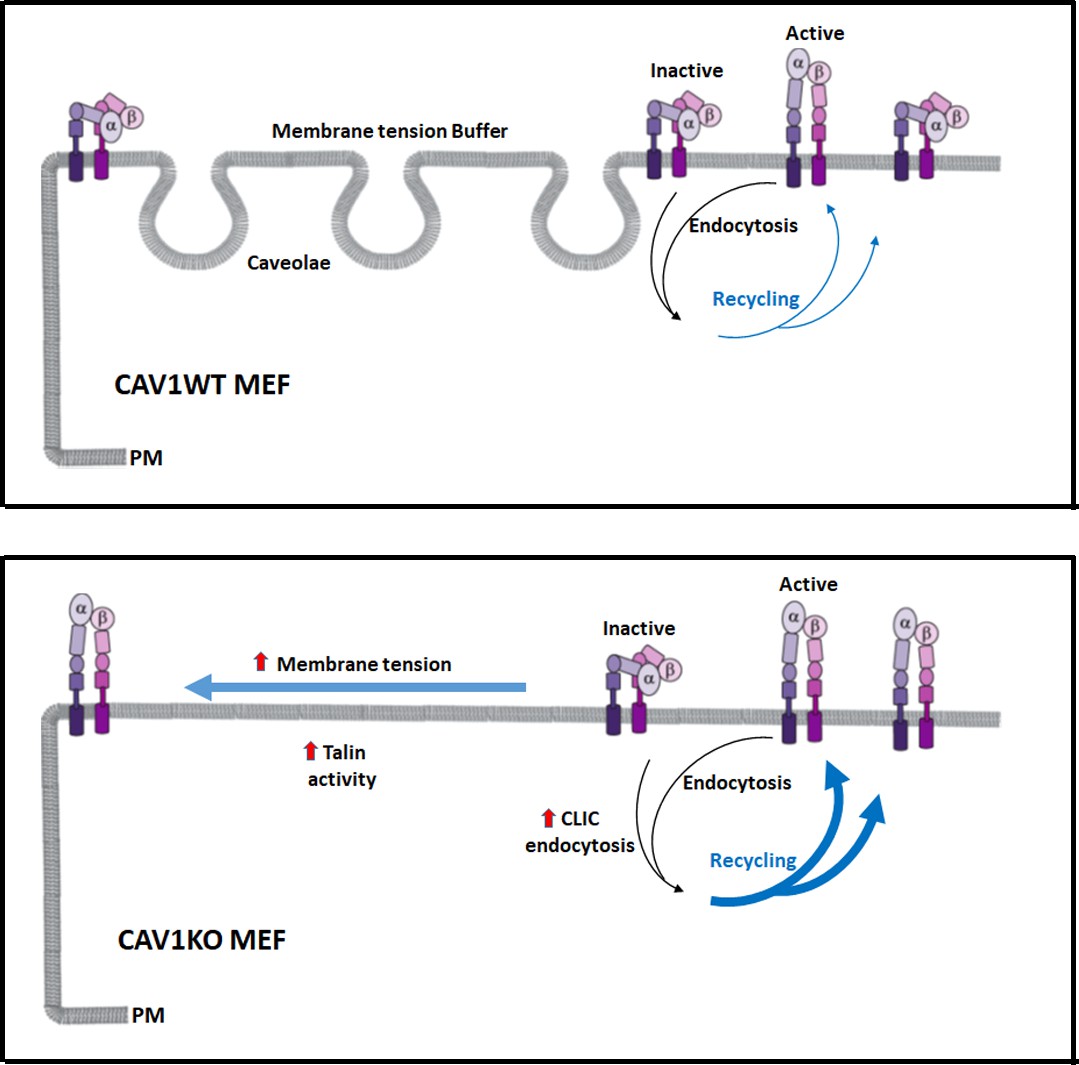
Caveolae adjust membrane tension to integrin mechanosensing by regulating integrin cycling and activation.
Wild type mouse embryonic fibroblasts (MEFs) adapt to membrane tension changes through the buffer system of caveolae, driving a physiological integrin mechanosensing (in this case α5β1-integrin). In the absence of caveolae, dysregulation of this response leads to increased plasma membrane (PM) tension, which accelerates integrin recycling and switches integrin from the inactive forms to the active forms (close vs open conformation, respectively). Both increased β1-integrin recycling and activation is supported by increased talin activity in the absence of caveolae.
Additional files
Download links
A two-part list of links to download the article, or parts of the article, in various formats.
Downloads (link to download the article as PDF)
Open citations (links to open the citations from this article in various online reference manager services)
Cite this article (links to download the citations from this article in formats compatible with various reference manager tools)
Caveolae couple mechanical stress to integrin recycling and activation
eLife 11:e82348.
https://doi.org/10.7554/eLife.82348


