Longitudinal fundus imaging and its genome-wide association analysis provide evidence for a human retinal aging clock
- Google Research, United States
- Buck Institute for Research on Aging, United States
- Google Health, United States
- Department of Biophysics, Post Graduate Institute of Medical Education and Research, India
- Department of Ophthalmology, Zuckerberg San Francisco General Hospital and Trauma Center, United States
- Department of Ophthalmology, University of California, San Francisco, United States
Figures
Figure 1
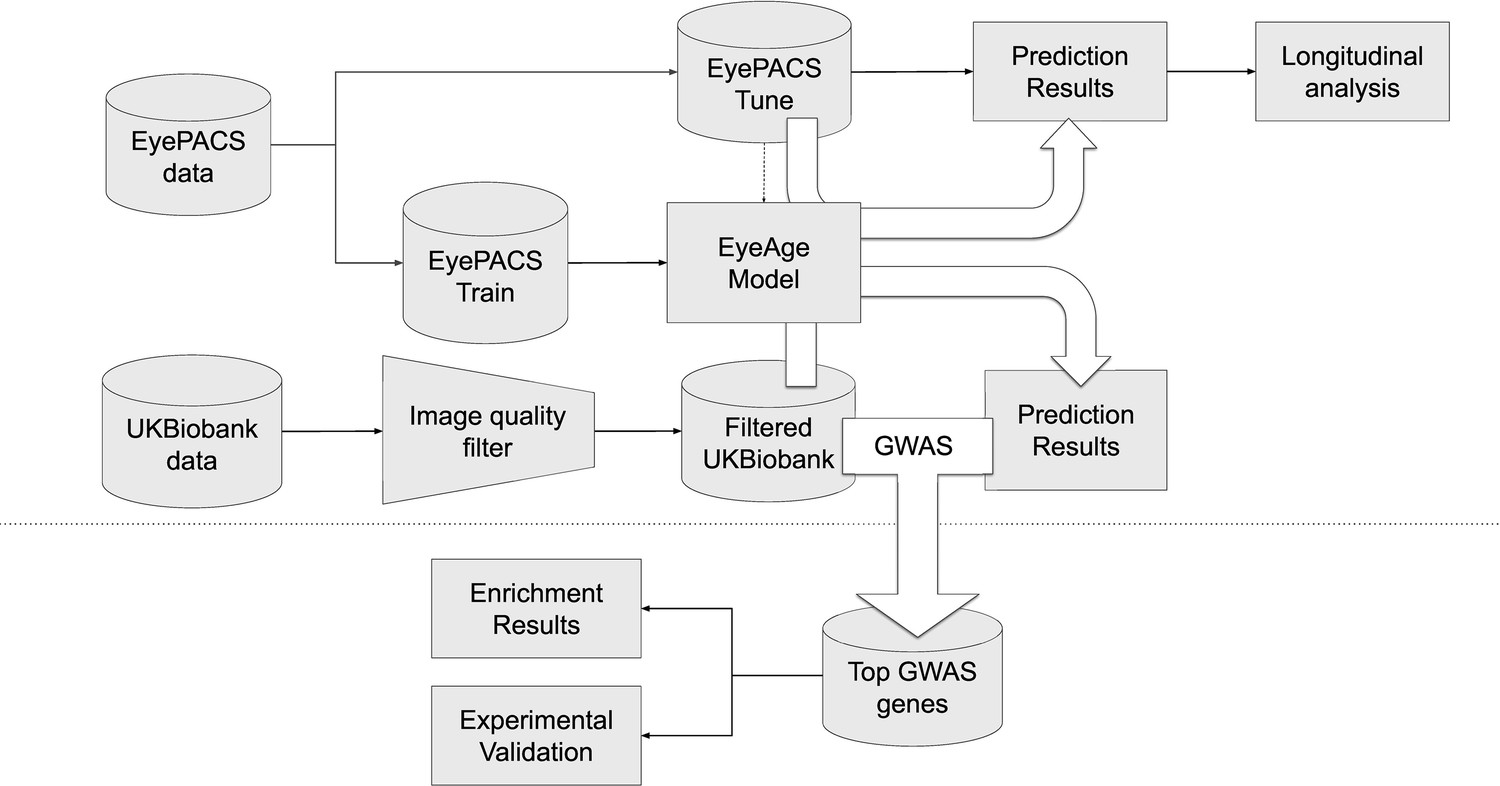
Schematic of analysis pipeline.
EyePACS images were split into train and tune sets based on the patient. The model was then trained with the final model step being selected via the tune set. Prediction results on the EyePACS tune set were used for longitudinal analysis of aging. After filtering for image quality, inference was performed with the same model on the UK Biobank dataset and filtering for image quality, and the resulting eyeAgeAccel was used for GWAS analysis. Enrichment analysis was performed on the GWAS hits with a homolog of the top gene (ALKAL2) validated experimentally in Drosophila.
Figure 2 with 3 supplements
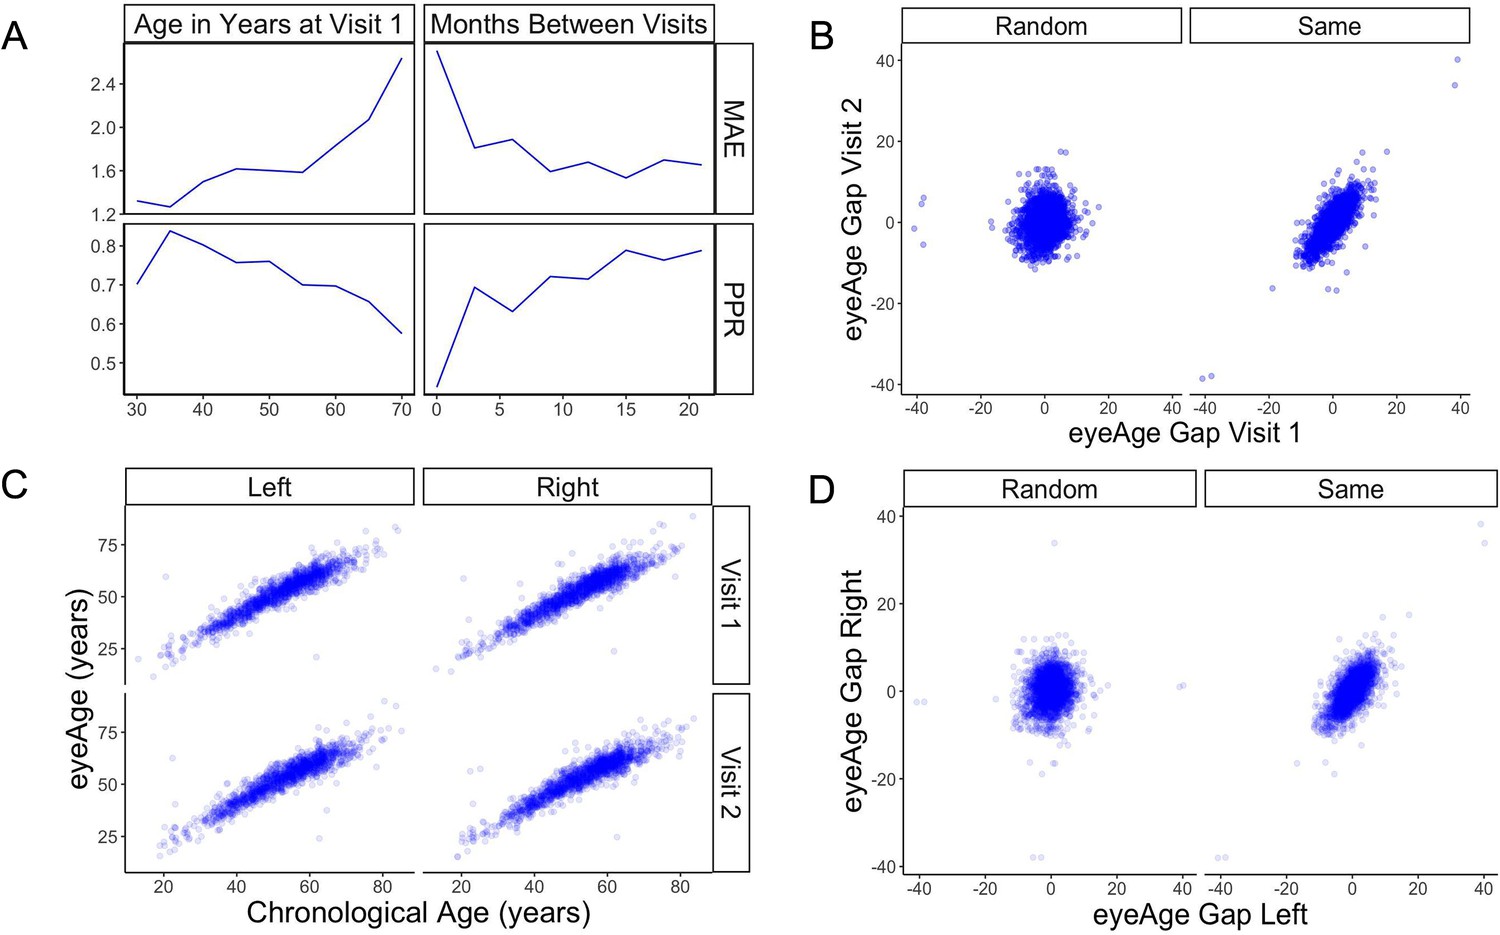
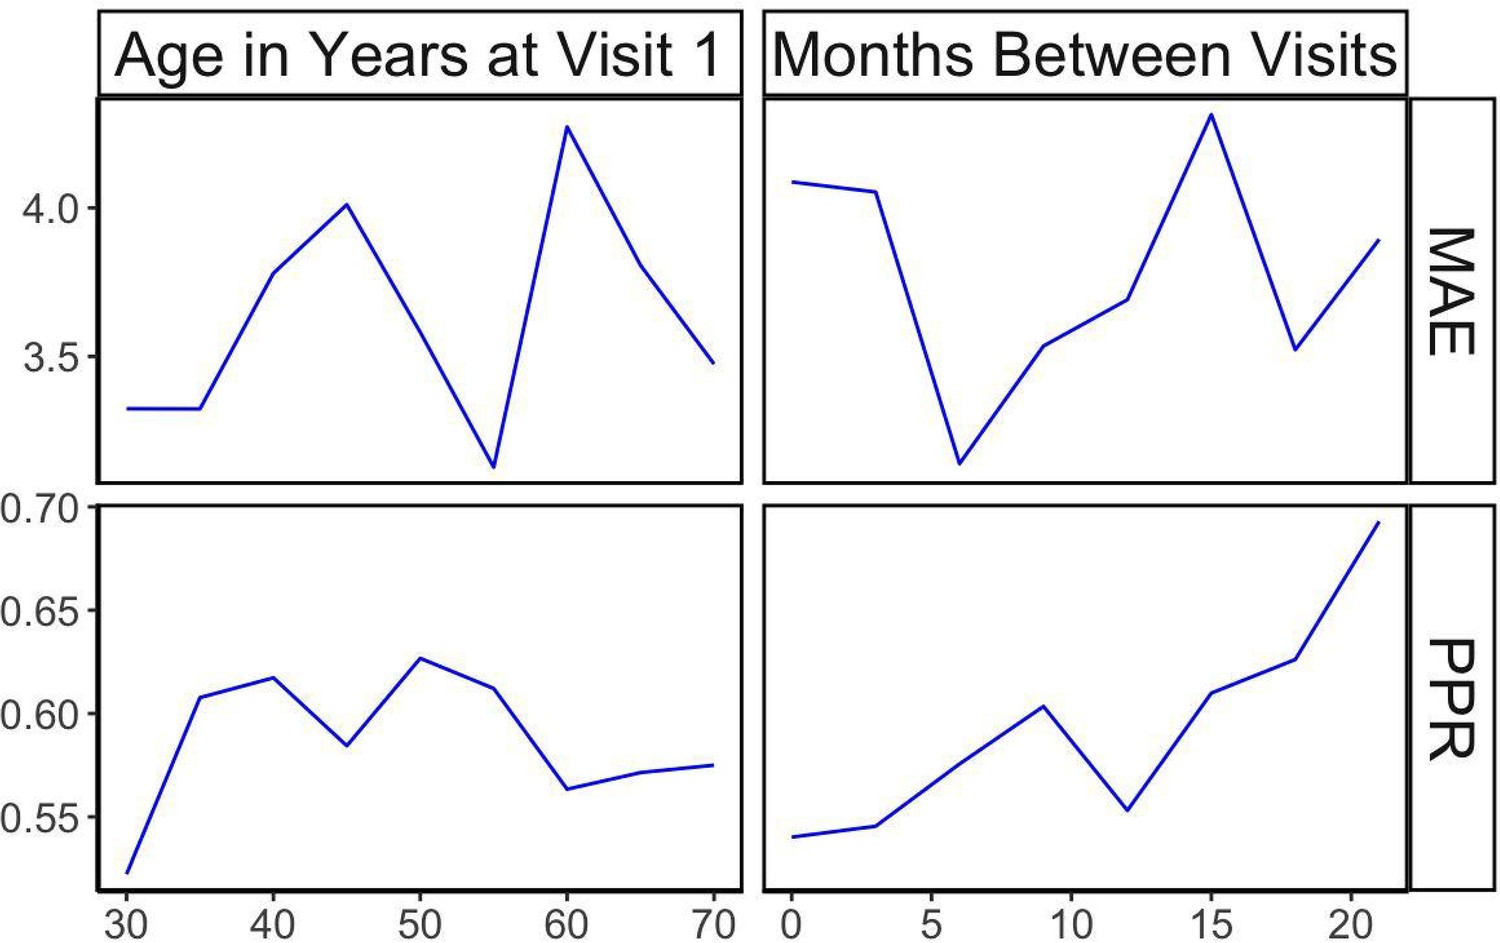
Longitudinal analysis of patients with exactly two visits in the EyePACS cohort.
(A) Changes of PPR (positive prediction ratio: the ratio of data whose eyeAge increased between subsequent visits) and MAE (mean absolute error) calculated on the same individual in relationship to chronological age at the first visit (left) and time between longitudinal visits (right). (B) Scatter plots representing correlation between eyeAge Gap (difference between predicted age and chronological age) of two consecutive visits from an individual (Same) or two consecutive visits from two different individuals (Random). (C) Correlation of eyeAge and chronological age between left and right and two consecutive visits of the same individual. (D) Scatter plots representing the correlation of left and right eyeAge Gap from the same or two random individuals.
-
Figure 2—source data 1
MAE and positive prediction ratio for time-matched and random individuals based on age at visit 1.
- https://cdn.elifesciences.org/articles/82364/elife-82364-fig2-data1-v2.zip
-
Figure 2—source data 2
MAE and positive prediction ratio for time-matched and random individuals based on months between visits.
- https://cdn.elifesciences.org/articles/82364/elife-82364-fig2-data2-v2.zip
-
Figure 2—source data 3
Age gap for random and time-matched individuals at visit 1 and 2.
- https://cdn.elifesciences.org/articles/82364/elife-82364-fig2-data3-v2.zip
-
Figure 2—source data 4
Chronological and predicted age for left and right eye.
- https://cdn.elifesciences.org/articles/82364/elife-82364-fig2-data4-v2.zip
-
Figure 2—source data 5
Age gap for random and time-matched individuals for left and right eyes.
- https://cdn.elifesciences.org/articles/82364/elife-82364-fig2-data5-v2.zip
-
Figure 2—source data 6
Scatter plot of eyeAge with chronological age.
- https://cdn.elifesciences.org/articles/82364/elife-82364-fig2-data6-v2.zip
Figure 2—figure supplement 1
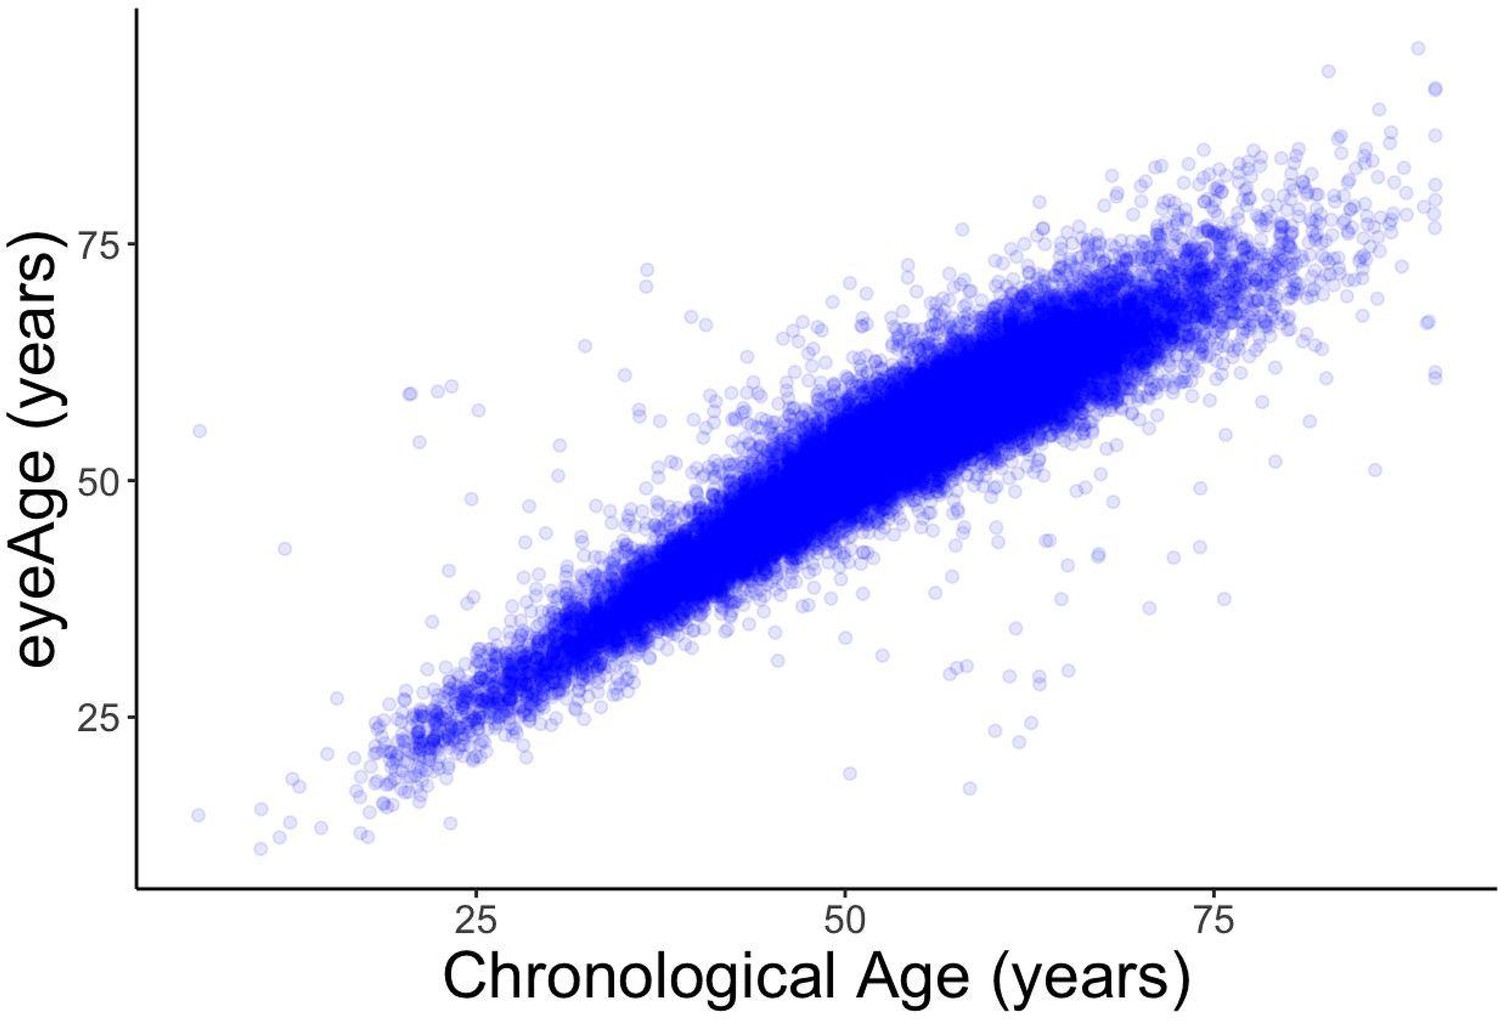
Scatter plot of eyeAge with chronological age (Pearson ⍴=0.96).
Figure 2—figure supplement 2
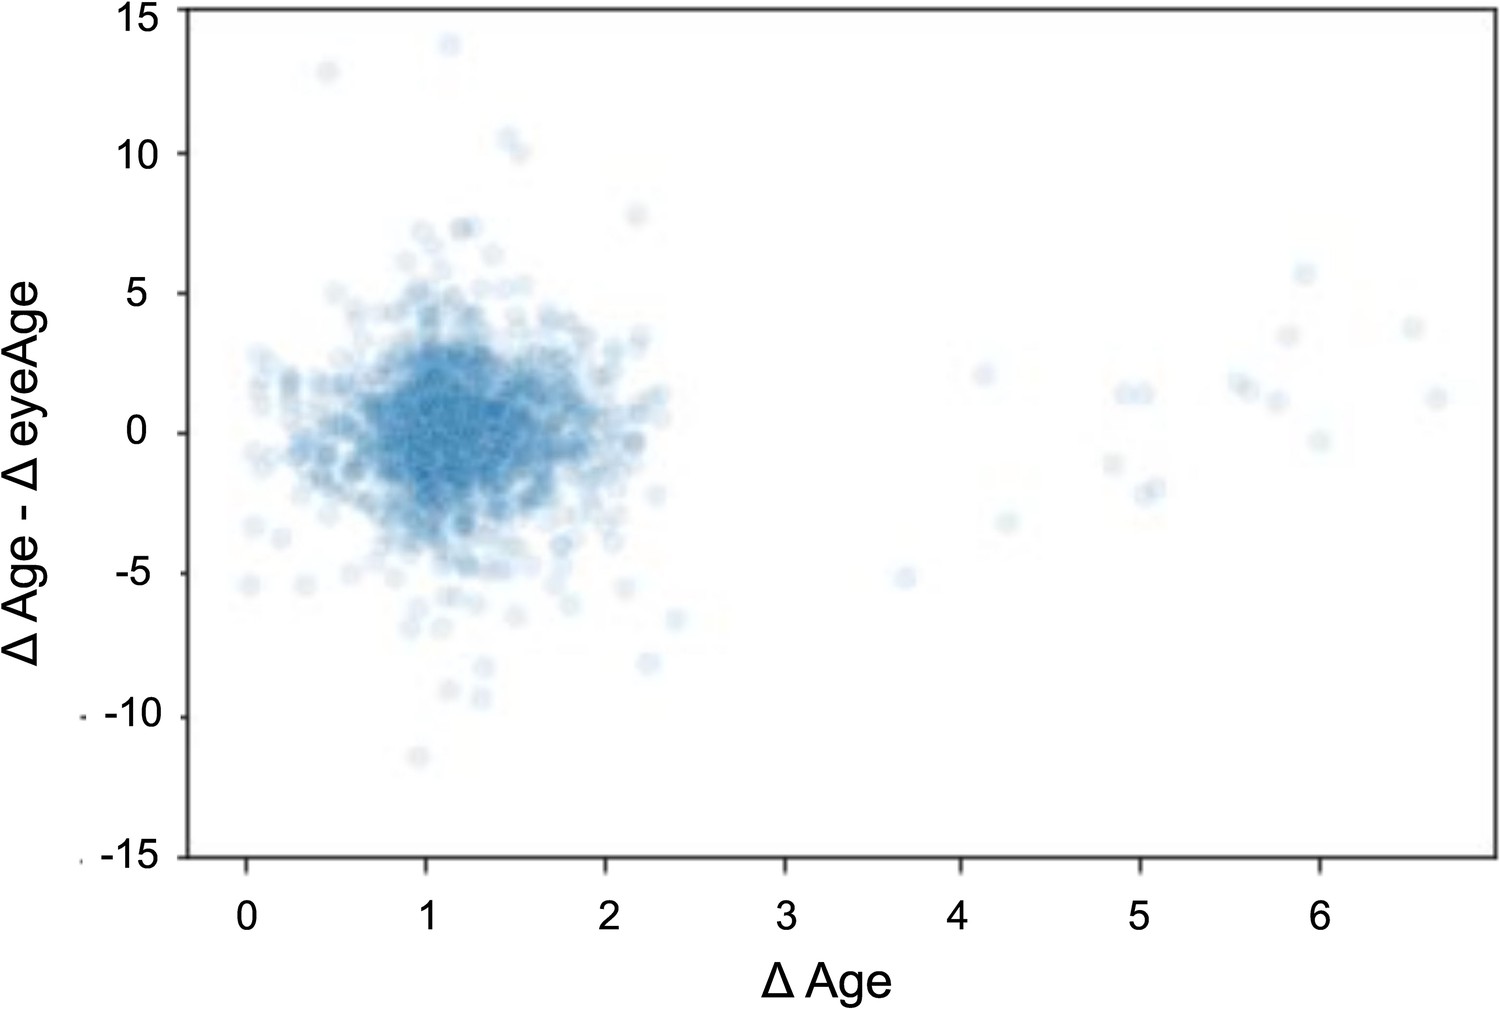
Scatterplot showing the time elapsed (x-axis) vs. the difference between time elapsed and change in eyeAge (y-axis).
Figure 2—figure supplement 3
Positive prediction ratio and MAE for random, time-matched individuals.
Plots shown in relationship to chronological age (left) and time between longitudinal visits (right).
Figure 3 with 2 supplements
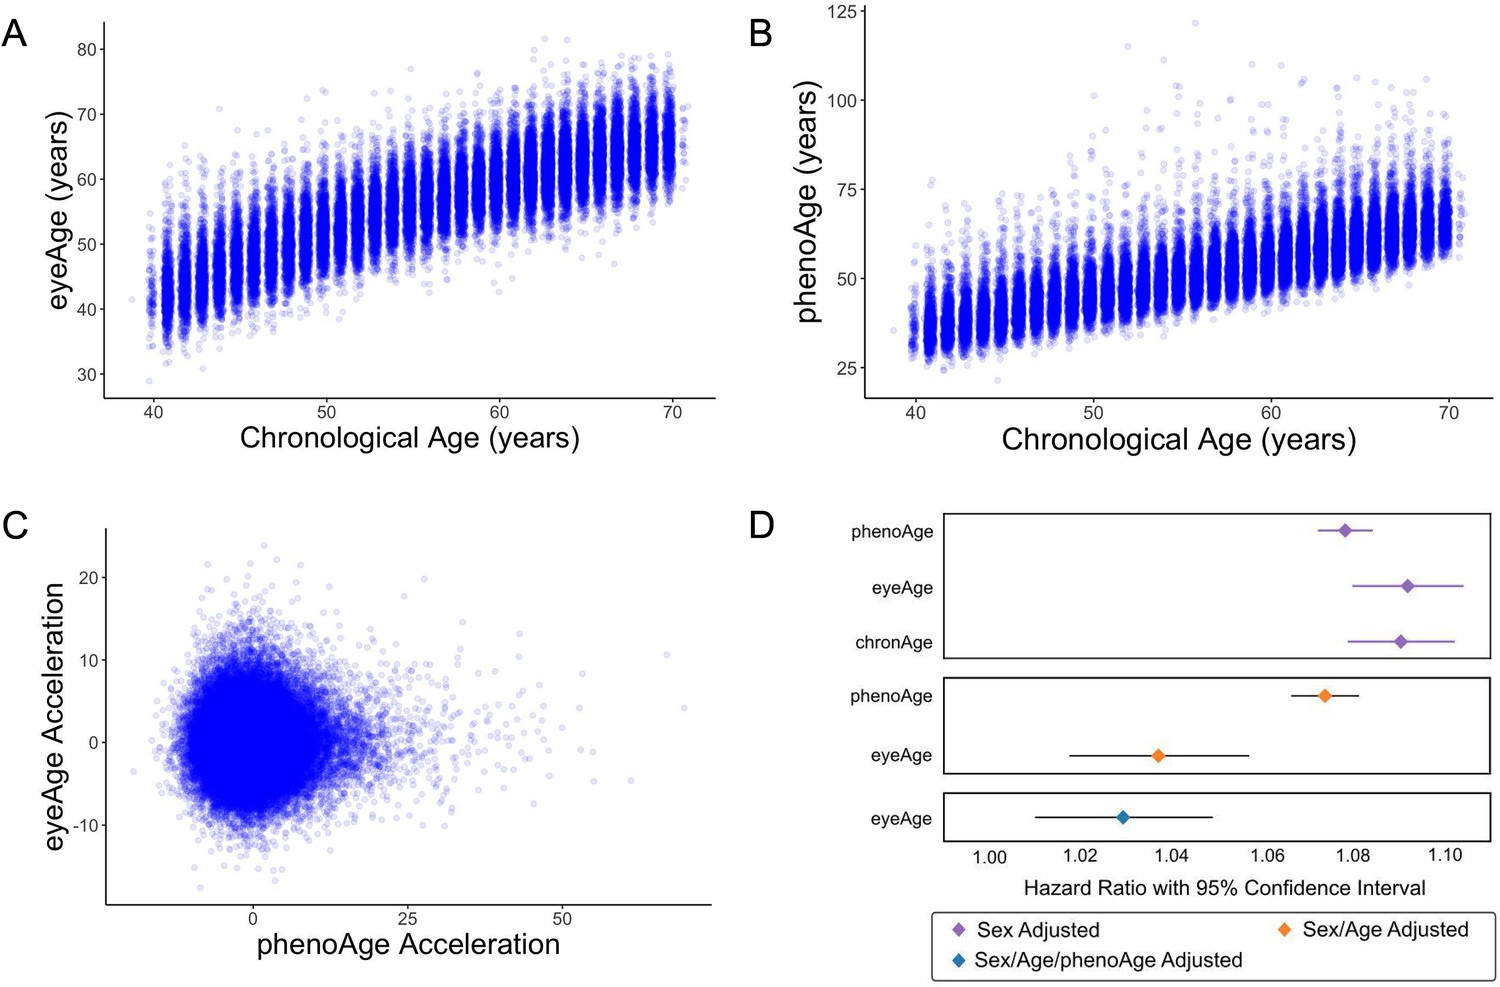
Relationships between eyeAge, phenoAge, and chronological age in the UK Biobank cohort.
(A) Correlation between eyeAge and chronological age (Pearson ⍴=0.86). (B) Correlation between phenoAge and chronological age (Pearson ⍴=0.82). (C) Correlation between eyeAgeAcceleration and phenoAgeAcceleration (Pearson ⍴=0.12). (D) Forest plot of all-cause mortality hazard ratios (diamonds) and confidence intervals (lines) for the UK Biobank dataset. Purple lines are adjusted only for sex; orange lines are adjusted for sex and age; blue lines are adjusted for sex, age, and phenoAge.
-
Figure 3—source data 1
Age, eyeAge, phenoAge, eyeAge Acceleration and phenoAge Acceleration values for each individual.
- https://cdn.elifesciences.org/articles/82364/elife-82364-fig3-data1-v2.zip
Figure 3—figure supplement 1
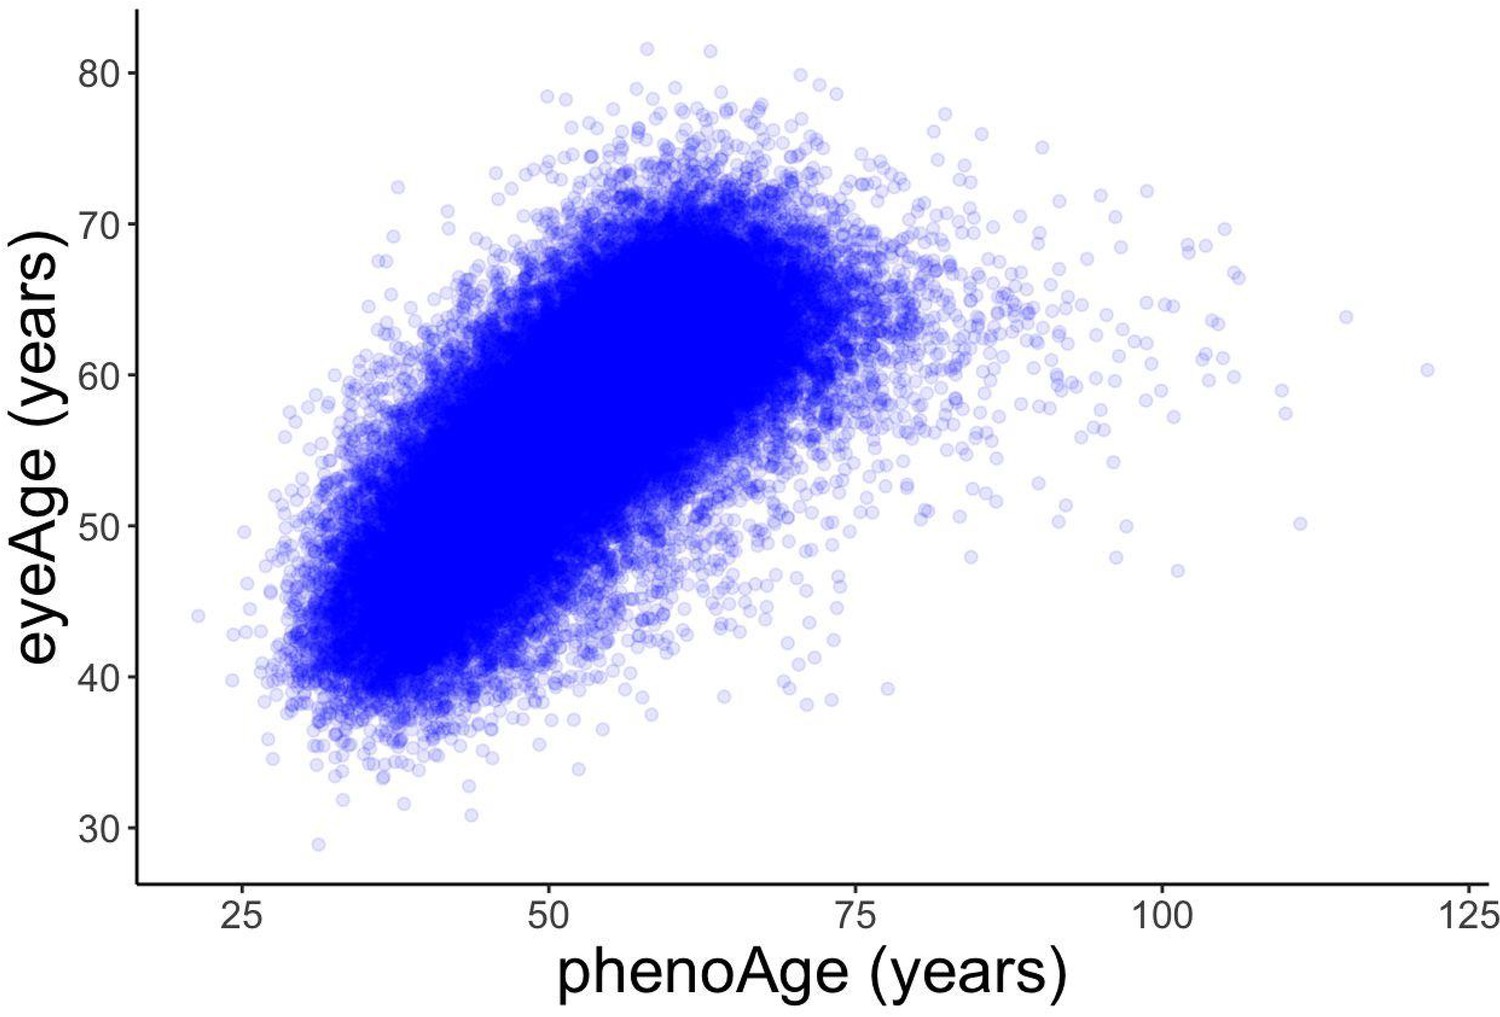
Scatter plot of eyeAge and phenoAge (Pearson ⍴=0.71).
Figure 3—figure supplement 2
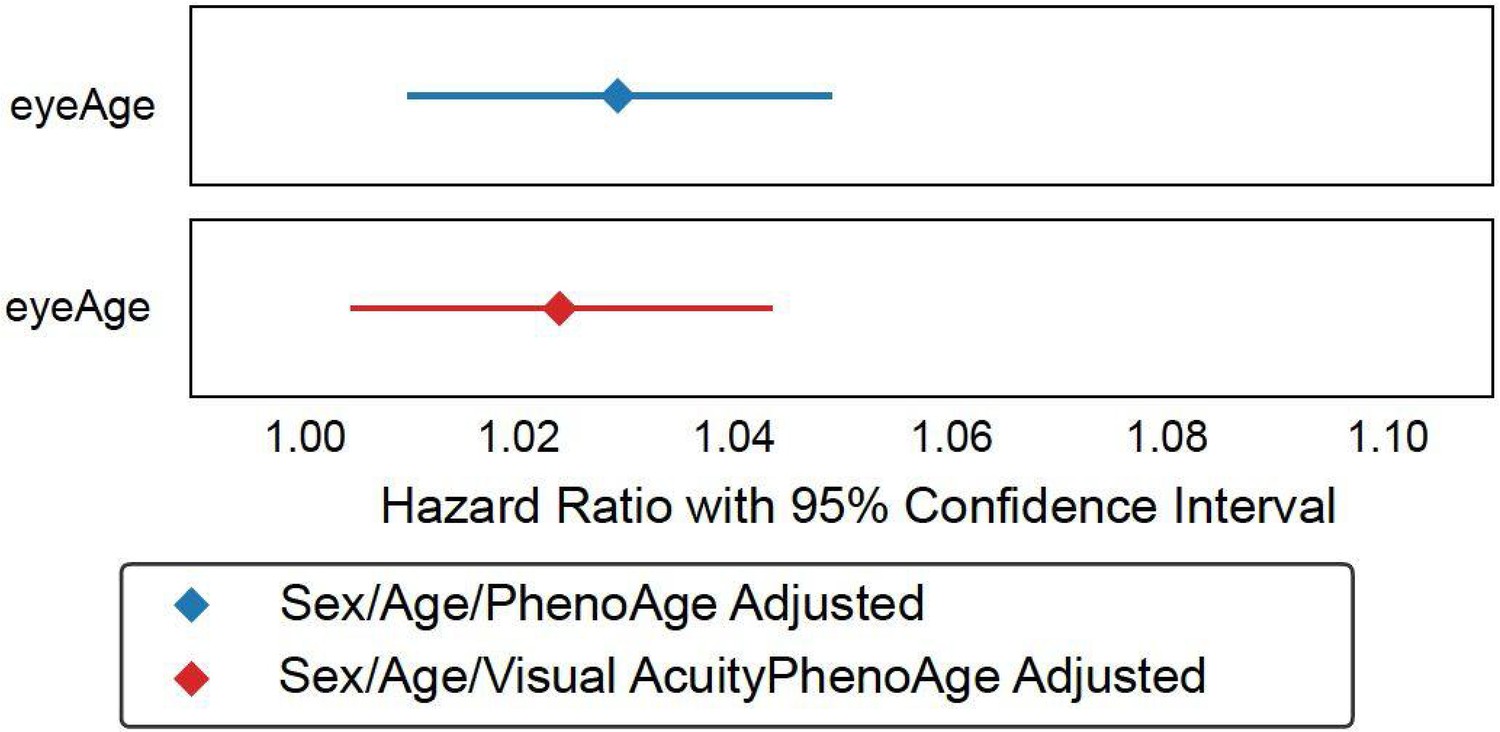
eyeAge hazard ratio adjusted with and without visual acuity.
Figure 4 with 2 supplements
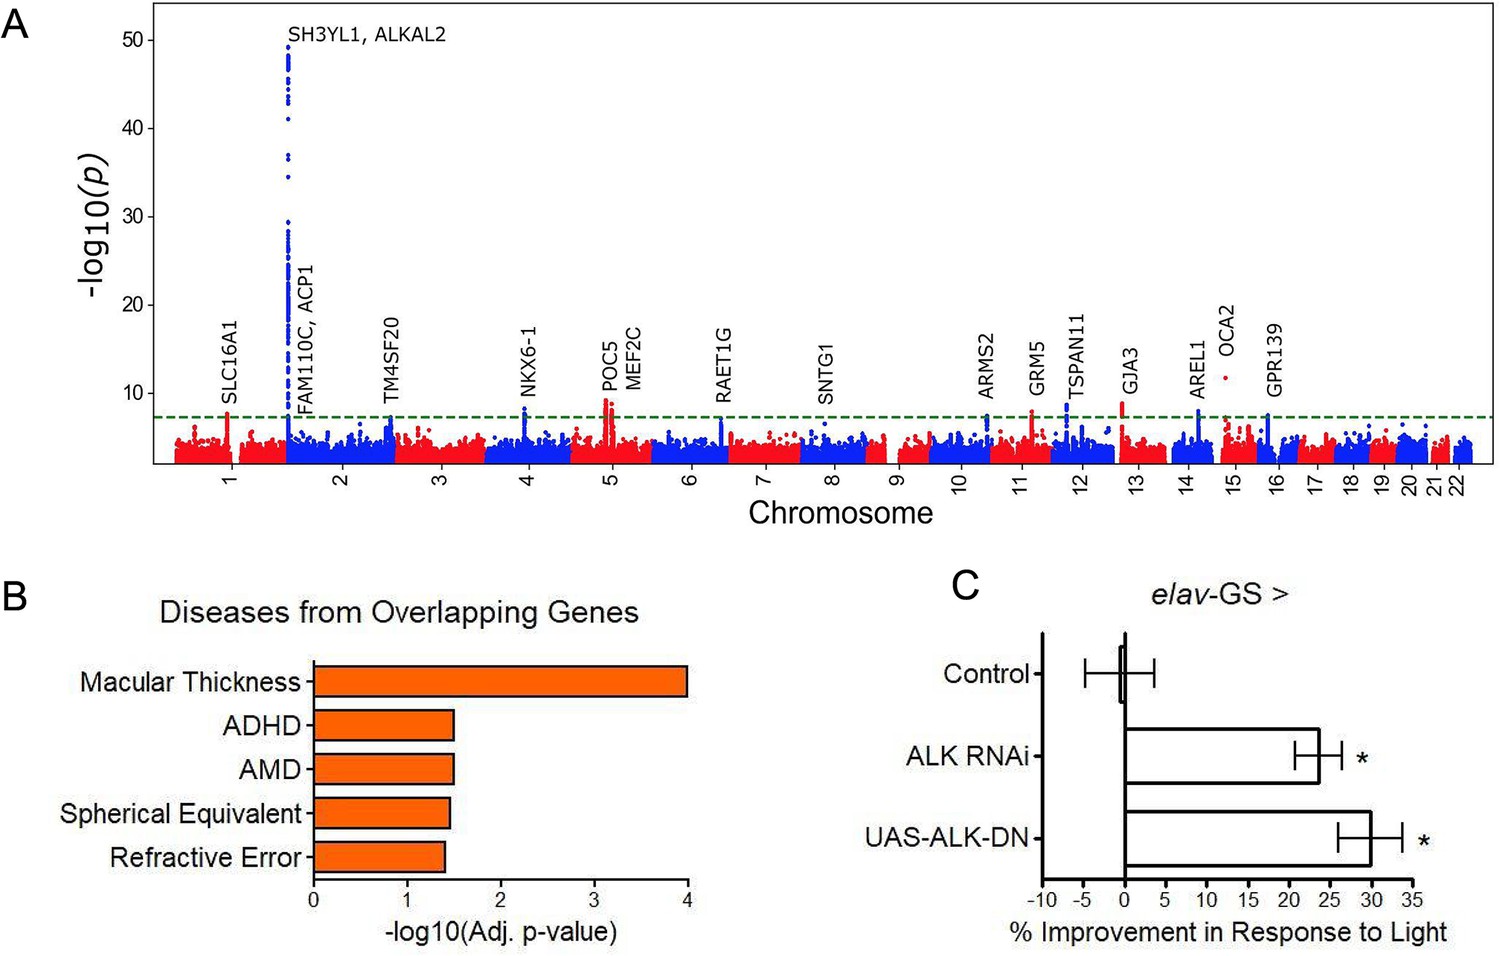
GWAS analyses and experimental validation.
(A) Manhattan plot representing significant genes associated with eyeAgeAcceleration. (B) p-Values for enriched pathways: Macular thickness, ADHD (attention deficit hyperactivity disorder), AMD (age-related macular degeneration), spherical equivalent, and refractive error. (C) Assessment of visual performance of transgenic and control flies with age. p-Value is relative to control (*=p < 0.05). p-Value for ALK RNAi vs. control is 0.009; p-value for UAS-ALK-DN vs. control is 0.006. Error bars show standard deviation between 3 biological replicates. n = 100 flies per replicate.
Figure 4—figure supplement 1
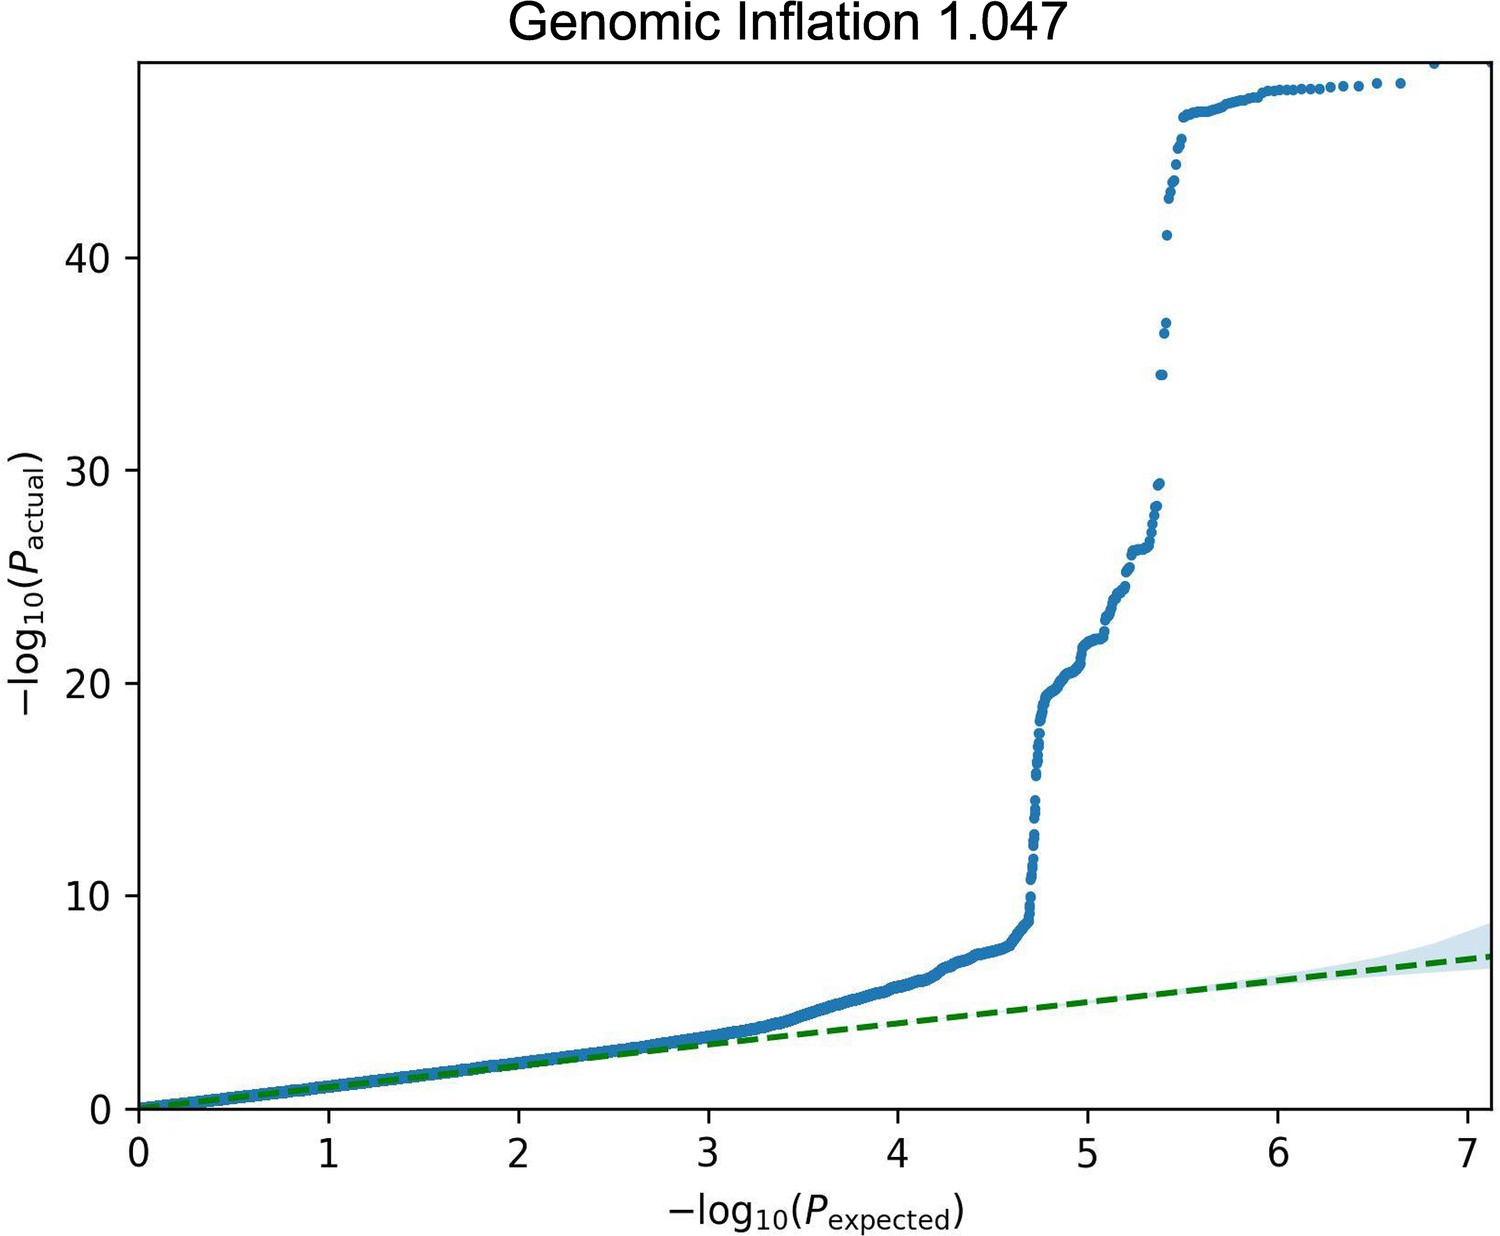
eyeAgeAcceleration qq-plot.
Figure 4—figure supplement 2
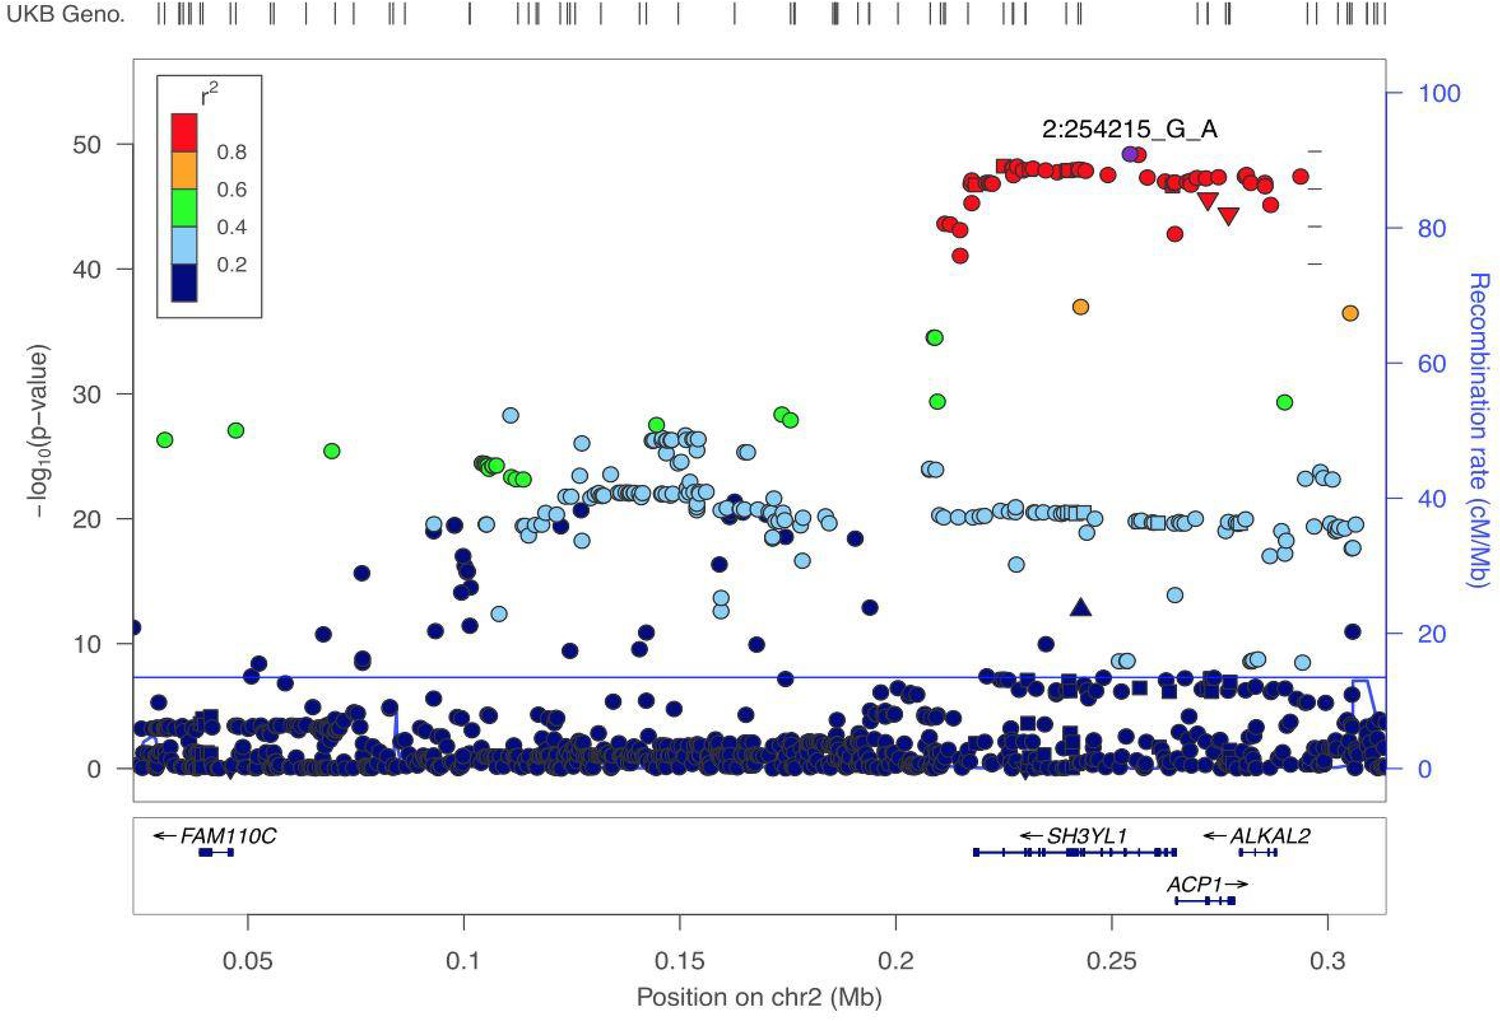
Zoom in on significant locus covering three genes in a highly significant LD block.
This block includes the three genes: SH3YL1, ACP1, and ALKAL2.
Tables
Table 1
Characteristics of patients in the development and validation sets (before filtering).
| Development set (EyePACS) | Test set (UK Biobank) | ||
|---|---|---|---|
| Train | Tune | ||
| Patients | 100,692 | 25,238 | 64,019 |
| Images | 217,289 | 54,292 | 119,532 |
| Ethnicity | Black: 11908 [7%] Asia Pacific Islander: 11842 [7%] White: 22539 [13%] Hispanic: 125595 [71%] Native American: 1791 [1%] Other: 3809 [2%] | Black: 3040 [7%] Asia Pacific Islander: 2923 [7%] White: 5657 [13%] Hispanic: 31521 [71%] Native American: 426 [1%] Other: 918 [2%] | Black: 1540 [1%] Asia Pacific Islander: 4183 [4%] White: 107967 [91%] Hispanic: 0 [0%] Native_american: 0 [0%] Other: 5015 [4%] |
| Self- reported Sex | Female: 127075 [59%] Male: 90128 [41%] | Female: 31743 [58%] Male: 22531 [42%] | Female: 65739 [55%] Male: 53793 [45%] |
| Age | median = 55.13 mean = 54.21 std = 11.50 | median = 55.19 mean = 54.20 std = 11.46 | median = 57.94 mean = 56.85 std = 8.18 |
Key resources table
| Reagent type (species) or resource | Designation | Source or reference | Identifiers | Additional information |
|---|---|---|---|---|
| Strain, wDah background (Drosophila melanogaster, females) | wDah control strain | Laboratory of Linda Partridge, Woodling et al., 2020 | Maintained in Kapahi Lab | |
| Strain, wDah background (Drosophila melanogaster, females) | UAS-ALKRNAi RNAi for ALK | Laboratory of Linda Partridge, Woodling et al., 2020 | VDRC GD 11446 | Maintained in Kapahi Lab |
| Strain, wDah background (Drosophila melanogaster, females) | UAS-ALKDN dominant negative ALK overexpression | Laboratory of Linda Partridge, Woodling et al., 2020 | Maintained in Kapahi Lab | |
| Strain, wDah background (Drosophila melanogaster, females) | elav-GS Ru486 inducible Gal4 driver | Bloomington Drosophila Stock Center, Woodling et al., 2020 | BDSC 43642 | Maintained in Kapahi Lab |
| Chemical compound, drug | RU486 (mifepristone) | United States Biological, Osterwalder et al., 2001 | 282888 | For inducting fly GeneSwitch expression system; 200 µM final concentration in food |
Author response table 1
| test_statistic | p | -log2(p) | ||
|---|---|---|---|---|
| chronological age | km | 2.16 | 0.14 | 2.82 |
| rank | 2.16 | 0.14 | 2.82 | |
| eyeAge | km | 0.22 | 0.64 | 0.65 |
| rank | 0.22 | 0.64 | 0.65 | |
| sex | km | 2.47 | 0.12 | 3.11 |
| rank | 2.47 | 0.12 | 3.11 | |
| phenoAge | km | 2.63 | 0.11 | 3.25 |
| rank | 2.63 | 0.10 | 3.25 |
Additional files
-
Supplementary file 1
Hazard ratio results for men and women.
- https://cdn.elifesciences.org/articles/82364/elife-82364-supp1-v2.zip
-
Supplementary file 2
Hazard ratio results with adjustments.
- https://cdn.elifesciences.org/articles/82364/elife-82364-supp2-v2.zip
-
Supplementary file 3
Cox proportional hazards regression of Outcome on Age, Sex, and eyeAge.
P-value and Hazard ratio are reported for eyeAge.
- https://cdn.elifesciences.org/articles/82364/elife-82364-supp3-v2.zip
-
Supplementary file 4
Linear regression of INT(Outcome) on INT(Age), Sex, INT(eyeAgeAccel).
- https://cdn.elifesciences.org/articles/82364/elife-82364-supp4-v2.zip
-
Supplementary file 5
Linear regression of visual acuity-related outcomes on age measurements.
- https://cdn.elifesciences.org/articles/82364/elife-82364-supp5-v2.zip
-
Supplementary file 6
Filtered gene association results.
- https://cdn.elifesciences.org/articles/82364/elife-82364-supp6-v2.zip
-
Supplementary file 7
Fine mapping gene association results.
- https://cdn.elifesciences.org/articles/82364/elife-82364-supp7-v2.zip
-
Supplementary file 8
List of genes associated with eyeAgeAccel and function.
- https://cdn.elifesciences.org/articles/82364/elife-82364-supp8-v2.zip
-
Supplementary file 9
Gene association results with annotated hits.
- https://cdn.elifesciences.org/articles/82364/elife-82364-supp9-v2.zip
-
MDAR checklist
- https://cdn.elifesciences.org/articles/82364/elife-82364-mdarchecklist1-v2.pdf
Download links
A two-part list of links to download the article, or parts of the article, in various formats.
Downloads (link to download the article as PDF)
Open citations (links to open the citations from this article in various online reference manager services)
Cite this article (links to download the citations from this article in formats compatible with various reference manager tools)
Longitudinal fundus imaging and its genome-wide association analysis provide evidence for a human retinal aging clock
eLife 12:e82364.
https://doi.org/10.7554/eLife.82364


