Cryo-EM structures of an LRRC8 chimera with native functional properties reveal heptameric assembly
- Department of Molecular Physiology and Biophysics, School of Medicine, Vanderbilt University, United States
- Center for Structural Biology, Vanderbilt University, United States
- Department of Anesthesiology, Vanderbilt University Medical Center, United States
- Department of Pharmacology, School of Medicine, Vanderbilt University, United States
Figures
Figure 1 with 1 supplement
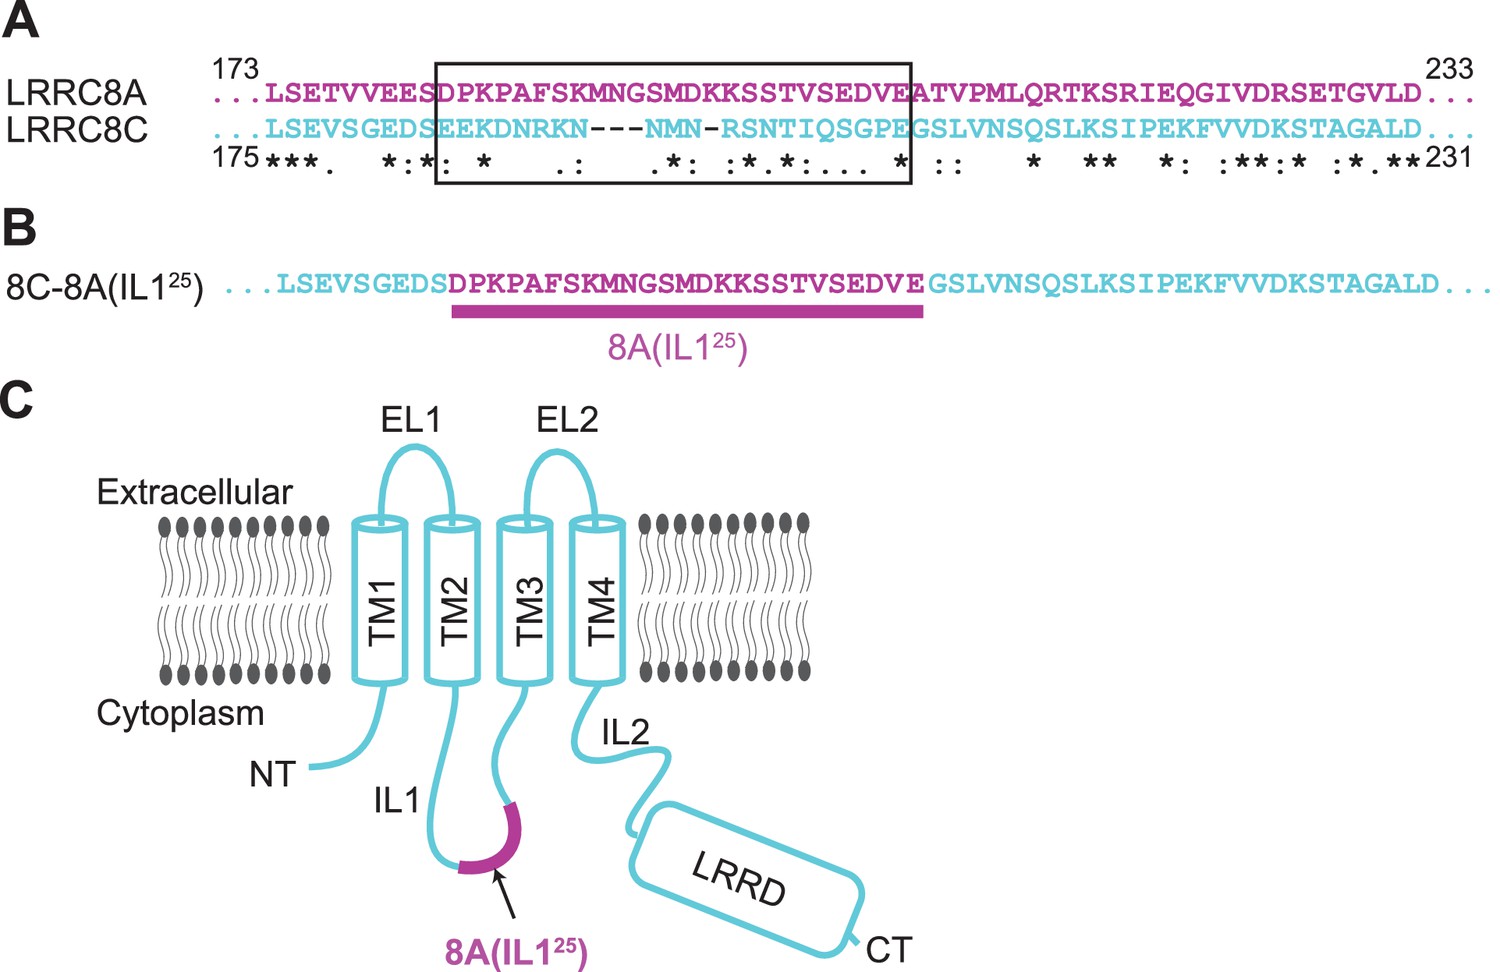
Construct design of 8C-8A(IL125).
(A) Sequence alignment of LRRC8A and LRRC8C around the swapped IL125 region. The swapped region in the 8C-8A(IL125) construct is shown inside a black box. The key below amino acid sequences denotes identical (*), conservative (:), and semi-conservative (.) sequences. Space indicates the residues that are not conserved. (B) The amino acid sequence of the 8C-8A(IL125) construct around the swapped IL125 region. (C) Schematic diagram of the 8C-8A(IL125) protein highlighting the relative position of the swapped IL125 region.
Figure 1—figure supplement 1
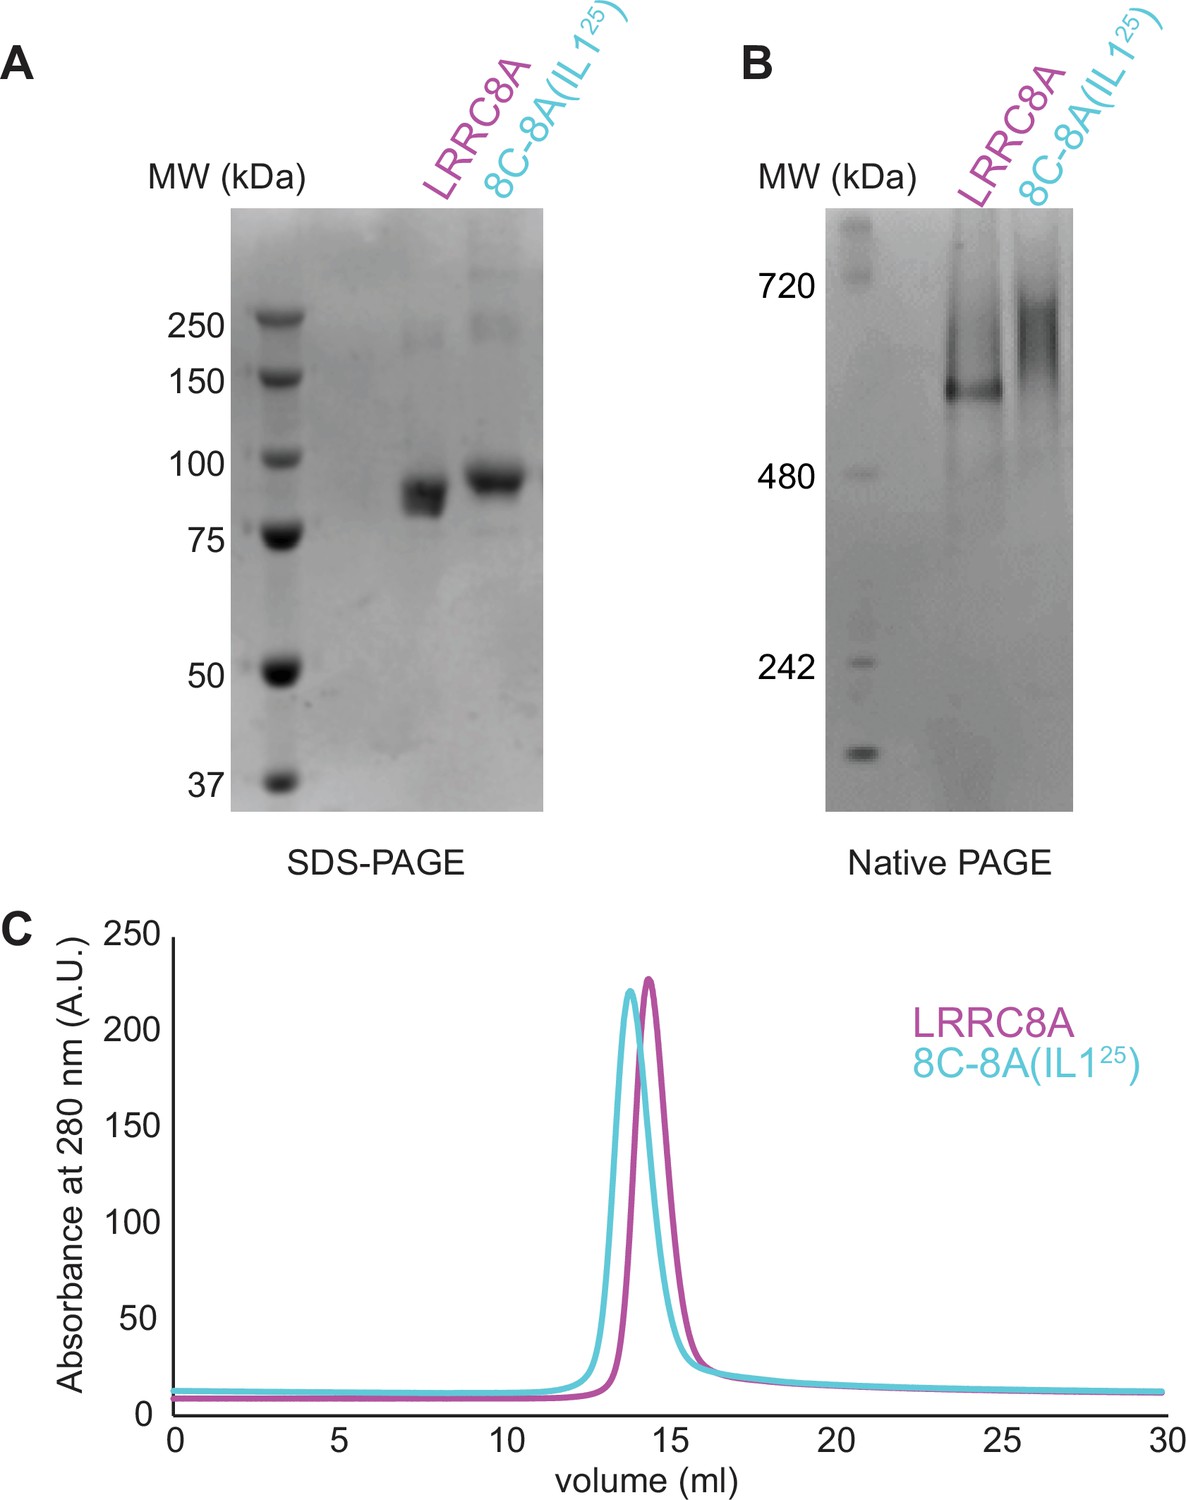
Purification of 8C-8A(IL125).
SDS-PAGE (A), native-PAGE (B), and size exclusion chromatography (C) analysis of the purified LRRC8A and 8C-8A(IL125) proteins.
-
Figure 1—figure supplement 1—source data 1
Raw and annotated images of the SDS-PAGE gel analyzing the purified LRRC8A and 8C-8A(IL125) proteins.
- https://cdn.elifesciences.org/articles/82431/elife-82431-fig1-figsupp1-data1-v2.zip
-
Figure 1—figure supplement 1—source data 2
Raw and annotated images of the native-PAGE gel analyzing the purified LRRC8A and 8C-8A(IL125) proteins.
- https://cdn.elifesciences.org/articles/82431/elife-82431-fig1-figsupp1-data2-v2.zip
Figure 2 with 3 supplements
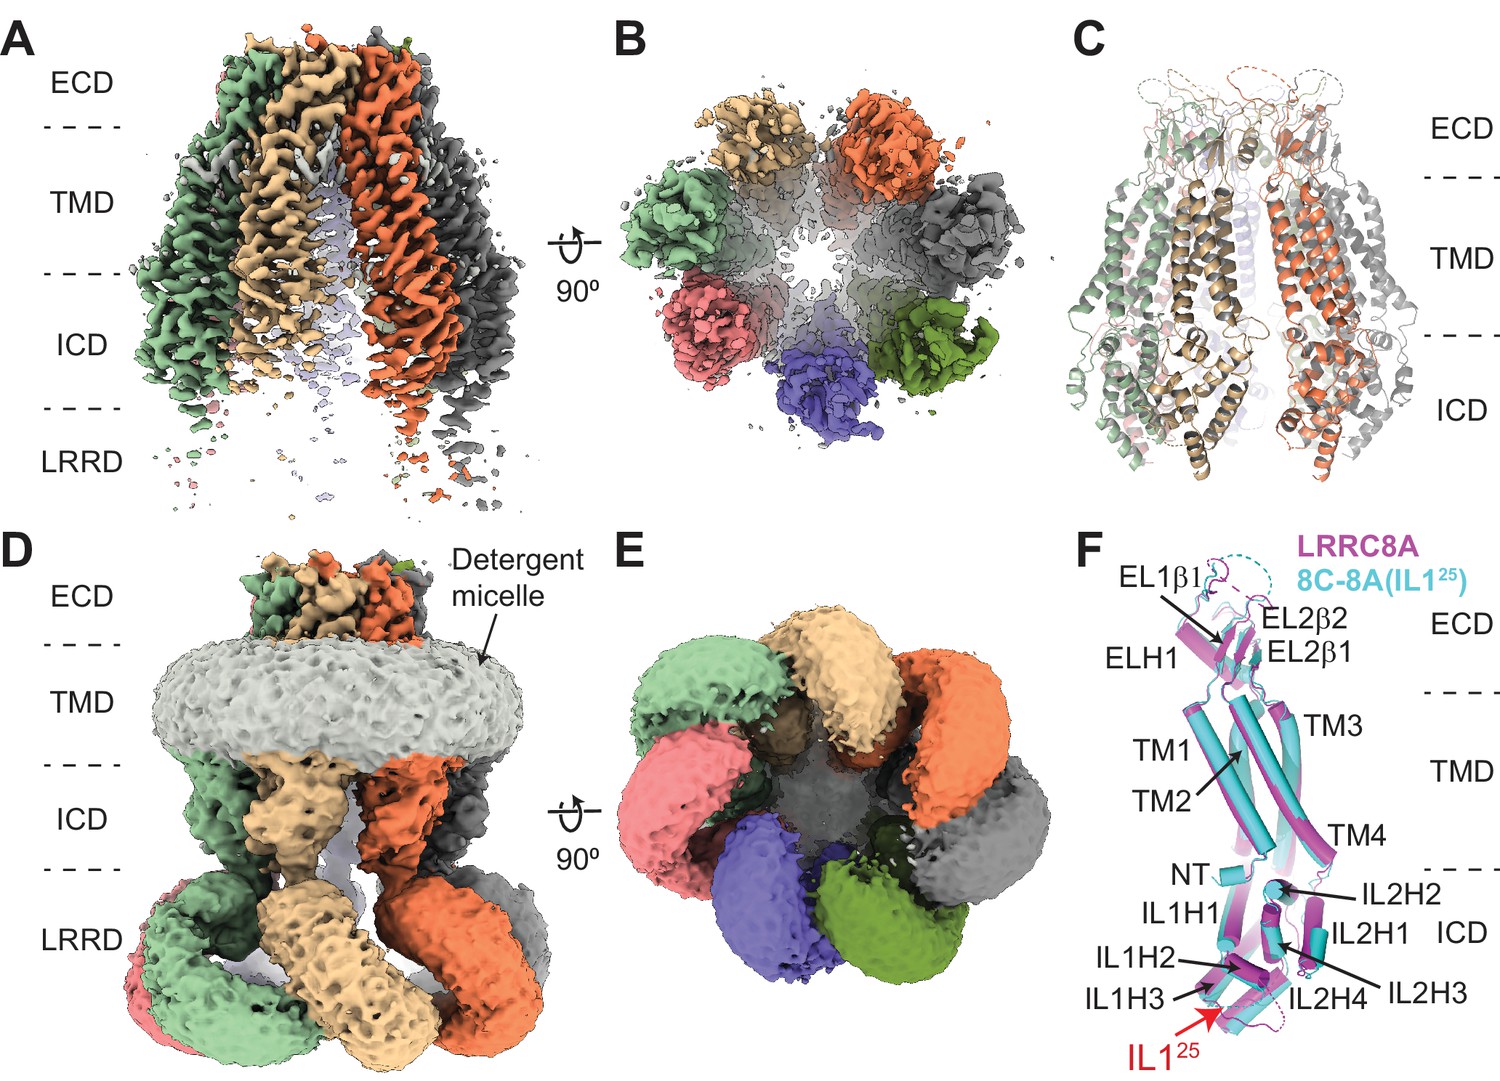
Cryo-electron microscopy (cryo-EM) structure of 8C-8A(IL125).
(A–B) Cryo-EM maps of 8C-8A(IL125) class 1 structure viewed through the membrane plane (A) and from the cytoplasm (B). (C) Ribbon representation of the 8C-8A(IL125) class 1 structure viewed through the membrane plane. (D–E) Unsharpened cryo-EM maps of 8C-8A(IL125) class 1 structure viewed through the membrane plane (D) and from the cytoplasm (E), emphasizing low-resolution features. (F) Structural comparison of the 8C-8A(IL125) (cyan) and LRRC8A (magenta, PDB ID: 5ZSU) subunits.
Figure 2—figure supplement 1
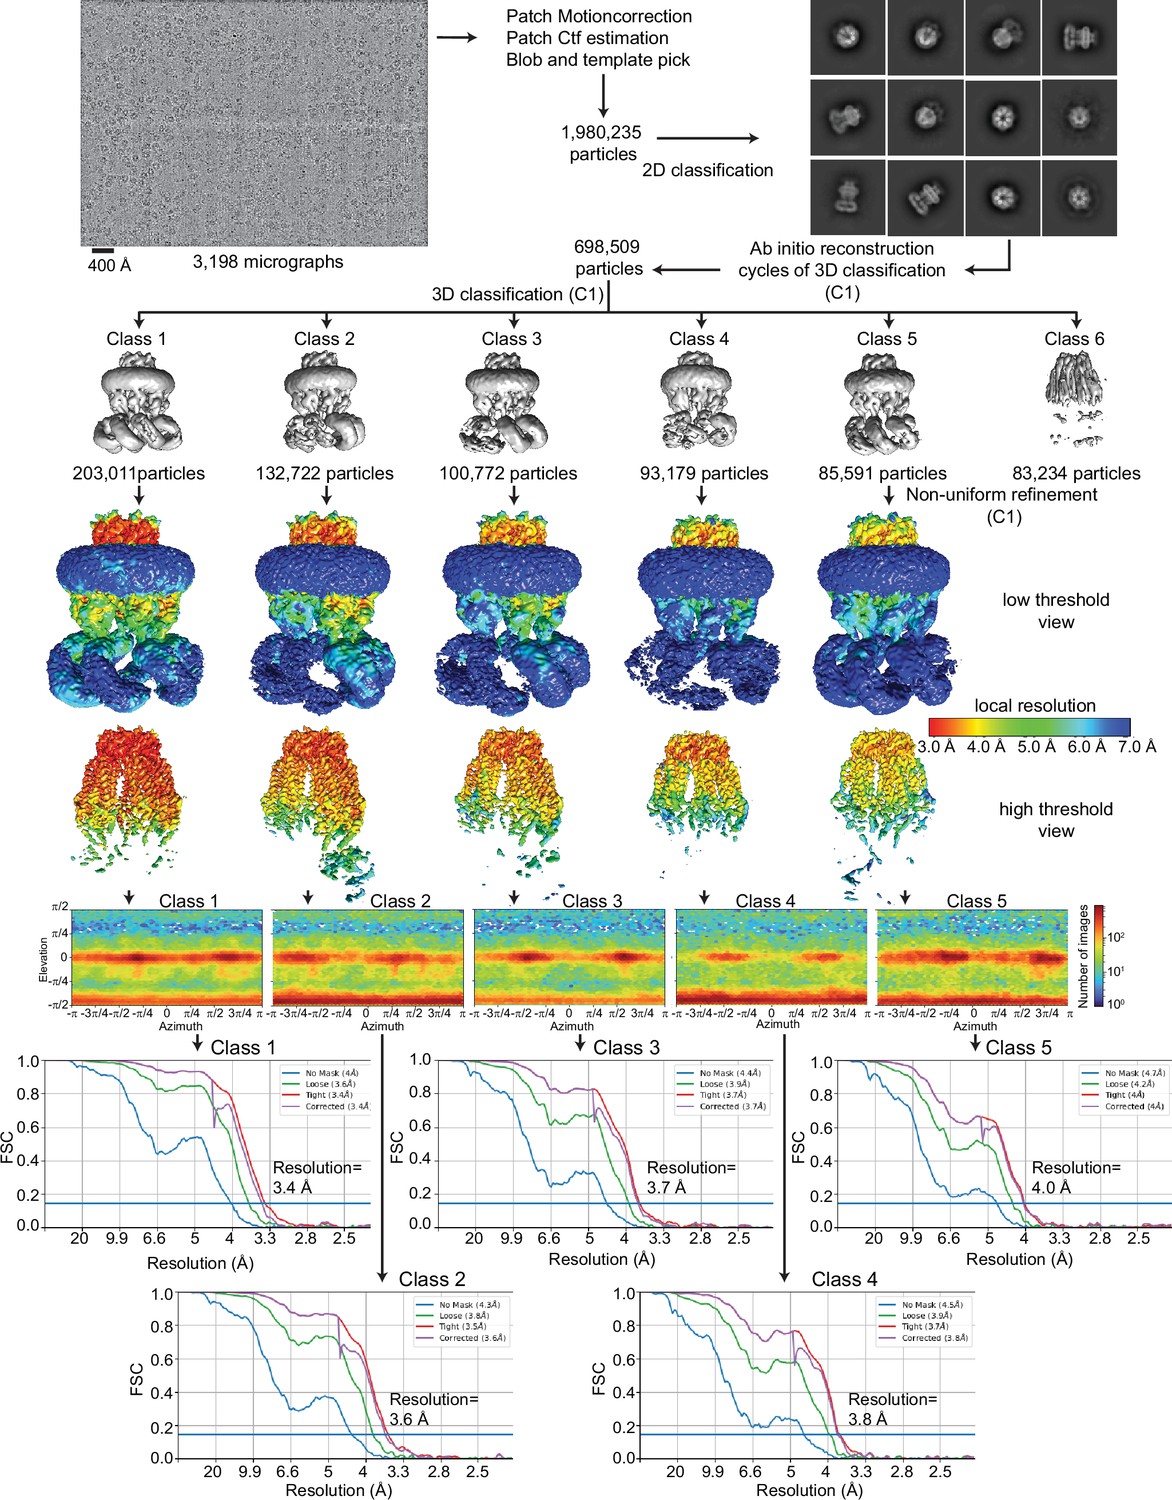
Cryo-electron microscopy (cryo-EM) analysis of 8C-8A(IL125).
Flowchart detailing the particle selection and refinement procedure to obtain the cryo-EM maps of 8C-8A(IL125). Local resolution maps are shown on maps viewed at two different thresholds in Chimera. FSC curves and angular distributions are shown for the refined classes.
Figure 2—figure supplement 2
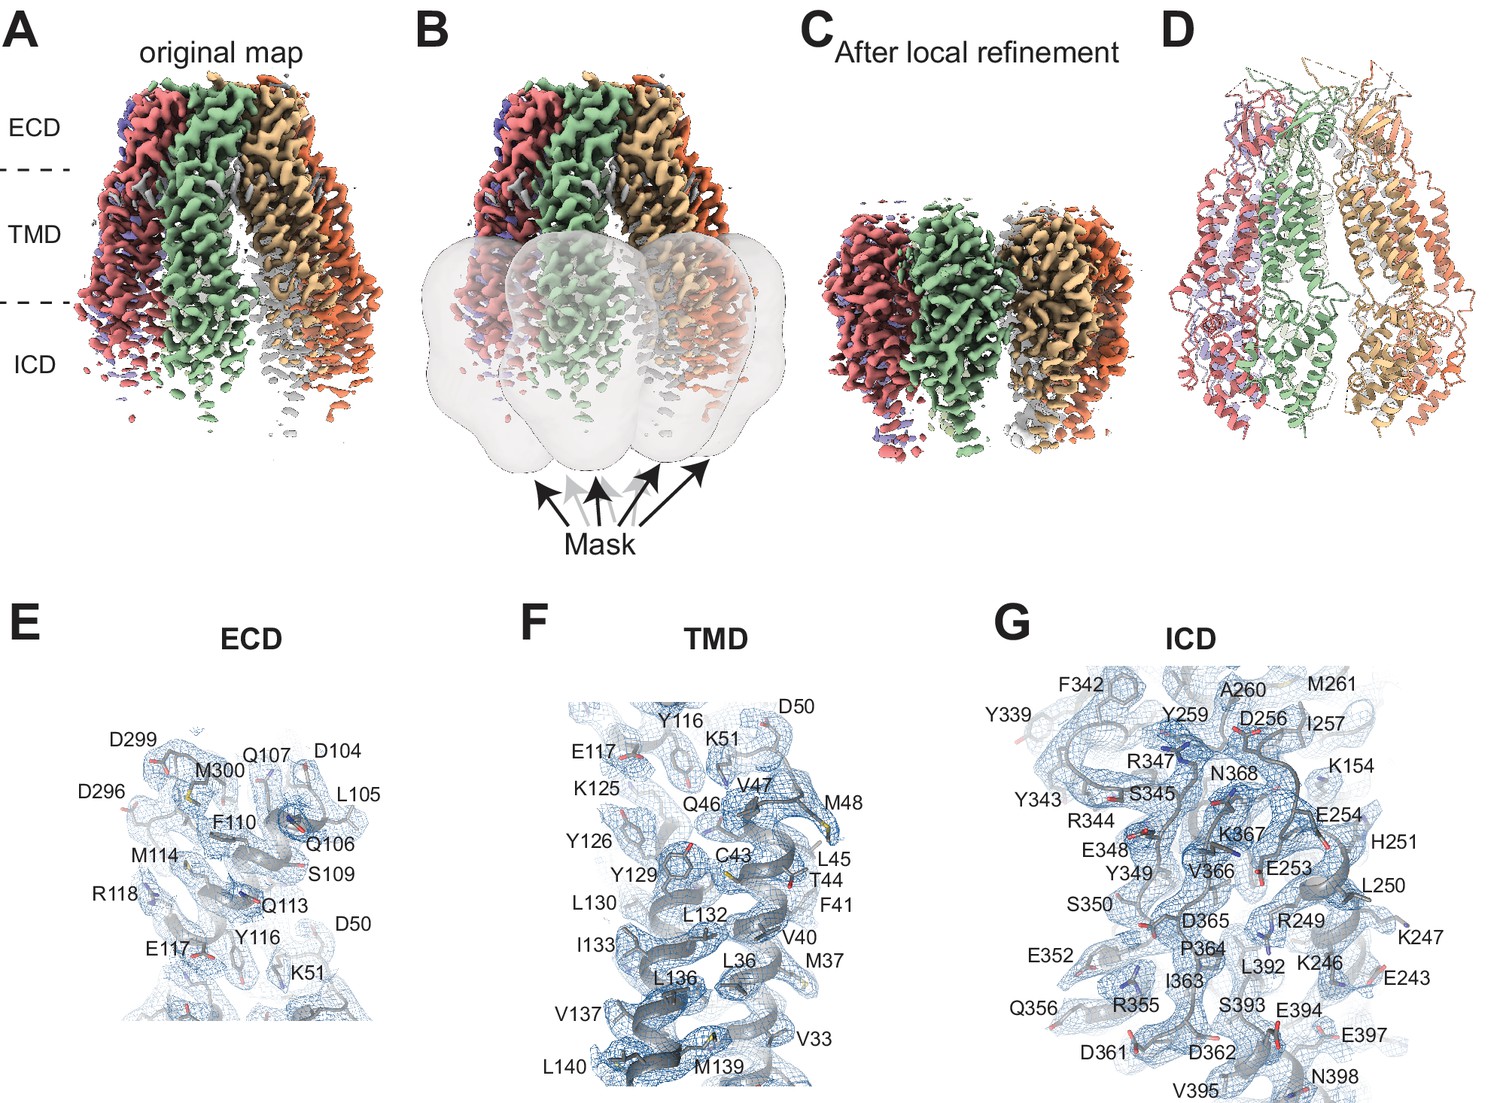
Cryo-electron microscopy (cryo-EM) analysis of 8C-8A(IL125).
(A) Cryo-EM map of 8C-8A(IL125) class 1 structure colored by individual subunits. (B) Masks used for local refinement of individual subunits are shown as transparent gray surfaces. Each mask was used separately for local refinement. (C) The cryo-EM maps after local refinement for each subunit are aligned onto the original map. (D) Ribbon representation of the 8C-8A(IL125) structure. (E–F) Representative images of the cryo-EM density and the modeled structure covering parts of extracellular domain (ECD) (E), transmembrane domain (TMD) (F), and intracellular domain (ICD) (G). The map in panel (G) is obtained after local refinement, and the maps in panels (E) and (F) are the original maps.
Figure 2—figure supplement 3
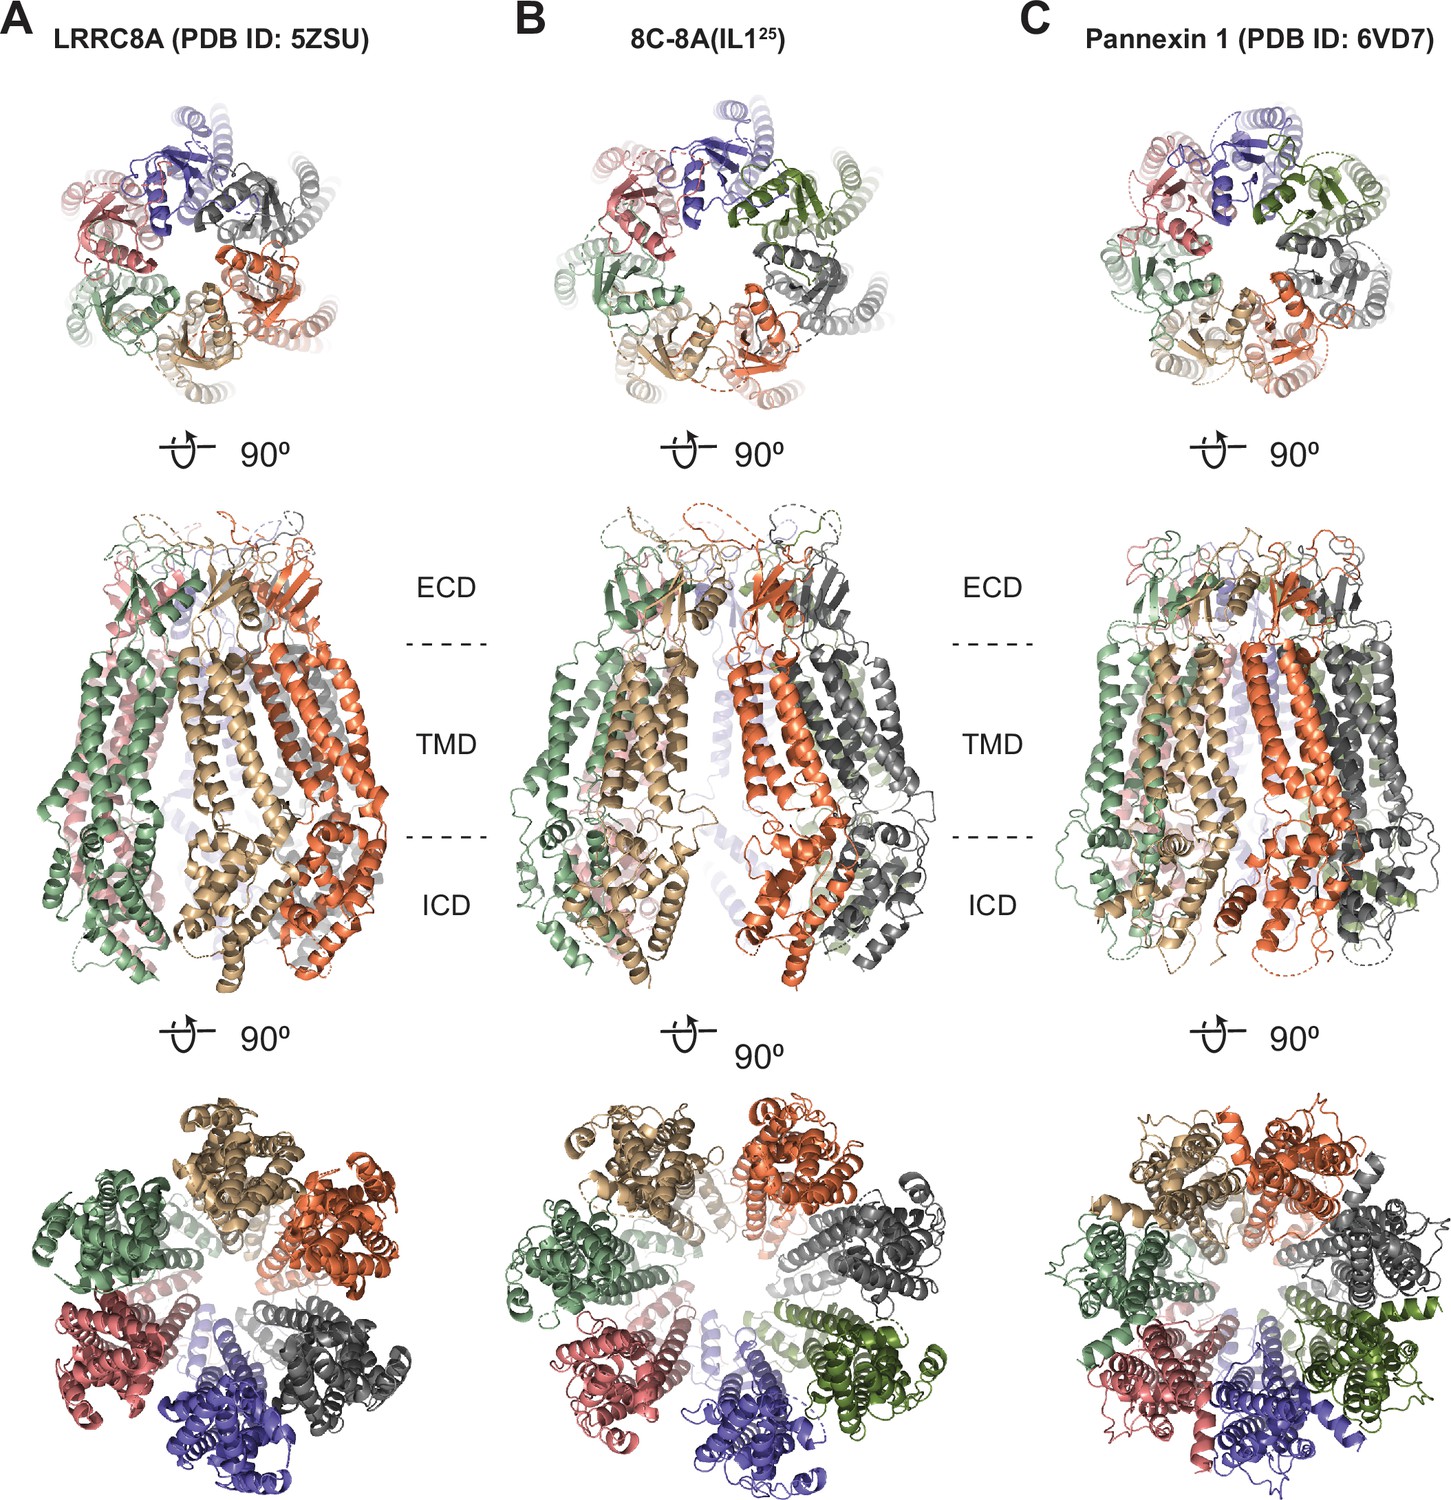
Structural comparison of 8C-8A(IL125) to LRRC8A and pannexins.
(A–C) Ribbon representations of LRRC8A (PBD ID: 5ZSU) (A), 8C-8A(IL125) class 1 structure (B), and pannexin 1 (PDB ID: 6VD7) (C) viewed from the extracellular space (top), through the membrane plane (middle) and from the cytoplasm (bottom). Leucine-rich repeat motif-containing domains (LRRDs) for 8C-8A(IL125) and LRRC8A were not shown. Each subunit is colored differently.
Figure 3 with 3 supplements

Subunit arrangement of the 8C-8A(IL125) chimera.
(A–B) Surface representation of the 8C-8A(IL125) class 1 structure viewed from two sides, highlighting the ‘tight’ (A) and ‘loose’ (B) interfaces. (C–E) Intracellular domain (ICD), transmembrane domain (TMD), and extracellular domains (ECDs) are viewed from the cytoplasm with a depth of view, as shown in panel (B).
Figure 3—figure supplement 1
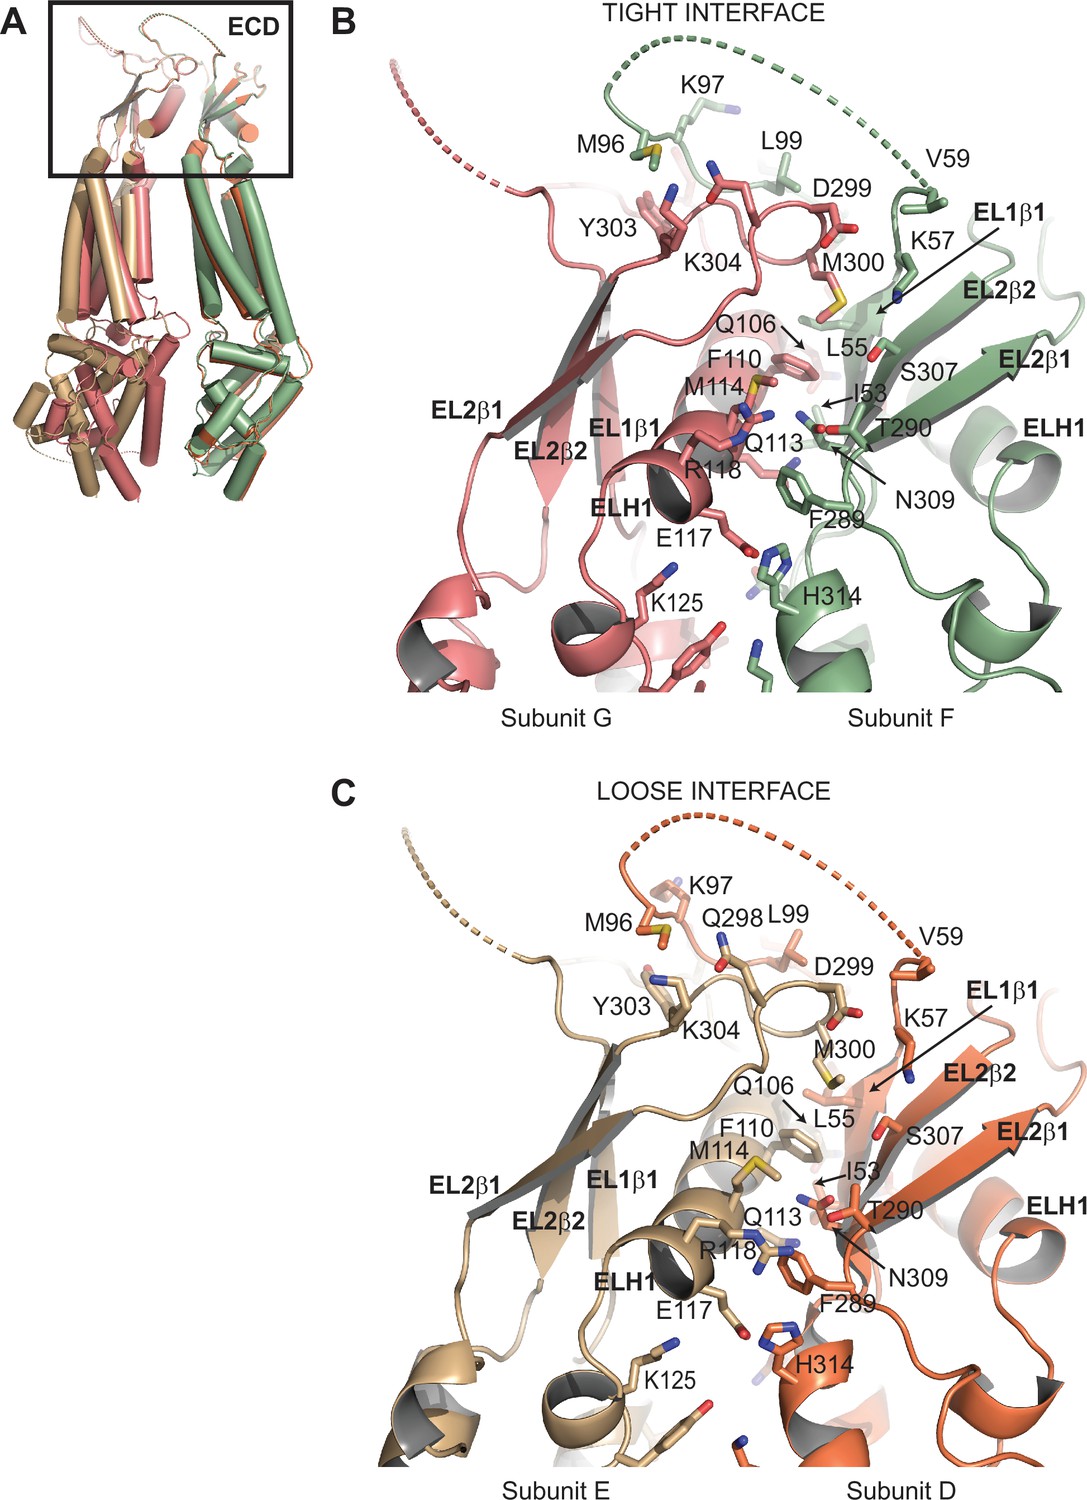
Comparison of subunit interfaces.
(A) Overlay of two 8C-8A(IL125) subunit pairs of the class 1 structure that form tight and loose interfaces. Structures were aligned on their extracellular domains (ECDs). (B–C) Close-up view of the ECDs forming the tight (B) and loose (C) interfaces. Select residues at the interfaces are shown in stick representation and labeled.
Figure 3—figure supplement 2
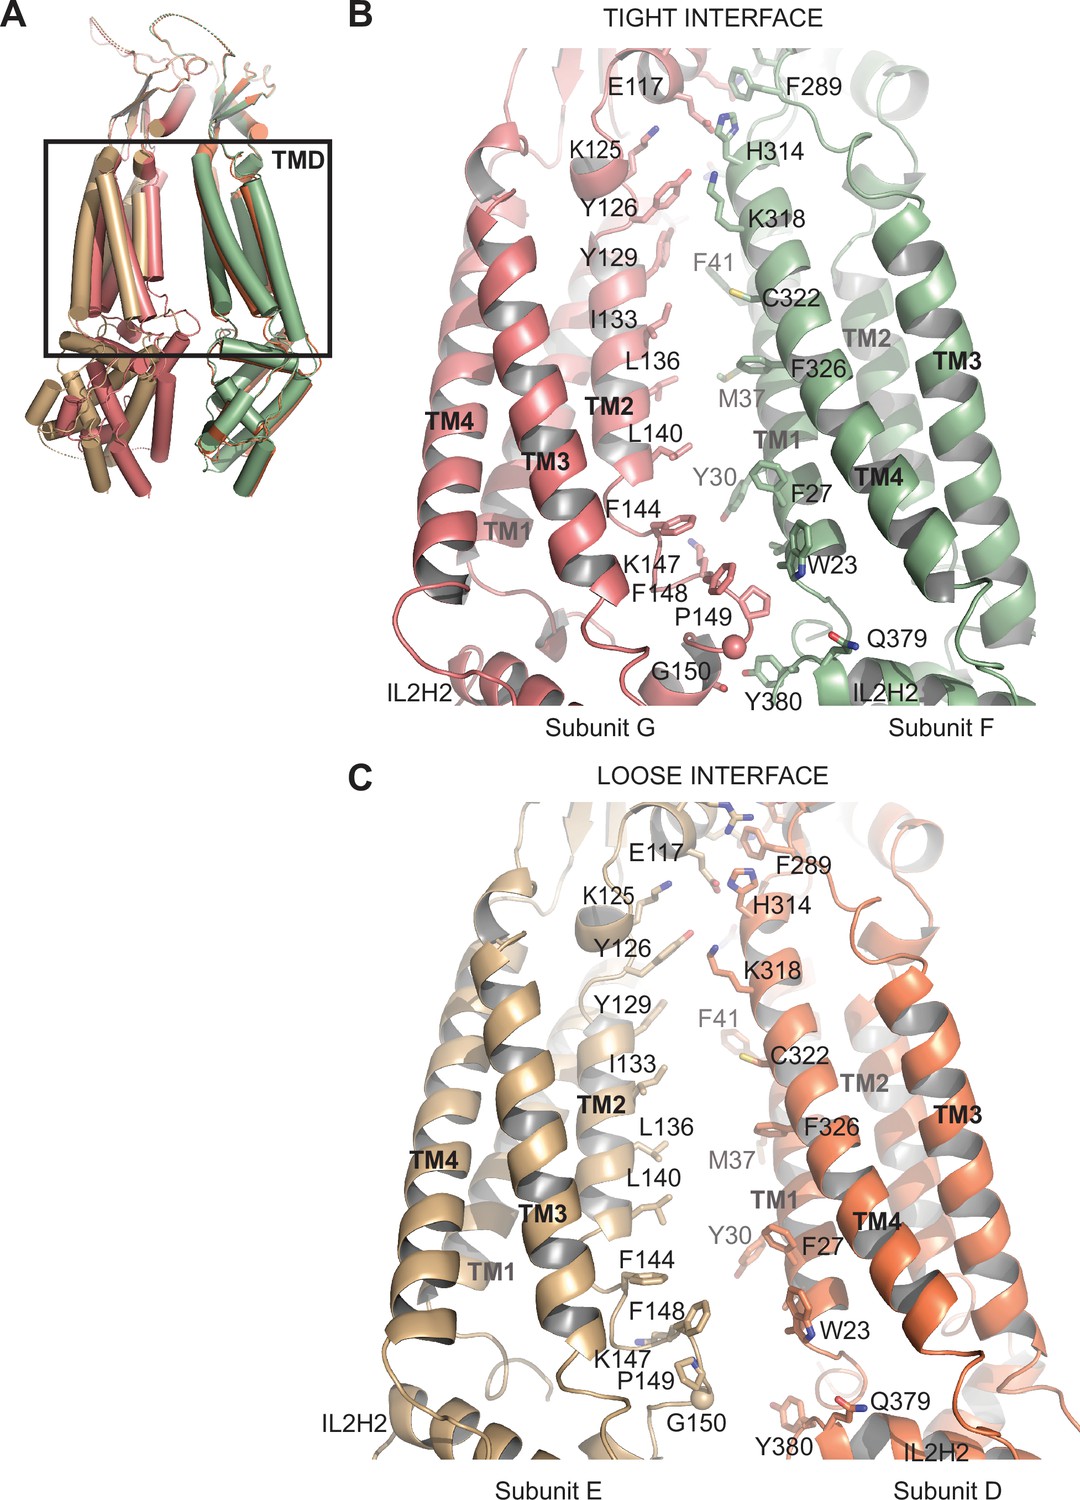
Comparison of subunit interfaces.
(A) Overlay of two 8C-8A(IL125) subunit pairs of the class 1 structure that form tight and loose interfaces. Structures were aligned on their extracellular domains (ECDs). (B–C) Close-up view of the transmembrane domains (TMDs) forming the tight (B) and loose (C) interfaces. Select residues at the interfaces are shown in stick representation and labeled.
Figure 3—figure supplement 3
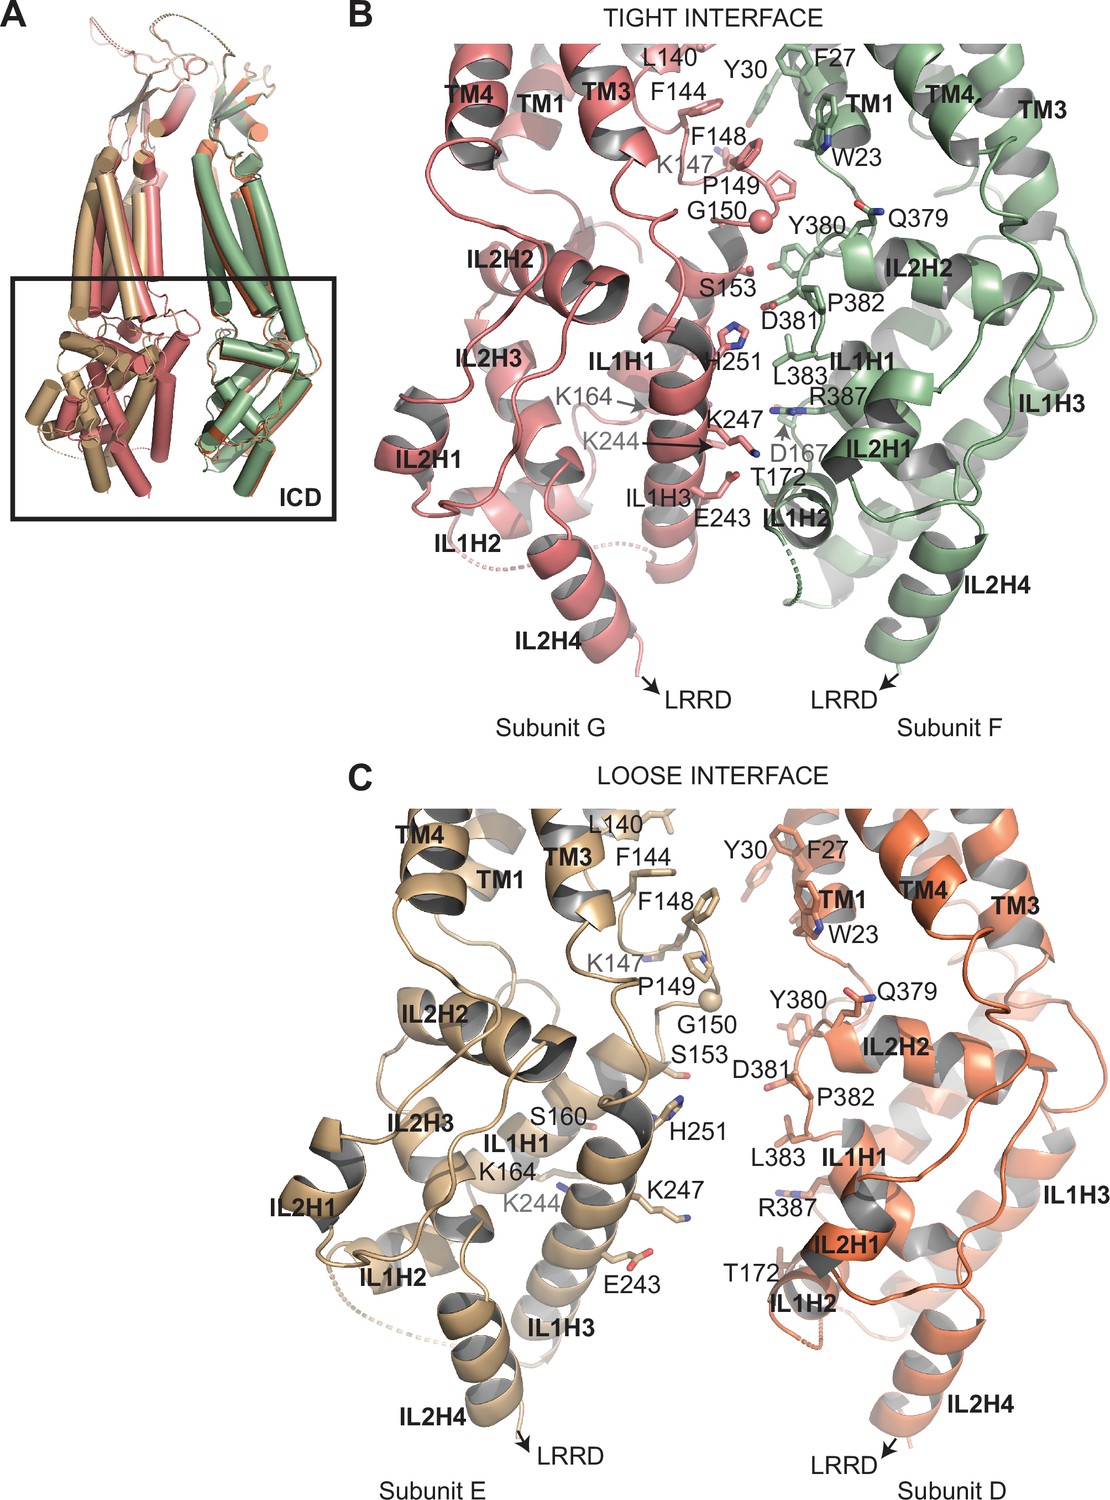
Comparison of subunit interfaces.
(A) Overlay of two 8C-8A(IL125) subunit pairs of the class 1 structure that form tight and loose interfaces. Structures were aligned on their extracellular domains (ECDs). (B–C) Close-up view of the intracellular domains (ICDs) forming the tight (B) and loose (C) interfaces. Select residues at the interfaces are shown in stick representation and labeled.
Figure 4
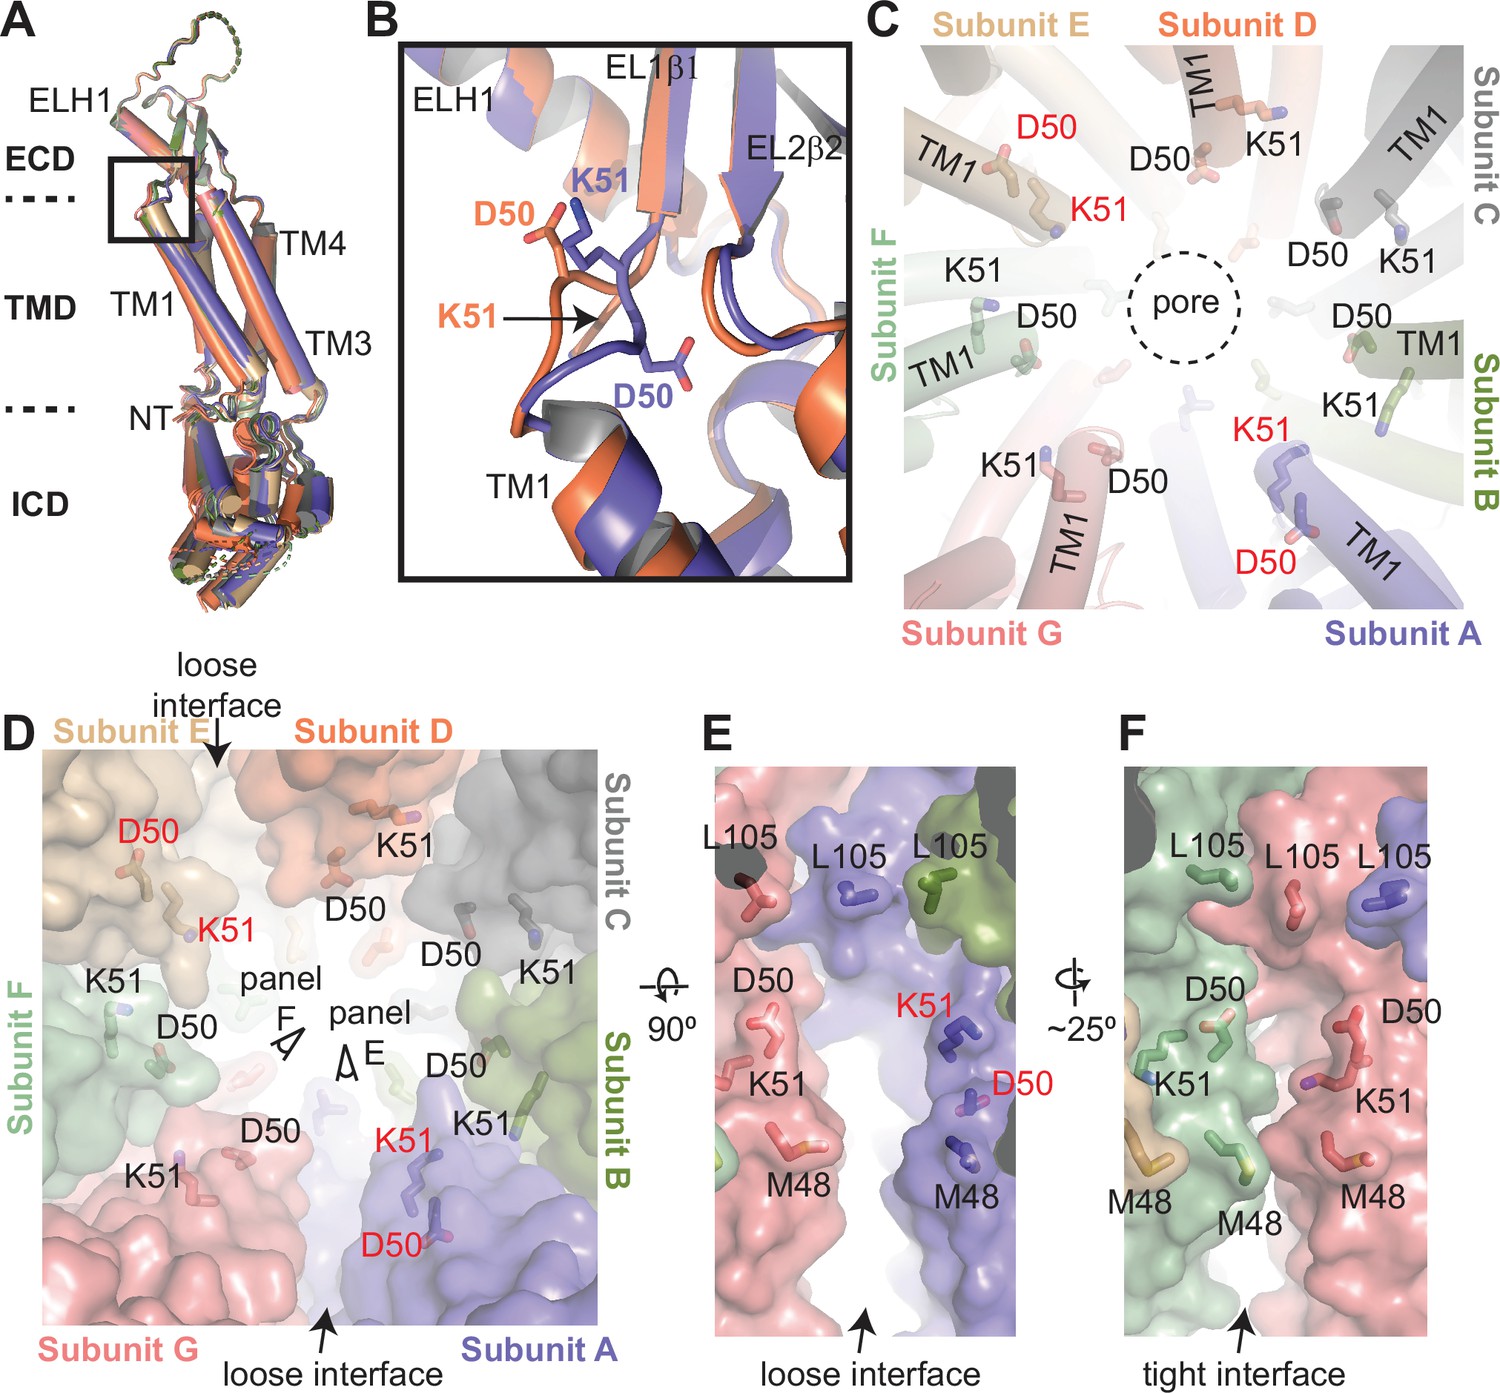
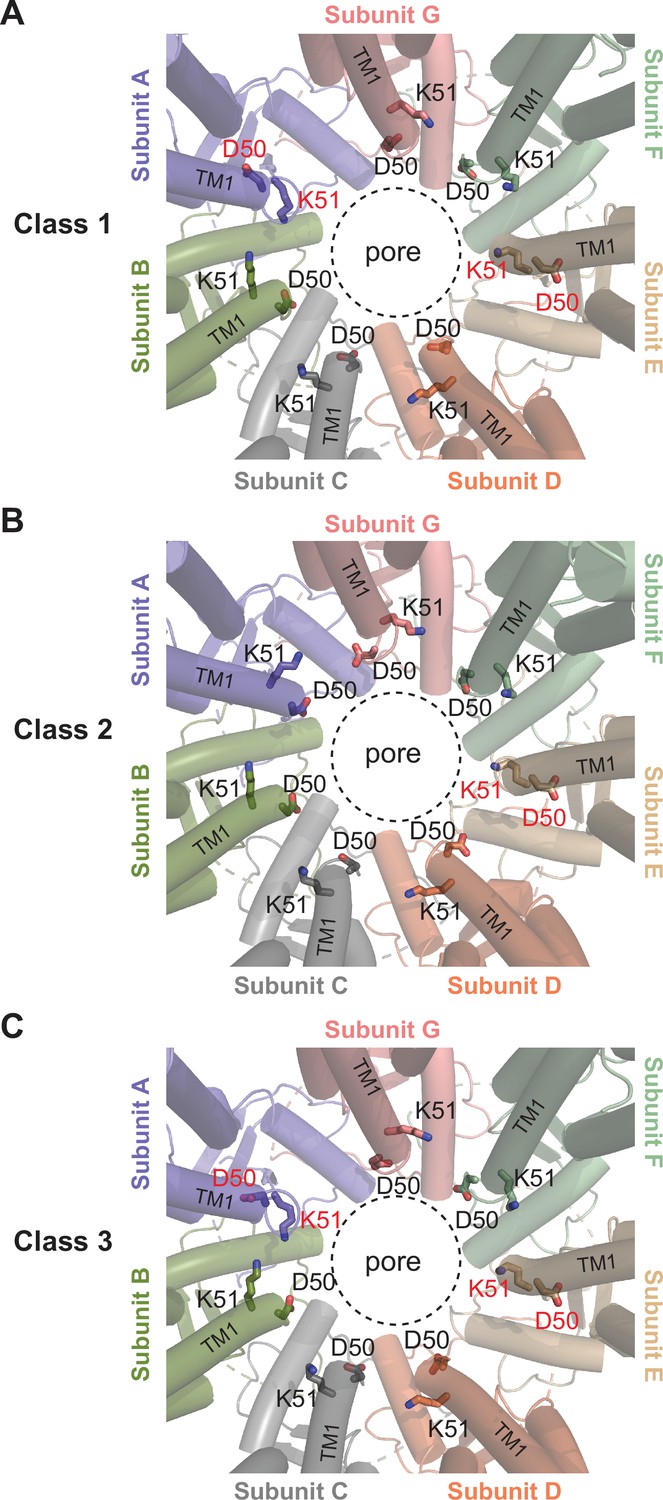
Structural heterogeneity of 8C-8A(IL125) protomers.
(A) Structural comparison of the 8C-8A(IL125) subunits in the class 1 structure. The structures are aligned based on their extracellular domains (ECDs). (B) Close-up view of the box region in panel (A), highlighting the structural differences in the loop that connects transmembrane helix 1 (TM1) to EL1β1. Only two subunits are shown. (C) Close-up view of the pore around the residues D50 and K51, which are shown as sticks. The residues that adopt different conformations compared to others are labeled in red. The dashed circle indicates the pore-lining surface. (D) The same view as panel (C) but including the surface representation (transparent) to highlight the distinct interfaces between the subunits. (E–F) Close-up view of the interfaces from the points of view shown in panel (D).
Figure 5 with 2 supplements
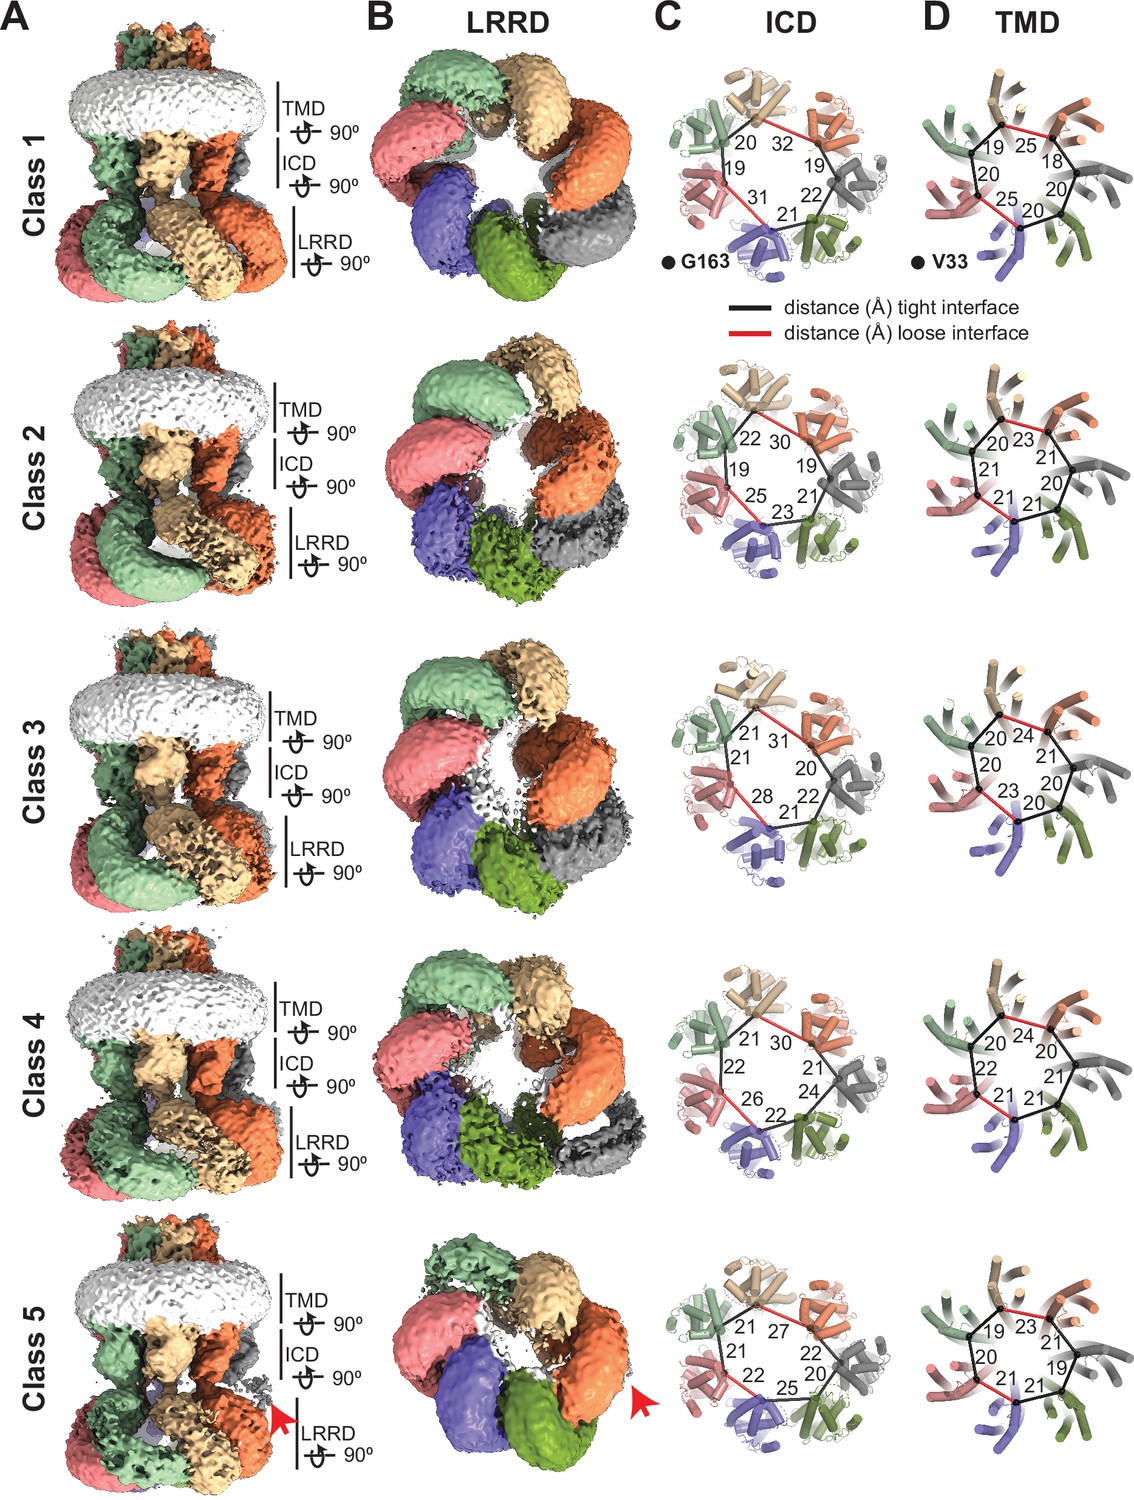
Conformational heterogeneity of 8C-8A(IL125) chimeras.
(A–B) Cryo-electron microscopy (cryo-EM) maps (before sharpening) of 8C-8A(IL125) 3D classes viewed through the membrane plane (A) and from the cytoplasm (B). Individual subunits are colored as in Figure 1. The detergent micelle is shown in white. Red arrows point to the weak density of the leucine-rich repeat motif-containing domain (LRRD), which is not located within the LRRD quaternary assembly. Lines represent the depth of the view for LRRD, intracellular domain (ICD), and transmembrane domain (TMD). (C–D) Ribbon representation of the ICD (C) and TMD (D) structures viewed from the cytoplasm with a depth of view indicated in panel (A). The Cα atoms for G163 in ICD and V33 in TMD are shown as spheres. The distances between these atoms in neighboring subunits are shown as lines (in black and red for the tight and loose interfaces, respectively) and labeled in Å.
Figure 5—figure supplement 1
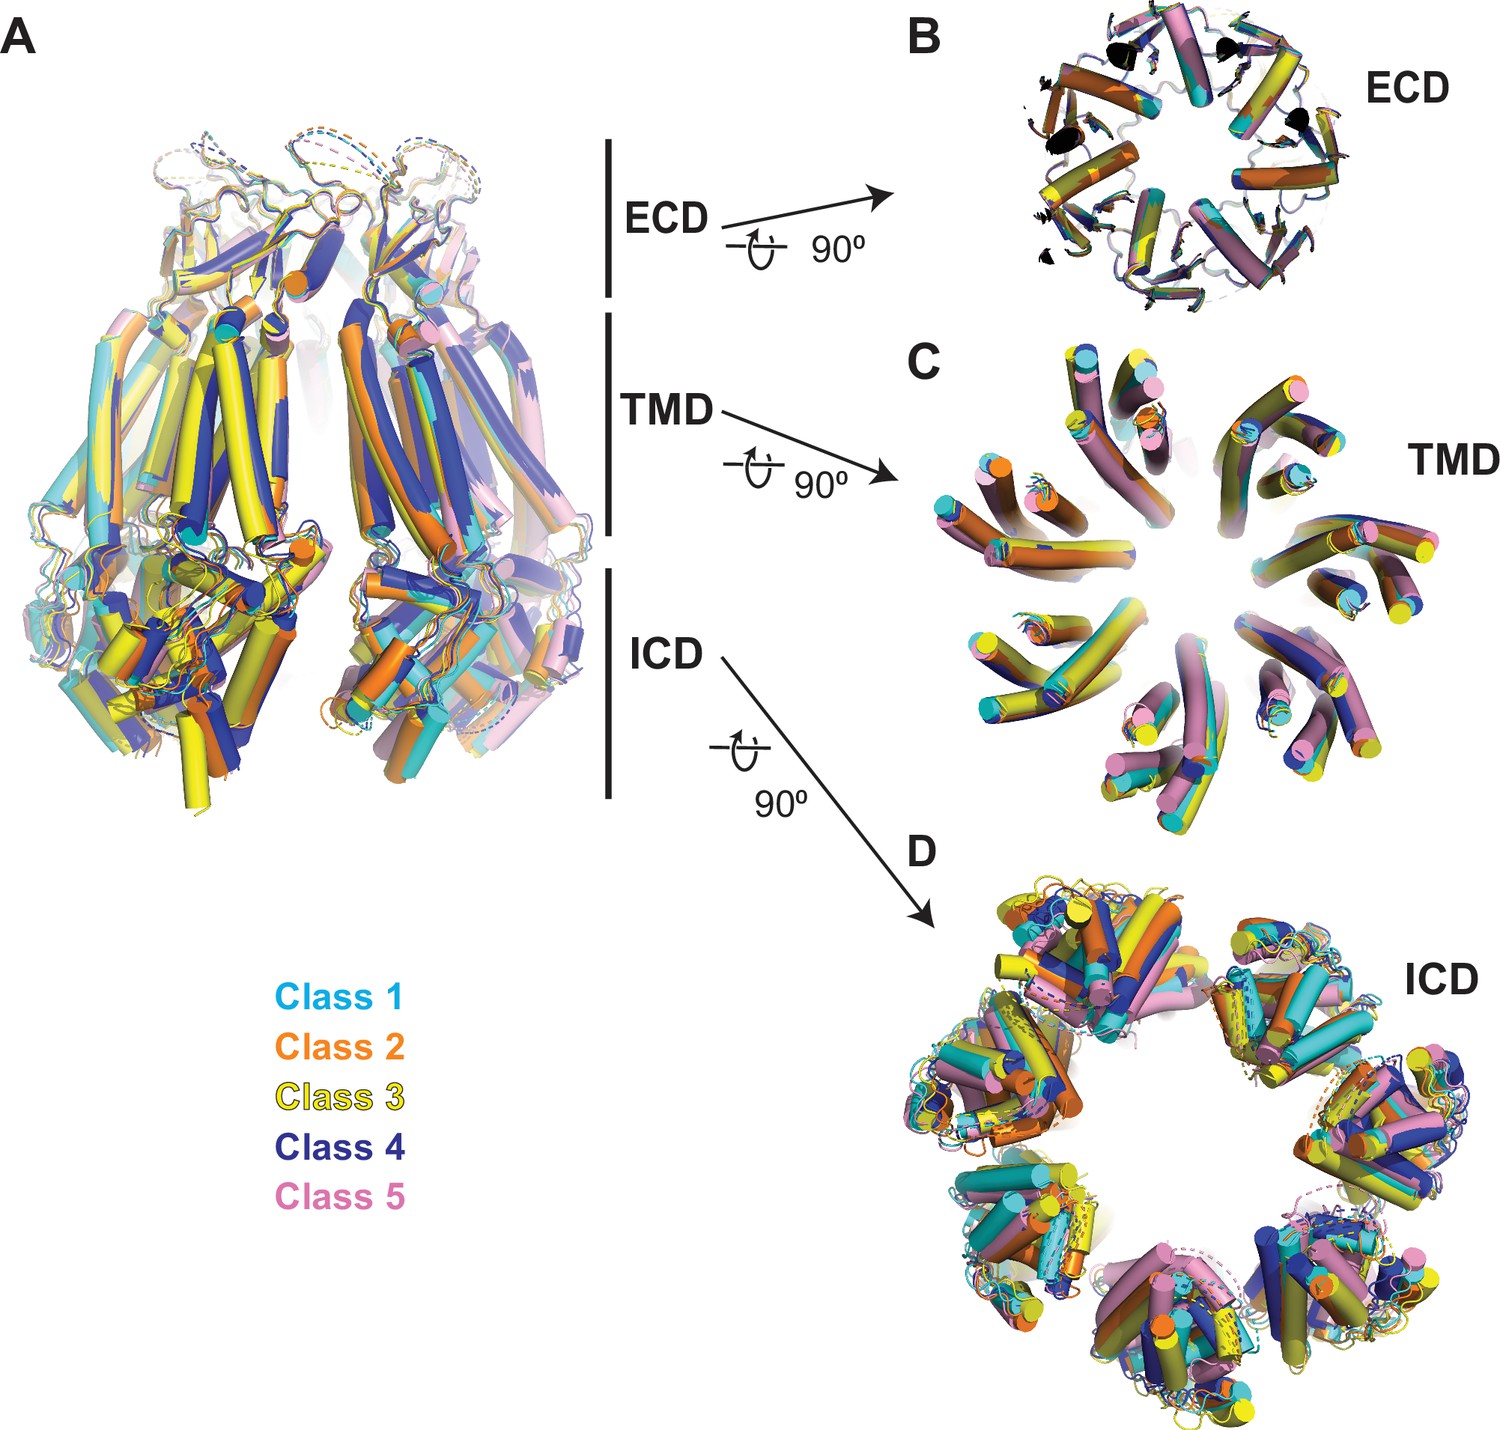
Comparison of 8C-8A(IL125) structures.
(A) Overlay of 8C-8A(IL125) structures in different classes viewed through the membrane plane. (B–D) Overlay of 8C-8A(IL125) structures in different classes viewed from the intracellular space focusing on the extracellular domain (ECD) (B), transmembrane domain (TMD) (C), and intracellular domain (ICD) (D). Structures are aligned on their ECDs and colored as indicated in the figure. The depths of the views for panels (B)–(D) are indicated in panel (A) with straight lines.
Figure 5—figure supplement 2
Comparison of the D40-K51 loop among different classes.
Close-up view of the pore around the residues D50 and K51, which are shown as sticks. The residues that adopt different conformations compared to others are labeled in red. The dashed circle indicates the pore-lining surface.
Figure 6 with 2 supplements
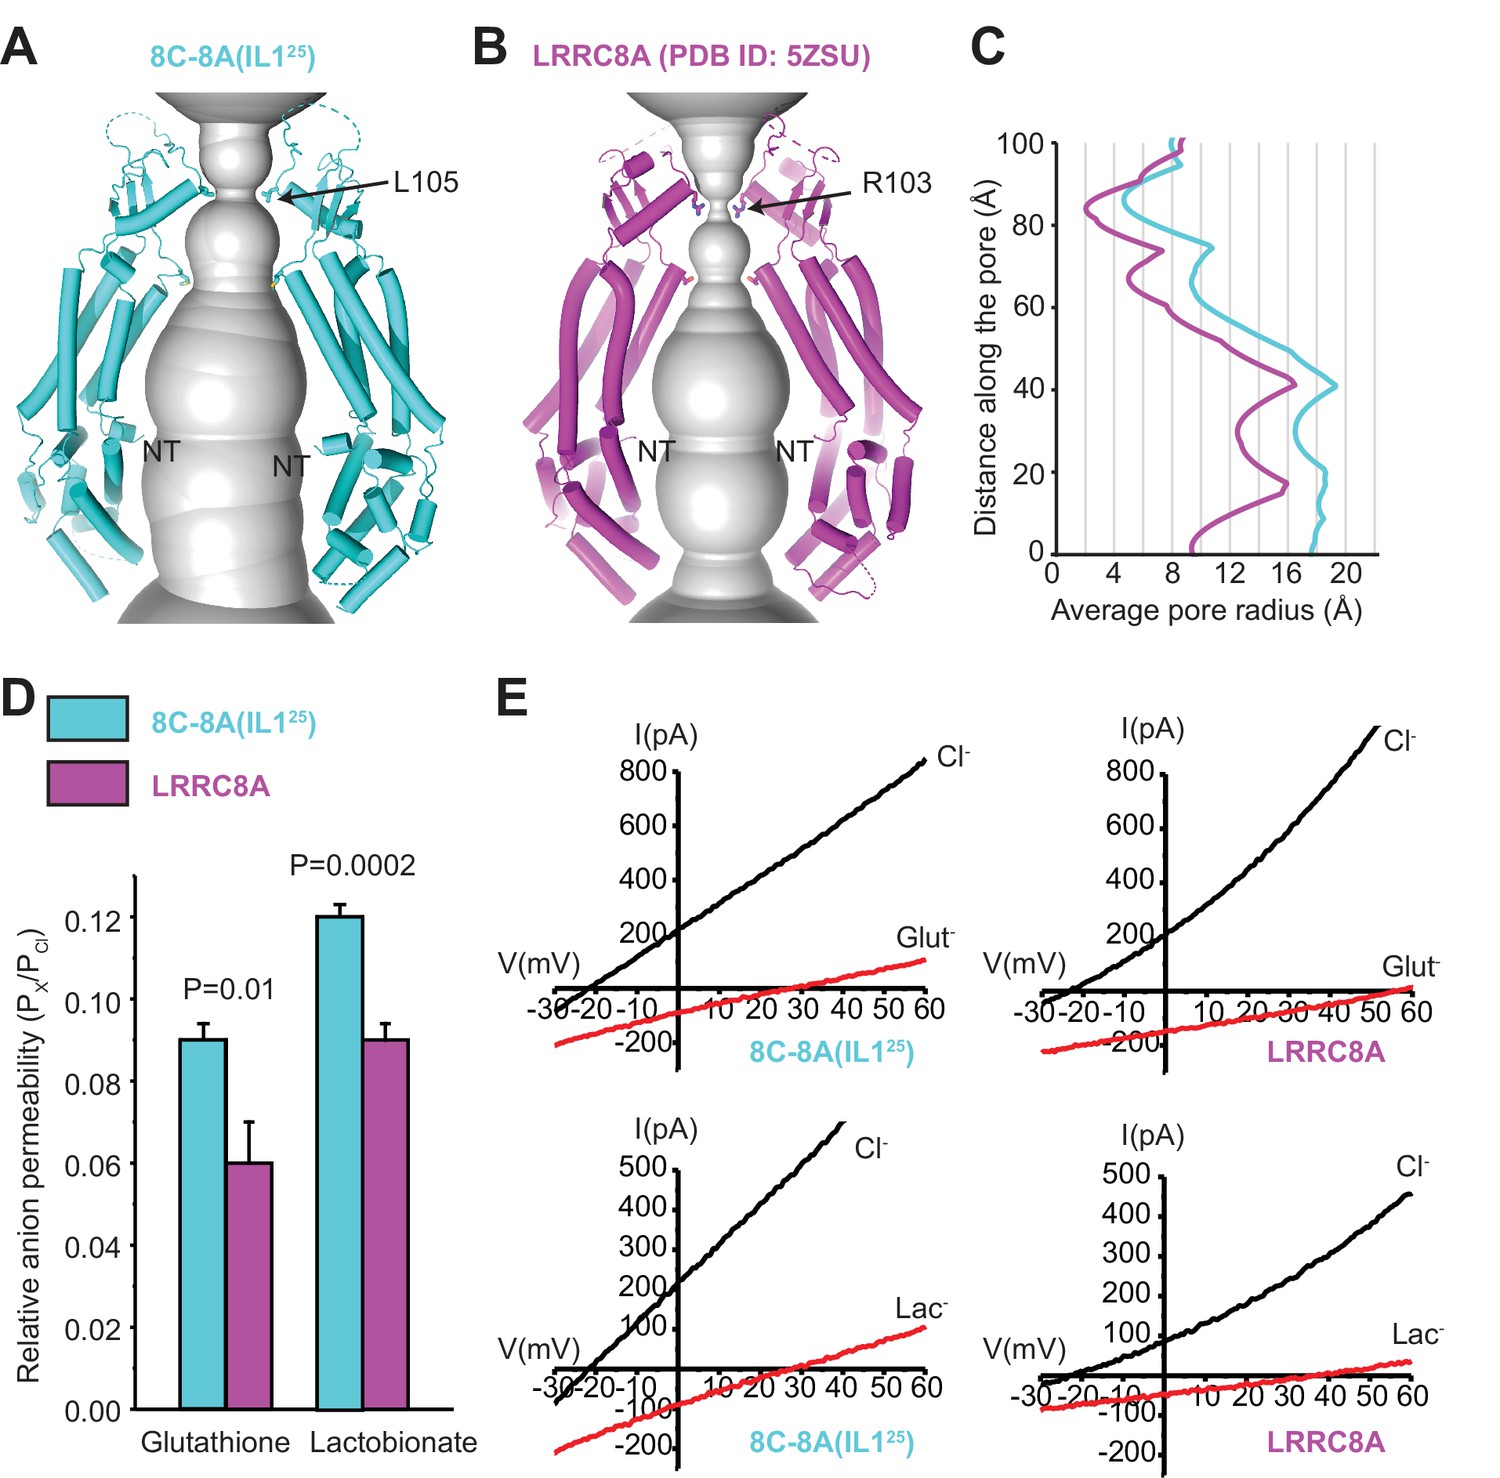
Comparison of channel pores.
(A–B) Pore openings of the 8C-8A(IL125) heptameric channel (class 1 structure) (A) and LRRC8A (PDB ID: 5ZSU) homohexameric channel (B) calculated using the software program HOLE (Smart et al., 1996). Only two opposing subunits are shown. Residues forming the constriction sites are shown as sticks. The first modeled residues at the N-termini are labeled as NT. (C) 1D graph of the average radius along the length of the 8C-8A(IL125) (cyan) and LRRC8A (magenta) channel pores. (D) Relative (Px/PCl) glutathione and lactobionate permeabilities calculated from reversal potential changes induced by replacing bath Cl- with the test anion. Values are means ± SEM (N=4–7). Statistical significance was determined using Student’s unpaired t-test. (E) Representative LRRC8A and 8C-8A(IL125) current traces in the presence of bath Cl- or after substitution with glutathione (Glut-) or lactobionate (Lac-). Currents were elicited by ramping membrane voltage from −100 to +100 mV.
Figure 6—figure supplement 1
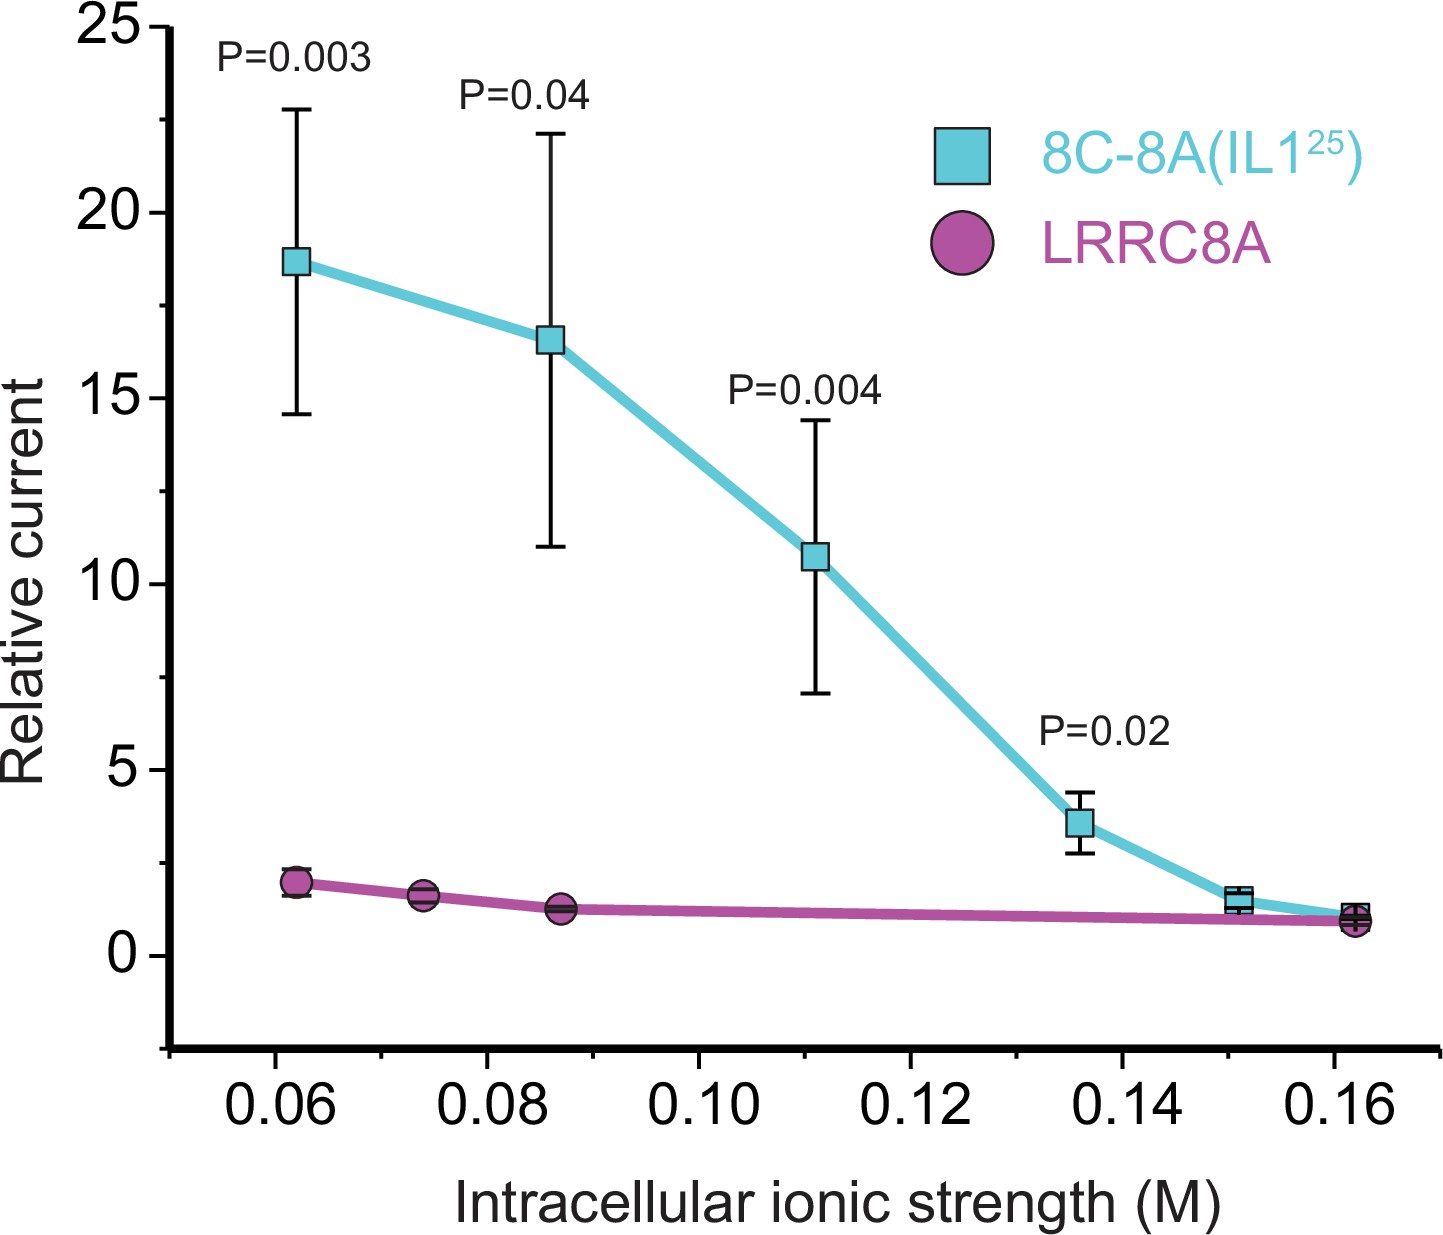
Effect of intracellular ionic strength on activation of LRRC8A and the 8C-8A(IL125) chimeric channel.
The relative current was quantified as the fold change in current measured immediately after whole-cell access was achieved and currents measured 120 s later. As we have shown previously (Yamada et al., 2021), LRRC8A currents activate only very slowly when intracellular ionic strength is reduced from a normal level of 0.162 to 0.062 M. However, no statistically significant (p>0.9) current activation is detected 120 s after whole-cell access even at the lowest intracellular ionic strength of 0.062 M. In striking contrast, significant (p=0.02) 8C-8A(IL125) current is detected at an intracellular ionic strength of 0.136 M. Reducing ionic strength further leads to more rapid current activation and larger current amplitudes measured at 120 s. The effect of ionic strength on the rate of 8C-8A(IL125) current activation is similar to what we have reported previously for native VRAC/LRRC8 channels (Cannon et al., 1998). The current amplitude was quantified at +60 mV above the measured reversal potential. Values are means ± SEM (N=5–8). Statistical significance was determined using Student’s unpaired t-test.
Figure 6—figure supplement 2
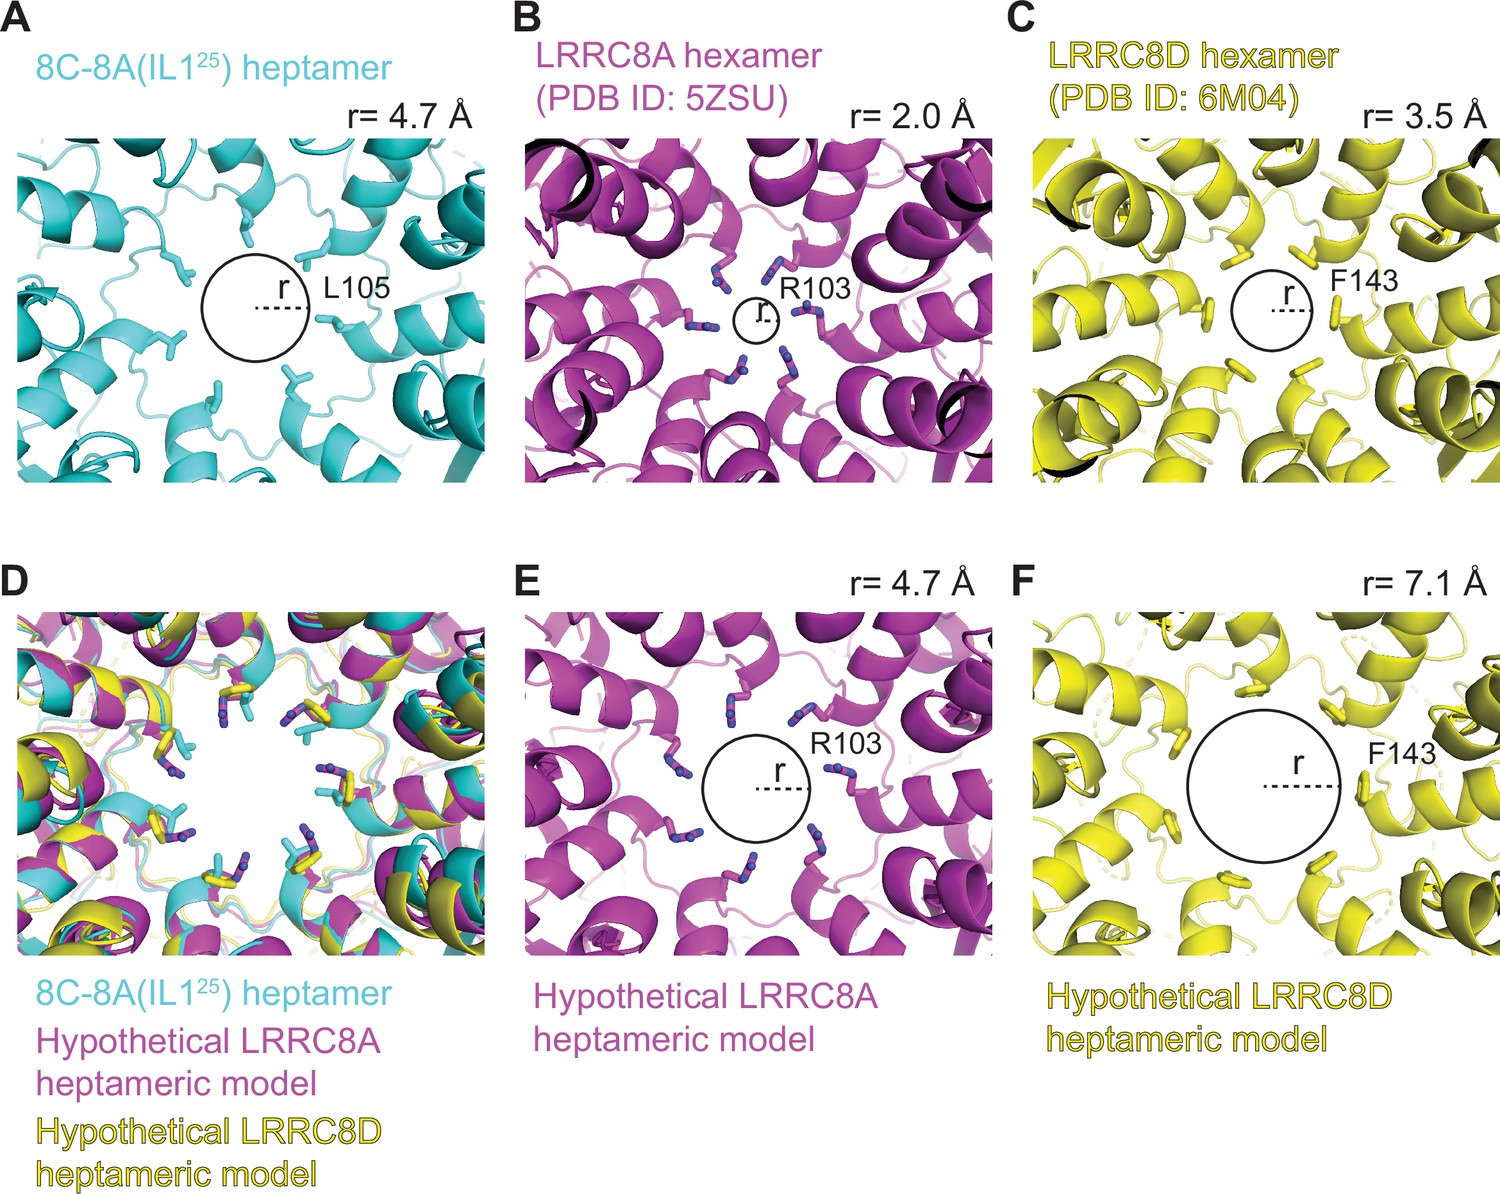
Heptameric oligomerization leads to larger pore sizes.
(A–C) Close-up cytoplasmic view of the narrowest constriction sites of 8C-8A(IL125) class 1 structure (A), LRRC8A (PDB ID: 5ZSU) (B), and LRRC8D (PDB ID: 6M04) (C). (D) The heptameric LRRC8A and LRRC8D models were obtained by overlaying one of the LRRC8A or LRRC8D subunits on the seven subunits of 8C-8A(IL125) heptamer by aligning the extracellular domains (ECDs). (E–F) Pores of hypothetical LRRC8A (E) and LRRC8D (F) heptamers. Residues forming the constriction are shown as sticks. The circles and the dashed lines represent the solvent-accessible pore size and radius, respectively. The radii of the pores were calculated using the software HOLE (Smart et al., 1996) and shown on top of each panel.
Figure 7 with 1 supplement
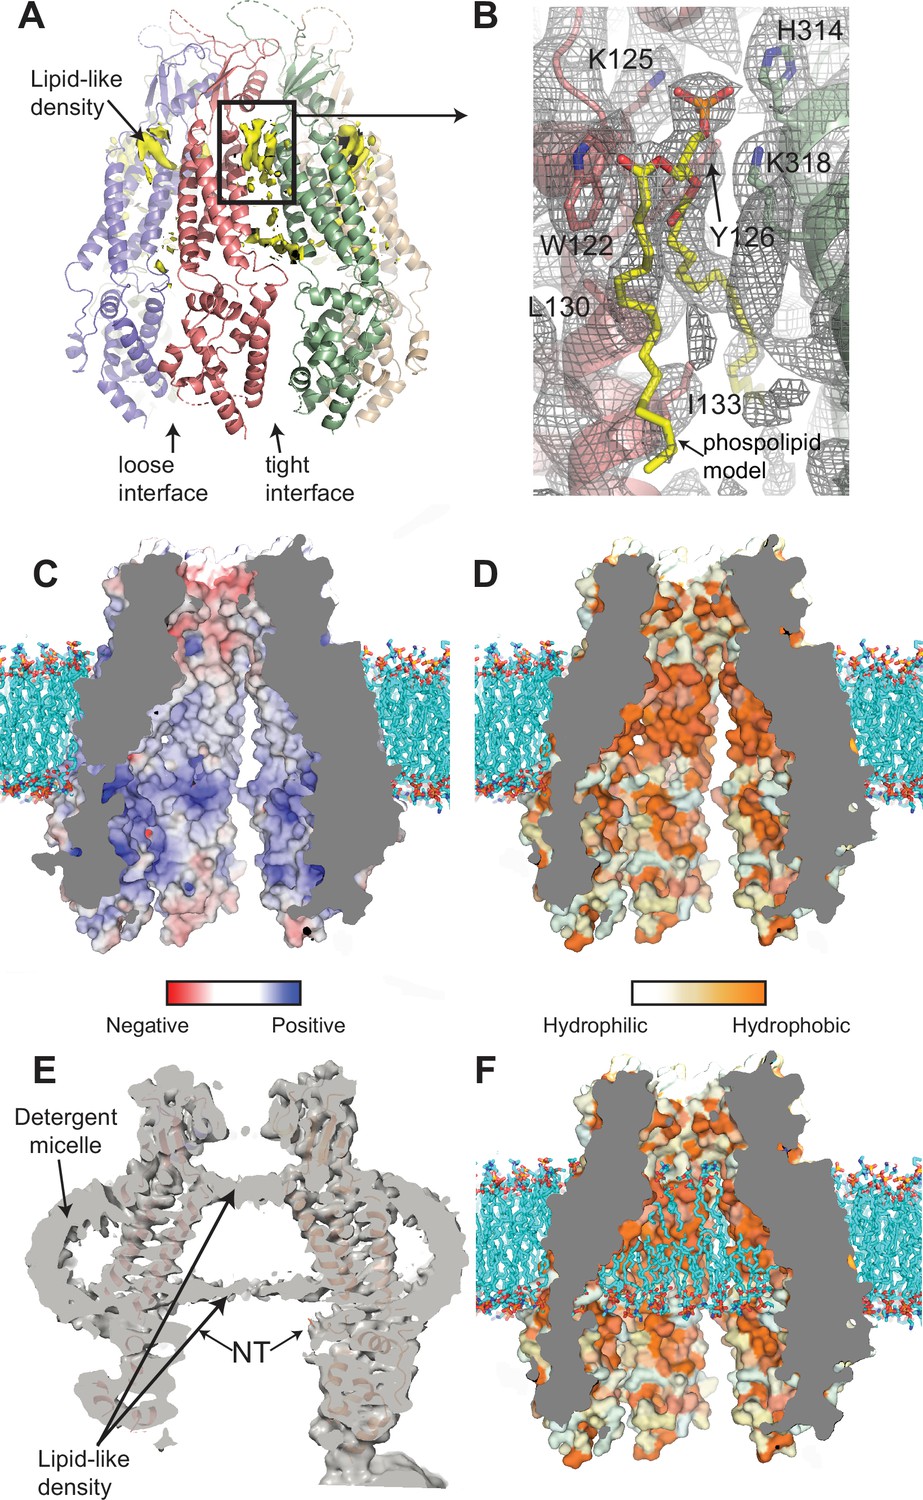
Interaction of lipids with the 8C-8A(IL125) chimera.
(A) Ribbon representation of the 8C-8A(IL125) class 1 structure along with the lipid-like cryo-electron microscopy (cryo-EM) densities (yellow) between the subunits viewed through the membrane plane. Loose and tight interfaces are indicated with arrows. (B) Close-up views of the boxed regions in panel (A). The cryo-EM map for the entire region visualized is shown as gray mesh. The phospholipid molecule shown as yellow sticks within the lipid-like density is used for illustration purposes only and not included in the deposited coordinate files. Select residues near the lipid-like densities are shown as sticks and labeled. (C–D) Surface representation of the 8C-8A(IL125) pore colored based on electrostatic charge (C) and hydrophobicity (D). The hypothetical lipid bilayer around the transmembrane domain (TMD) is built using CHARMM-GUI (Wu et al., 2014) and shown as sticks (cyan). Positioning of the protein within the bilayer is calculated using PPM 2.0 (Lomize et al., 2012). (E) A sliced view of the unsharpened cryo-EM map (gray, transparent) with the ribbon representation of the 8C-8A(IL125) class 1 structure. Arrows indicate densities corresponding to pore-blocking lipid-like densities and detergent micelles. (F) Hypothetical interaction of lipids with the inner surface of the pore is shown by placing phospholipids using CHARMM-GUI (Wu et al., 2014). Surface representation of the 8C-8A(IL125) colored based on hydrophobicity as in panel (D).
Figure 7—figure supplement 1
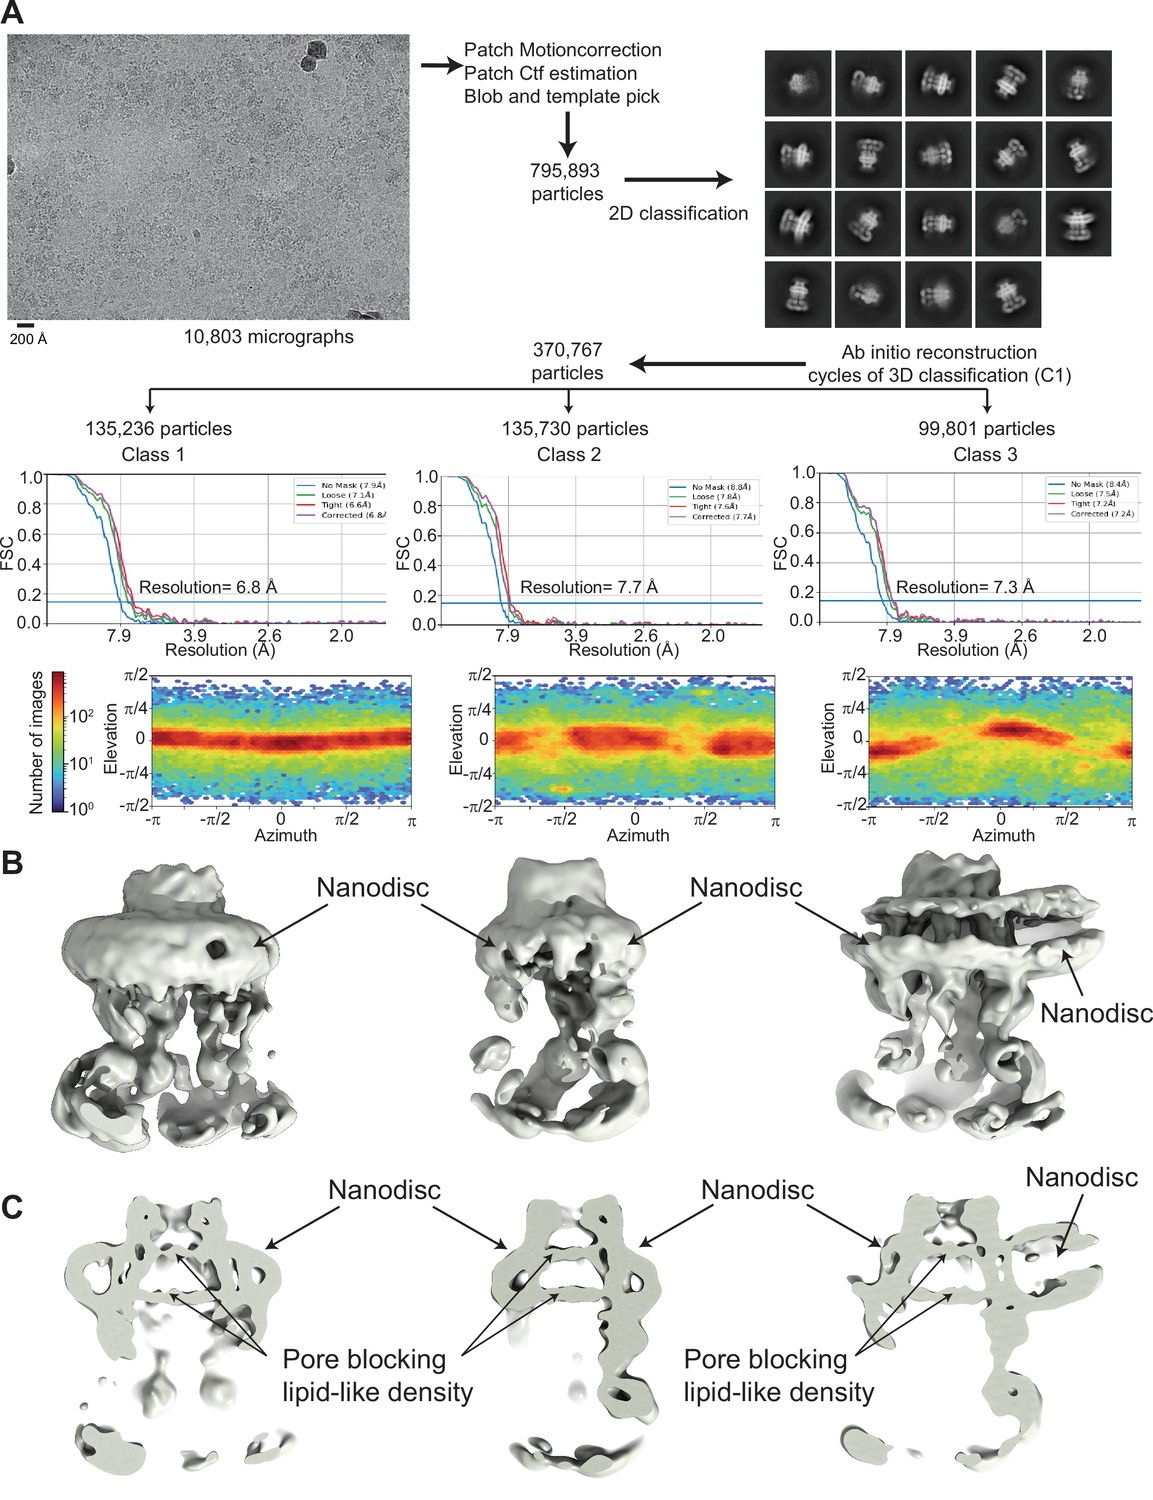
Cryo-electron microscopy (cryo-EM) analysis of 8C-8A(IL125) reconstituted in nanodiscs.
(A) Flowchart detailing the particle selection and refinement procedure to obtain the cryo-EM maps of the 8C-8A(IL125) nanodiscs. FSC curves and angular distributions are shown. (B–C) Full (B) and sliced (C) views of the cryo-EM maps of the 8C-8A(IL125) nanodiscs.
Tables
Table 1
Cryo-electron microscopy (cryo-EM) data collection, refinement, and validation statistics.
| Data collection and processing | |||||
|---|---|---|---|---|---|
| Microscope | FEI Krios G3i microscope | ||||
| Detector | Gatan K3 direct electron camera | ||||
| Nominal magnification | ×81,000 | ||||
| Voltage (kV) | 300 | ||||
| Electron exposure (e/Å2) | 54 | ||||
| Defocus range (µm) | –0.8 to –1.5 | ||||
| Pixel size (Å) | 1.1 | ||||
| Number of Micrographs | 3198 | ||||
| Particles images (no.) | 846,122 | ||||
| Conformational state | Class 1 | Class 2 | Class 3 | Class 4 | Class 5 |
| Symmetry imposed | C1 | C1 | C1 | C1 | C1 |
| Final particles images (no.) | 203,011 | 132,722 | 100,772 | 93,179 | 85,591 |
| Map resolution (Å) (FSC threshold = 0.143) | 3.4 | 3.6 | 3.7 | 3.8 | 4.0 |
| Refinement | |||||
| Model resolution (Å) (original map, FSC threshold = 0.5) | 3.6 | 3.9 | 3.9 | 4.2 | 4.4 |
| B-factor used for map sharpening (Å2) | –102.0 | –88.2 | –84.7 | –70.5 | –83 |
| Model composition | |||||
| Non-hydrogen atoms | 17,499 | 17,499 | 17,465 | 10,435 | 10,435 |
| Protein residues | 2101 | 2101 | 2097 | 2101 | 2101 |
| Mean B factors (Å2) | |||||
| Protein | 32.4 | 23.5 | 32.4 | 44.9 | 38.34 |
| R.m.s. deviations | |||||
| Bond lengths (Å) | 0.003 | 0.002 | 0.003 | 0.002 | 0.004 |
| Bond angles (°) | 0.563 | 0.525 | 0.553 | 0.516 | 0.807 |
| Molprobity score | 1.72 | 1.68 | 1.75 | 1.37 | 1.49 |
| Clash score | 5.04 | 4.84 | 6.02 | 1.14 | 1.54 |
| Poor rotamers (%) | 0.0 | 0.0 | 0.0 | 0.0 | 0.0 |
| Favored (%) | 92.9 | 93.5 | 93.6 | 89.95 | 88.3 |
| Allowed (%) | 7.1 | 6.5 | 6.4 | 10.0 | 11.6 |
| Disallowed (%) | 0 | 0 | 0 | 0.05 | 0.1 |
Table 2
Total buried solvent-accessible surface area between subunits for each domain.
| Buried surface area between the neighboring subunits (Å2)* | |||||||
|---|---|---|---|---|---|---|---|
| Subunits A-B | Subunits B-C | Subunits C-D | Subunits D-E | Subunits E-F | Subunits F-G | Subunits G-A | |
| Tight | Tight | Tight | Loose | Tight | Tight | Loose | |
| ECD† | 1995 | 1897 | 1964 | 1905 | 1900 | 1896 | 1869 |
| TMD† | 664 | 625 | 620 | 122 | 660 | 670 | 99 |
| ICD† | 462 | 294 | 500 | 0 | 559 | 502 | 0 |
-
*
Buried solvent-accessible surface area calculations were performed using the software NACCESS v2.1.1 (Hubbard and Thornton, 1993).
-
†
Domain definitions used for these calculations are as follows: ECD: residues 49–121 and 288–310; TMD: residues 20–48, 122–150, 260–287, and 311–342; ICD: residues 151–259 and 343–405.
Table 3
Composition of patch pipette and solutions.
| Patch pipette solutions | Bath solutions | ||||
|---|---|---|---|---|---|
| Control | Control | Control | Hypotonic | ||
| CsCl | 126 mM | 26 mM | 75 mM | 75 mM | |
| Cesium methanesulfonate | 100 mM | ||||
| MgSO4 | 2 mM | 2 mM | 5 mM | 5 mM | |
| Ca-gluconate2 | 1 mM | 1 mM | |||
| ATP-Na2 | 2 mM | 2 mM | |||
| GTP-Na2 | 0.5 mM | 0.5 mM | |||
| Glutamine | 2 mM | 2 mM | |||
| EGTA | 1 mM | 1 mM | |||
| HEPES | 20 mM | 20 mM | 12 mM | 12 mM | |
| Tris | 8 mM | 8 mM | |||
| CsOH | 12 mM | 12 mM | |||
| HCl | 2 mM | 2 mM | |||
| Glucose | 5 mM | 5 mM | |||
| Sucrose | 16 mM | 16 mM | 115 mM | 70 mM | |
| pH* | 7.2 | 7.2 | 7.4 | 7.4 | |
| Osmolality | 275 mOsm | 275 mOsm | 300 mOsm | 250 mOsm | |
| Ionic strength | 0.162 M | 0.162 M | |||
-
*
The pH of patch pipette and bath solutions was adjusted with CsOH and HCl, respectively.
Additional files
Download links
A two-part list of links to download the article, or parts of the article, in various formats.
Downloads (link to download the article as PDF)
Open citations (links to open the citations from this article in various online reference manager services)
Cite this article (links to download the citations from this article in formats compatible with various reference manager tools)
Cryo-EM structures of an LRRC8 chimera with native functional properties reveal heptameric assembly
eLife 12:e82431.
https://doi.org/10.7554/eLife.82431


