Genetic architecture of natural variation of cardiac performance from flies to humans
- Aix-Marseille University, INSERM, TAGC, Turing Center for Living systems, France
- Centre for Molecular Medicine Norway (NCMM), Norway
- Development, Aging and Regeneration Program, Sanford Burnham Prebys Medical Discovery Institute, United States
- CNRS, France
Figures
Figure 1 with 2 supplements

Quantitative genetics and genome-wide associations studies (GWAS) for cardiac traits in the Drosophila Genetic Reference Panel (DGRP).
(A) Left: Cardiac performance traits were analyzed in 167 sequenced inbred lines from the DGRP population. Approximately 12 females per line were analyzed. Right panels: Schematic of the Drosophila adult heart assay and example of M-mode generated from video recording of a beating fly heart. Semi-intact preparations of 1-week-old adult females were used for high-speed video recording followed by automated and quantitative assessment of heart size and function. The representative M-mode trace illustrate the cardiac traits analyzed. DI: diastolic interval; SI: systolic interval; HP: heart period (duration of one heartbeat); EDD: end diastolic diameter (fully relaxed cardiac tube diameter); ESD: end systolic diameter (fully contracted cardiac tube diameter). Fractional shortening (FS=EDD − ESD/EDD) and arrythmia index (AI=Std Dev (HP)/HP) were additionally calculated and analyzed. (B) Distribution of line means and within lines variations (box plots) from 167 measured DGRP lines for HP and EDD. DGRP lines are ranked by their increasing mean phenotypic values. For both phenotypes, representative M-modes from extreme lines are shown below (other traits are displayed in Figure 1—figure supplement 1). (C) Pearson residuals of chi-square test from the comparison of indicated single nucleotide polymorphism (SNP) categories in the DGRP and among variants associated with cardiac traits. According to DGRP annotations, SNPs are attributed to genes if they are within the gene transcription unit (5’ and 3’ UTR, synonymous and non-synonymous coding, introns) or within 1 kb from transcription start and end sites (1 kb upstream, 1 kb downstream). NA: SNPs not attributed to genes (>1 kb from transcription start site [TSS] and transcription end sites [TES]). (D) Comparison of gene sets identified by single marker using Fast-LMM (LMM) and in interaction using FastEpistasis (Epistasis). The Venn diagram illustrates the size of the two populations and their overlap. (E) Overlap coefficient of gene sets associated with the different cardiac traits analyzed.
-
Figure 1—source data 1
Individual values for cardiac traits analyzed across the 167 Drosophila Genetic Reference Panel (DGRP) lines.
Individual and DGRP line number are indicated. Phenotypic values were determined from high-speed video recording on dissected flies and movie analysis using Semi-automated Heartbeat Analysis (SOHA) (Mackay et al., 2012).
- https://cdn.elifesciences.org/articles/82459/elife-82459-fig1-data1-v1.xlsx
-
Figure 1—source data 2
Variants identified by FastLMM as associated to indicated phenotypes.
Among the 100 best ranked associations, only variants with MAF >4% were retained. Tables for variants mapped to genes and for variants that are not within gene mapping criteria (>1 kb from transcription start site [TSS] and transcription end sites [TES]) are indicated.
- https://cdn.elifesciences.org/articles/82459/elife-82459-fig1-data2-v1.xlsx
-
Figure 1—source data 3
All FastEpistasis data on mean phenotypes, per quantitative trait.
Single nucleotide polymorphism (SNP) ID, position, associated genes, and statistics are indicated for both focal SNPs (left) and their interacting SNPs (right). Each sheet displays the results for indicated quantitative traits, except for the first one which is a merge of all quantitative traits association analyses.
- https://cdn.elifesciences.org/articles/82459/elife-82459-fig1-data3-v1.xlsx
Figure 1—figure supplement 1
Quantitative genetics of cardiac traits means.
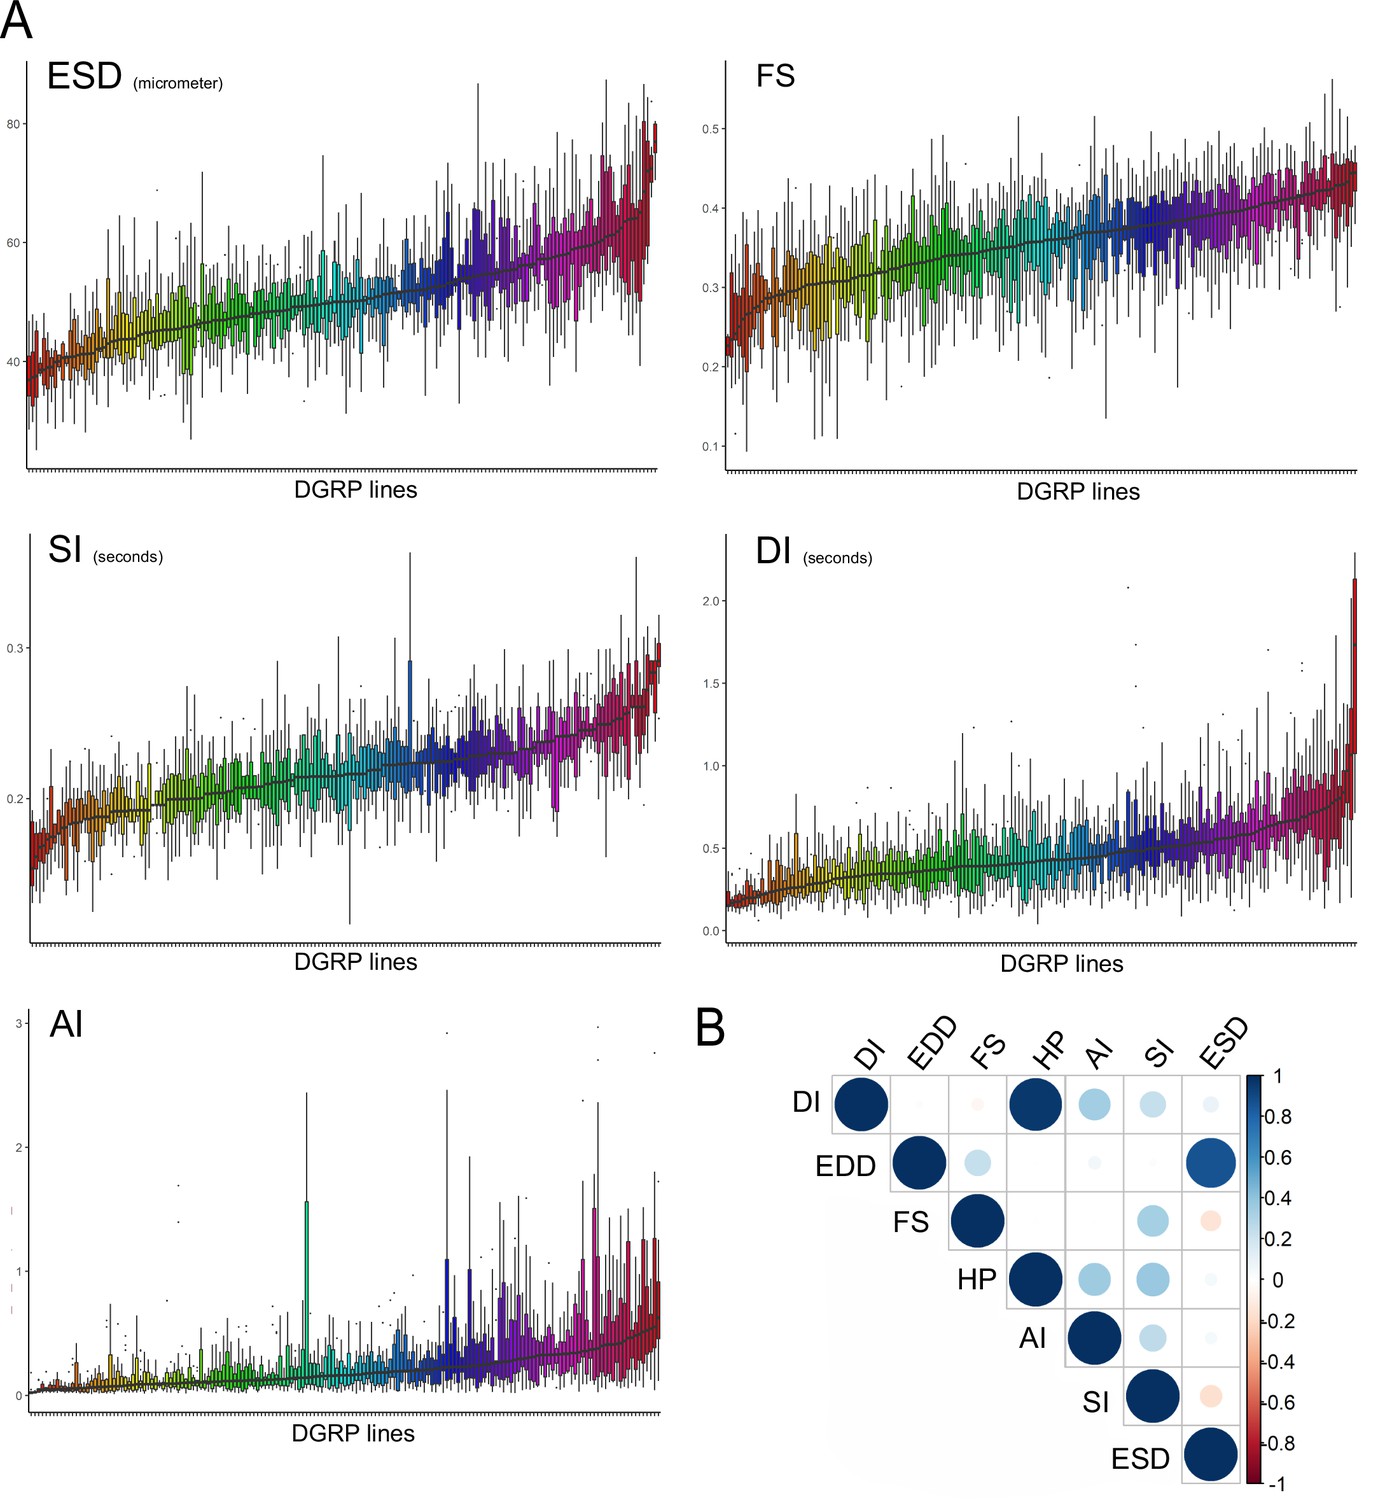
(A) Distribution of line means and within lines variations (box plots) from 167 measured Drosophila Genetic Reference Panel (DGRP) lines for diastolic interval (DI), systolic interval (SI), arrhythmia index (AI), end systolic diameter (ESD), and fractional shortening (FS). DGRP lines are ranked by their mean phenotypic values. (B) Overall correlations between phenotypes in the DGRP population. Spearman correlations were calculated based on average of line means for each cardiac trait.
Figure 1—figure supplement 2

Quantile-quantile (QQ) plots of association p-values.
QQ plot displays the quantile distribution of observed marker-phenotype association p-values vs. the distribution of expected p-values assuming the null hypothesis (uniformly distributed). The first part shows the QQ plot for trait means and the second part shows the QQ plot for trait CVe’s. QQ plots fail to capture deviation from uniformity for most of the phenotypes.
Figure 2 with 2 supplements
Functional annotations and validations of genes associated with genome-wide associations studies (GWAS) for cardiac performance.
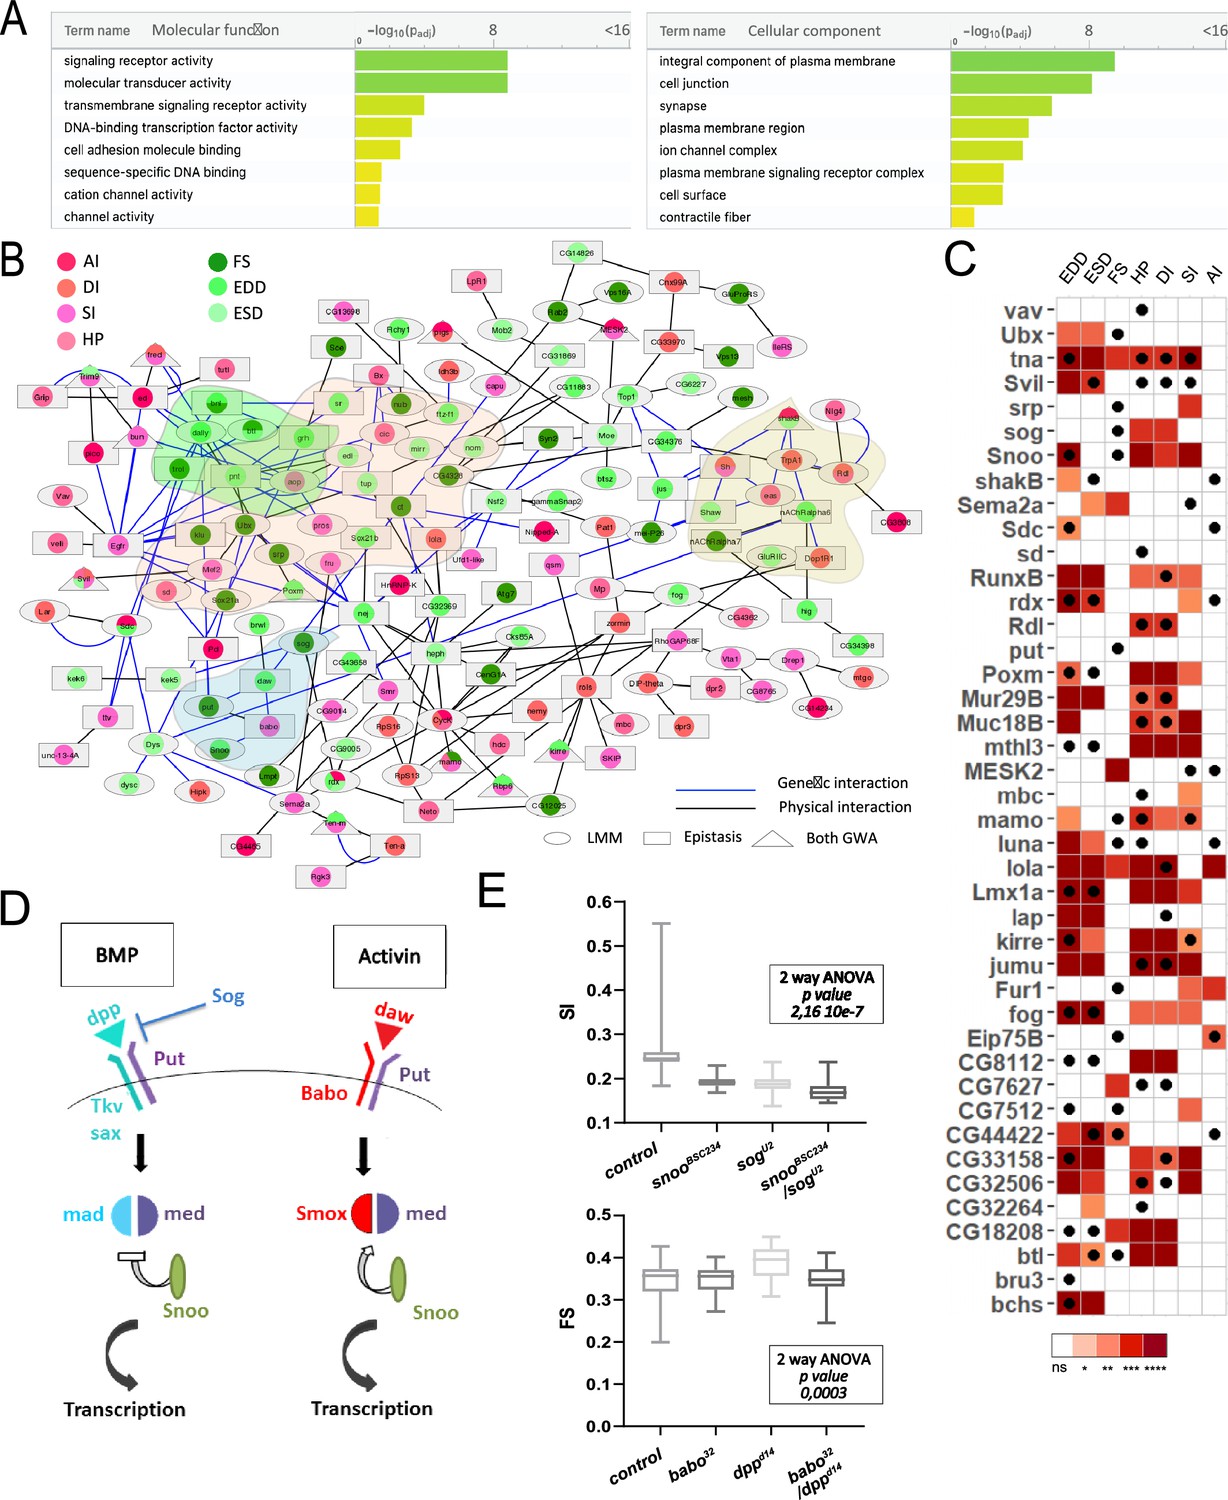
(A) Gene Ontology (GO) enrichment analyses. Selected molecular functions (MF, left) and cellular components (CC, right) associated with cardiac performances at FDR < 0.05 are shown. Enrichment analysis was performed using G:profiler with a correction for multitesting (see Materials and methods). (B) Interaction network of genes associated with natural variations of cardiac performance. Direct genetic and physical interactions between cardiac fly GWAS genes are displayed. Nodes represent genes and/or proteins, edges represent interactions (blue: genetic; black: physical). Node shapes refer to single marker and/or epistasis GWAS, node color to the cardiac performances phenotype(s) for which associations were established. Genes and proteins highlighted in pink point to transcription factors, in green and blue to signaling pathways (FGF and TGFb, respectively), and in yellow to ion channels. (C) Heatmap representing the effects on indicated cardiac traits of heart-specific RNAi-mediated knockdown (KD) of 42 genes identified in GWAS for cardiac performance. Results of Wilcoxon rank sum test of the effects of indicated heart-specific RNAi-mediated gene KD (rows) for cardiac performance traits (columns), analyzed on semi-intact 1-week females flies. Detailed data are presented in Figure 2—source data 2. Thirty-eight (out of 42) genes tested lead to significant effects on cardiac performance traits upon KD. Black dots indicate the trait(s) for which the corresponding gene was associated in GWAS. ns: not significant; *: pval <0.05; **: pval <0.01; ***: pval <0.005; ****pval <0.0001 (p-values were adjusted for multiple testing using Bonferroni correction). Comparison with heart-specific effect of random selected genes is displayed in Figure 2—figure supplement 1. (D) Schematic drawing of BMP and activin pathways in Drosophila. (E) Genetic interactions between BMP and activin pathway genes. Genetic interactions tested between snooBSC234 and sogU2 for SI and between dppd14 and babo32 for FS (other phenotypes are shown in Figure 2—figure supplement 2). Cardiac traits were measured on each single heterozygotes and on double heterozygotes flies. Two-way ANOVA reveals that the interaction between snooBSC234 and sogU2 for SI and between dppd14 and babo32 for FS are significant. Detailed data for interaction effect corresponding to all phenotypes are displayed in Figure 2—figure supplement 2.
-
Figure 2—source data 1
Collection of physical (IP, Y2H) and genetic interactions identified in Drosophila.
- https://cdn.elifesciences.org/articles/82459/elife-82459-fig2-data1-v1.xlsx
-
Figure 2—source data 2
Data from validation experiments.
(Heart-specific RNAi validations and tests for genetic interactions among BMP members.)
- https://cdn.elifesciences.org/articles/82459/elife-82459-fig2-data2-v1.xlsx
Figure 2—figure supplement 1
Heart-specific RNAi-mediated knockdown (KD) of random selected genes.
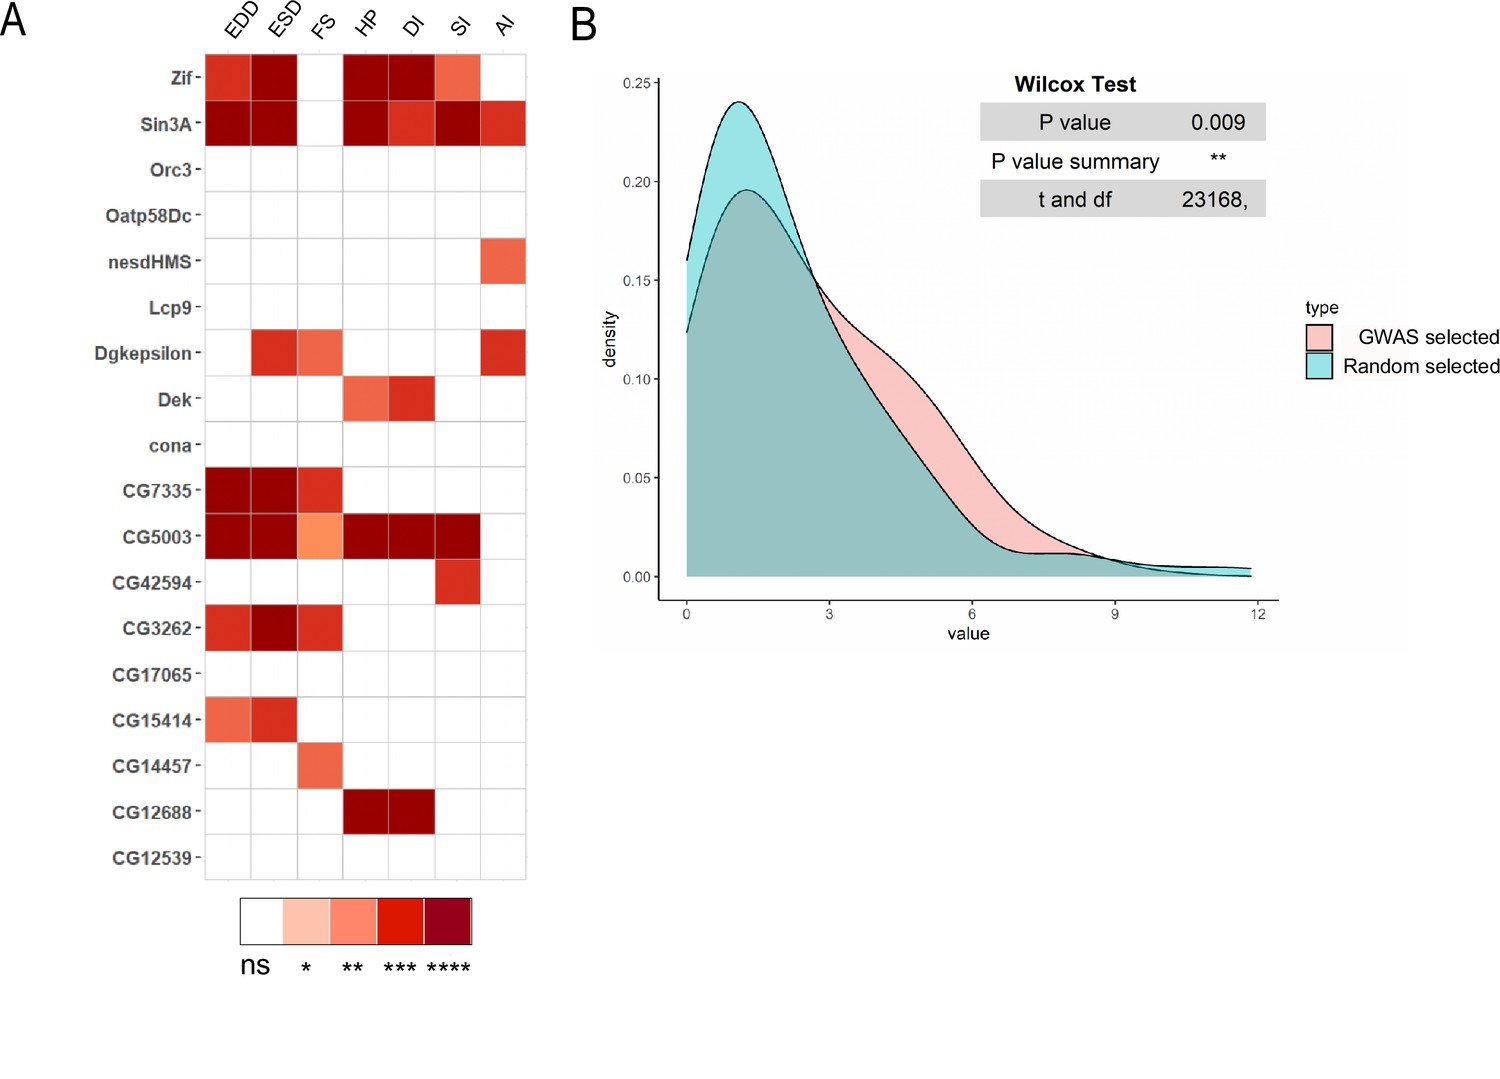
(A) Heatmap representing the effects on indicated cardiac traits of heart-specific RNAi-mediated KD of 20 genes selected randomly (below the top 100 threshold for reporting associations). Results of Wilcoxon rank sum test of the effects of indicated heart-specific RNAi-mediated gene KD (rows) for cardiac performance traits (columns), analyzed on semi-intact 1-week females’ flies. (B) For each phenotype and each gene, Z-scores summarizes the difference in the phenotype distribution from tested genes to their respective control (detailed data are in Figure 2—source data 2). The density curve highlighted in pink shows the distribution of the absolute Z-scores of all the phenotypes for the genome-wide associations studies (GWAS) associated genes and the density curve in blue highlights the corresponding distribution for randomly selected genes. Using the Mann-Whitney-Wilcoxon test, we showed that the Z-scores of GWAS associated genes were significantly different (higher) from the randomly selected genes.
Figure 2—figure supplement 2

Genetic interactions between BMP and activin pathway genes.
(A) Cardiac performances of controls, snooBSC234, sogU2 heterozygotes, and snooBSC234; sogU2 double heterozyotes. Box plots and Wilcoxon test results are indicated (*: pval<0.05; **: pval<0.01; ***: pval<0.005; ****: pval<0.0001). n: number of individual flies analyzed for each genotype. p-Values from two-way ANOVA, testing the significance of the genetic interaction between snooBSC234 and sogU2, are indicated for each phenotype. (B) Cardiac performances phenotypes of heterozygotes for babo32 and dppd14 and of babo32; dppd14 double heterozyotes. Box plots and Wilcoxon test results are indicated (*: pval< 0.05; **: pval<0.01; ***: pval< 0.005; ****: pval<0.0001). n: number of individual flies analyzed for each genotype. The two-way ANOVA p-values testing the significance of the genetic interaction between babo32 and dppd14 are reported. (C) Cardiac performances phenotypes of heterozygotes for babo32 and tkv8 and of babo32; tkv8 double heterozyotes. Box plots and Wilcoxon test results are indicated (*: pval< 0.05; **: pval<0.01; ***: pval< 0.005; ****: pval<0.0001). n: number of individual flies analyzed for each genotype. The two-way ANOVA p-values testing the significance of the genetic interaction between babo32 and tkv8 are reported. (D) Cardiac performances phenotypes of heterozygotes for smoxG0348 and mad12 and of smoxG0348; mad12 double heterozyotes. Box plots and Wilcoxon test results are indicated (*: pval< 0.05; **: pval<0.01; ***: pval< 0.005; ****: pval<0.0001). n: number of individual flies analyzed for each genotype. The two-way ANOVA p-values testing the significance of the genetic interaction between smoxG0348 and mad12 are reported. (E) Cardiac performances phenotypes of heart-specific dpp RNAi knockdown. Hand>Gal4; UAS RNAi 1-week adult females were analyzed for cardiac performance. Box plots and Wilcoxon test results are indicated (*: pval< 0.05; **: pval<0.01; ***: pval< 0.005; ****: pval<0.0001). n: number of individual flies analyzed for each genotype.
Figure 3
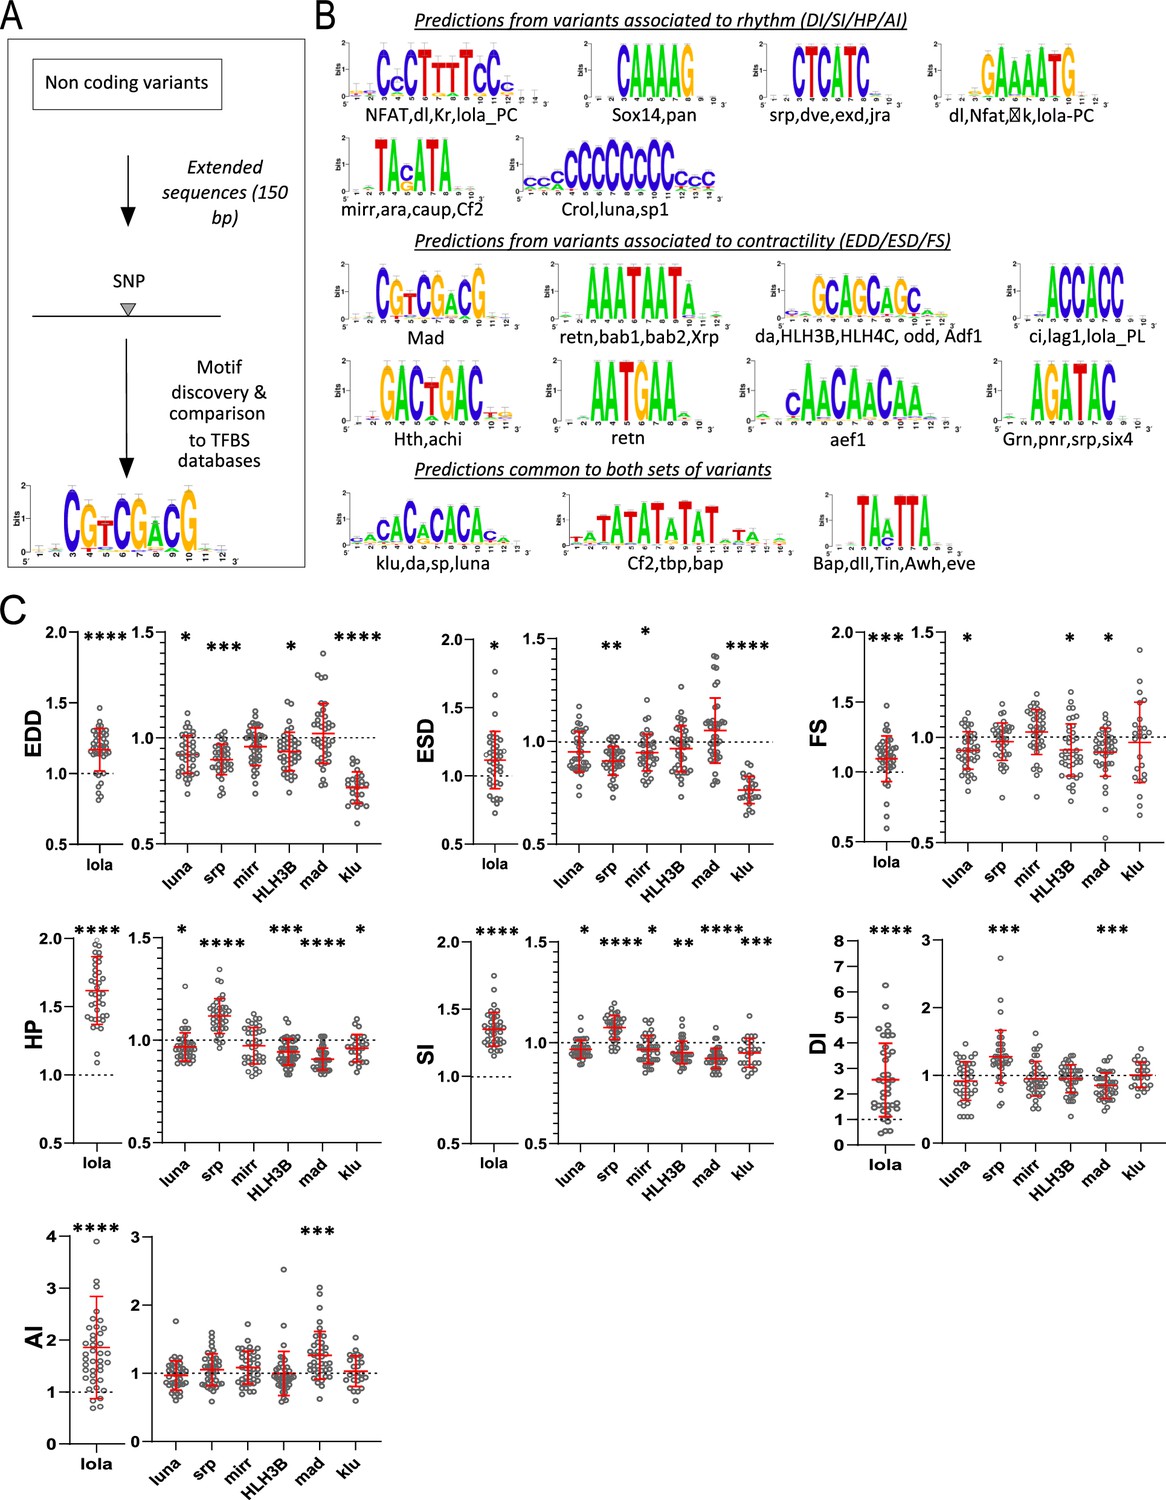
Transcription factor binding site (TFBS) predictions from sequences surrounding non-coding variants and in vivo validation of cognate transcription factors (TFs).
(A) Schematic representation of the workflow used for motifs analysis in the vicinity of the non-coding variants and comparison with TFBSs databases. (B) Logo representation of position-specific scoring matrices (PSSMs) identified in corresponding sets of non-coding variants. Potential cognate TFs are indicated and were identified by comparing PSSMs to TFBSs databases. (C) Cardiac-specific RNAi knockdown phenotypes of TFs tested in vivo. Hand>Gal4; UAS RNAi 1-week adult females (n>30 per cross) were analyzed for cardiac performance in intact flies. Scatter plots of individual data, mean, and SD are represented. Wilcoxon test results are indicated (*: pval <0.05; **: pval <0.01; ***: pval <0.005; ****pval <0.0001). Data were normalized to genotype matched controls. Raw data are presented in Figure 2—source data 2. Detailed statistical analyses are in Supplementary file 2e.
-
Figure 3—source data 1
Variants in non-coding regions used for motif discovery, associated with end diastolic diameter (EDD), end systolic diameter (ESD), and fractional shortening (FS) (‘structure’) and to AI, DI, SI, and HP (‘rhythm’) for both mean and CVe of cardiac traits.
- https://cdn.elifesciences.org/articles/82459/elife-82459-fig3-data1-v1.xlsx
Figure 4 with 2 supplements
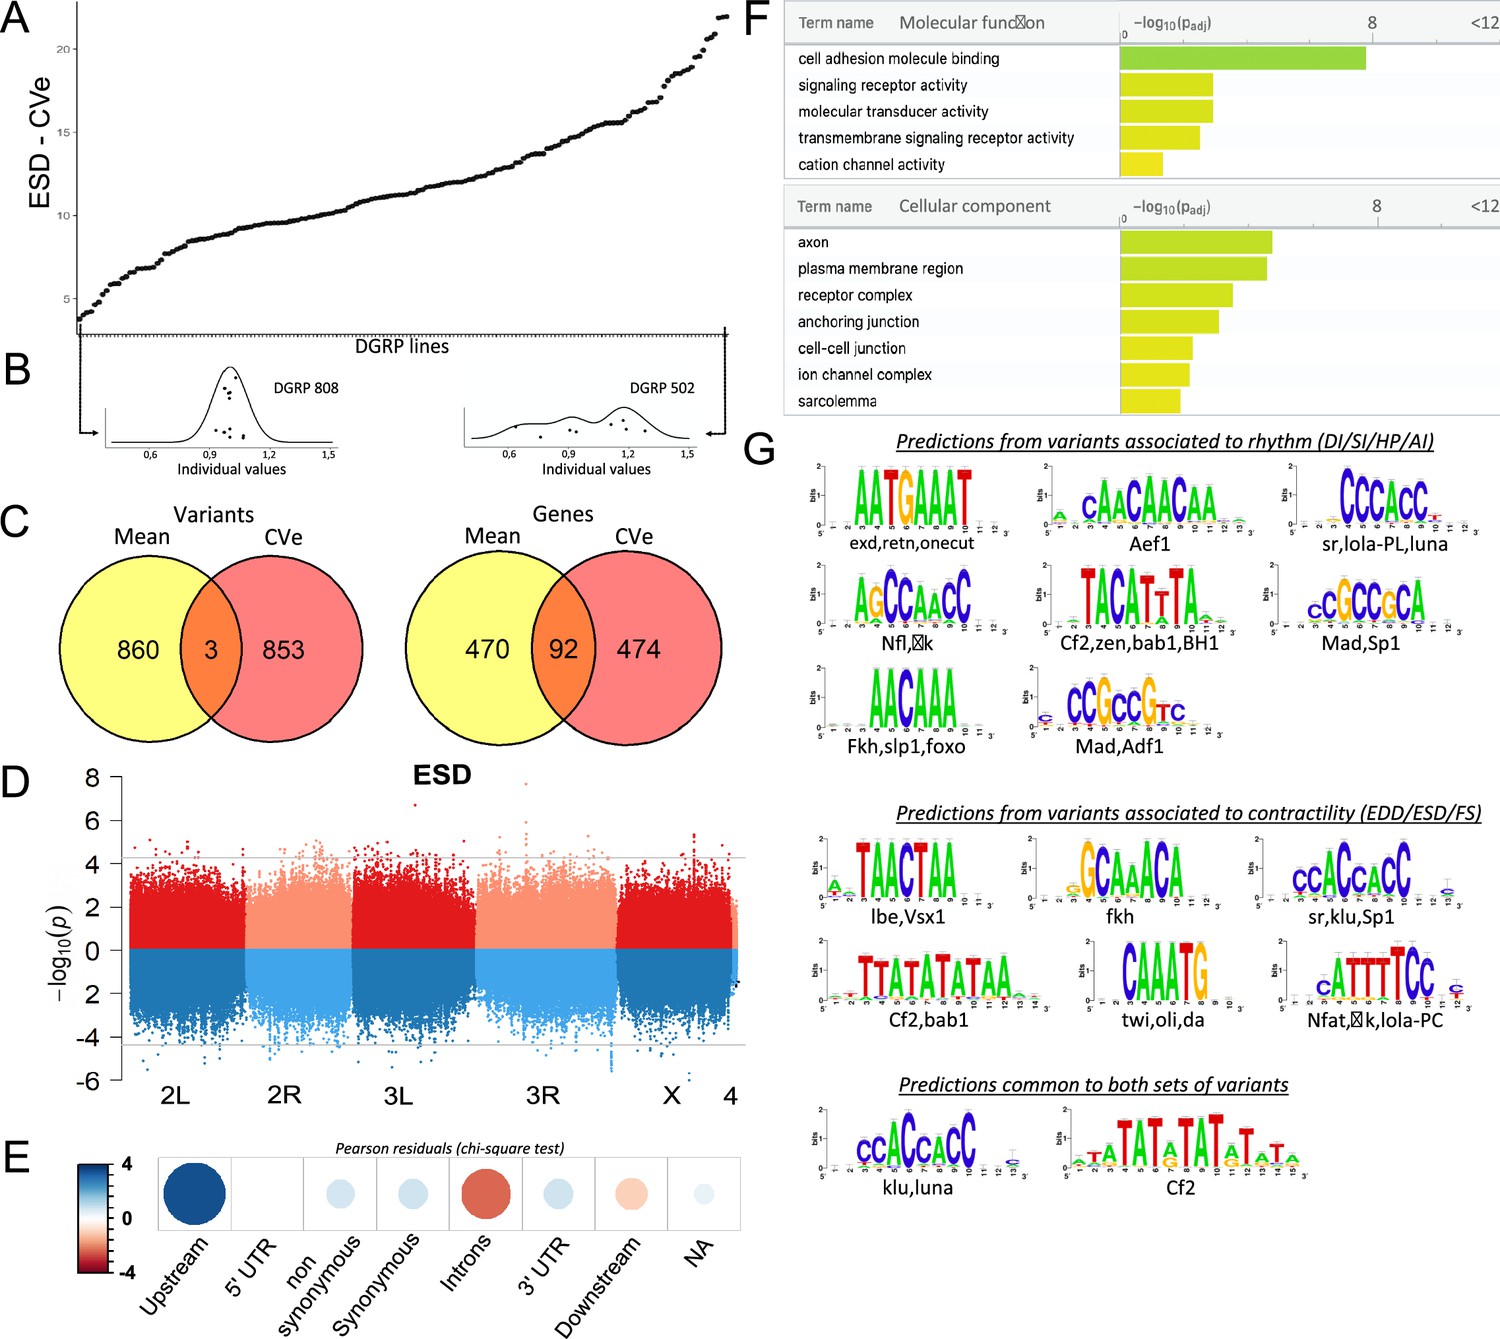
Quantitative genetics and genome-wide associations studies (GWAS) for cardiac traits CVe in the Drosophila Genetic Reference Panel (DGRP).
(A) Distribution of end systolic diameter (ESD) CVe values among DGRP lines. Lines are arranged by increasing CVe values (other phenotypes are displayed in Figure 4—figure supplement 1). (B) Distribution of ESD values across individuals for two representative DGRP lines with low and high intra-genotypic variability. Each dot represents ESD value of a single fly. (Individual values scaled by line mean). (C) Venn diagram illustrating the overlap between single nucleotide polymorphisms (SNPs) (left) and genes (right) associated with mean (yellow) and CVe traits (pink). While only three SNPs were retrieved from GWAS of both mean and CVe traits, genes associated with CVe traits are largely overlapping with those associated with mean traits. (D) Miami plots showing the results of GWAS performed on mean of ESD (top, red) and ESD CVe (bottom, blue). No overlap between sets of variants is observed. Miami plots for other traits are displayed in Figure 4—figure supplement 2. (E) Pearson residuals of chi-square test from the comparison of indicated SNPs categories in the DGRP and among variants associated with cardiac traits CVe (see legend to Figure 1C for detailed description of SNPs categories). (F) Gene Ontology (GO) enrichment analyses of genes associated with CVe traits. Selected molecular functions and cellular components associated with variance of cardiac performances at FDR < 0.05 are shown. (G) Logo representation of position-specific scoring matrices (PSSMs) identified in corresponding sets of non-coding variants associated with cardiac traits CVe. Potential cognate transcription factors (TFs) indicated below were identified by comparing PSSMs to TF binding sites databases.
-
Figure 4—source data 1
Variants identified associated to phenotypic variance (Cve).
Sheets ‘phenotypes_CVe’: Variants among the 100 best ranked associations for each cardiac trait, with information about the associated genes and the number of Drosophila Genetic Reference Panel (DGRP) lines in which they are present. Variants among the 100 best ranked associations for each cardiac trait that are not within gene mapping criteria (>1 kb from transcription start site [TSS] and transcription end sites [TES]) are shown below. sheets ‘FastEpistasis_CVe_...’: All FastEpistasis data (on traits CVe), per phenotypes. SNPs ID, position, associated genes, and statistics are indicated for both focal SNPs (left) and their interacting SNPs (right). Each sheet displays the results for indicated quantitative traits, except for the first one which is a merge of all quantitative traits association analyses.
- https://cdn.elifesciences.org/articles/82459/elife-82459-fig4-data1-v1.xlsx
Figure 4—figure supplement 1
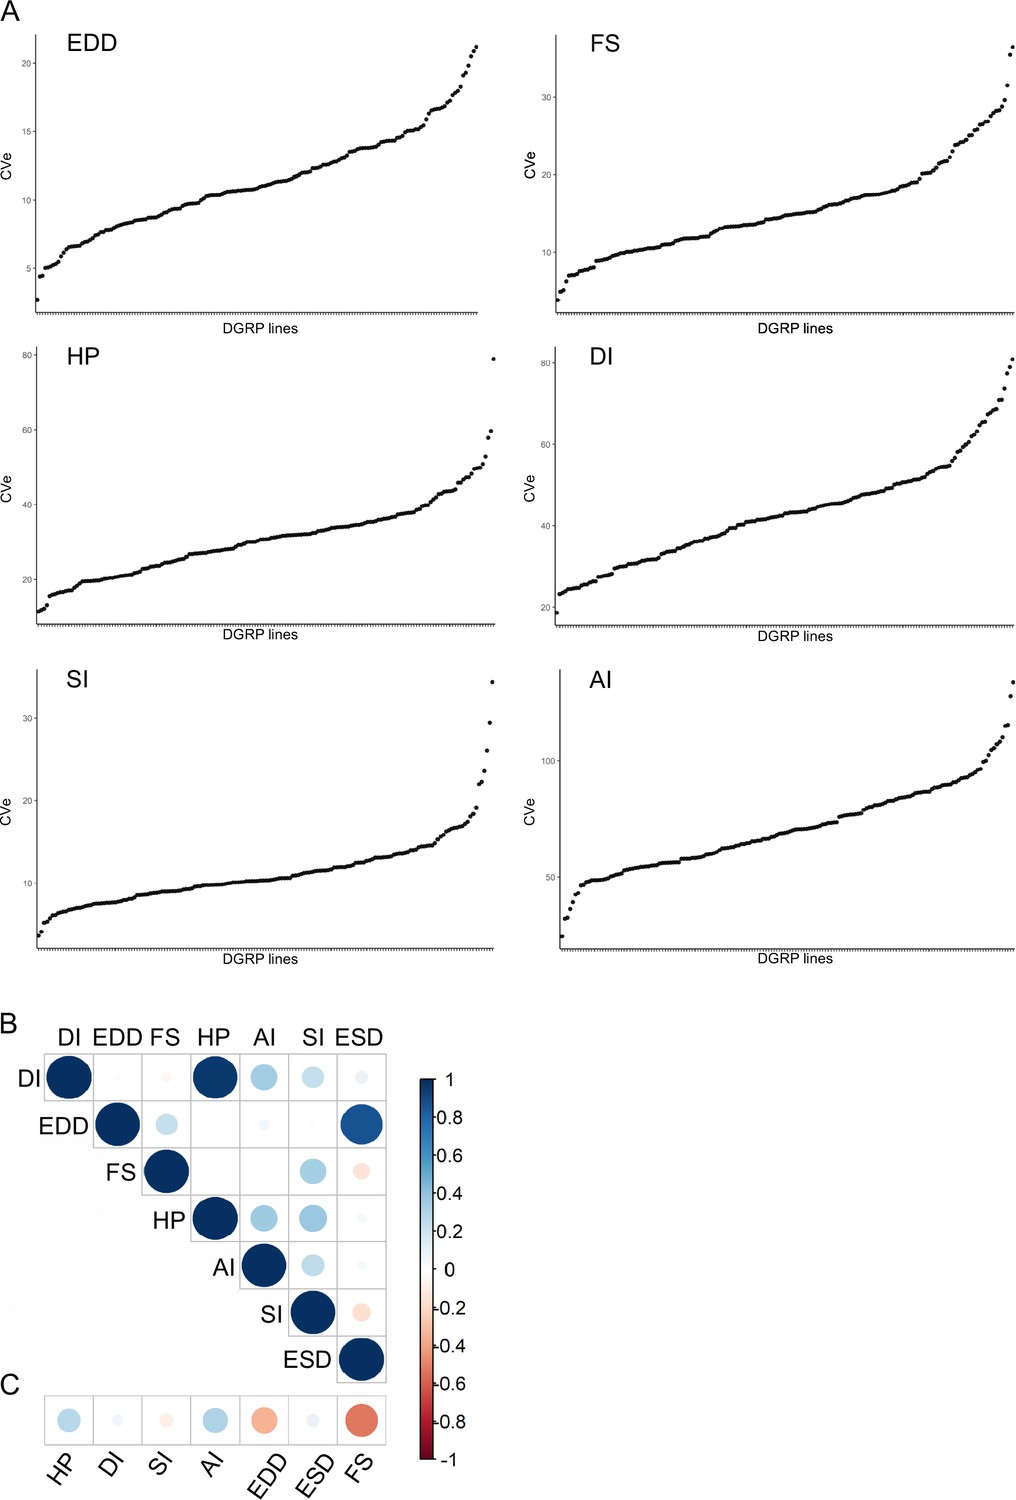
Quantitative genetics of cardiac traits CVe.
(A) Barplot distribution of heart period (HP), diastolic interval (DI), systolic interval (SI), arrhythmia index (AI), end diastolic diameter (EDD), and fractional shortening (FS) CVe values among Drosophila Genetic Reference Panel (DGRP) lines. Lines are arranged by increased CVe values. (B) Overall correlations between CVe phenotypes. Spearman correlations were calculated on line CVe for each cardiac trait. (C) Overall correlations among mean and CVe phenotypes. Spearman correlations were calculated among line mean and line CVe for each cardiac trait.
Figure 4—figure supplement 2
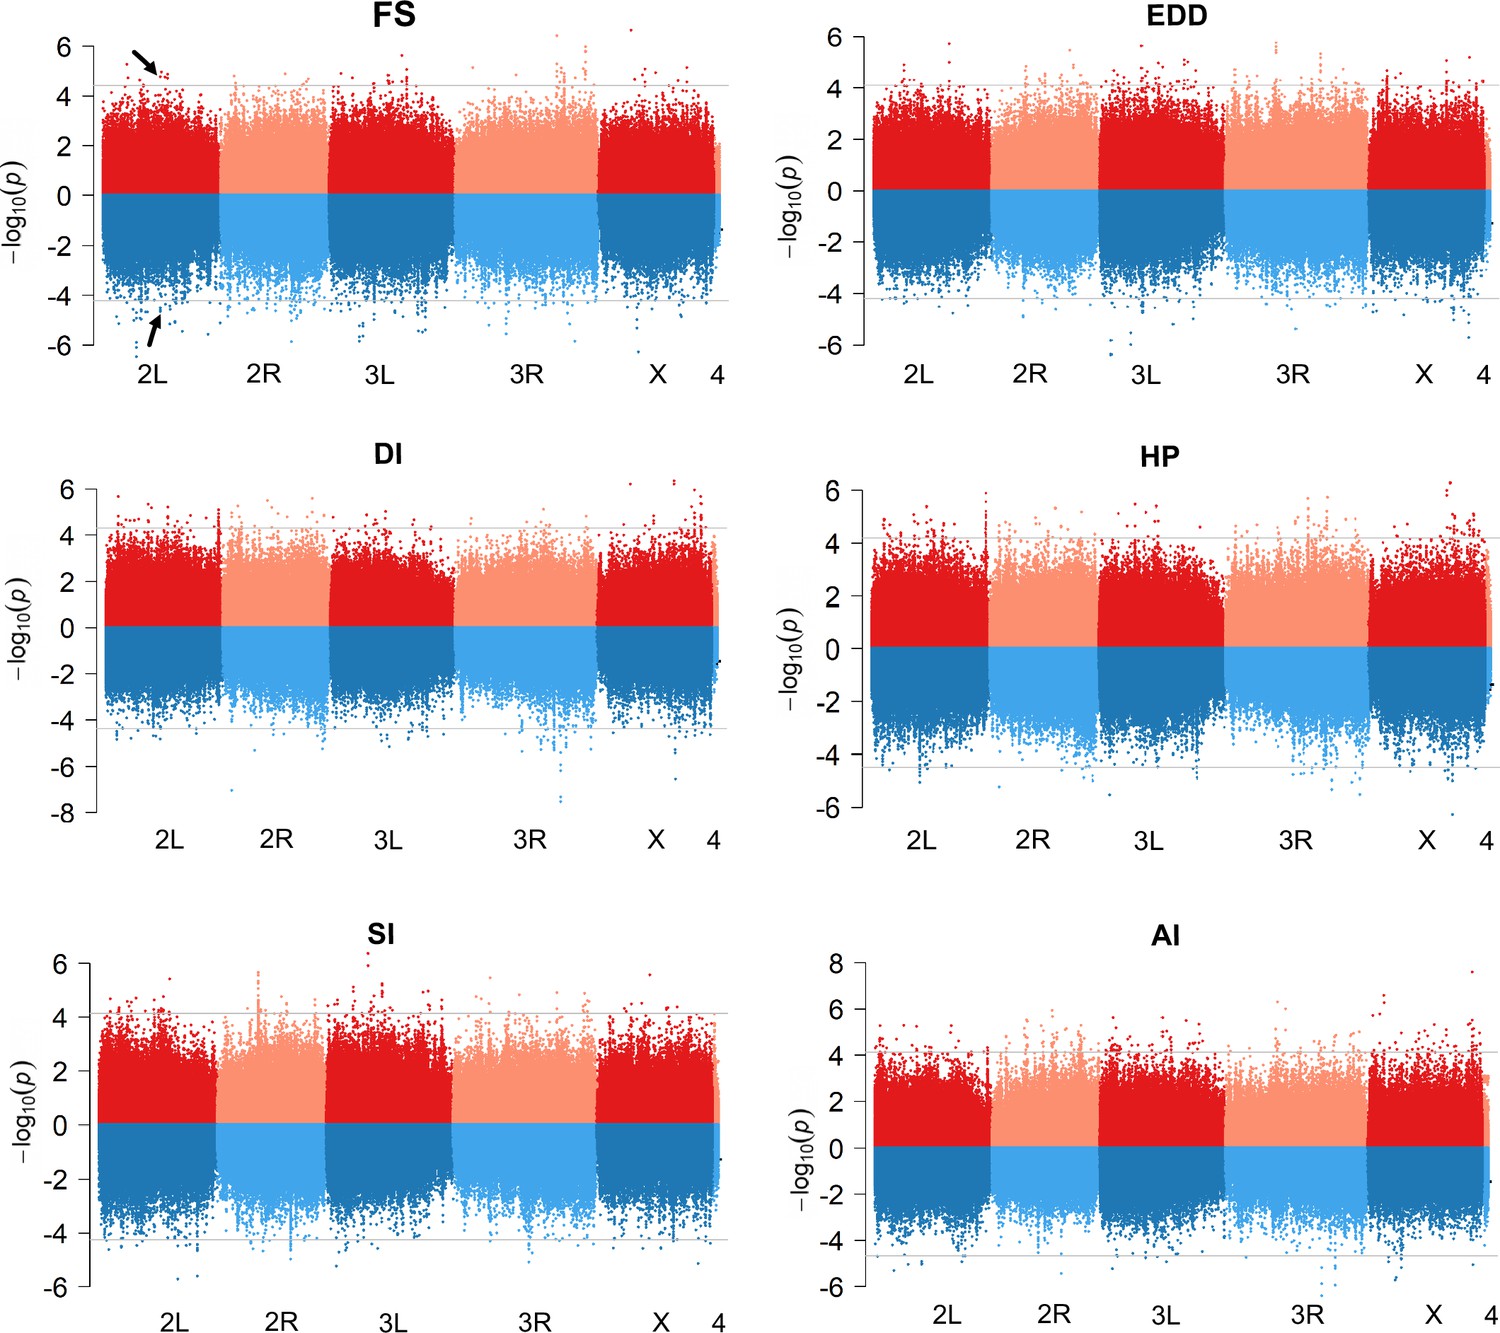
Comparison of genome-wide associations studies (GWAS) results for mean and CVe cardiac traits.
Miami plots showing the results of GWAS performed on mean (top, red) and CVe (bottom, blue) of indicated cardiac traits. The arrows point the Ca-β single nucleotide polymorphisms (SNPs) associated to both mean fractional shortening (FS) and CVe FS.
Figure 5 with 1 supplement
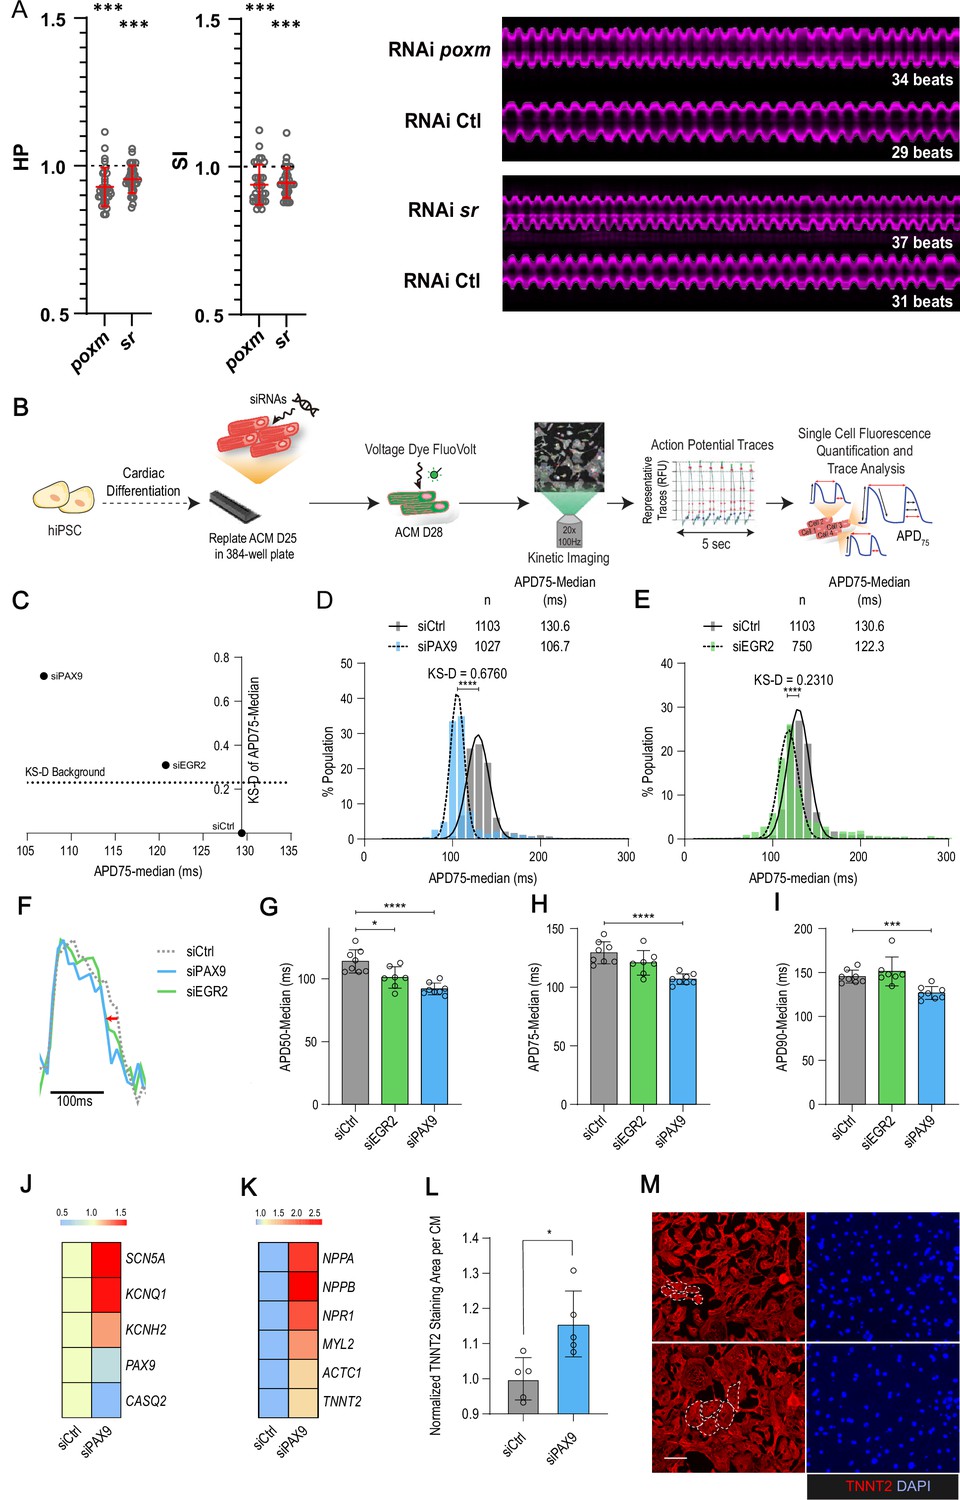
In vivo and in vitro assays for poxm/Pax9 and sr/Egr2 in flies and human induced pluripotent stem cells derived cardiomyocyte (hiPSC-CM).
(A) Heart-specific knockdown (KD) of poxm/Pax9 and sr/Egr2 lead to increased heart rate in flies. Cardiac-specific RNAi KD phenotypes of tested transcription factors (TFs). Hand>Gal4; UAS RNAi 1-week adult females (n>30 per cross) were analyzed for cardiac performance using the in vivo assay on intact flies. Scatter plots of individual data, mean, and SD are represented. Wilcoxon test results are indicated (***: pval <0.005). Data were normalized to genotype matched controls. Right panel: representative M-modes (5 s) of RNAi KD and their respective control illustrating the increased heart rate observed upon poxm and sr inactivation. Number of heartbeats counted from M-modes are indicated. (B–I) Effects of Pax9 and Egr2 siRNA on hiPSC-CM action potentials. (B) Schematic overview of single cell and high-throughput voltage assay. (C) Two-dimensional graph for APD75 and Kolgomorov-Smirnov distance (KS-D) representing screen results for PAX9 and EGR2 KD. (D–E) Population distribution of APD75 measurements for siPAX9 and siEGR2 vs. siControl-transfected hiPSC-CMs, respectively. (F) Median action potential traces for siPAX9, siEGR2, and siControl-transfected hiPSC-CMs. (G–I) Histograms showing median APD50, APD75, and APD90 for siPAX9, siEGR2, and siControl-transfected hiPSC-CMs. n > 4 in all experiments. SD are represented. (J,K) Heatmaps of differentially expressed genes in siControl- and siPAX9-transfected hiPSC-CMs. (L) Histogram showing the effect of PAX9 KD on the average TNNT2 staining area per CM as compared to siControl. n > 4 in all experiments. SD are represented. (M) Representative images for siPAX9 and siControl. TNNT2 is shown in red and nuclei are stained with DAPI in blue. Scale bar = 25 μm. t-Test was used to calculate p-values. *p<0.05, ***p<0.001, ****p<0.0001.
Figure 5—figure supplement 1
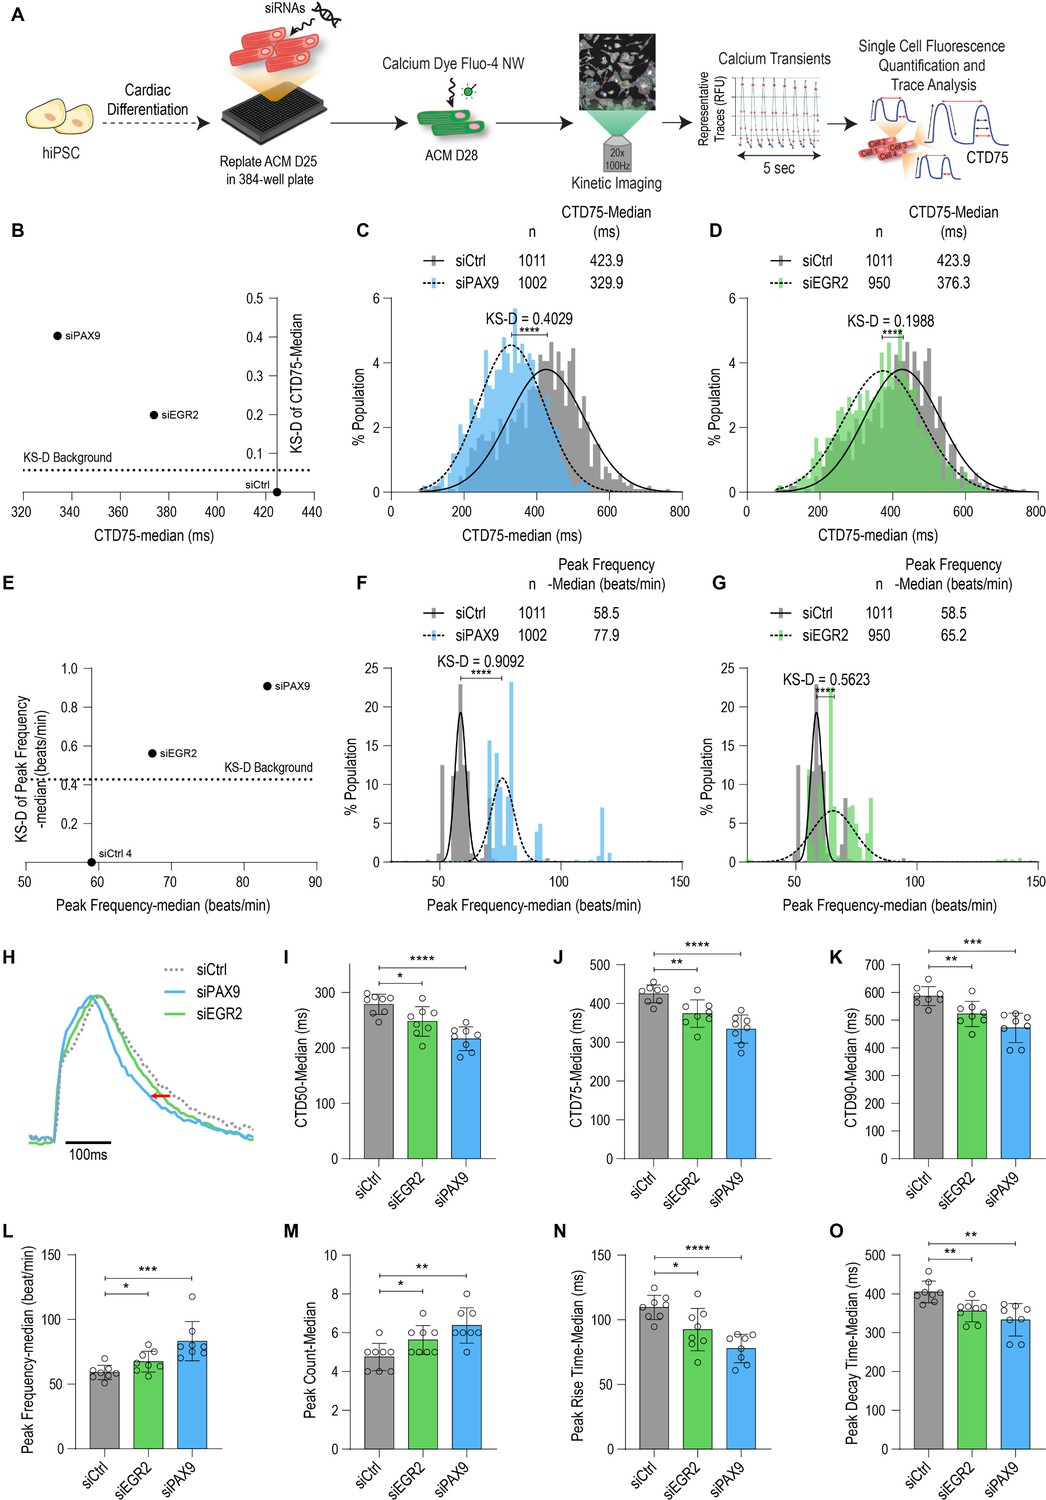
Calcium transient measured in iPSC-ACM upon Pax9 and EGR2 siRNA-mediated knockdown (KD).
(A) Schematic overview of single cell and high-throughput calcium assay. (B) Two-dimensional graph for CTD75 and Kolgomorov-Smirnov distance (KS-D) representing screen results for PAX9 and EGR2 KD. (C–D) Population distribution of CTD75 measurements for siPAX9 and siEGR2 vs. siControl-transfected hiPSC-ACMs, respectively. (E) Two-dimensional graph for peak frequency measurements and Kolgomorov-Smirnov distance representing screen results for PAX9 and EGR2 KD. (F–G) Population distribution of peak frequency measurements for siPAX9 and siEGR2 vs. siControl-transfected hiPSC-ACMs, respectively. (H) Median action potential traces for siPAX9, siEGR2, and siControl-transfected hiPSC-ACMs. (I–O) Histograms showing median CTD50, CTD75, CTD90, peak frequency, peak count, peak rise time, and peak decay time for siPAX9, siEGR2, and siControl-transfected hiPSC-ACMs. n > 4 in all experiments. SD are represented. t-Test was used to calculate p-values. *p<0.05, **p<0.01, ***p<0.001, ****p<0.0001.
Tables
Table 1
Quantitative genetics of cardiac traits in the Drosophila Genetic Reference Panel (DGRP).
Summary statistics over all DGRP genotypes assayed. Number of lines and individuals (after outlier removal, see Materials and methods) analyzed for each cardiac trait is indicated. Mean, standard deviation (Std dev.), and coefficient of variation (Coef. Var) among the whole population are indicated. Genetic, environment, and phenotypic variance (respectively Genet. var, Env. var, and Phen. var) were calculated for each trait. Broad sense heritability of traits means (H2) suggested heritability of corresponding traits. Levene test indicated significant heterogeneity of the variance among the lines.
| Diastolicintervals | Systolicintervals | Heartperiod | Diastolic Diameter | Systolic diameter | Fractional shortening | Arrhythmia Index | |
|---|---|---|---|---|---|---|---|
| total.nb.lines | 167 | 167 | 167 | 167 | 167 | 167 | 167 |
| mean | 0.4638 | 0.2166 | 0.6883 | 79.4200 | 51.0500 | 0.3538 | 0.2475 |
| Std dev. | 0.26330 | 0.03216 | 0.27690 | 14.09000 | 9.49300 | 0.06837 | 0.29230 |
| Coef. var | 0.5677 | 0.1485 | 0.4022 | 0.1774 | 0.1860 | 0.1933 | 1.1810 |
| lines (mean) | 165 | 166 | 165 | 159 | 157 | 158 | 166 |
| Indiv. (mean) | 1914 | 1911 | 1920 | 1779 | 1753 | 1767 | 1832 |
| lines (Cve) | 165 | 166 | 165 | 159 | 157 | 158 | 166 |
| Indiv. (Cve) | 1914 | 1911 | 1920 | 1779 | 1753 | 1767 | 1832 |
| Genet. var | 2.59e-02 | 5.03e-04 | 2.87e-02 | 1.13e+02 | 4.39e+01 | 1.57e-03 | 2.21e-02 |
| Env. var | 4.36e-02 | 5.35e-04 | 4.82e-02 | 8.64e+01 | 4.65e+01 | 3.11e-03 | 6.35e-02 |
| Phen. var | 6.95e-02 | 1.04e-03 | 7.68e-02 | 1.99e+02 | 9.04e+01 | 4.68e-03 | 8.56e-02 |
| H2 | 0.373 | 0.485 | 0.373 | 0.566 | 0.485 | 0.335 | 0.258 |
| F value | 76,864 | 11,686 | 74,715 | 46,950 | 15,041 | 11,164 | 65,308 |
| Pr(F) | 8.8e-120 | 2.3e-187 | 5.8e-116 | 7.1e-62 | 1.9e-231 | 8.8e-175 | 1.8e-96 |
| Levene test | 1.9e-10 | 1.9e-10 | 1.7e-08 | 1.6e-05 | 2.1e-13 | 1.6e-05 | 2.1e-13 |
Table 2
Conserved genes associated with natural variations of cardiac traits from flies to humans.
Enrichment analyses for genes conserved in human and for genes whose human orthologue is associated with either coronary artery diseases (CAD) or cardiac disorders. Numbers in parenthesis indicate the total number of genes in each analyzed gene set (whole fly genome/mean and CVe GWAS-associated genes). First row (human orthologue): Number of fly genes that display a human orthologue according to DIOPT (high and moderate rank). Second and third rows: Number of genes whose human orthologue (high and moderate rank) has been associated with CAD or cardiac disorders by genome-wide associations studies (GWAS) in human populations (Supplementary file 3f-i). Fold change (FC): Ratio between expected (based on successes observed on fly genome) and observed number of successes in respective GWAS gene sets. pval: hypergeometric p-value.
| Fly genome (17500) | GWAS mean (562) | FC | pval | GWAS Cve (566) | FC | pval | |
|---|---|---|---|---|---|---|---|
| Human orthologue | 9463 | 410 | 1.4 | 4.3 · 10–21 | 379 | 1.25 | 7 ·10–11 |
| CAD | 321 | 19 | 1.35 | 0.04 | 16 | 1.25 | 0.07 |
| Cardiac disorders | 944 | 68 | 1.66 | 7 · 10–6 | 64 | 1.7 | 7 · 10–6 |
Additional files
-
Supplementary file 1
Data on single marker GWAS performed on trait means.
(a) Tests for block effect within the 14 Drosophila Genetic Reference Panel (DGRP) lines analyzed twice. (b) ‘Variants_MAF4%_merged’: Summary table of variants with minor allele frequency (MAF) >4% identified by single marker GWAS for the seven traits, and their associated genes. (c) Summary table of genes associated with cardiac traits. (d) Analysis of genes found in at least two independent GWA analyses. (e) Summary table of genes associated with single nucleotide polymorphisms (SNPs) identified by FastEpistasis for traits means. Fly Base gene numbers (FBgn), gene symbol, and corresponding quantitative traits are indicated. Gene Ontology (molecular function) annotations are provided. The 31 genes also found in single marker GWA (c) are labeled in red. (f) Summary of all trait mean GWA analyses associated genes. Summary table of genes associated with cardiac traits means, computing data from Fast LMM (single marker GWA), and FastEpistasis (Epistasis GWA). Fly Base gene numbers (FBgn), gene symbol, and method from which the associated gene was identified are indicated. Corresponding quantitative traits and Gene Ontology (molecular function) annotations are provided. The 31 genes found in both single marker and epistasis GWA are labeled in red.
- https://cdn.elifesciences.org/articles/82459/elife-82459-supp1-v1.xlsx
-
Supplementary file 2
Enrichments and annotations analyses of gene lists associated to trait means.
(a) Enriched annotations within GWA-associated genes traits means. gProfiler_allGWAS: Functional enrichment analysis performed on the 562 genes from FastLMM and FastEpistasis analyses, all traits merged (see Supplementary file 1f), using g:GOSt from G profiler (https://biit.cs.ut.ee/gprofiler/gost). Parameters used were as follows: Background: all annotated genes/selected GO terms size >5 and <500. (b) Enrichment analysis (hypergeometric distribution calculations) for genes identified in a global RNAi screen for heart function (Neely et al., 2010). (c) Principal network component (PNC) formed by genes and gene products from cardiac traits means GWAS (refer to Figure 2B). Details of the 148 genes forming the principal network components of direct genetic and physical interactions among the 562 cardiac performances-associated genes. Gene symbol, FBgn, and cardiac trait(s) for which they have been associated are indicated, together with corresponding Gene Ontology (GO) annotations. Annotations for signaling pathways (in biological processes) are highlighted in yellow, annotations for transcription factors (in molecular function) are highlighted in blue. (d) Details on the interactions depicted in Figure 2B. (e) Statistics of transcription factors (TFs) RNAi cardiac knockdown effects on heart performance traits. TFs were inactivated in the heart by Hand-Gal4 and heart parameters monitored in vivo by tdtk tomato high-speed video recording (see Materials and methods). Graphic representation of the data is displayed in Figure 3C. Wilcoxon-Mann-Whitney rank sum test results for indicated cardiac parameters are shown.
- https://cdn.elifesciences.org/articles/82459/elife-82459-supp2-v1.xlsx
-
Supplementary file 3
Data on GWAS for CVe traits and data from GWAS for human cardiac traits used for enrichement analyses.
(a) Summary table of genes associated with cardiac traits CVe, computing data from Fast LMM (single marker GWA), and FastEpistasis (Epistasis GWA). Raw data are provided in Figure 4—source data 1. Fly Base gene numbers (FBgn), gene symbol, and method from which the associated gene was identified are indicated. Corresponding quantitative traits and Gene Ontology (molecular function) annotations are provided. The genes found in both single marker and epistasis GWA are labeled in red. (b) List of the 92 genes found associated with both mean and CVe of cardiac performance traits. (c) Lists of all variants associated with CVe and mean identified by FastLMM and FastEpistasis and overlap between both lists. (d) Functional enrichment analysis performed on the 566 genes from FastLMM and FastEpistasis analyses, all CVe traits merged (a), using g:GOSt from G profiler. Parameters used were as follows: Background: all annotated genes/selected GO terms size >5 and <500. (e) Enrichment analysis (hypergeometric distribution calculations) for genes identified in a global RNAi screen for heart function (Neely et al., 2010). (f) Human genes found associated with coronary artery diseases (CAD) in genome-wide associations studies (GWAS). Human gene ID, SNP ID (when available), and original article describing the association are indicated. (g) Drosophila orthologues of human CAD genes identified using DIOPT. (h) Human genes found associated with cardiac traits in GWAS. Human gene ID, SNP ID (when available), quantitative trait analyzed for association, and original article describing the association are indicated. (i) Drosophila orthologues of human cardiac traits genes identified using DIOPT.
- https://cdn.elifesciences.org/articles/82459/elife-82459-supp3-v1.xlsx
-
Supplementary file 4
Comparisons and enrichment analyses between fly and human GWAS for cardiac traits.
(a) Fly cardiac mean genome-wide associations studies (GWAS) genes (Supplementary file 1f) and corresponding human orthologues identified with DIOPT. (b) Fly cardiac mean GWAS genes and corresponding human orthologues associated with cardiac disorders. (c) Fly cardiac mean GWAS genes, and corresponding human orthologues associated with CAD. (d) Fly cardiac CVe GWAS (Supplementary file 3a) genes and corresponding human orthologues identified with DIOPT. (e) Fly cardiac CVe GWAS genes and corresponding human orthologues associated with cardiac disorders. (f) Fly cardiac Cve GWAS genes and corresponding human orthologues associated with CAD. (g) Headcounts of fly mean GWAS genes for which human orthologues have been identified in human GWAS studies (moderate and high rank), and hypergeometric distribution calculations. (h) DGRP lines analyzed. (i) Other fly lines used in the study.
- https://cdn.elifesciences.org/articles/82459/elife-82459-supp4-v1.xlsx
-
MDAR checklist
- https://cdn.elifesciences.org/articles/82459/elife-82459-mdarchecklist1-v1.docx
Download links
A two-part list of links to download the article, or parts of the article, in various formats.
Downloads (link to download the article as PDF)
Open citations (links to open the citations from this article in various online reference manager services)
Cite this article (links to download the citations from this article in formats compatible with various reference manager tools)
Genetic architecture of natural variation of cardiac performance from flies to humans
eLife 11:e82459.
https://doi.org/10.7554/eLife.82459


