The aperiodic exponent of subthalamic field potentials reflects excitation/inhibition balance in Parkinsonism
- Medical Research Council Brain Network Dynamics Unit, Nuffield Department of Clinical Neurosciences, University of Oxford, United Kingdom
- Movement Disorders and Neurostimulation, Biomedical Statistics and Multimodal Signal Processing Unit, Department of Neurology, University Medical Center of the Johannes Gutenberg University Mainz, Germany
- Department of Neurosurgery, King's College London, United Kingdom
- Neurosciences Research Centre, Molecular and Clinical Sciences Institute, St. George' s, University of London, United Kingdom
- Institut des Maladies Neurodégénératives, CNRS UMR5293, Université de Bordeaux, France
Figures
Figure 1 with 2 supplements
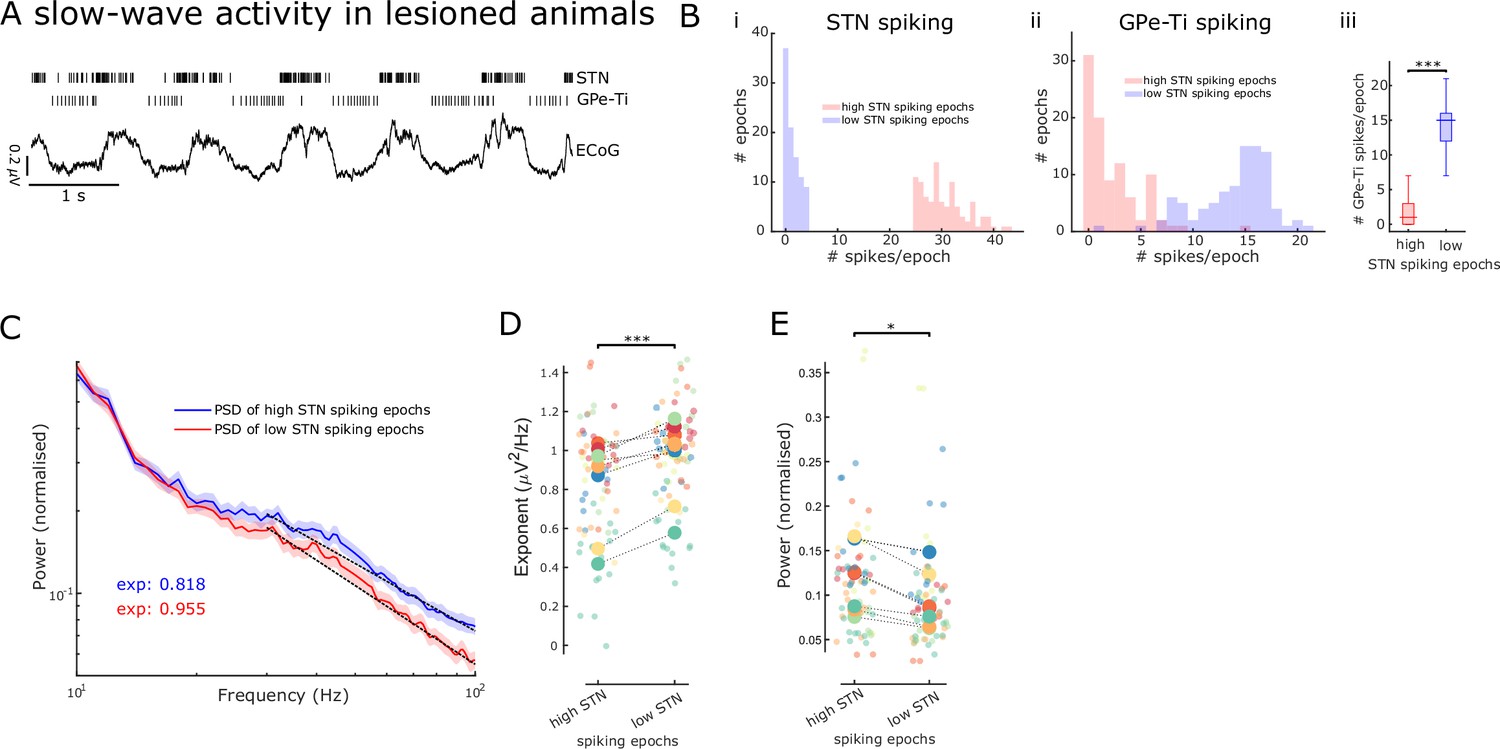
Aperiodic exponents and power of subthalamic nucleus-local field potentials (STN-LFPs) between 30 and 100 Hz reflect STN excitation and inhibition in lesioned animals.
(A) Example traces of electrocorticography (ECoG) and single-unit spiking activity of STN and GPe-Ti neurons during slow-wave activity (SWA) in anaesthetised 6-hydroxydopamine (6-OHDA)-lesioned animals. Note the rhythmic spiking pattern of both neuron types, which either aligns with peaks or troughs of cortical slow (~1 Hz) oscillations. (B) We identified 250 ms epochs of relatively high spiking (>75th percentile) and epochs of low spiking (<25th percentile) based on STN neuron activity during cortical SWA. The distribution of STN (i) and GPe-Ti (ii) spiking activity is shown for one example animal, which confirms that spiking rates are clearly differentiable for the two high and low STN spiking states. GPe-Ti neurons are most active when STN neurons are relatively inactive and vice versa (iii; ***p<.001, Wilcoxon rank-sum test). (C) Average power spectral densities (PSDs) of STN-LFPs in the two states identified above (mean ± SEM, n = 8 animals). The black dotted lines denote the aperiodic fits (exponent values [exp] are colour-coded) for the respective PSDs between 30 and 100 Hz. (D) Aperiodic exponents are high during low STN spiking epochs corresponding to more GPe-Ti activity and, by inference, more inhibition of STN. Inversely, aperiodic exponents are low during high STN spiking epochs associated with less GPe-Ti activity and, by inference, disinhibition (LME: estimate = 0.12, t = 3.92, p<0.001). (E) Average power between 30 and 100 Hz in the STN-LFPs is higher when STN neurons are highly active than when STN spiking is low (LME: estimate = –0.02, t = –2.34, p=0.02). (D, E) Large dots denote the mean per animal and are colour-coded. Small dots denote individual LFP channels. n = 8 animals, *p<0.05, **p<0.01, ***p<.001, LME.
Figure 1—figure supplement 1
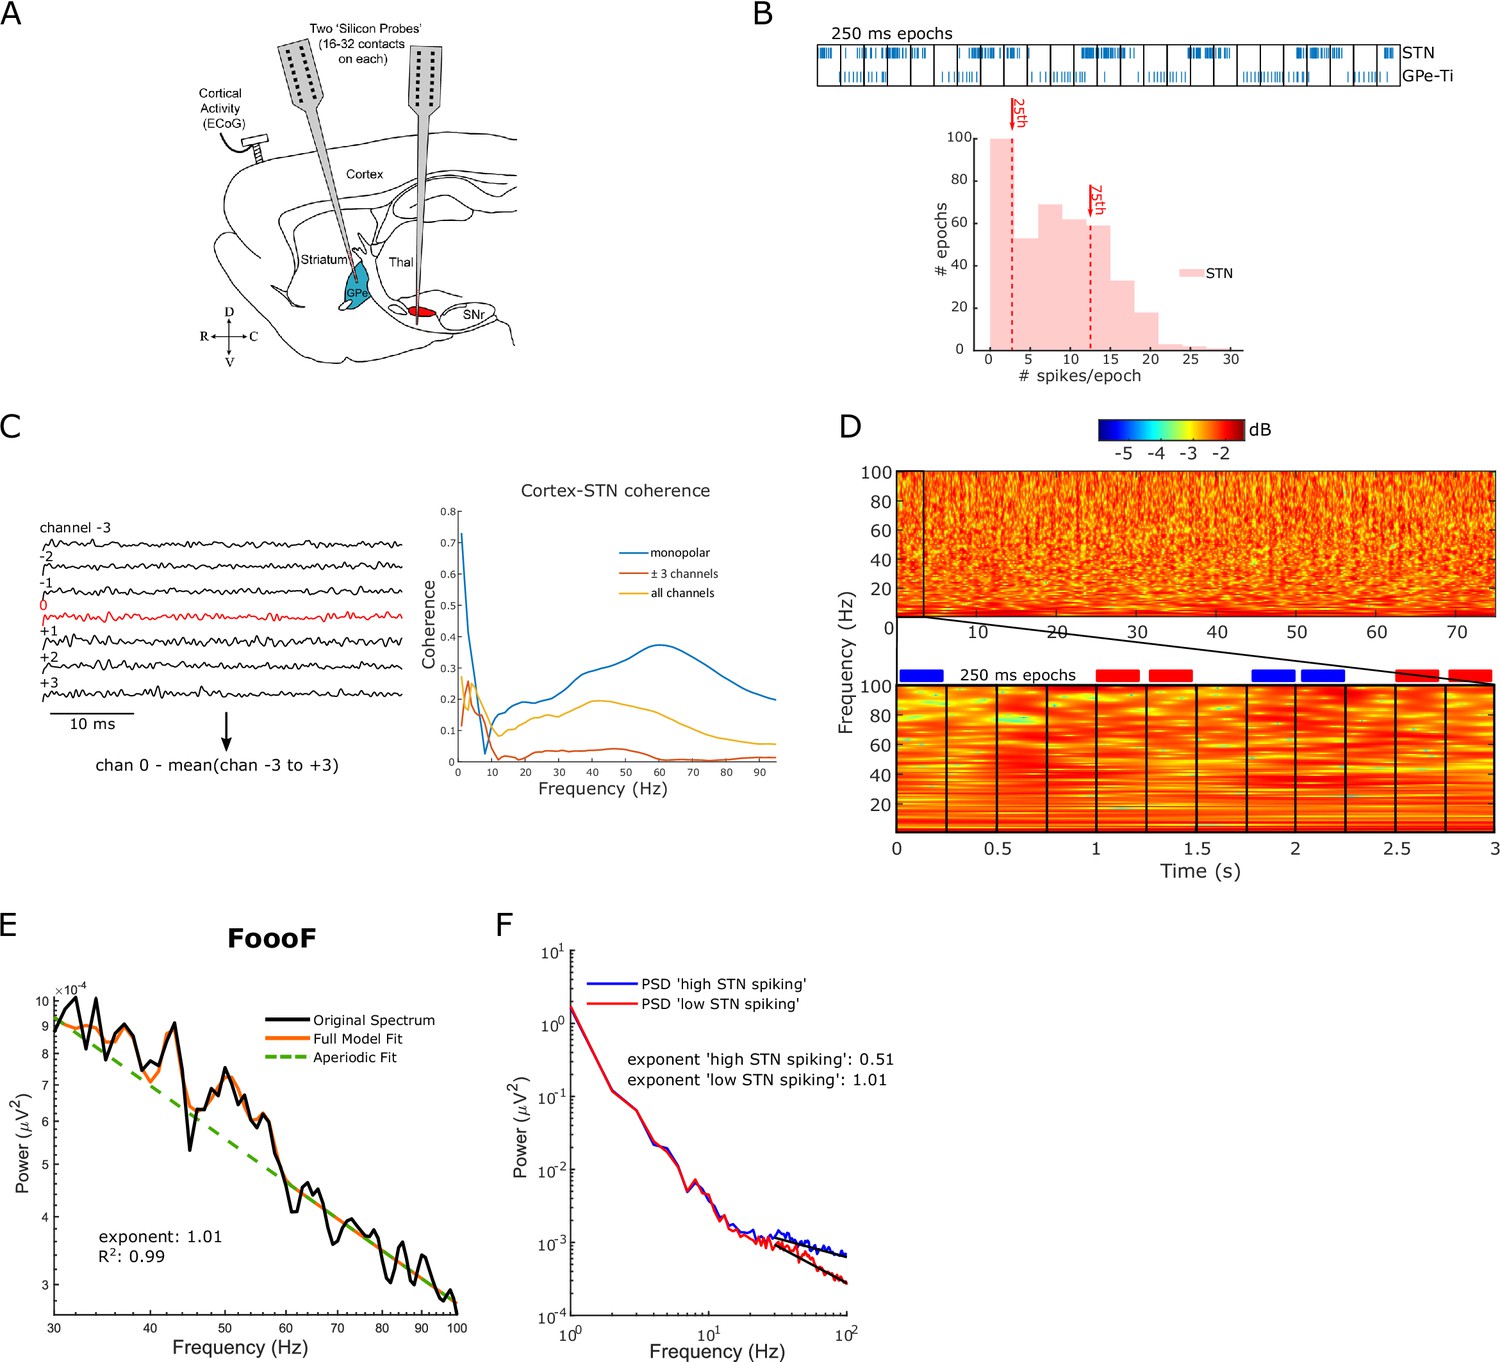
Signal processing of the electrophysiological data recorded in animals.
(A) Parasagittal cross section of the rat brain. Multi-contact electrode arrays (‘silicon probes’) were used to record wideband signals (incorporating local field potentials [LFPs] and single-unit activities) from the subthalamic nucleus (STN, in red) in eight 6-hydroxydopamine (6-OHDA)-lesioned rats during cortical slow-wave activity (SWA). GPe: external globus pallidus; SNr: substantia nigra pars reticulata; Thal: thalamus; ECoG: electrocorticogram; D: dorsal; V: ventral; R: rostral; C: caudal. (B) Spikes were isolated from the wideband signal using standard spike sorting procedures as in Mallet et al. 2008. Top: spike events per 250 ms epoch were calculated for probe channels within STN (GPe-Ti spikes are shown for comparison). Bottom: the spike distribution is shown for an example STN channel. Epochs above the 75th percentile were considered high spiking. Epochs below the 25th percentile were considered low spiking. (C) Left: LFP was re-referenced by subtracting the mean of the six neighbouring LFP channels. Right: this approach was chosen to control volume conduction since coherence between the re-referenced LFP channel and ECoG recorded from a steel screw over the frontal cortex (red) was lower compared to no re-referencing (blue) and subtracting the mean of all channels (yellow). (D) Complex Morlet wavelet transforms (50 cycles) were used for time-frequency decomposition of the full LFP time series. Afterwards, average power spectral densities (PSDs) were computed for non-overlapping 250 ms epochs. PSDs of all high-spiking epochs (blue boxes) and low-spiking epochs (red boxes) were averaged. (E) Periodic and aperiodic components of the PSD were separated using the FoooF parameterisation (see ‘Methods’). The original PSD of all low-spiking epochs (black) is shown for one example LFP channel with the FoooF model fit (orange) and the aperiodic fit (dashed green). The aperiodic exponent and goodness-of-fit metric for this example are shown. (F) Example analysis of the aperiodic exponent for one STN-LFP channel in one subject. The blue and red lines show the average PSDs of ‘high STN spiking’ epochs and ‘low STN spiking’ epochs, respectively. The black lines denote the aperiodic fit in the selected fitting range (30–100 Hz). Note the PSD is roughly linear across this frequency range in log-log space.
Figure 1—figure supplement 2
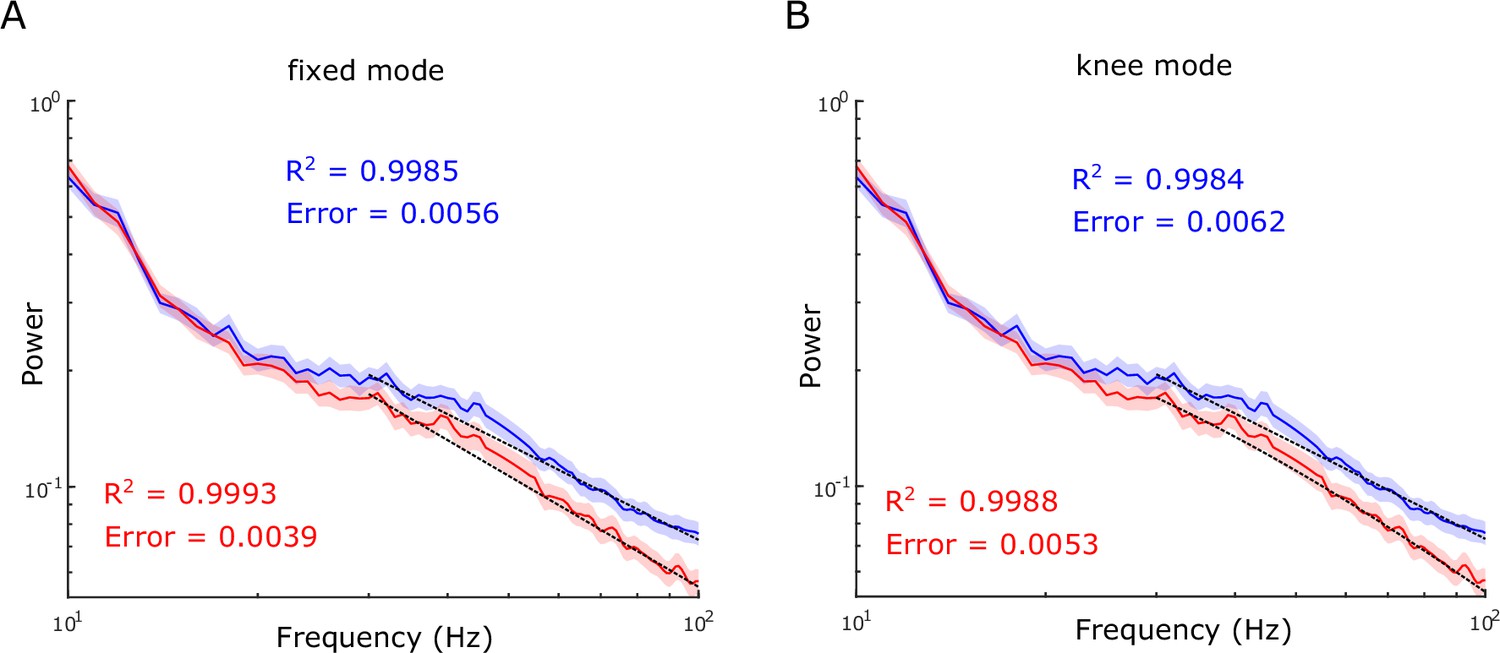
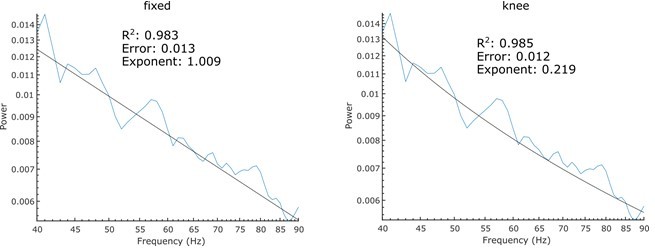
Knee parameterisation of animal data.
Power spectra from Figure 1C were parameterised using the fixed (A) and knee (B) mode. Goodness of fit and fitting errors are colour-coded. The dashed black line denotes the aperiodic fit from 30 to 100 Hz.
Figure 2 with 2 supplements
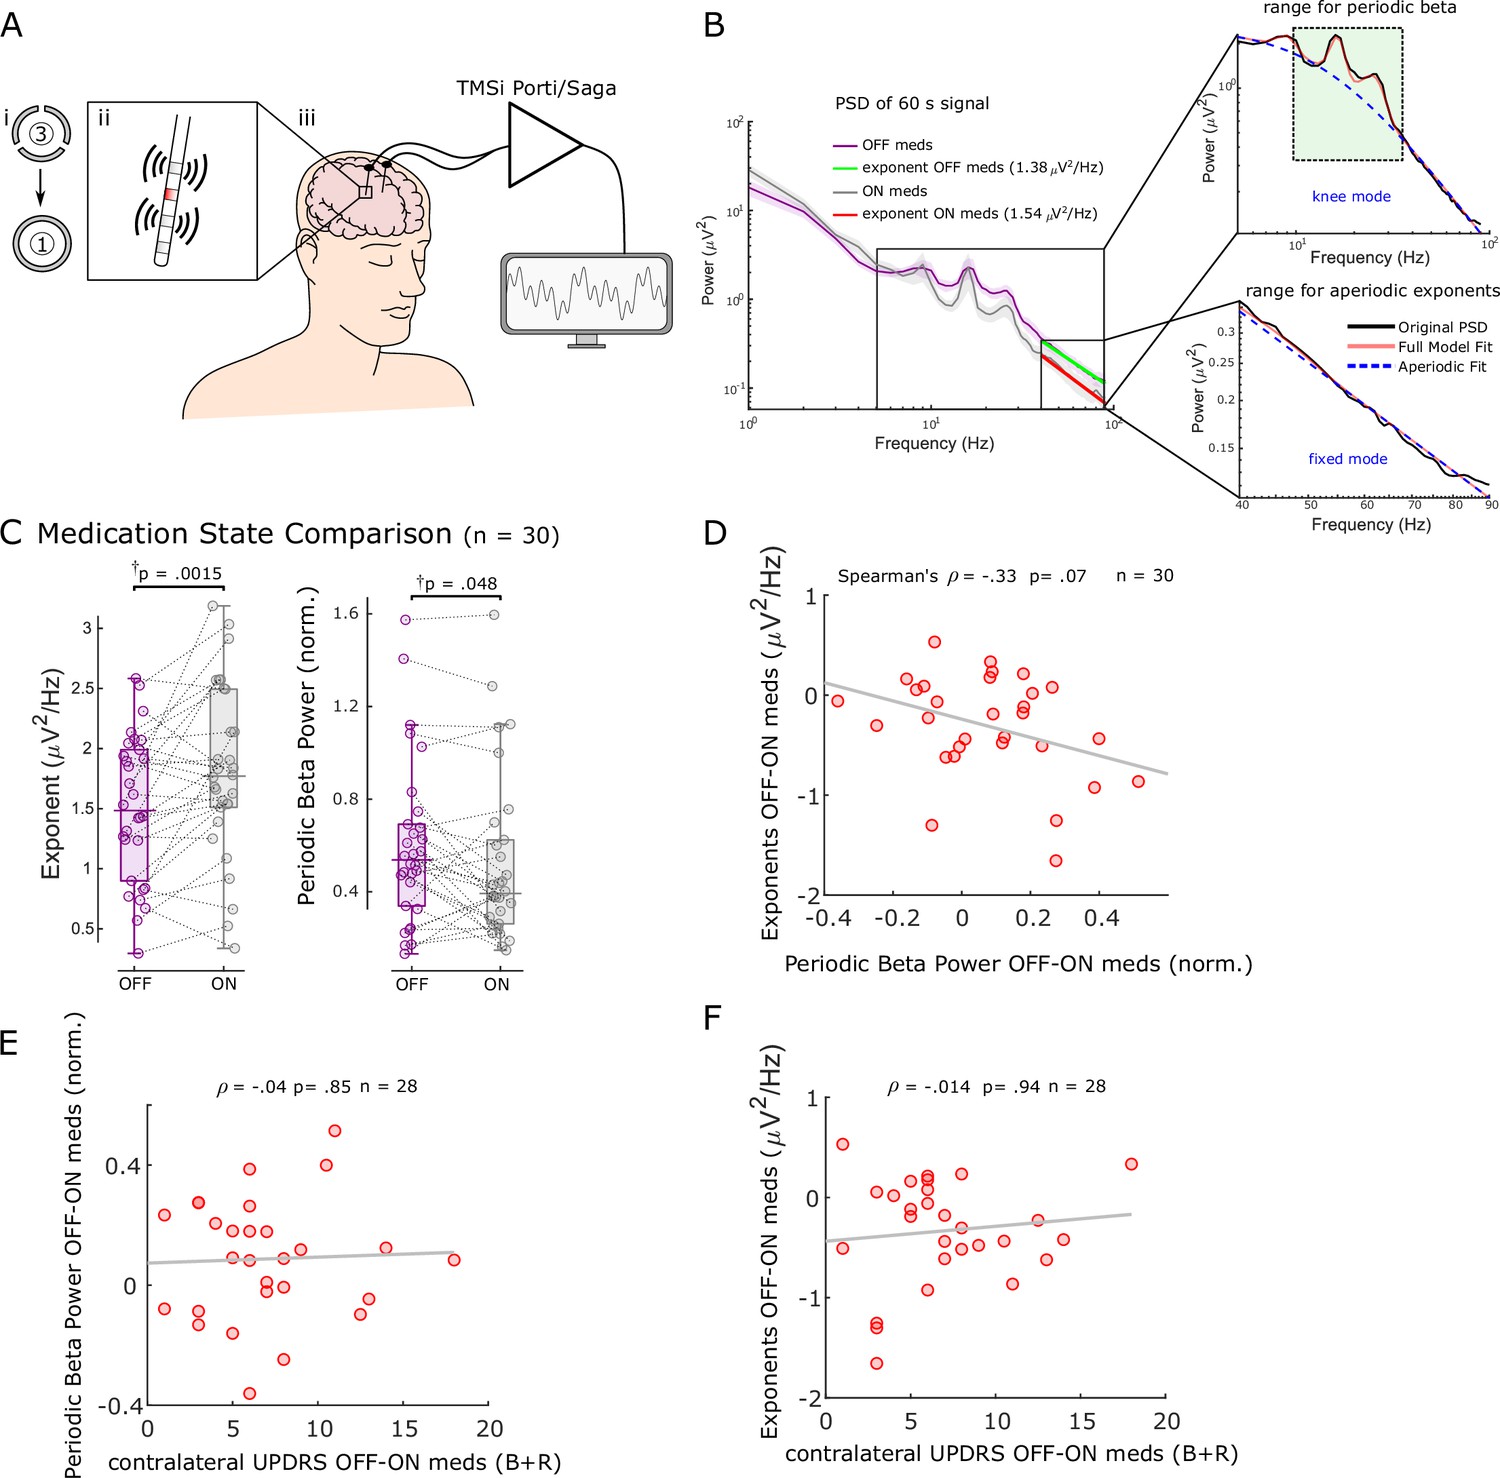
Aperiodic exponents between 40 and 90 Hz of subthalamic nucleus-local field potentials (STN-LFPs) distinguish medication states in externalised recordings from Parkinson’s patients.
(A) We analysed 60 s segments of bipolar STN-LFP recorded from Parkinson’s patients at rest while leads were externalised (iii). Recordings were performed ON and OFF dopaminergic medication. Directional contacts were fused (i) and bipolar recordings were conducted from contacts adjacent to the stimulation contact (red; ii). (B) Average power spectral densities (PSDs) from 30 hemispheres (17 patients) ON and OFF medication of 60 s recordings using Morlet wavelet transforms (mean ± SEM). Aperiodic exponents were computed between 40 and 90 Hz (fixed mode, bottom-right subplot) to avoid high-amplitude beta peaks and harmonics of mains noise at 100 Hz and the fixed mode was used since the PSD was relatively linear in log-log space within this range. To obtain periodic beta power, we fit the FoooF algorithm between 5 and 90 Hz (knee mode, top-right subplot) and picked the power of the largest oscillatory component within the beta range (13–35 Hz, green rectangle). (C) Aperiodic exponents and periodic beta power differ between medication states (p=0.0015 and p=0.048). †p-Values were computed using a paired samples permutation t-test with multiple comparison correction on 30 hemispheres recorded from 17 Parkinson’s disease (PD) patients. (D) Aperiodic exponent and periodic beta power changes with levodopa are not correlated (Spearman; ρ = –0.33, p=0.07, n = 30). (E, F) Neither periodic beta power (E) nor the aperiodic exponent (F) changes with medication are correlated with contralateral appendicular bradykinesia and rigidity UPDRS part III sub-scores OFF-ON levodopa (Spearman: ρ = –0.04, p=0.85, n = 28 hemispheres for periodic beta; Spearman: ρ = –0.014, p=0.94, n = 28 hemispheres for aperiodic exponents).
Figure 2—figure supplement 1
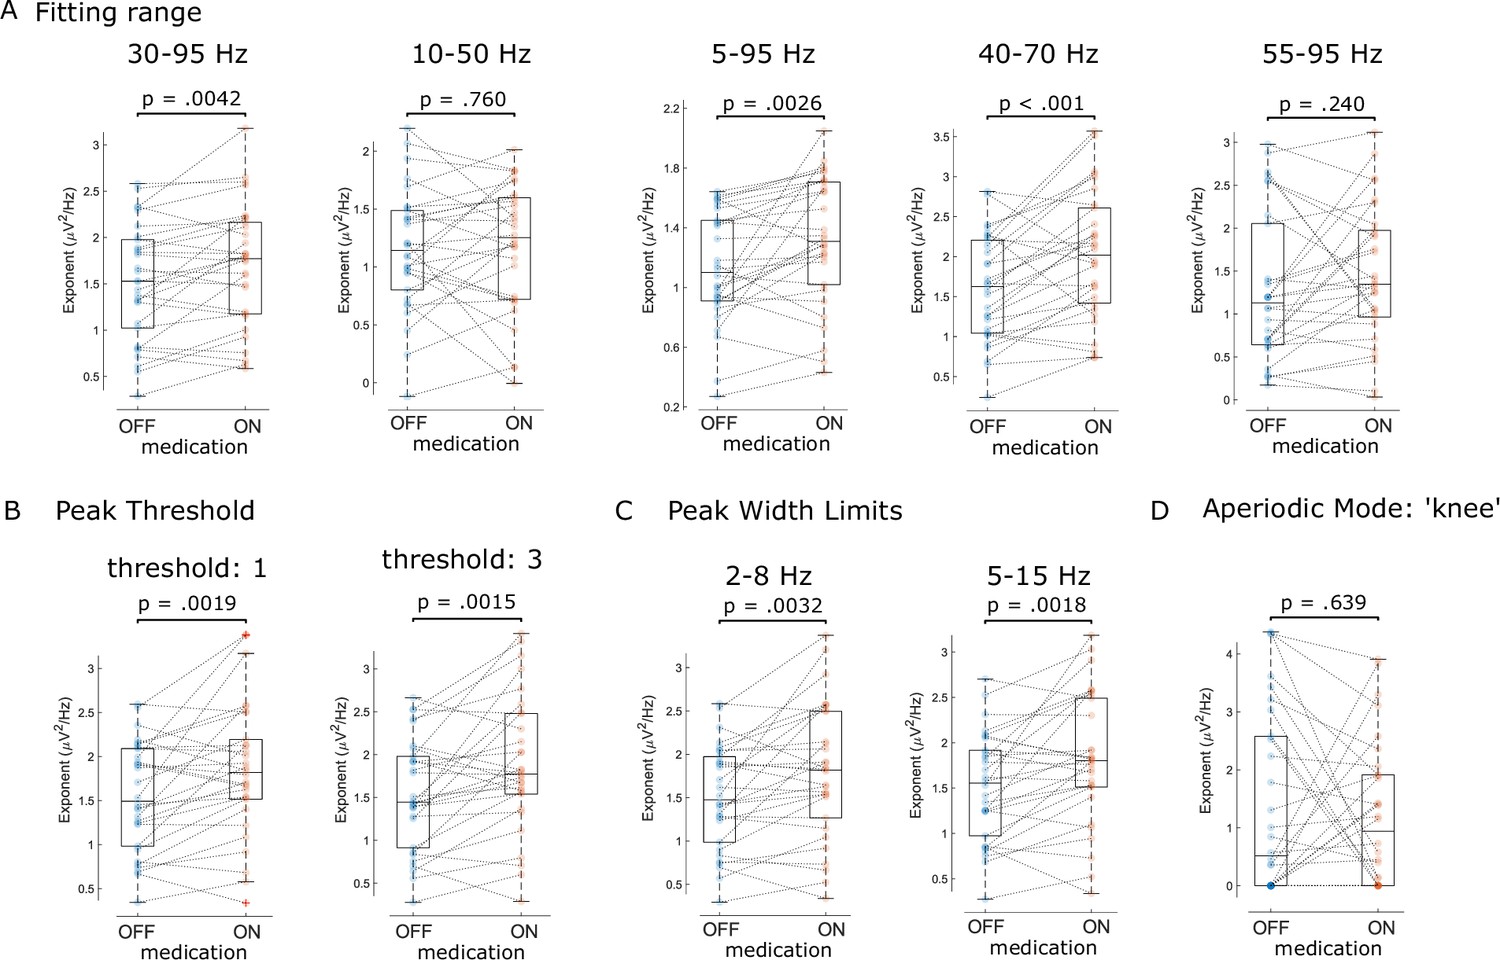
Sensitivity analysis of FoooF parameterisation.
We tested different fitting ranges (A), peak thresholds (B), peak width limits (C), and a different aperiodic mode (knee mode, D) for FoooF parameterisation of patients’ local field potentials (LFPs in both medication states). Dots denote individual hemispheres.
Figure 2—figure supplement 2
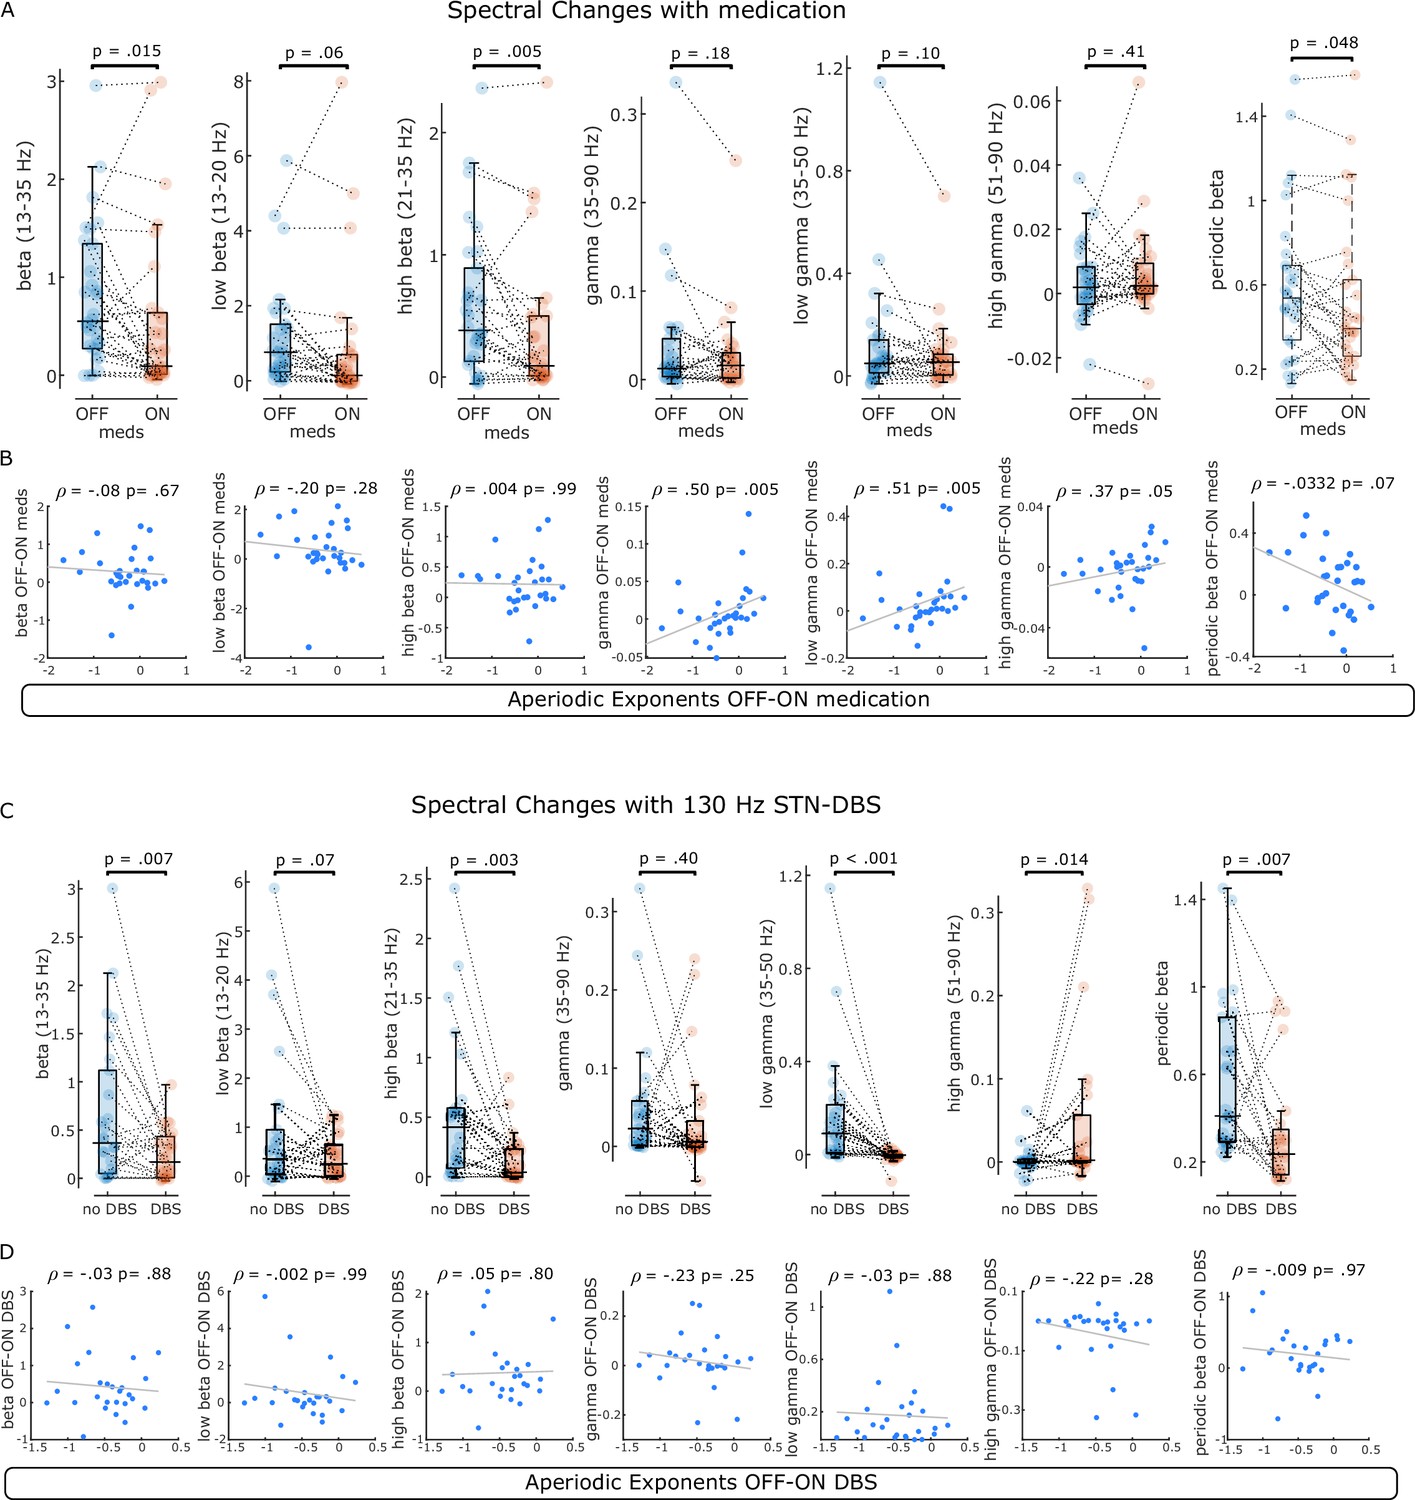
Spectral changes with levodopa and subthalamic nucleus-deep brain stimulation (STN-DBS).
(A) Average power of six different frequency bands and periodic beta power were compared between OFF and ON levodopa. Changes in beta power distinguished medication states. (B) For the same frequency bands, changes between medication states were correlated with aperiodic exponent changes. Note that correlations with beta power were not significant, while there was a weak positive correlation between aperiodic exponents at 40–90 Hz and power changes in the gamma range. (C) Average power of the same frequency bands and periodic beta power were compared before and during 130 Hz STN-DBS. Primarily high beta and low gamma power separated ON and OFF stimulation conditions. Note the power increase of the high gamma band ON DBS, which is driven by artefacts of stimulation in this frequency band. (D) Spectral changes with DBS were not correlated with changes of the aperiodic exponent at 10–50 Hz.
Figure 3 with 1 supplement
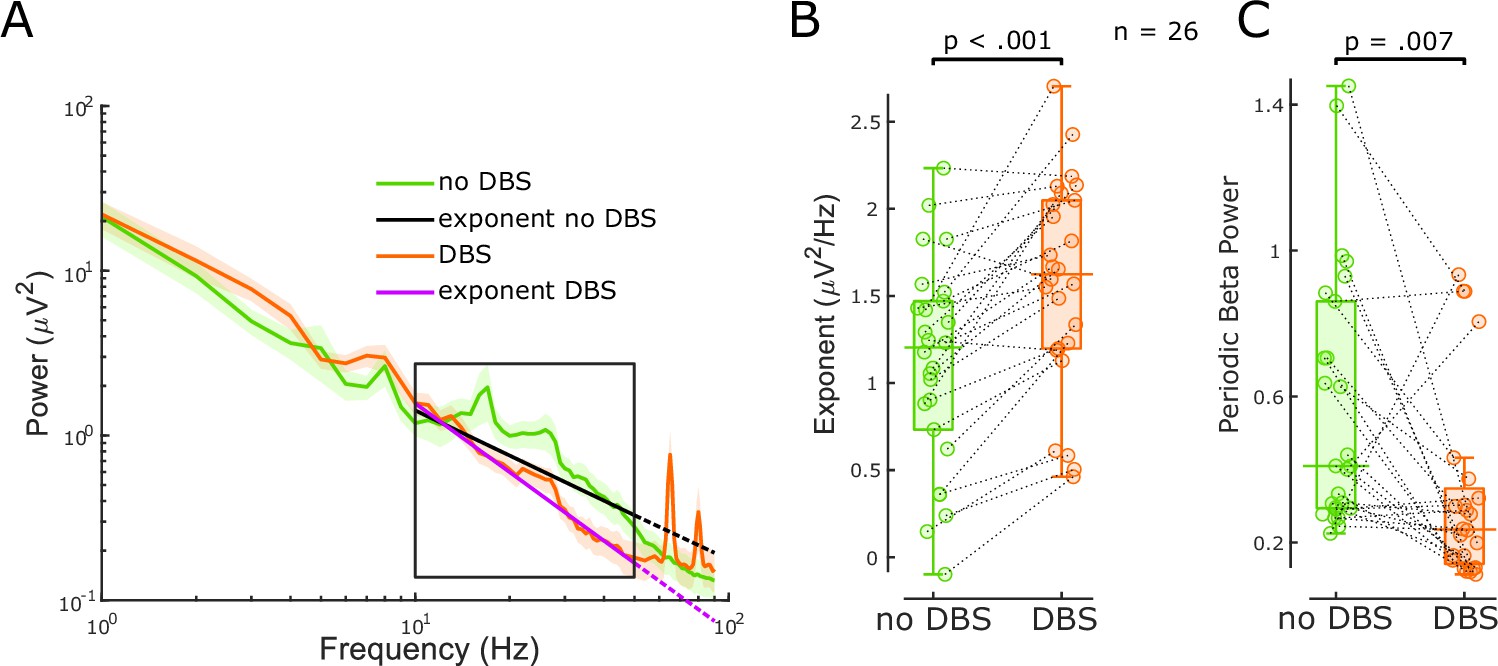
The aperiodic exponent between 10 and 50 Hz of subthalamic nucleus-local field potential (STN-LFP) distinguishes stimulation states in externalised recordings from Parkinson’s disease (PD) patients.
(A) Average power spectral densities (PSDs) and linear fitting in the exponential scale of 60 s segments of bipolar STN-LFPs ON and OFF 130 Hz STN-DBS recorded from externalised electrodes in 26 hemispheres from 17 PD patients (mean ± SEM). PSDs during DBS (red) display a spectral plateau >50 Hz, hence, exponents were isolated between 10 and 50 Hz (black rectangle). Linear fitting of the aperiodic exponents between 10 and 50 Hz for no DBS and DBS is shown in black and yellow, respectively. While the dotted extension of the black line is still a relatively good fit for the no DBS PSD, the yellow dotted line deviates from the DBS PSD due to the plateau at around 50 Hz. (B) Aperiodic exponents differ between periods of no DBS and periods of 130 Hz STN-DBS (paired samples permutation t-test, n = 26, p<0.001). (C) Periodic beta power was compared before and during 130 Hz STN-DBS (paired samples permutation t-test, n = 26, p=0.007).
Figure 3—figure supplement 1
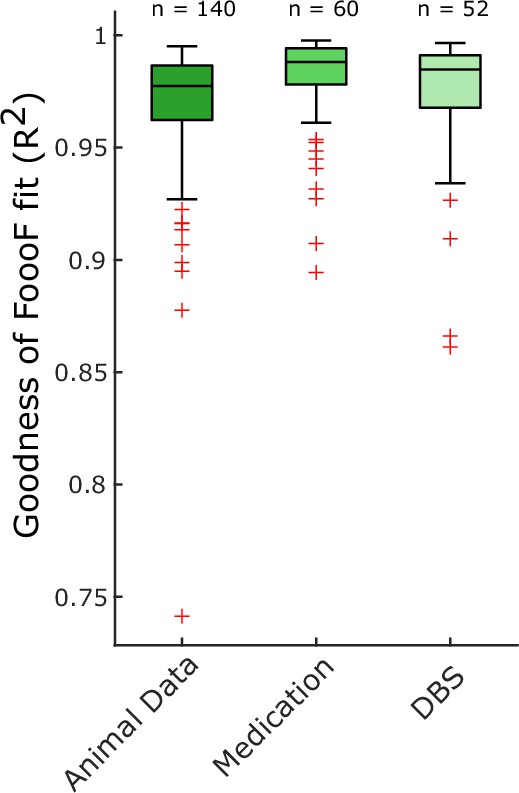
Goodness of FoooF parameterisation.
R2 values are shown for all FoooF parameterisations used to analyse animal data in Figure 1 (n = 140; 70 local field potential [LFP] channels in both subthalamic nucleus [STN] spiking states), human LFP data ON and OFF medication in Figure 2 (n = 60; 30 hemispheres in both conditions) and human LFP data ON and OFF DBS in Figure 3 (n = 52; 26 hemispheres in both conditions).
Author response image 1

Aperiodic exponent and average γ power changes in animal data between 40 and 90 Hz are consistent with those reported in Figure 1 for a slightly different fitting range.
Author response image 2
FOOOF parameterisation of pink noise with the same settings used in this manuscript (left) and a knee parameter (right).
Author response image 3
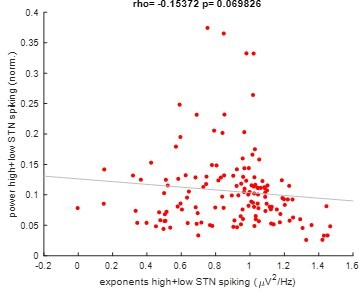
Pooled correlation between power and exponents of high and low STN spiking epochs.
Author response image 4
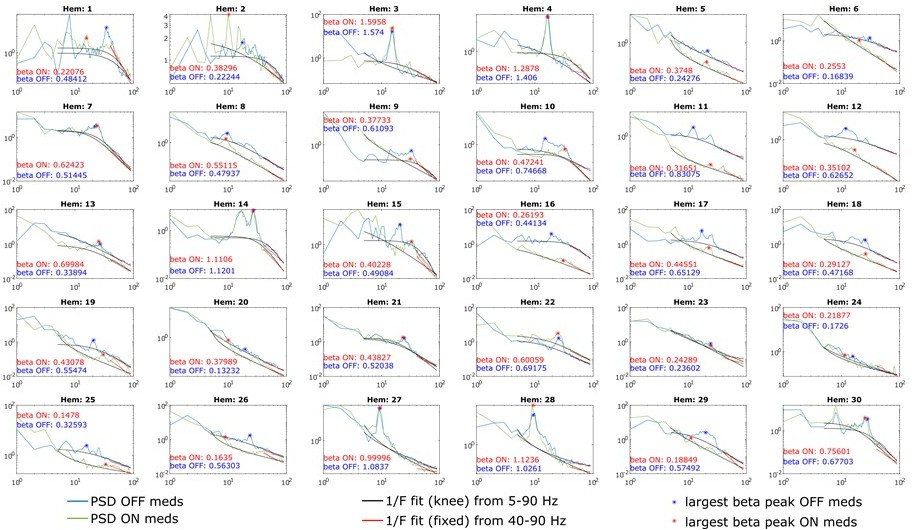
PSDs from all 30 hemispheres ON and OFF medication.
Aperiodic fits are shown between 5-90 Hz (knee mode), which was used to calculate the power of β peaks, and between 40-90 Hz (fixed mode), which was used to estimate the aperiodic exponent of the spectrum.
Author response image 5

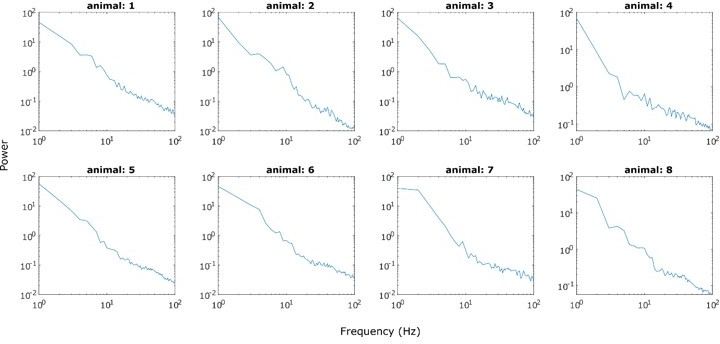
Power spectrum of STN LFPs recorded from anaesthetised 6-OHDA-lesioned rats during cortical activation.
Note the prominent peak in the β range. The black box designated the frequency range from 30-100 Hz.
Author response image 6
Tables
Author response table 1
Results of linear regression models.
| PredictorVariables | R2 | p-value |
|---|---|---|
| periodic β | 0.002 | 0.821 |
| β (13-35 Hz) | 0.027 | 0.405 |
| γ (15-35 Hz) | 0.062 | 0.203 |
| β + γ + 1/F | 0.111 | 0.411 |
| β + γ | 0.071 | 0.399 |
| all frequencies fromFigure 2—figure supplement 2A + 1/F | 0.117 | 0.842 |
Additional files
-
MDAR checklist
- https://cdn.elifesciences.org/articles/82467/elife-82467-mdarchecklist1-v2.pdf
-
Source code 1
This source code generates Figures 1-3 of this paper.
- https://cdn.elifesciences.org/articles/82467/elife-82467-code1-v2.zip
Download links
A two-part list of links to download the article, or parts of the article, in various formats.
Downloads (link to download the article as PDF)
Open citations (links to open the citations from this article in various online reference manager services)
Cite this article (links to download the citations from this article in formats compatible with various reference manager tools)
The aperiodic exponent of subthalamic field potentials reflects excitation/inhibition balance in Parkinsonism
eLife 12:e82467.
https://doi.org/10.7554/eLife.82467


