Estimating the contribution of subclinical tuberculosis disease to transmission: An individual patient data analysis from prevalence surveys
- TB Modelling Group, TB Centre and Centre for Mathematical Modelling of Infectious Diseases, Department of Infectious Disease Epidemiology, London School of Hygiene & Tropical Medicine, United Kingdom
- School of Health and Related Research, University of Sheffield, United Kingdom
- International Centre for Diarrhoeal Disease Research, Bangladesh
- School of Public Health, Vita-Salute San Raffaele University, Italy
- South West Sydney Clinical Campuses, University of New South Wales, Australia
- Ingham Institute of Applied Medical Research, Australia
- James P. Grant School of Public Health, BRAC University, Bangladesh
- Global Tuberculosis Programme, World Health Organization, Switzerland
- Department of Health Sciences, VU University, Netherlands
- Amsterdam Public Health Research Institute, Netherlands
- Woolcock Institute of Medical Research, Australia
- National Lung Hospital, National Tuberculosis Control Program, Viet Nam
- Research Institute of Tuberculosis, Japan Anti-Tuberculosis Association, Japan
- Tropical Disease Foundation, Philippines
- Sanofi Pasteur, United Kingdom
- KNCV Tuberculosis Foundation, Netherlands
- Department of Global Health and Amsterdam Institute for Global Health and Development, Amsterdam University Medical Centers, University of Amsterdam, Netherlands
Figures
Figure 1
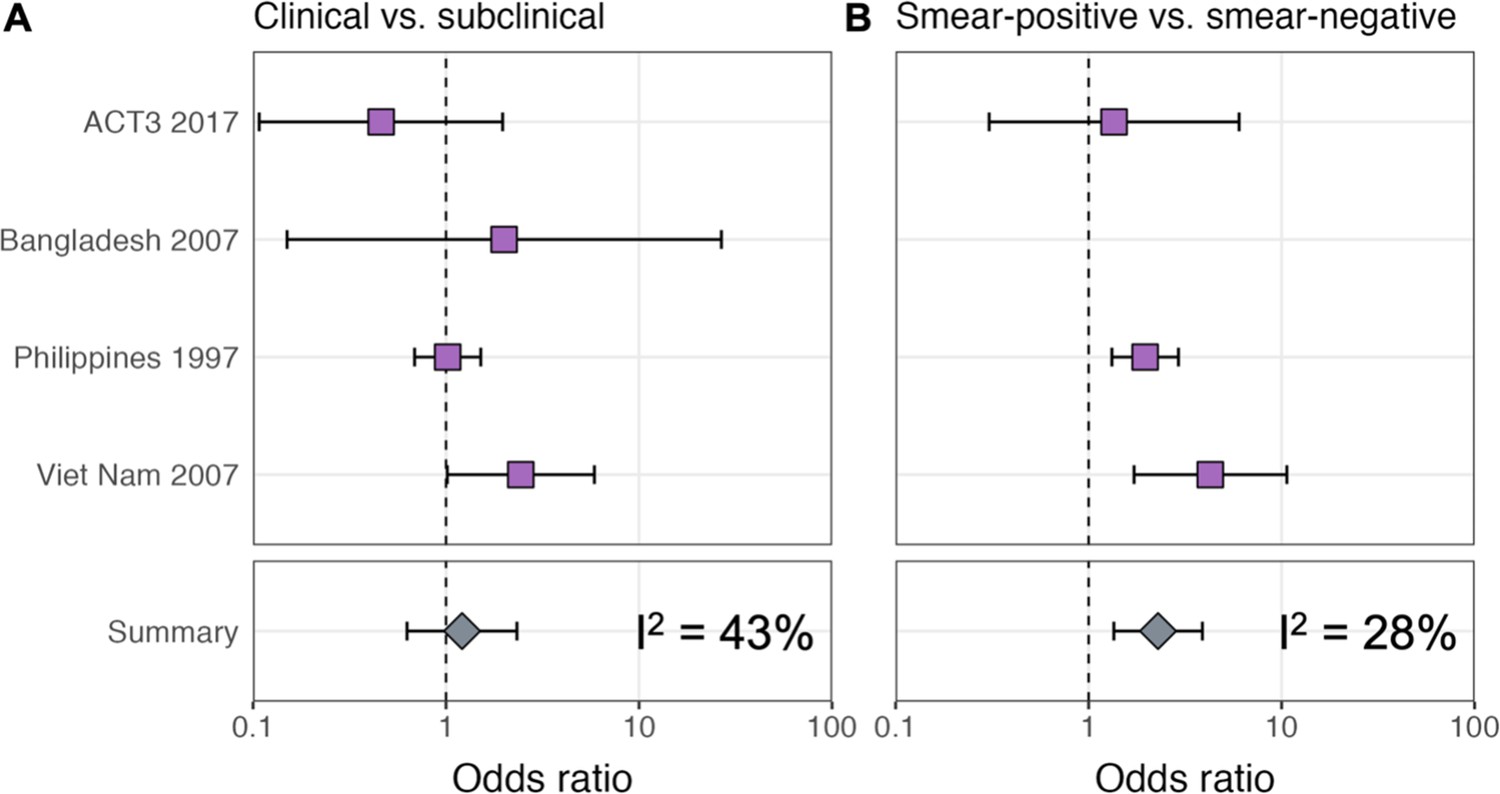
Odds ratios for infection in members of a household with a clinical versus a subclinical index case (irrespective of sputum smear-status) (A) and in members of a household with a sputum smear-positive versus a smear-negative index case (irrespective of symptoms) (B).
Illustrated are central estimates and 95% confidence intervals for each study separately and the results of a mixed-effects meta-analysis. Results for sputum smear status are omitted for Bangladesh as the survey considered only sputum smear-positive individuals.
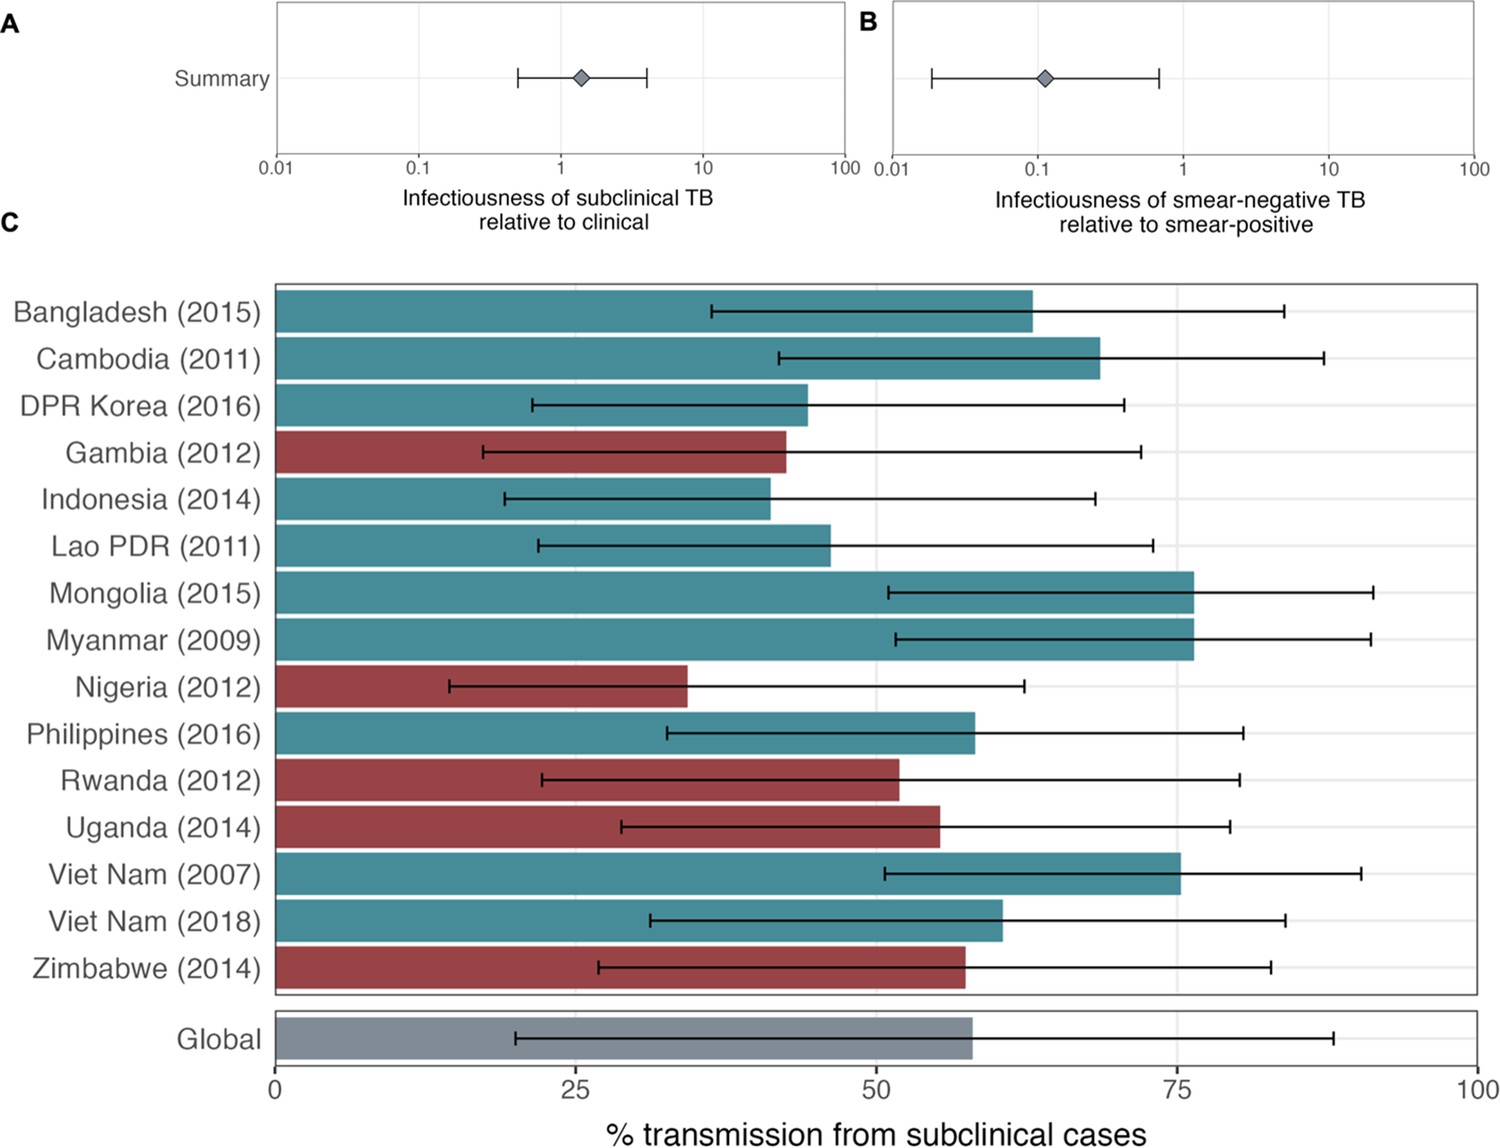
Figure 2

The estimated infectiousness of subclinical tuberculosis (TB) per unit time relative to clinical TB (A) and sputum smear-negative TB relative to smear-positive TB (B).
Illustrated are the median and 95% confidence intervals for each study separately and the median and 95% prediction interval results from mixed-effects meta-analyses across studies with an associated measure of heterogeneity (I2).
Figure 3
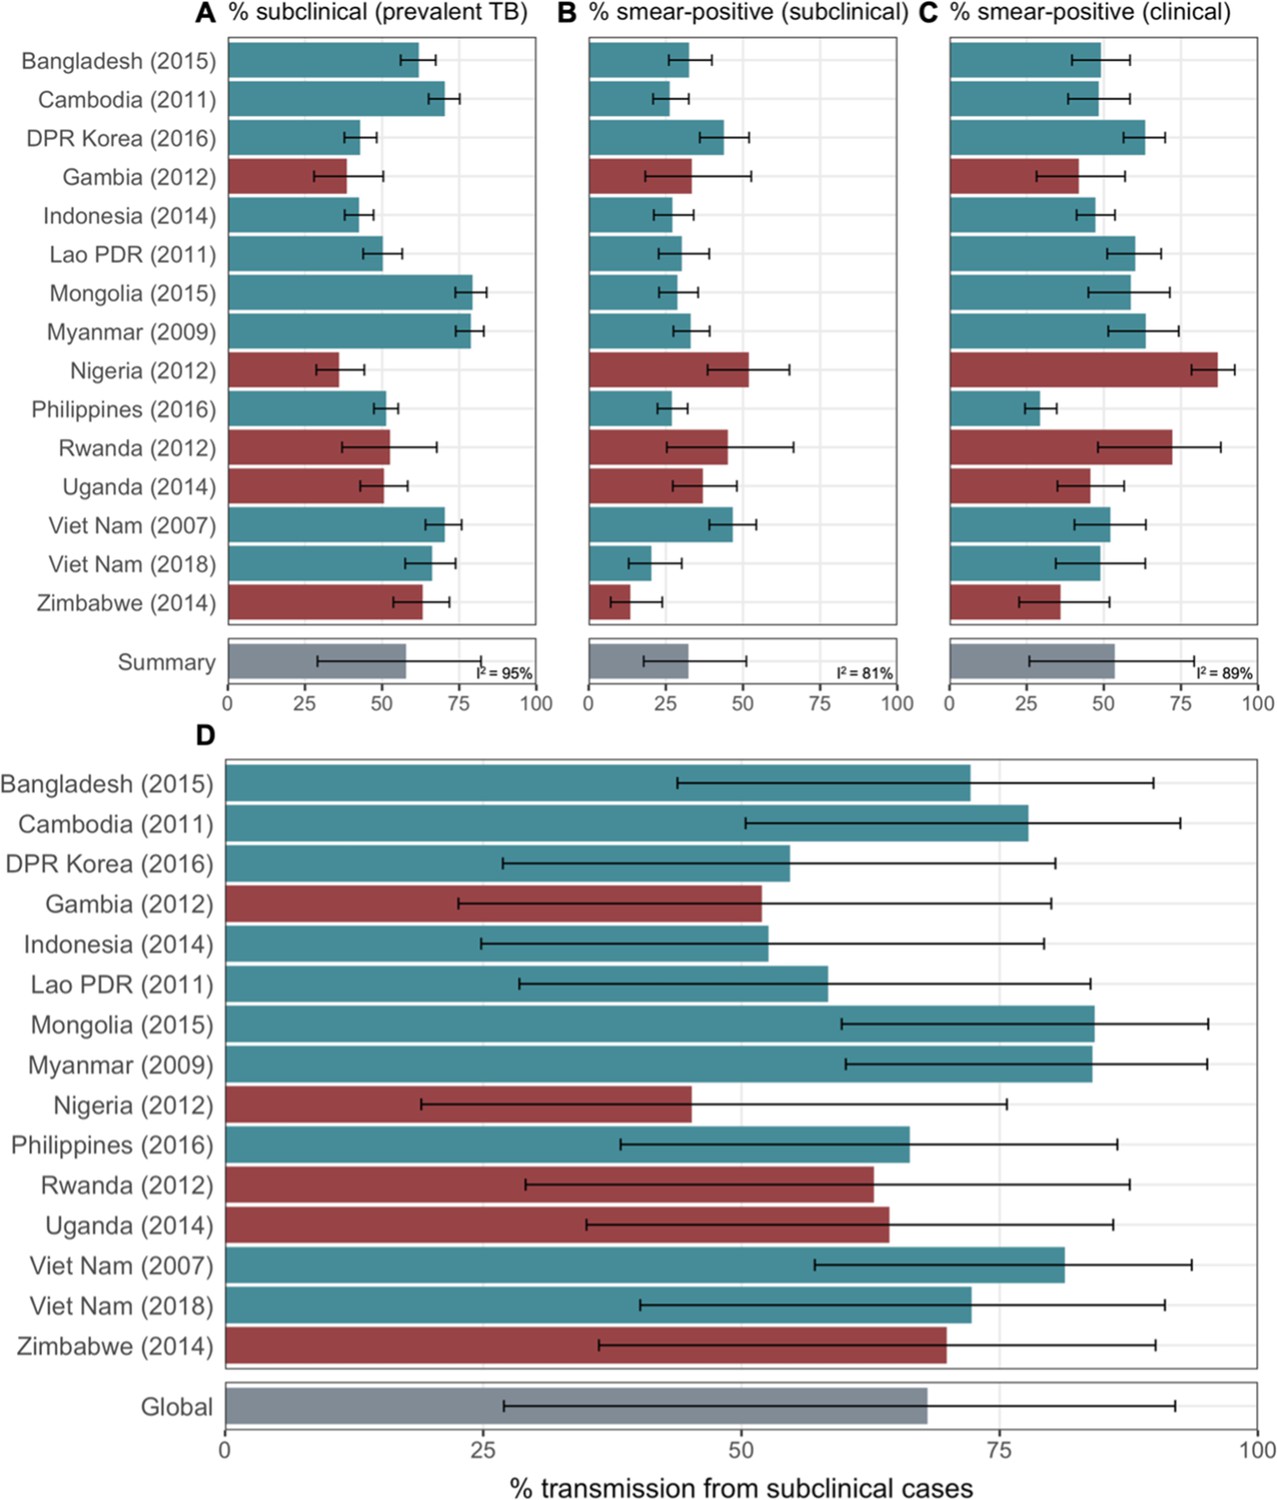
The proportion of prevalent tuberculosis (TB) that is subclinical (A), the proportion of subclinical TB that is smear-positive (B), and the proportion of clinical TB that is smear-positive (C) using data from prevalence surveys in Africa (red) and Asia (teal).
Illustrated are median and 95% confidence intervals for each study separately and the median and 95% prediction intervals from mixed-effects meta-analyses across studies with an associated measure of heterogeneity (I2). Also shown is the estimated proportion of transmission from subclinical TB at the time of and in the location of each of the prevalence surveys in Africa and Asia (D). Illustrated is the median and 95% prediction intervals for each study separately as well as the global value. DPR = Democratic People’s Republic; PDR = People’s Democratic Republic.
Appendix 1—figure 1

Competing risk model (A) with transition rates from Richards et al., 2021 used to estimate the durations of subclinical and clinical tuberculosis (TB) (B).
Appendix 1—figure 2
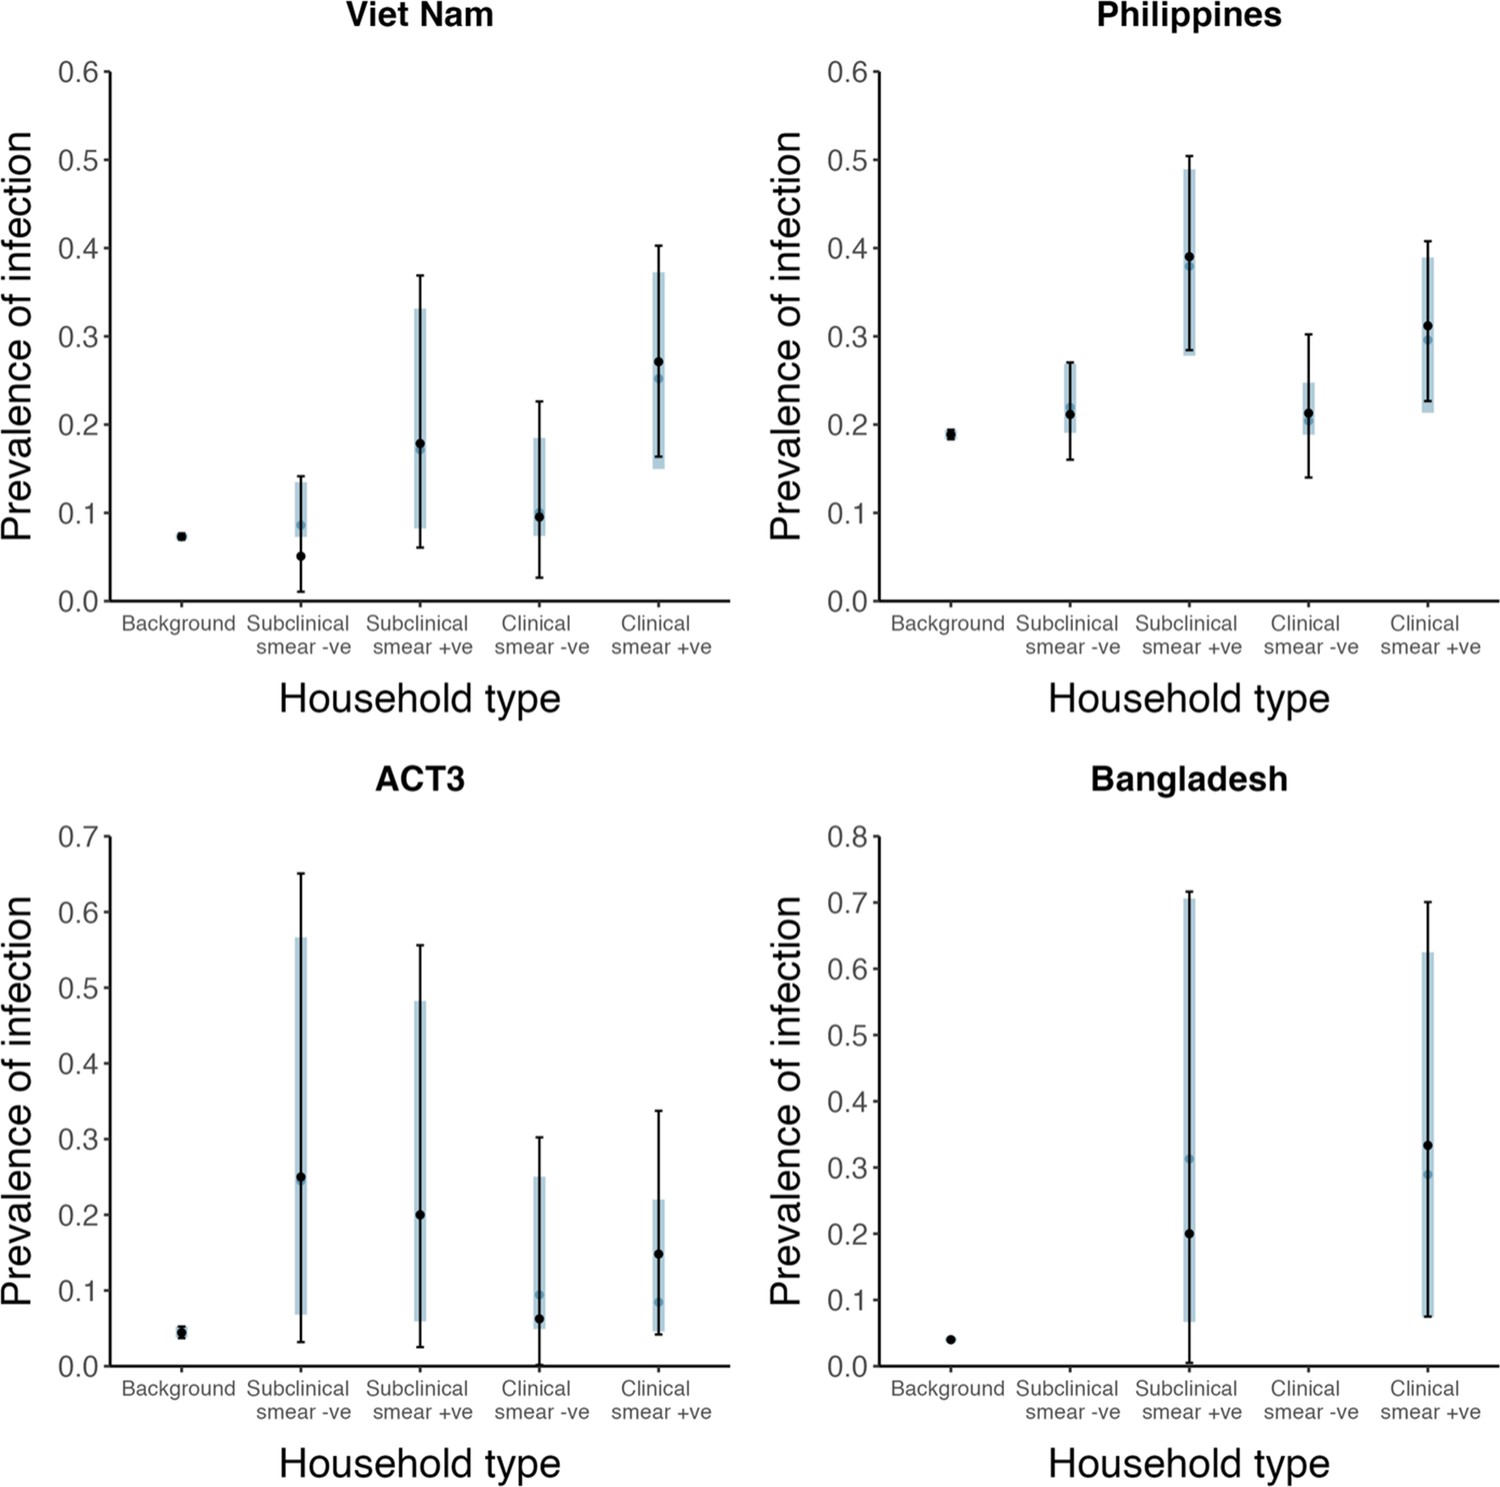
Model fits for each model.
Shown are prevalence of infection in members of households with different index case types (background, subclinical and smear-negative, subclinical and smear-positive, clinical and smear-negative, clinical and smear-positive). Error bars show median and 95% credible intervals. Shaded regions show posterior median and 95% posterior intervals. +ve = positive, -ve = negative.
Appendix 1—figure 3
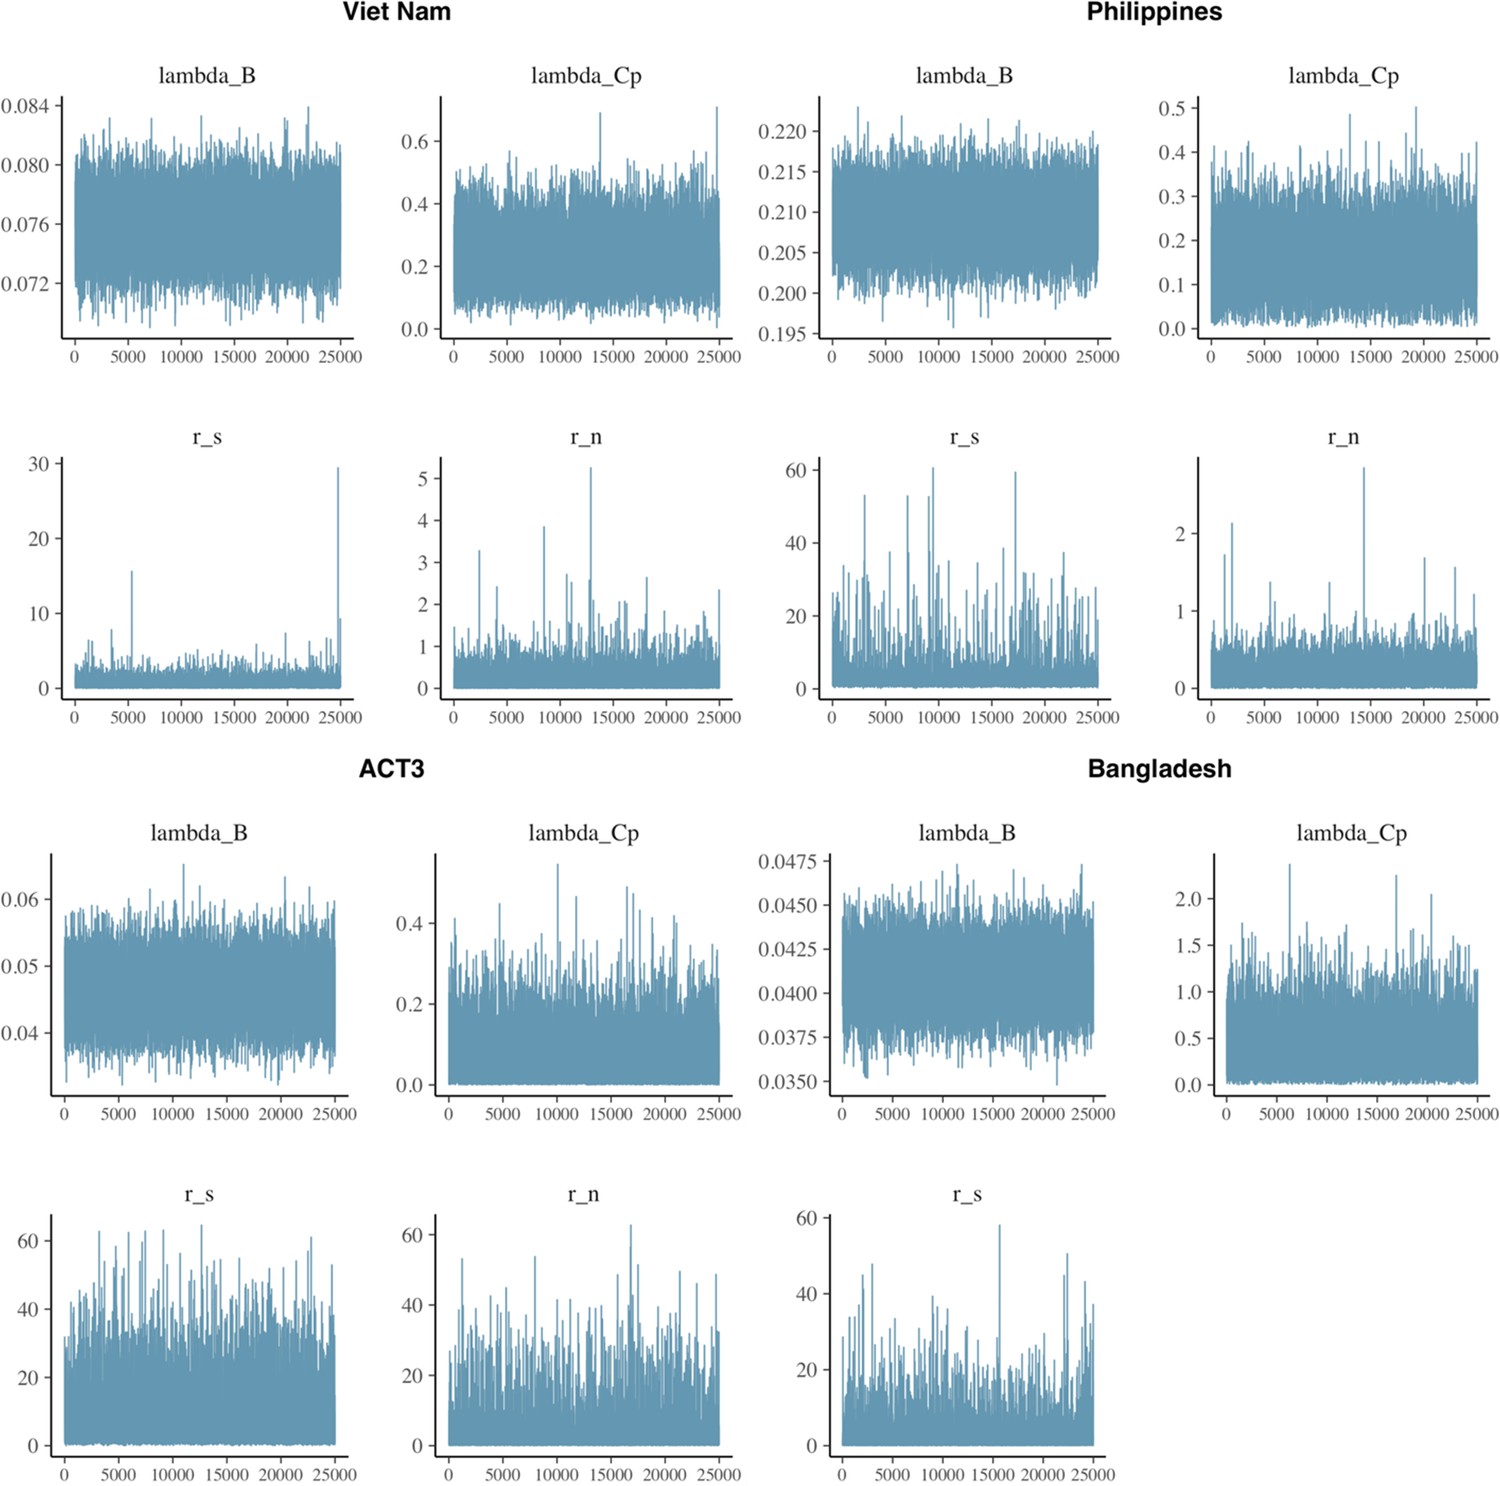
Trace plots for each model.
Appendix 1—figure 4

Correlation plots for each model.
Appendix 1—figure 5

Autocorrelation plots for each model.
Appendix 1—figure 6

Affected results for sensitivity analysis 1.
Figure details for A, B and C are as per Figures 2A, B, 3D in the main text, respectively.
Appendix 1—figure 7

Affected results for sensitivity analysis 2.
Figure details for A, B and C are as per Figures 2A, B, 3D in the main text, respectively.
Appendix 1—figure 8

Affected results for sensitivity analysis 3.
Figure details for A, B and C are as per Figures 2A, B, 3D in the main text, respectively.
Appendix 1—figure 9

Affected results for sensitivity analysis 4.
Figure details for A, B and C are as per Figures 2A, B, 3D in the main text, respectively.
Appendix 1—figure 10
Affected results for sensitivity analysis 5.
Figure details for A, B and C are as per Figures 2A, B, 3D in the main text, respectively.
Tables
Appendix 1—table 1
Summary of the relevant data from studies in which Mtb infection surveys were performed amongst household contacts of culture and/or nucleic acid amplification ttest (NAAT) confirmed cases where information on their symptom and sputum smear status at the time of diagnosis was available.
A negative/positive response to ‘symptoms’ defines subclinical/clinical tuberculosis (TB) in the corresponding study. Infected = number of tuberculin skin test (TST) or interferon-gamma release assay (IGRA)-positive household contacts; Contacts = number of household contacts with a TST or IGRA result; NA = not applicable
| Study | Background | Subclinical | Clinical | Symptoms | |||||||
|---|---|---|---|---|---|---|---|---|---|---|---|
| Smear-negative | Smear-positive | Smear-negative | Smear-positive | ||||||||
| Infected | Contacts | Infected | Contacts | Infected | Contacts | Infected | Contacts | Infected | Contacts | ||
| ACT3 2017 (Marks et al., 2019) | 128 | 2893 | 2 | 8 | 2 | 10 | 1 | 16 | 4 | 27 | Cough >2 wk |
| Bangladesh 2007 (Zaman et al., 2012) | 702 | 17,566 | NA | NA | 1 | 5 | NA | NA | 3 | 9 | Any cough |
| Philippines 1997 (Tupasi et al., 1999) | 3823 | 20,259 | 48 | 227 | 32 | 82 | 23 | 108 | 34 | 109 | Cough >2 wk |
| Vietnam 2007 (Hoa et al., 2010) | 1556 | 21,298 | 3 | 59 | 5 | 28 | 4 | 42 | 16 | 59 | Cough >2 wk |
Appendix 1—table 2
Data extracted from 15 prevalence where sufficient information on sputum smear status at the time of diagnosis was available.
The ‘symptom threshold’ used for initial symptom screening is the metric used here to define subclinical (negative) and clinical (positive). Neg = negative, Pos = positive.
| Survey setting (ref) | Year | Subclinicalsmear neg. | Subclinicalsmear pos. | Clinical smear neg. | Clinicalsmear pos. | Number screened | Symptom threshold |
|---|---|---|---|---|---|---|---|
| Viet Nam (Nguyen et al., 2020) | 2018 | 67 | 17 | 22 | 21 | 61,763 | Cough >2 wk |
| Viet Nam (Ministry of Health - Vietnam, 2008) | 2007 | 87 | 76 | 33 | 36 | 94,179 | Productive cough >2 wk |
| Myanmar (Ministry of Health - Myanmar, 2010) | 2009 | 164 | 81 | 24 | 42 | 51,367 | Any symptom |
| Lao PDR (Law et al., 2015) | 2011 | 83 | 36 | 47 | 71 | 39,212 | Cough >2 wk and/or other |
| Cambodia (Ministry of Health - Cambodia, 2011) | 2011 | 163 | 58 | 48 | 45 | 37,417 | Cough >2 wk and/or other |
| Gambia (Ministry of Health and Social Welfare - The Gambia, 2011) | 2012 | 18 | 9 | 25 | 18 | 43,100 | Cough >2 wk and/or other |
| Rwanda (Ministry of Health - Rwanda, 2014) | 2012 | 11 | 9 | 5 | 13 | 43,128 | Any symptom |
| Nigeria (Federal Republic of Nigeria, 2012) | 2012 | 25 | 27 | 12 | 80 | 44,186 | Cough >2 wk |
| Indonesia (Ministry of Health, Republic of Indonesia, 2015) | 2014 | 132 | 49 | 129 | 116 | 67,944 | Cough >2 wk and/or other |
| Uganda (The Republic of Uganda, 2015) | 2014 | 51 | 30 | 43 | 36 | 41,154 | Cough >2 wk |
| Zimbabwe (Ministry of Health and Child Care – Zimbabwe, 2014) | 2014 | 58 | 9 | 25 | 14 | 33,736 | Any symptom |
| Bangladesh (DGHS Ministry of Health and Family Welfare - Bangladesh, 2015) | 2015 | 116 | 56 | 54 | 52 | 98,710 | Cough >2 wk and/or other |
| Mongolia (Ministry of Health - Mongolia, 2016) | 2015 | 139 | 56 | 21 | 30 | 50,309 | Cough >2 wk |
| DPR Korea (Democratic People’s Republic of Korea, 2016) | 2016 | 82 | 64 | 71 | 123 | 60,683 | Cough >2 wk and/or other |
| Philippines (Department of Health - Philippines, 2016) | 2016 | 231 | 85 | 212 | 88 | 46,689 | Cough >2 wk and/or other |
Appendix 1—table 3
Progression and regression parameter values taken from (Richards et al., 2021) used to estimate the durations of subclinical and clinical tuberculosis (TB) using the competing risk method detailed in the main text.
See Richards et al., 2021 for data sources and methods for estimating the above parameters.
| Parameter | Value (95% posterior interval) | Units |
|---|---|---|
| Regression from subclinical | 1.54 (1.23–1.90) | Per year |
| Progression from subclinical | 0.67 (0.54–0.86) | Per year |
| Regression from clinical | 0.57 (0.47–0.69) | Per year |
| Treatment from clinical | 0.70 | Per year |
| Death from clinical | 0.32 (0.27–0.37) | Per year |
Appendix 1—table 4
Posterior summary statistics for each model.
Shown are the effective sample size (n_eff); the ‘R hat’ statistic (Rhat); sample mean (mean); Monte Carlo standard error (mcse); sample standard deviation (sd); and sample quantiles (2.5%, 50%, 97.5%).
| n_eff | Rhat | Mean | mcse | sd | 2.5% | 50% | 97.5% | |
|---|---|---|---|---|---|---|---|---|
| Viet Nam | ||||||||
| lambda_B | 16,683 | 1 | 0.076 | 0.000 | 0.002 | 0.072 | 0.076 | 0.080 |
| lambda_Cp | 14,000 | 1 | 0.222 | 0.001 | 0.078 | 0.089 | 0.216 | 0.393 |
| r_s | 11,465 | 1 | 0.653 | 0.006 | 0.610 | 0.050 | 0.524 | 1.988 |
| r_n | 15,677 | 1 | 0.195 | 0.002 | 0.197 | 0.006 | 0.140 | 0.682 |
| Philippines | ||||||||
| lambda_B | 12,836 | 1 | 0.209 | 0.000 | 0.003 | 0.203 | 0.209 | 0.216 |
| lambda_Cp | 8107 | 1 | 0.145 | 0.001 | 0.065 | 0.028 | 0.142 | 0.281 |
| r_s | 4532 | 1 | 2.644 | 0.044 | 2.940 | 0.683 | 1.910 | 9.700 |
| r_n | 15,022 | 1 | 0.172 | 0.001 | 0.131 | 0.010 | 0.145 | 0.484 |
| ACT3 | ||||||||
| lambda_B | 13,924 | 1 | 0.046 | 0.000 | 0.004 | 0.038 | 0.046 | 0.054 |
| lambda_Cp | 10,476 | 1 | 0.058 | 0.001 | 0.055 | 0.002 | 0.042 | 0.203 |
| r_s | 9133 | 1 | 6.843 | 0.074 | 7.052 | 0.612 | 4.406 | 27.192 |
| r_n | 7628 | 1 | 2.696 | 0.049 | 4.273 | 0.143 | 1.337 | 15.314 |
| Bangladesh | ||||||||
| lambda_B | 10,804 | 1 | 0.041 | 0.000 | 0.002 | 0.038 | 0.041 | 0.044 |
| lambda_Cp | 11,415 | 1 | 0.349 | 0.002 | 0.240 | 0.037 | 0.297 | 0.944 |
| r_s | 7640 | 1 | 2.101 | 0.036 | 3.174 | 0.076 | 1.113 | 10.723 |
Additional files
Download links
A two-part list of links to download the article, or parts of the article, in various formats.
Downloads (link to download the article as PDF)
Open citations (links to open the citations from this article in various online reference manager services)
Cite this article (links to download the citations from this article in formats compatible with various reference manager tools)
Estimating the contribution of subclinical tuberculosis disease to transmission: An individual patient data analysis from prevalence surveys
eLife 12:e82469.
https://doi.org/10.7554/eLife.82469


