Metabolic activity organizes olfactory representations
- Osmo, United States
- Google Research, Brain Team, United States
- Department of Computer Science, University of Illinois, United States
- TropIQ Health Sciences, Netherlands
Figures
Figure 1 with 3 supplements
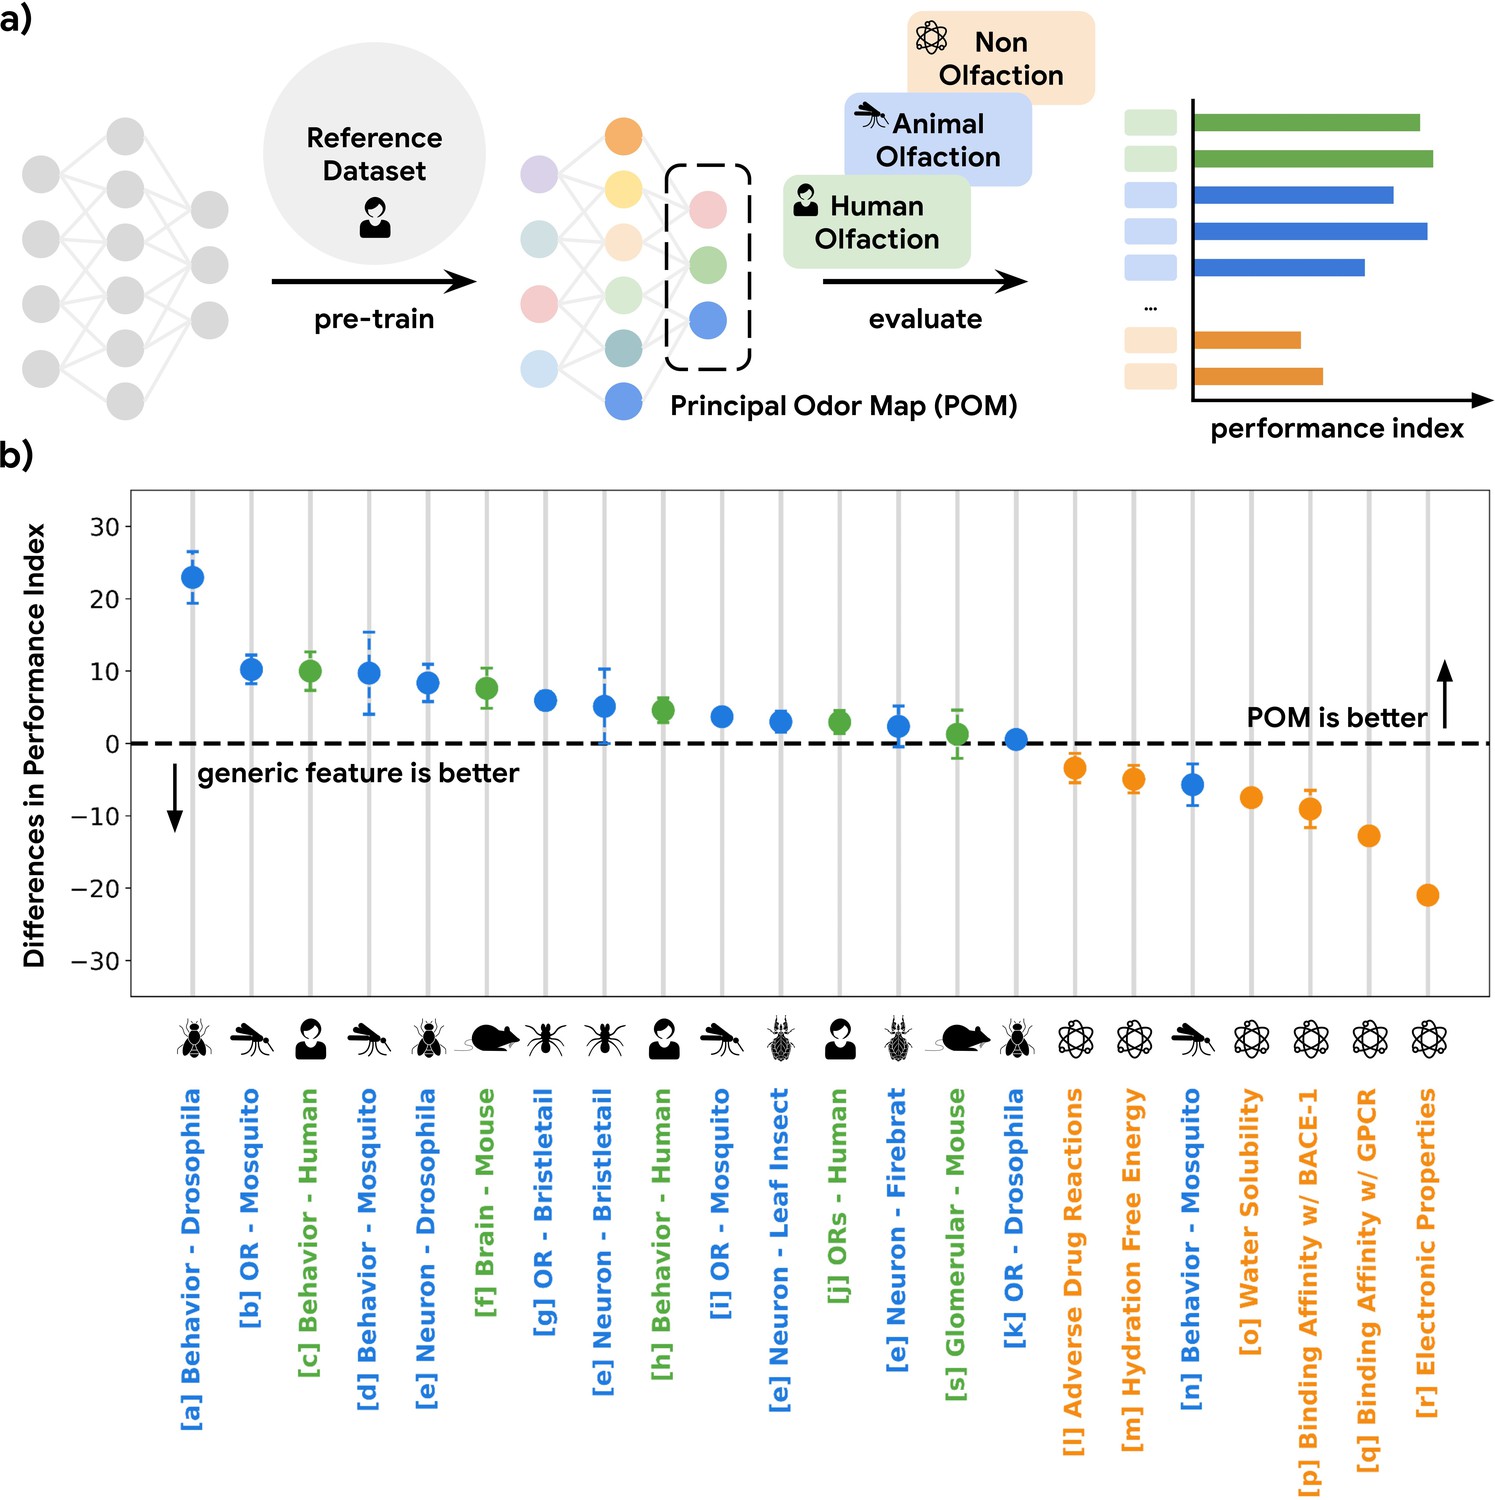
A single latent space can explain olfactory data across species and scales.
(a) A graph neural network model pre-trained on human olfactory perceptual data produces a principal odor map, or POM (latent space, dashed box), which can be used to make predictions about any small, volatile molecule in biological and behavioral experiments. (b) A random forest model using only POM produces predictions that meet or exceed those obtained from commonly used generic molecular features (Moriwaki et al., 2018; Bajusz et al., 2015; Mordred) across a range of olfactory datasets (Keller et al., 2017; MacWilliam et al., 2018; Missbach et al., 2014; Hallem and Carlson, 2006; Xu et al., 2014; Carey et al., 2010; Oliferenko et al., 2013; Dravnieks, 1982; Gupta et al., 2021; Pashkovski et al., 2020; Del Mármol et al., 2021; Wu et al., 2018; Kuhn et al., 2016; Mobley and Guthrie, 2014; Delaney, 2004; Subramanian et al., 2016; Rupp et al., 2012; Kooistra et al., 2021; Chae et al., 2019; Wei et al., 2022) in different species (green for vertebrates and blue for invertebrates) but not for prediction of non-odorous molecular properties (orange). The Y-axis is the difference between performance indices for models using POM vs. generic molecular features. Performance index is a rescaled metric to place classification and regression performance on the same axis. Performance indices of 0 and 100 represent random and perfect predictions, respectively. Error bars are calculated as the SD of performance differences across multiple random seeds.
Figure 1—figure supplement 1
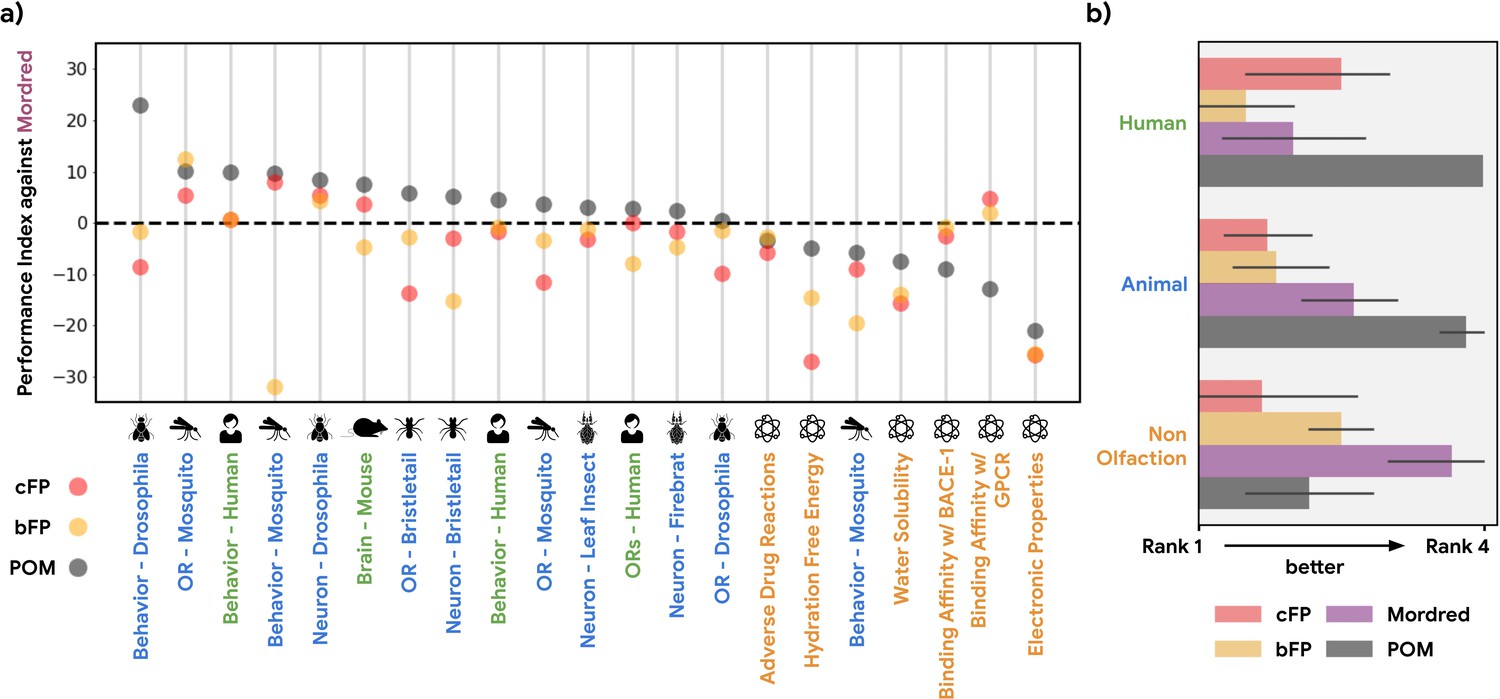
Performance index for alternative structure-based featurizations.
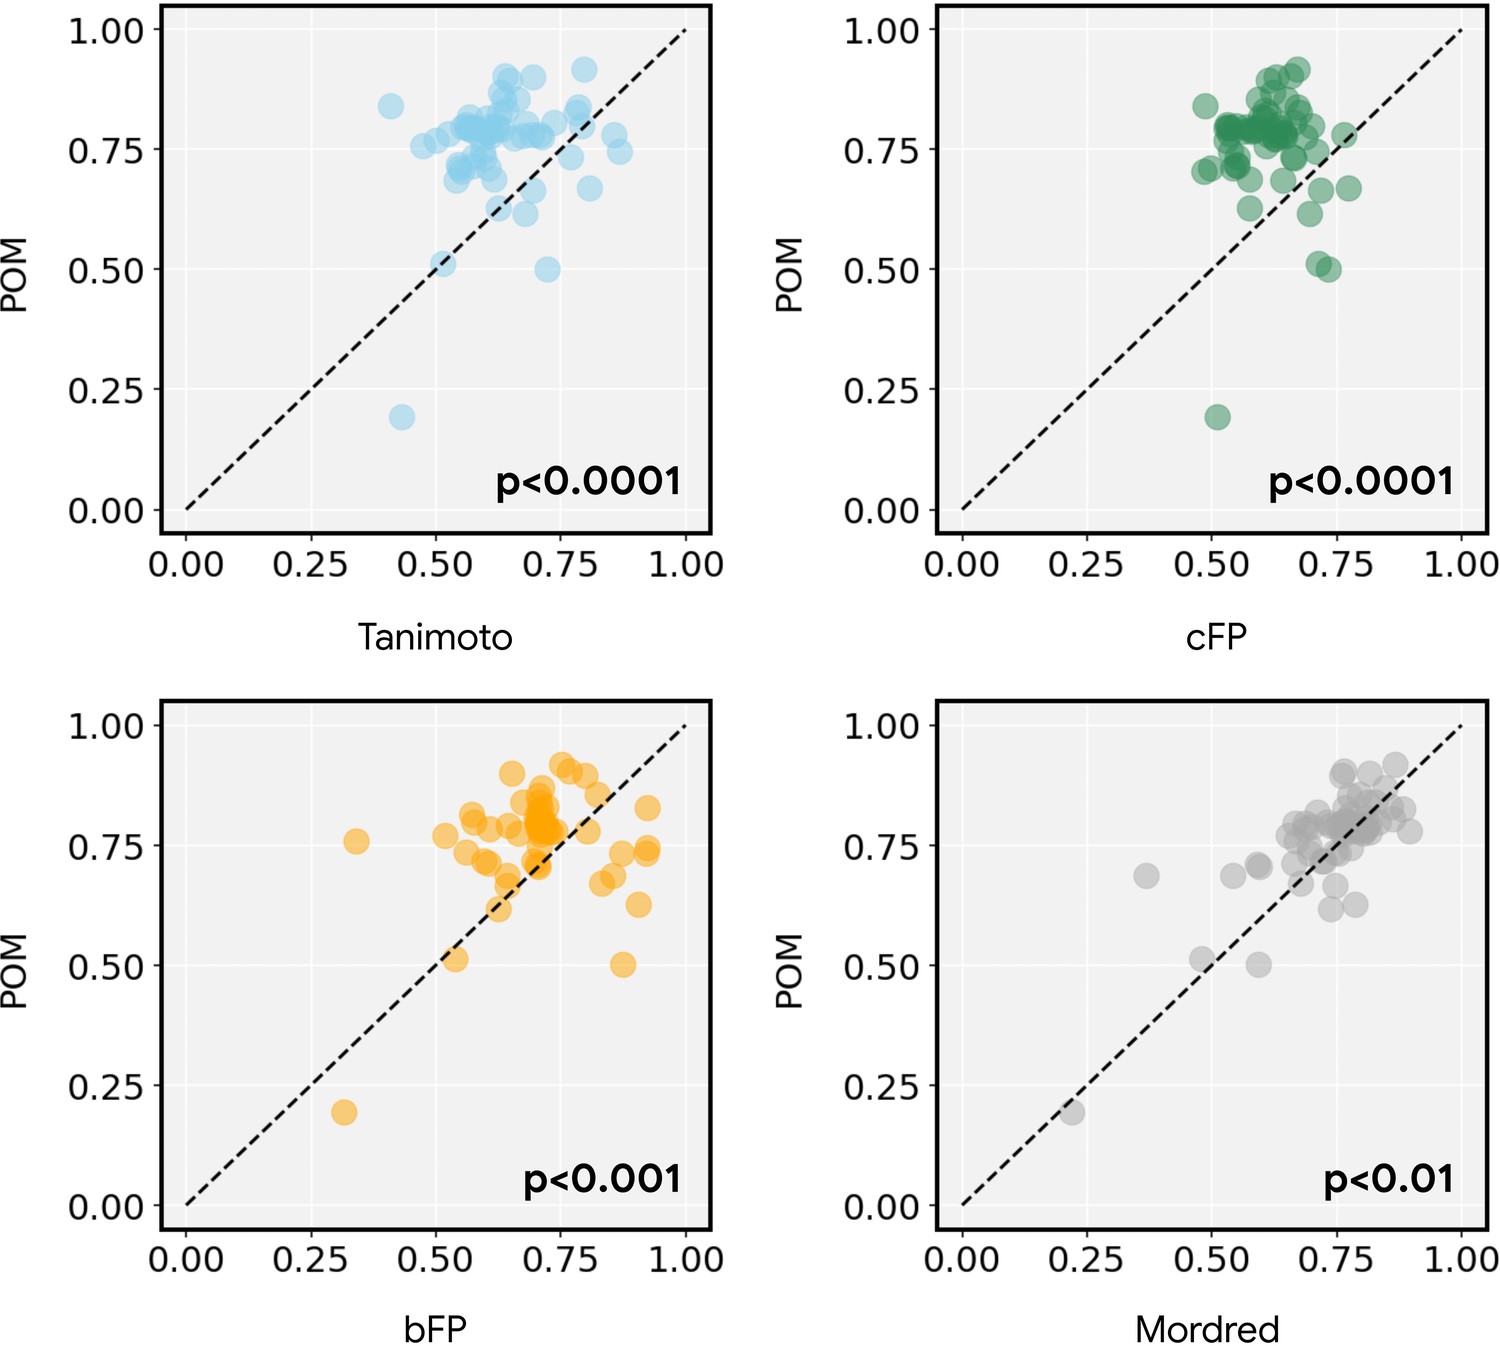
(a) Similar to Figure 1b, but showing performance of both principal odor map (POM; gray) and alternatives (count-based fingerprints, cFP, red; and bit-based fingerprints, bFP, orange) against Mordred chemoinformatic features. Only POM shows a consistent advantage in olfactory tasks. (b) Summary of (a) by averaging the performance ranking of different featurization methods, grouped by the origin of the task. Here, a higher rank means better performance – the best rank is 4 and the worst rank is 1.
Figure 1—figure supplement 2
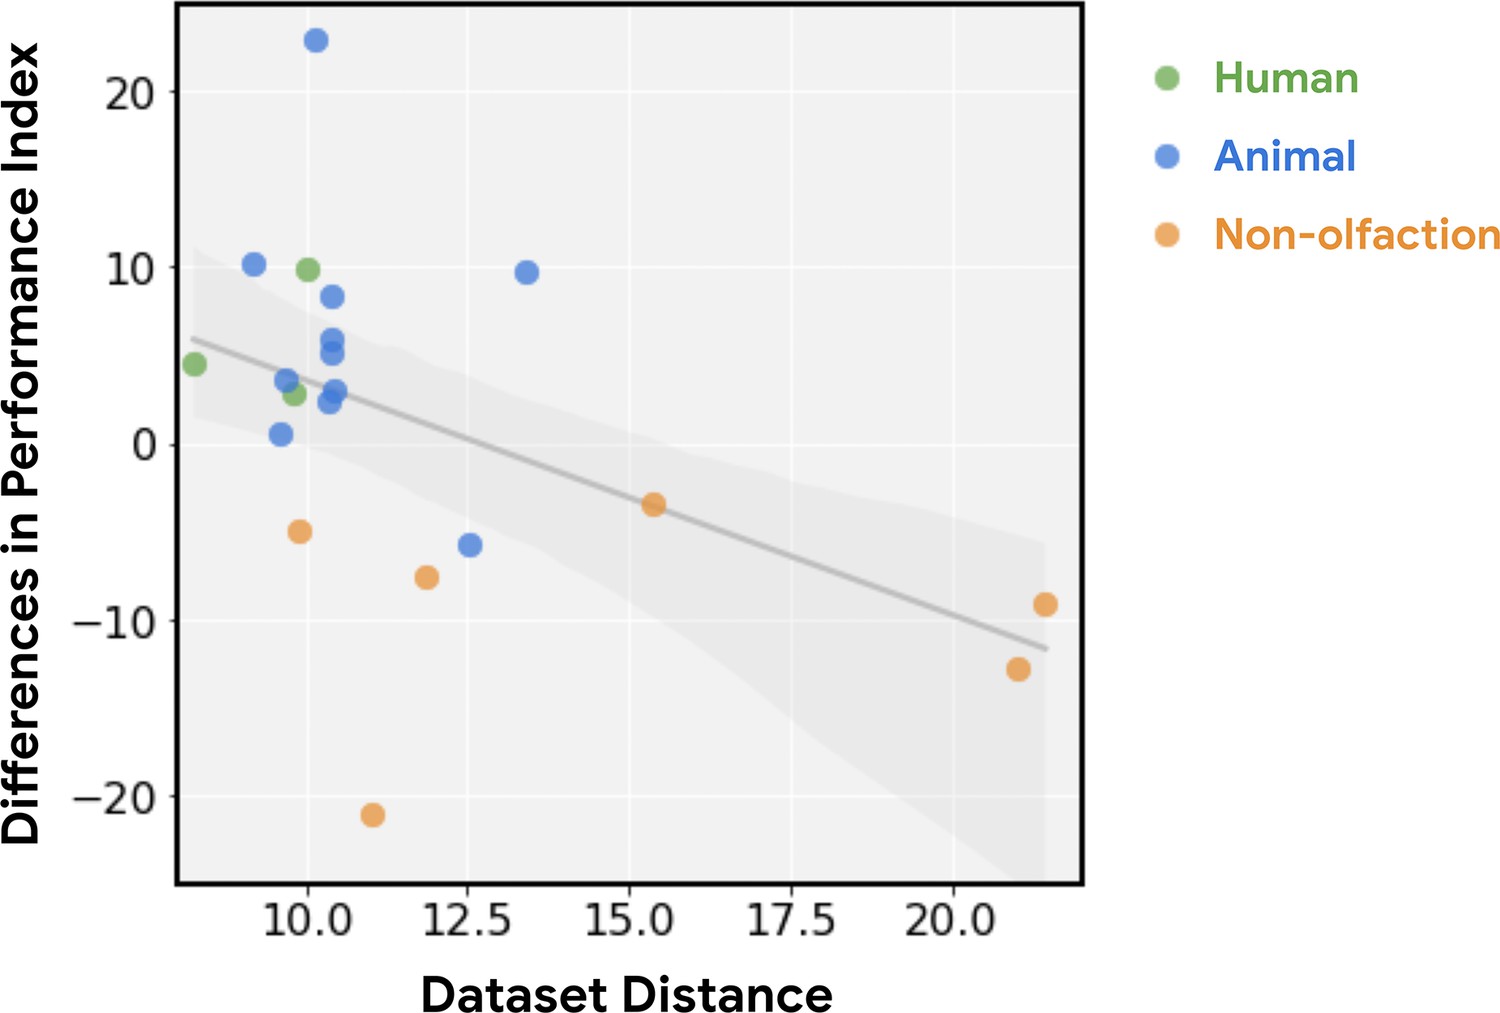
Relative performance of principal odor map (POM) is a function of dataset distance.
The advantage in predictive performance for POM vs. Mordred (i.e. see vertical axis in Figure 1b) decreases as the dataset becomes less relevant to olfaction (r=0.49, p<0.03). Relevance is measured by dataset distance (farther is less relevant), quantified as the distance from the training data (human odor labels) computed via the optimal transport method (Alvarez-Melis and Fusi, 2020).
Figure 1—figure supplement 3
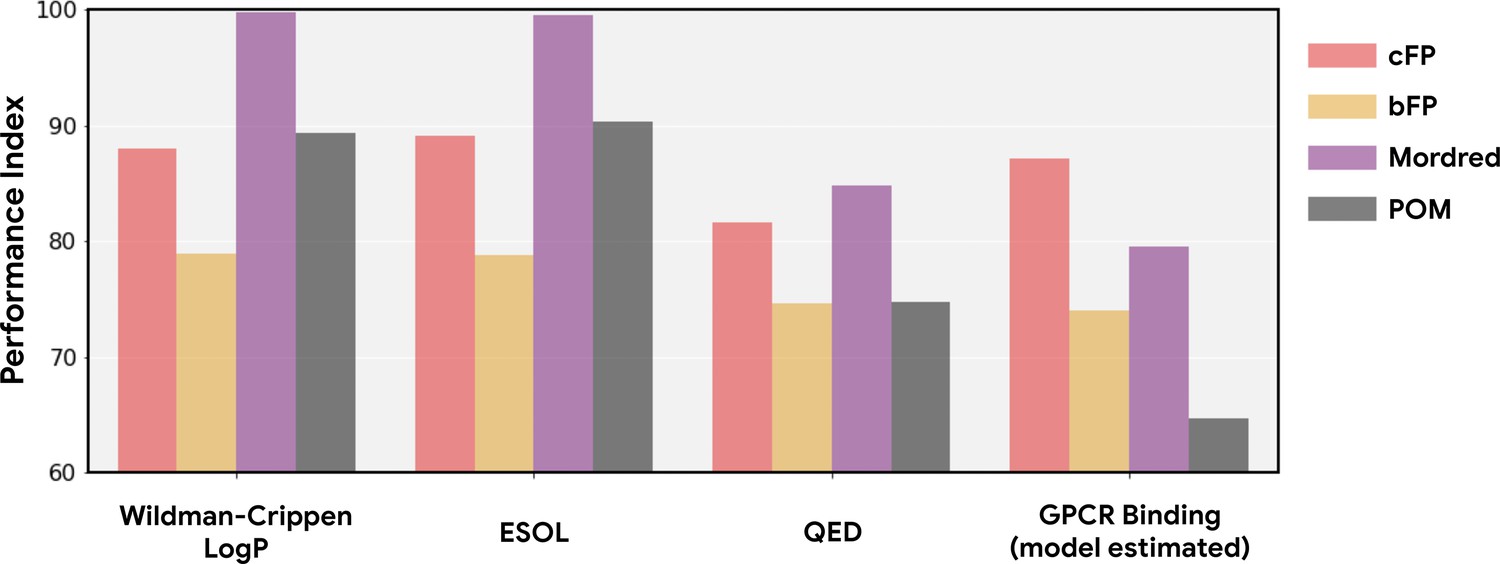
Principal odor map (POM) has no predictive advantage for non-olfaction-related chemoinformatic properties of odorous molecules.
In Figure 1 and Figure ED1, we estimate the performance index of POM and other methods on non-olfaction datasets containing molecules that are not necessarily odor-molecule-like. In order to control for such molecular distribution shifts, we construct four datasets for non-olfaction-related tasks on the same set of odorous molecules used in the training dataset. For general molecular properties, we compute Wildman-Crippen LogP (Wildman and Crippen, 1999), ESOL (Delaney, 2004), and QED (Bickerton et al., 2012) values for molecules in the training dataset; for enteric GPCR binding, we estimated the binding affinity between these molecules and the same GPCR used in Figure 1 using the winning model from the IDG-DREAM Drug-Kinase Binding Prediction Challenge (Cichońska et al., 2021). As in Figure 1, POM shows no advantage on these non-olfaction tasks and is strictly dominated by Mordred across each such task.
Figure 2 with 5 supplements
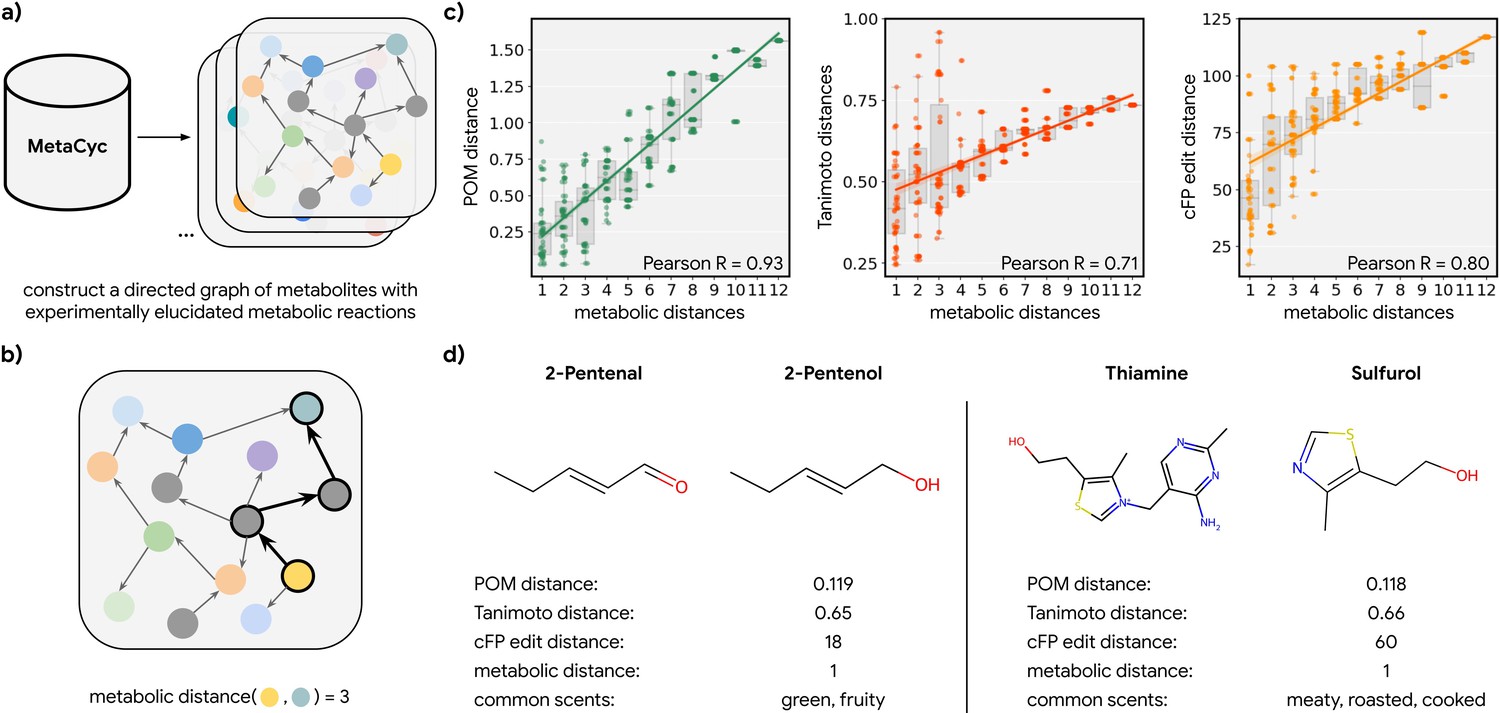
Metabolic pathways predict distance in the principal odor map (POM).
(a) The contents of MetaCyc, a large database of experimentally elucidated metabolic reactions across multiple species, were used to construct directed graphs connecting metabolites, including those with odors (non-gray). (b) The discrete pairwise distance of two molecules was defined by the shortest directed path between them within a species’ metabolic graph (if any). Each step corresponds to a single chemical reaction specified in MetaCyc. (c) Continuous pairwise distances between molecules in POM – which was produced from human perceptual data alone – are strongly correlated with discrete metabolic distance (left, r=0.93). This effect is not driven solely by the structure similarity of related metabolites since a weaker relationship is observed using alternative structural distance metrics including Tanimoto distance (center, r=0.71) and edit distance in count-based fingerprints (right, r=0.80). (d) Two pairs of example molecules that are closely related in metabolism. While these are structurally dissimilar molecules (Tanimoto distance >0.65; left: change in a key functional group; right: removal of a major substructure), a single metabolic reaction can turn one to the other, and therefore, POM also organizes them closely together (POM distance <0.12). In turn, they have similar odor profiles.
Figure 2—figure supplement 1
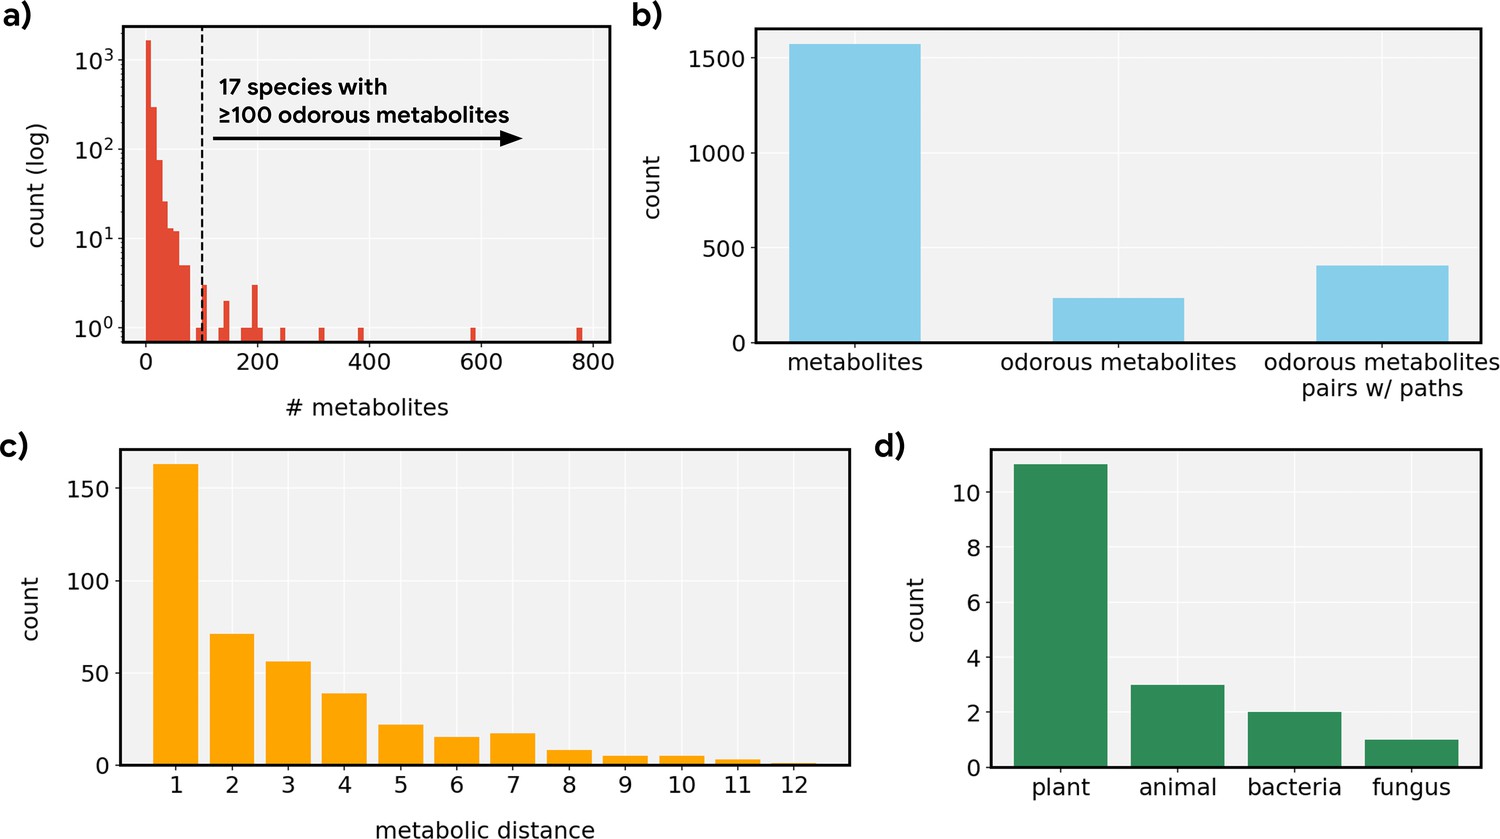
Distributional statistics for metabolic networks.
(a) Distribution of the count of metabolites described in MetaCyc across individual species. Most species were not well-represented, resulting in sparse networks, but 17 species were represented by ≥100 metabolites which we then selected for the analysis. (b) Most metabolites did not pass a simple odorousness filter, but we still find 405 pairs of odorous metabolites that can be connected via various steps of metabolic reactions. (c) Most odorous metabolites were connected by a short reaction path (≤3 steps), but the path can contain as many as 12 metabolic reactions. (d) The 17 species whose metabolic networks are used here span four different kingdoms of life.
Figure 2—figure supplement 2
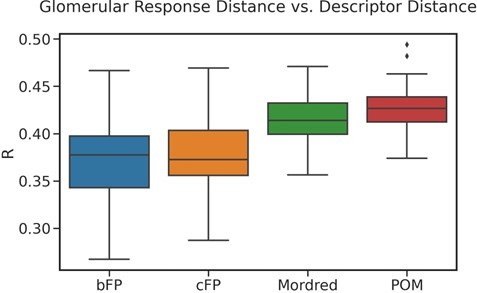
Correlation between principal odor map (POM) distance and other descriptors.
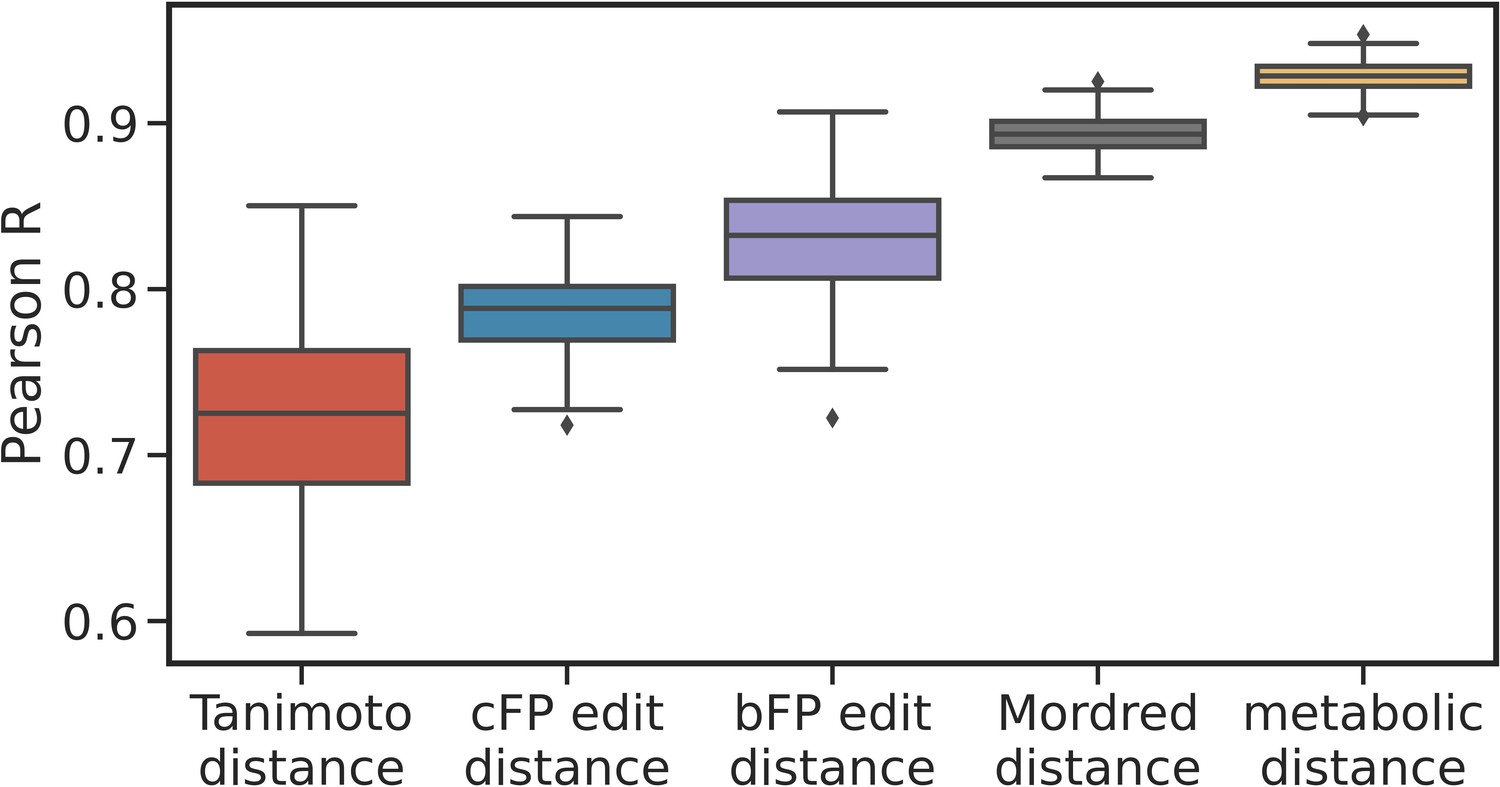
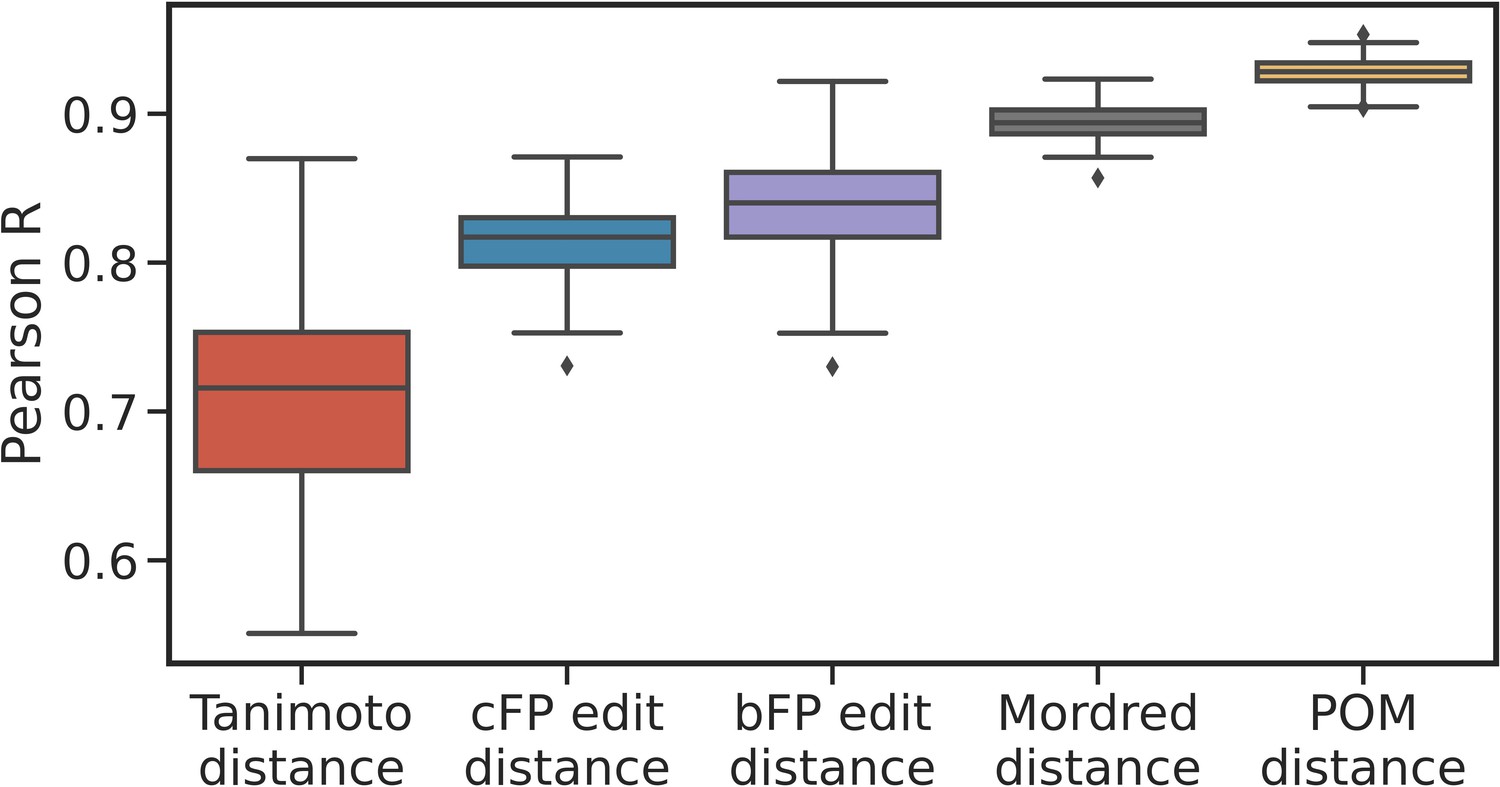
Box plots show the median, interquartile range, and min/max correlations for 100 sampling seeds, between POM distance and other distance measures for metabolite pairs. These structural and physicochemical-based descriptors show significant correlation with POM distance, but the metabolic distances shows the highest correlation with POM distance.
Figure 2—figure supplement 3
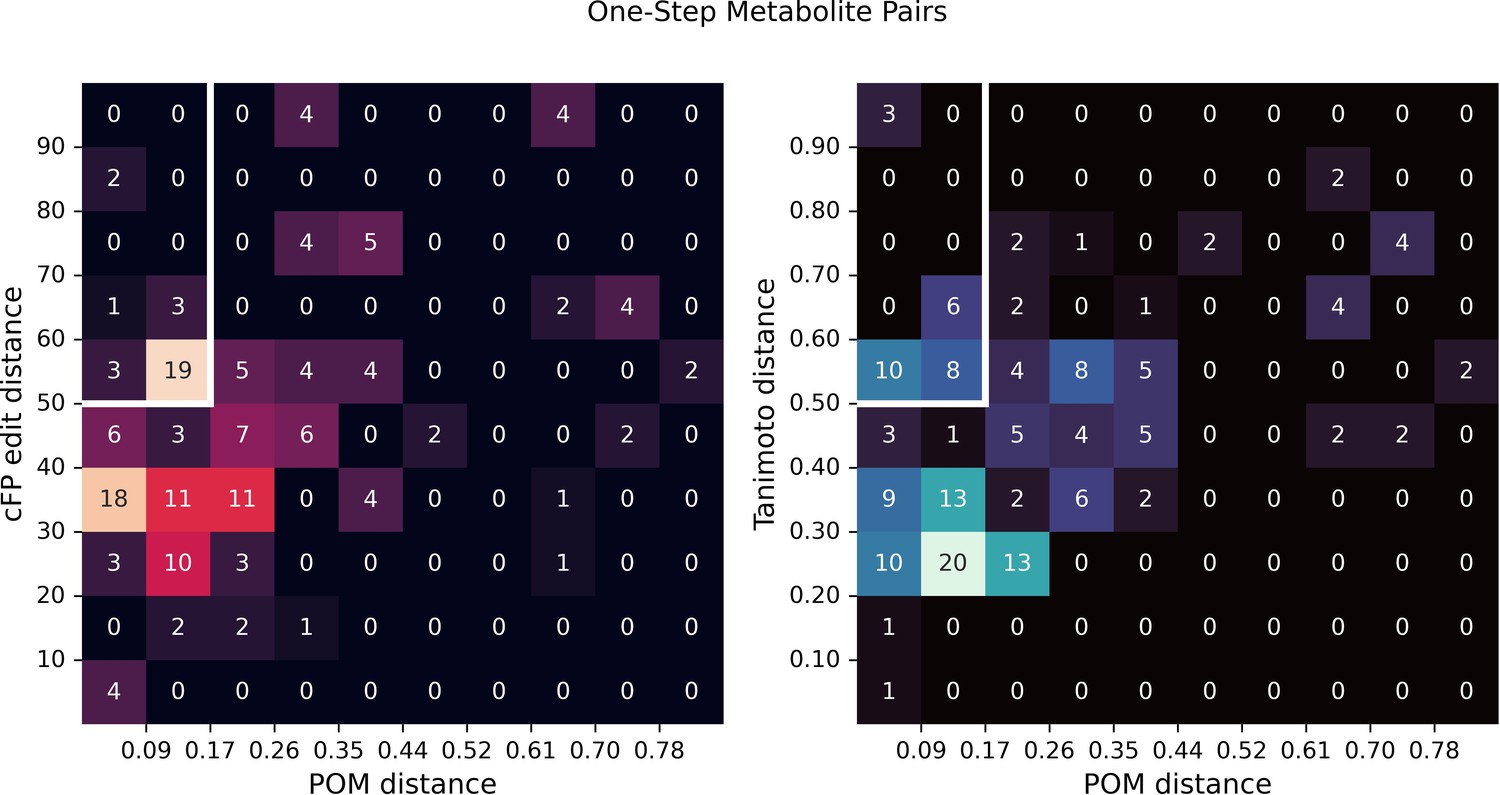
Structural distance vs. principal odor map (POM) distance for one-step metabolite pairs.
In Figure 2d, we show two examples of one-step metabolite pairs with small POM distance and large structural distance (including count-based fingerprints [cFP] edit distance and Tanimoto distance). Here, we show two density plots for structural distance and POM distance for one-step metabolite pairs, indicating the relative frequency of cases such as shown in Figure 2d.
Figure 2—figure supplement 4
Correlations are robust to alternative sub-samples of metabolite pairs.
Box plots show the median, interquartile range, and min/max correlations between the given distance measure and metabolic distance for 100 sampling seeds, i.e., for alternative sub-samples of metabolite pairs compared to those shown in Figure 2c. The correlation for principal odor map (POM) distance is uniformly stronger than for other distance measures.
Figure 2—figure supplement 5
Perturbation of the metabolic graph destroys the observed relationships.
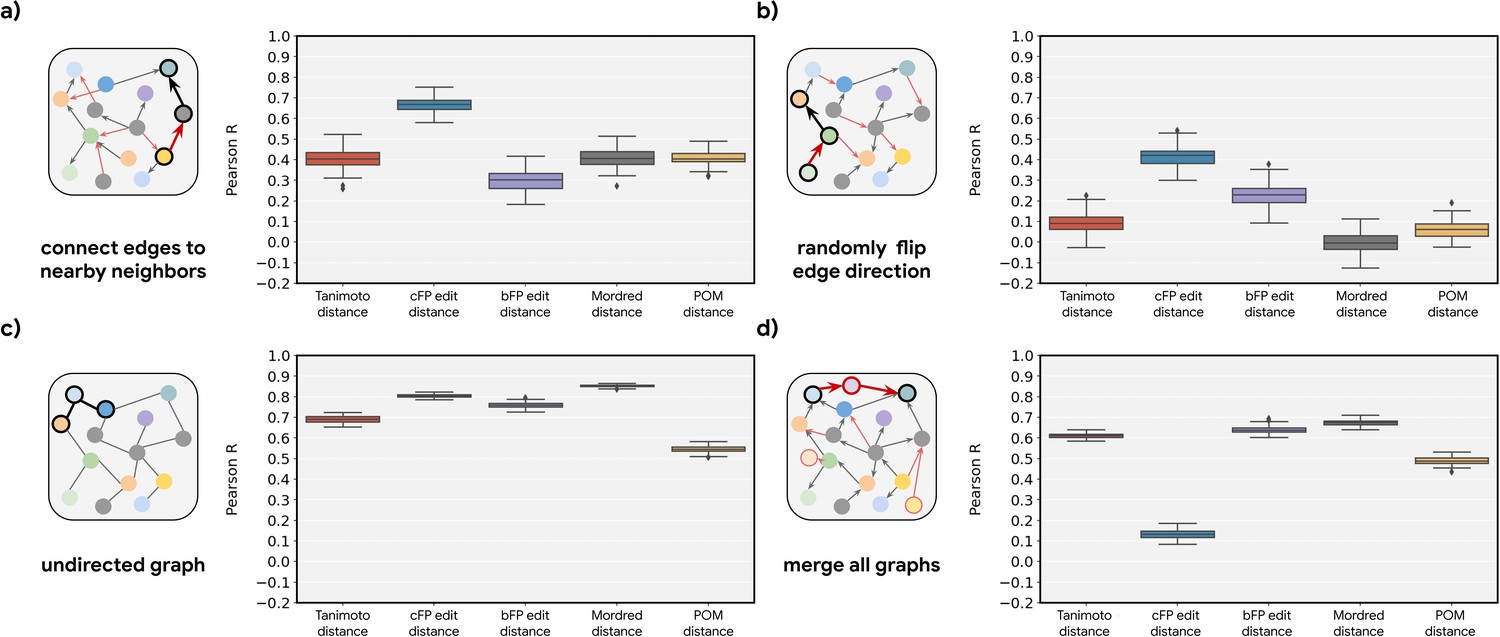
Correlations (across random seeds as shown in Figure 2—figure supplement 4) between metabolic distance and the indicated intermolecular distance for four different perturbations on the original metabolic networks: (a) End points of all the edges are randomly re-assigned to either the original metabolite or its neighbors. (b) Directions of 50% of the edges are reversed (i.e. reactants become products and vice versa). (c) Ablation of direction information (reactant vs. product identity becomes indeterminate). (d) Merging of all graphs across organisms, i.e., any reaction in an organism can be used to determine metabolic distance.
Figure 3 with 2 supplements
Smoothness of metabolic pathways in the principal odor map (POM).
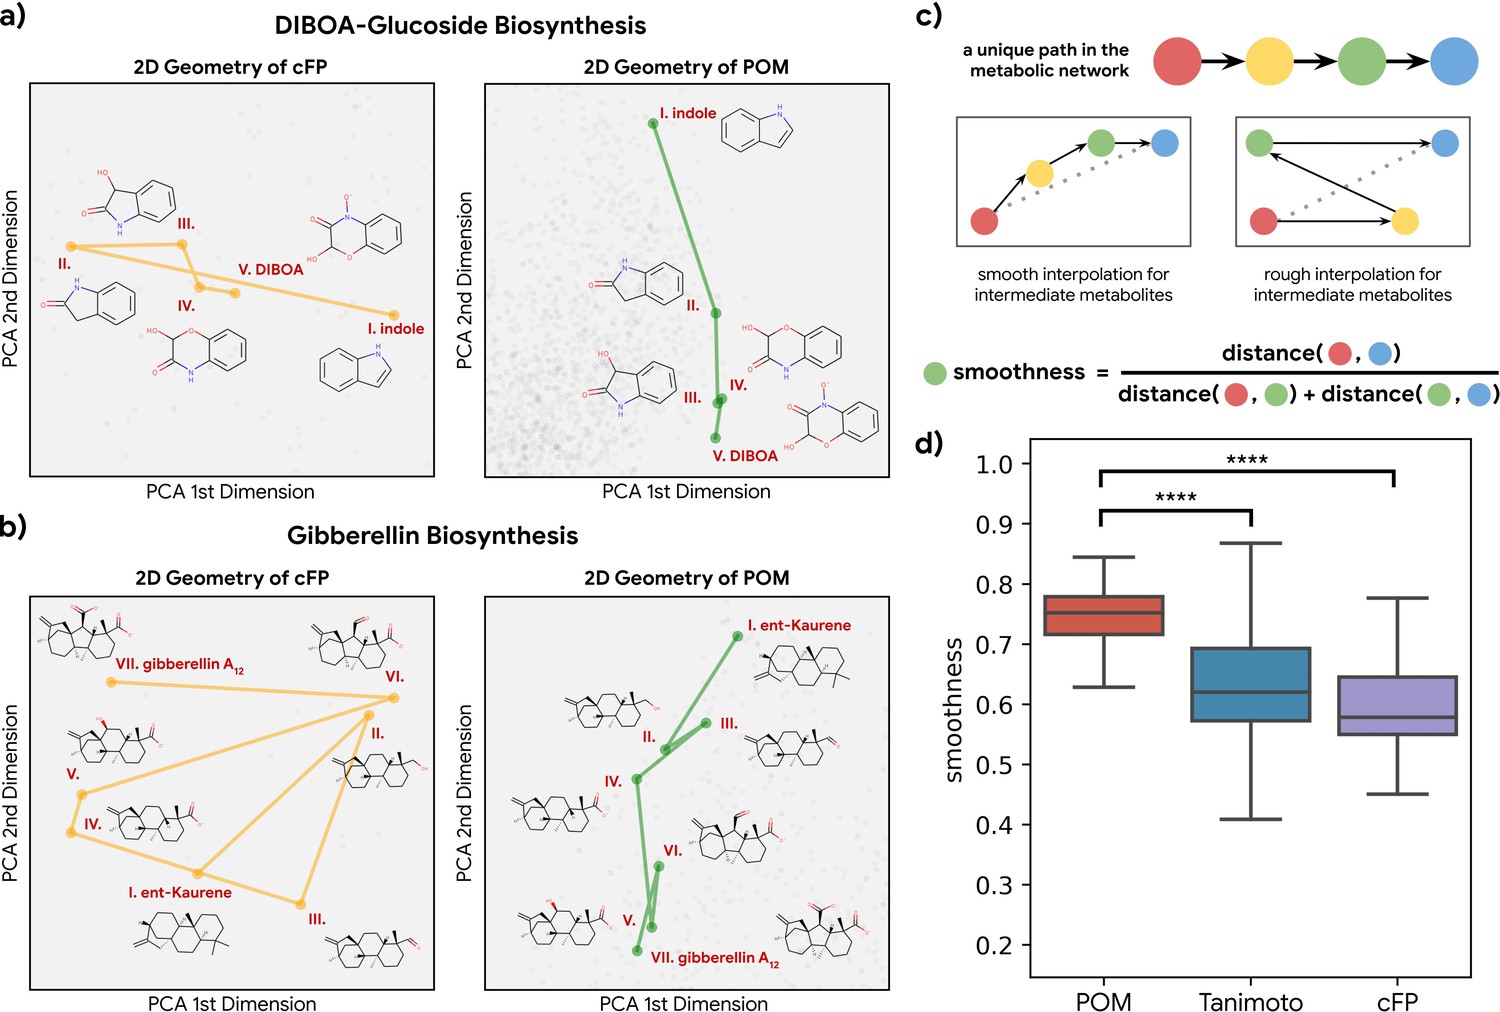
(a) Left: a four-step pathway (DIBOA-glucoside biosynthesis) depicted in a 2D representation of the structure fingerprints (count-based fingerprints, or cFP) using principal components analysis. Right: the same pathway depicted in a 2D representation of the POM. (b) Left: the same 2D cFP representation for a six-step pathway (gibberellin biosynthesis). Right: a 2D representation of the same pathway in the POM. We observe relatively smooth trajectories in POM for these pathways even though the same pathways show irregular trajectories in the structure space. (c) To systematically quantify such ‘smoothness,’ we examine all unique pathways in the metabolic network (top). A desirable molecular representation should exhibit smooth reaction paths, proceeding in a more consistent direction from the starting metabolite to the final metabolite allowing interpolation for intermediate metabolites (center). Smoothness for an intermediate metabolite is formally defined as the ratio between the direct euclidean distance and total path length between the start and end metabolites. A smoother path will result in a ratio close to 1 (bottom). (d) Metabolic trajectories are smoother after metabolite structures are projected to POM than when using alternative structural distance metrics (paired t-test, p<0.0001 for both structure distance metrics).
Figure 3—figure supplement 1
The smoothness of metabolic pathways in principal odor map (POM) is not an artifact of dimensionality.
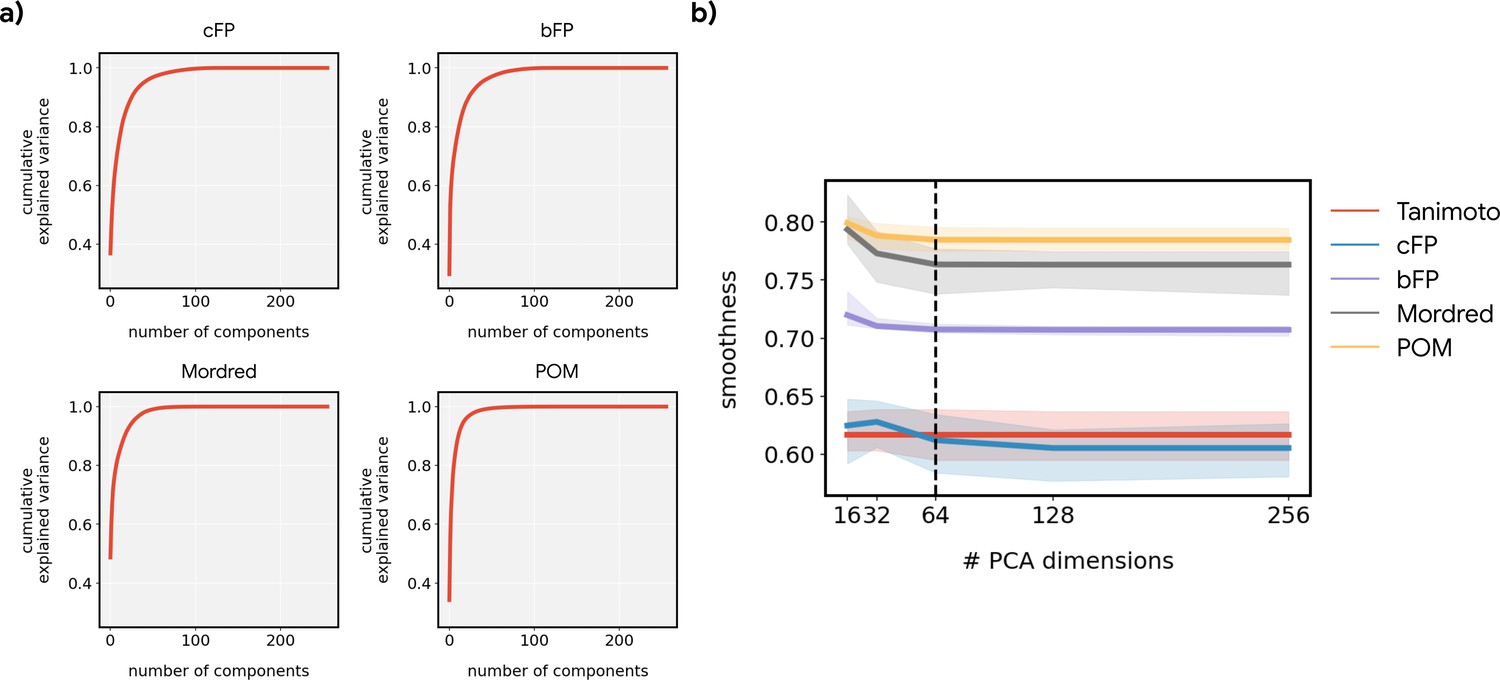
(a) Cumulative explained variance as a function of the number of principal components for different featurizations. The inherent dimensionality of POM is lower than the alternatives. (b) The smoothness metric reported in Figure 3d, as a function of the number of principal components retained. The dashed line (64 components) reflects the value used in Figure 3d. Reducing the dimensionality to a common value was necessary to avoid over-penalizing higher-dimensional feature spaces (e.g. bit-based fingerprint [bFP], count-based fingerprint [cFP] and Mordred).
Figure 3—figure supplement 2
Smoothness of individual metabolite triplets.
The metabolite triplets analyzed in Figure 3d are shown here in detail; each circle represents the smoothness of one triplet (e.g. A->B->D or A->C->D). Most triplets are smoother for principal odor map (POM) than for alternative representations (i.e. circles are above the dashed line). The smoothness across all triplets is significantly higher for POM than for each of the alternatives (paired t-test; p-value shown in each panel).
Figure 4 with 1 supplement
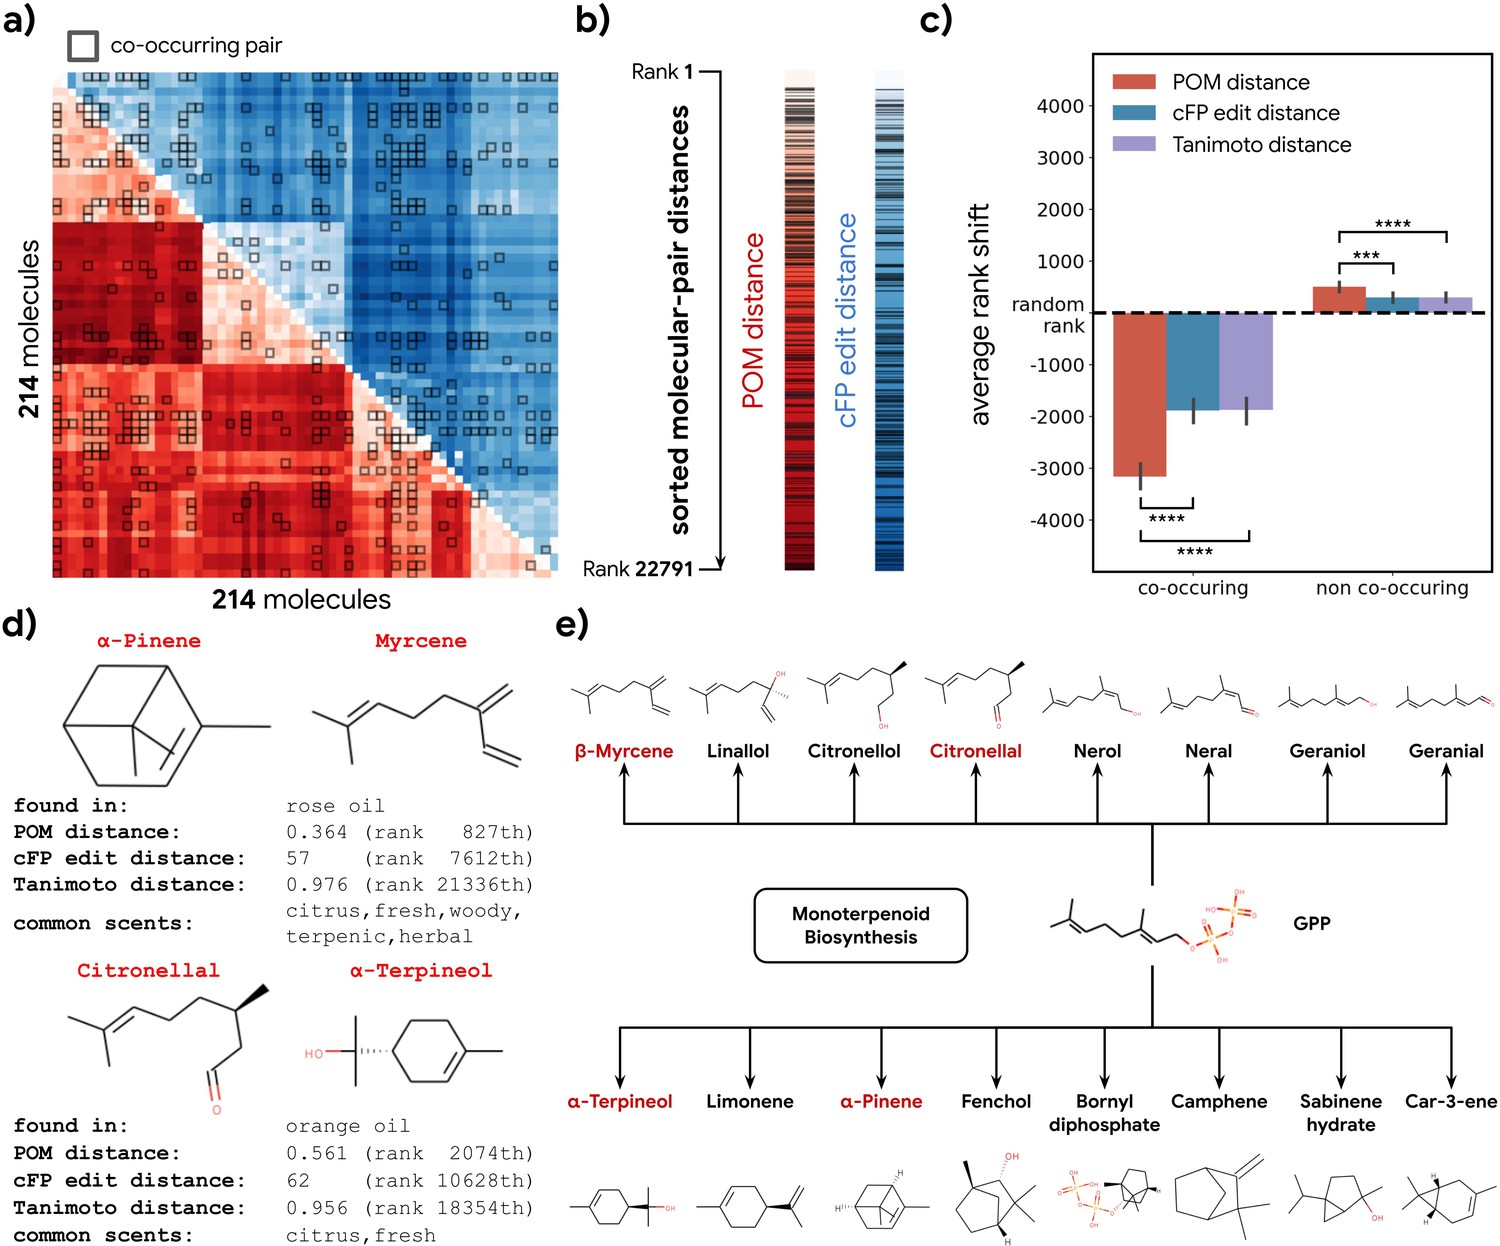
Co-occurrence of odorous molecules in natural substances is explained by the principal odor map (POM).
(a) We compiled a dataset of 214 molecules found in 303 essential oils and computed their pairwise POM distance (red) and count-based fingerprint (cFP) edit distance (blue), where molecule pairs that co-occur in the same essential oil are indicated by dark boxes. (b) To make POM and cFP edit distance comparable, we sort both POM and cFP edit distances for all 22,791 molecular pairs in the dataset from small to large and mark co-occurring pairs with dark lines; we then (c) plot the average shift in distance rank (relative to a random pair) for co-occurring (left) and non-co-occurring (right) molecule pairs under POM distance (red), cFP edit distance (blue), and Tanimoto distance (purple). As expected, the co-occurring pairs have a smaller rank (nearer together), and non-co-occurring pairs have a higher rank (further apart). More importantly, this rank shift for co-occurring molecules is ~2× larger in POM than for structures distance (paired t-test, p<0.0001) and reversed for non-co-occurring pairs (paired t-test, p<0.001). Error bar indicates the 95% CI. (d) Two example pairs of co-occurring molecules that POM successfully recognizes as closely related while conventional structure-based distance fails. Common odor labels for the two molecules as predicted by a state-of-the-art model (Sanchez-Lengeling et al., 2019). (e) The terpenoid biosynthesis pathway shows that these molecule pairs (red) are close downstream metabolic products of geranyl diphosphate (Kanehisa et al., 2021), explaining both their co-occurrence and their proximity in the POM despite their dissimilar structures.
Figure 4—figure supplement 1
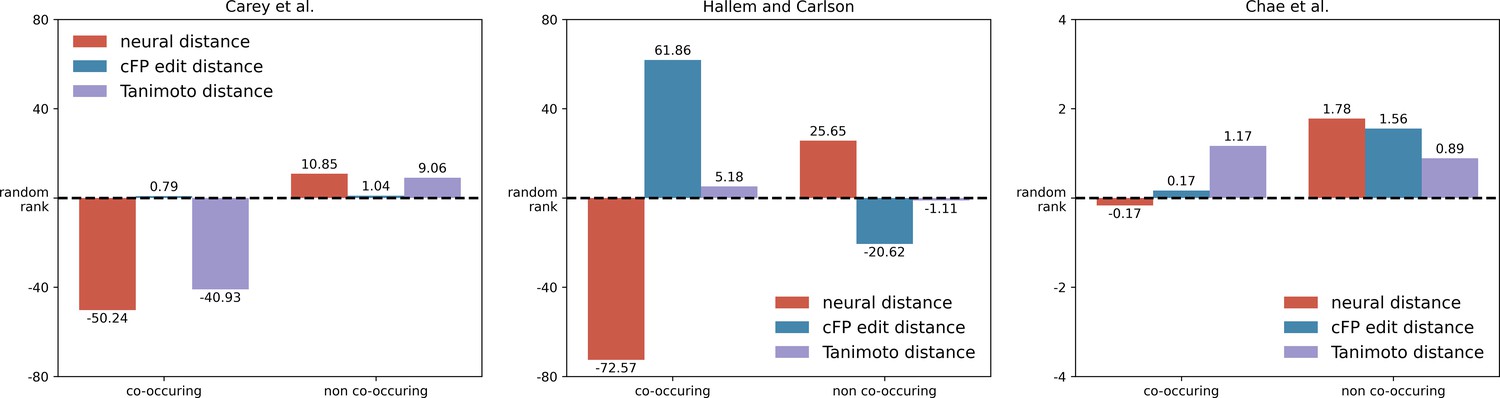
Co-occurring molecules in essential oils also show a smaller neural response distance in insects and mice.
In Figure 4c, we show that co-occurring pairs of molecules in essential oils show a smaller distance in principal odor map (POM) compared to non-co-occurring pairs. Here, we plot a similar figure using experimental data for mice and insect neural responses and observe a similar trend: co-occurring pairs of molecules activate animal olfactory systems in a more similar way than do non-co-occurring pairs (Student’s t-test; p<0.0005 for Carey et al.; p<0.0005 for Hallem and Carlson; n.s. for Chae et al. for which only 15 pairs of molecules overlapped with the essential oils dataset). In order to calculate the neural distance for a pair of molecules, we computed the correlation distances between their olfactory receptor neuron (ORN) activities or glomerular responses (described in Methods). In order to compare distances involving different units, we convert distances into ranks and then compared these ranks across co-occurring pairs and non-occurring pairs.
Author response image 1
Additional files
Download links
A two-part list of links to download the article, or parts of the article, in various formats.
Downloads (link to download the article as PDF)
Open citations (links to open the citations from this article in various online reference manager services)
Cite this article (links to download the citations from this article in formats compatible with various reference manager tools)
Metabolic activity organizes olfactory representations
eLife 12:e82502.
https://doi.org/10.7554/eLife.82502


