Exploring therapeutic strategies for infantile neuronal axonal dystrophy (INAD/PARK14)
- Department of Molecular and Human Genetics, Baylor College of Medicine, United States
- Jan and Dan Duncan Neurological Research Institute, Texas Children’s Hospital, United States
- New York Stem Cell Foundation Research Institute, United States
- INADcure Foundation, United States
- Department of Laboratory Medicine and Pathology, Mayo Clinic, United States
- Manipal Academy of Higher Education, Manipal, India
- Department of Neuroscience, Baylor College of Medicine, United States
Figures
Figure 1 with 3 supplements
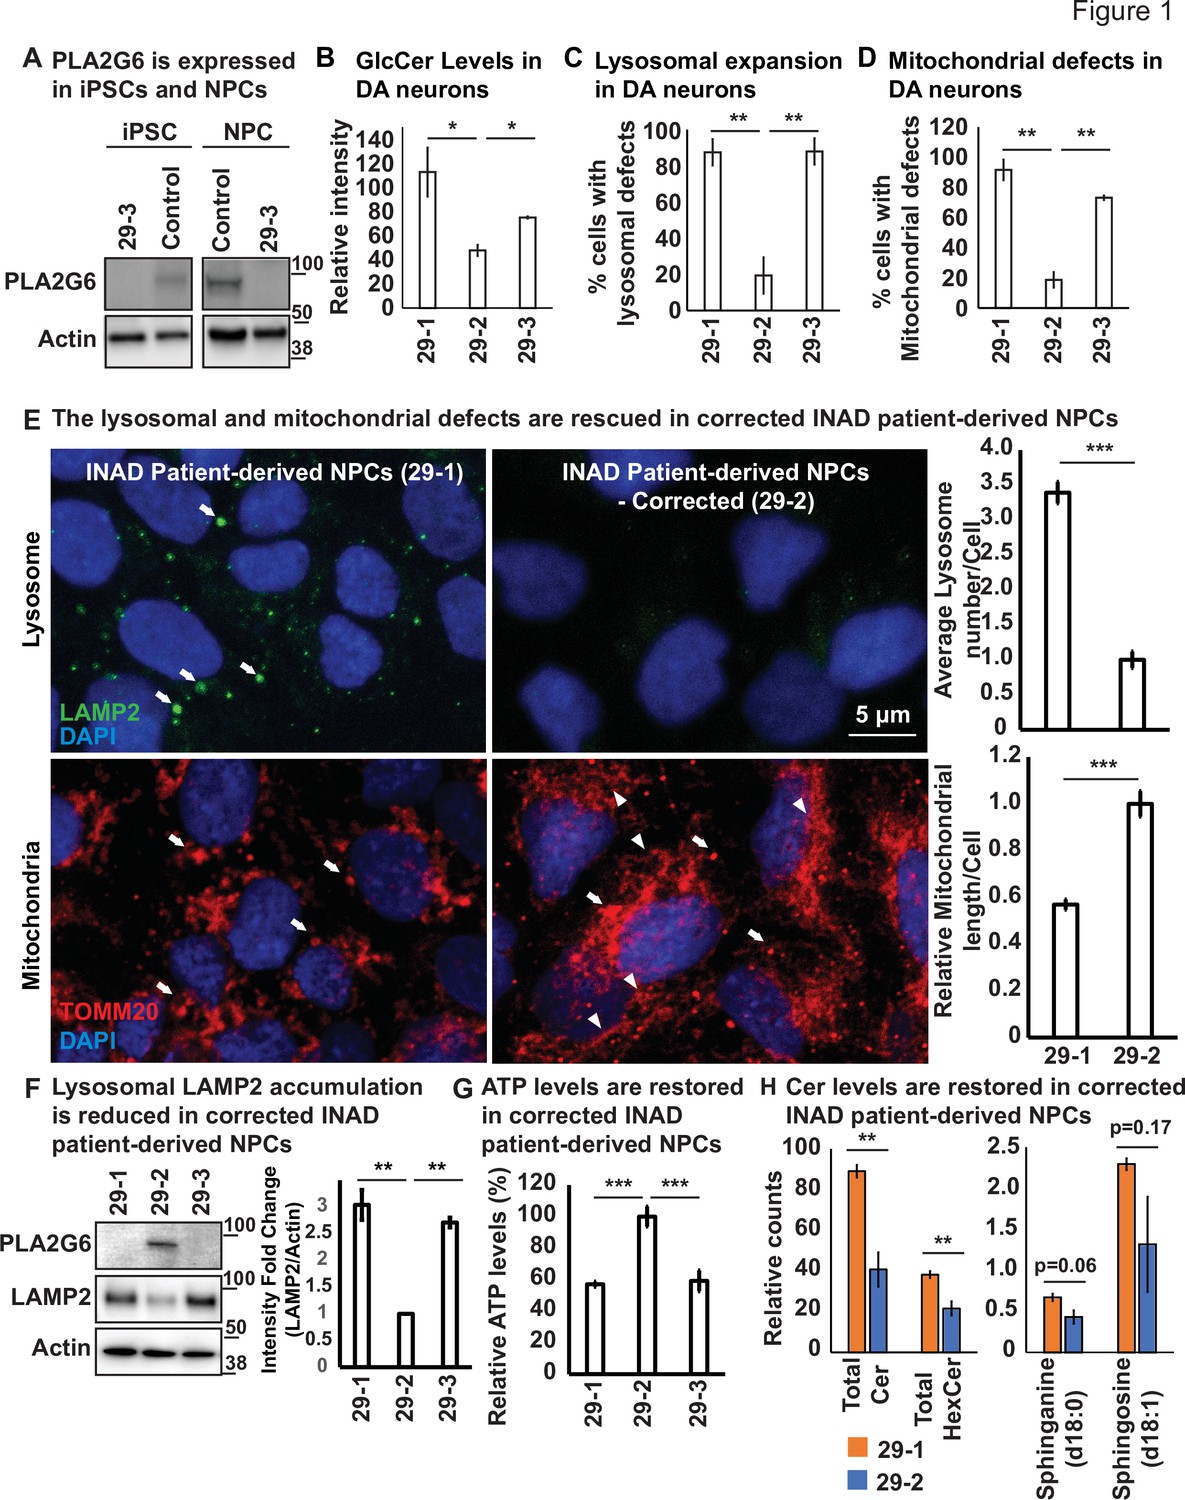
Ceramide accumulation, lysosomal expansion, and mitochondrial defects in INAD patient-derived NPCs and DA neurons.
(A) PLA2G6 is expressed in iPSCs and NPCs using the sc-376563 antibody. The control iPSCs and NPCs were generated by reprograming a fibroblast line from a healthy person (GM23815; Coriell Institute). The 29-3 iPSCs and NPCs were generated from lymphoblasts from an INAD patient in Family 2 (Figure 1—figure supplement 1D). Actin was used as a loading control. (B) GlcCer levels in DA neurons (images in Figure 1—figure supplement 3C) (n=8). (C) Lysosomal expansion in DA neurons (images in Figure 1—figure supplement 3C) (n=8–9). (D) Cells with mitochondrial defects (images in Figure 1—figure supplement 3C) (n=6–8). (E) The lysosomal and mitochondrial defects are rescued in edited INAD patient-derived NPCs. Immunofluorescence staining of the indicated INAD patient-derived NPCs. LAMP2 antibody (green; arrows) and TOMM20 antibody (red) were used to label lysosomes and mitochondria, respectively. DAPI (blue) labels cell nuclei. Scale bar=5 µm. The quantifications of the average lysosome number per cell (n=10) and the relative mitochondrial length per cell (n=10) are presented next to the images. (F) Lysosomal LAMP2 accumulation is reduced in edited INAD patient-derived NPCs. PLA2G6 antibody was used to detect the endogenous PLA2G6 in the indicated cellular lysates. LAMP2 antibody was used to assess lysosomal accumulation. Actin was used as a loading control. The intensity of the LAMP2/Actin is quantified at the right (n=3). (G) ATP levels are restored in edited INAD patient-derived NPCs. The relative amount of ATP are quantified in the indicated NPC lines (n=3). (H) Ceramide levels are reduced in the edited INAD patient-derived NPCs. The levels of the indicated ceramide and its derivatives are measured by lipidomic assays (n=3). Representative images are shown in this figure. Error bars represent SEM; *p<0.05; **p<0.01; ***p<0.001. INAD, infantile neuroaxonal dystrophy; NPC, neural progenitor cell.
-
Figure 1—source data 1
PLA2G6 is expressed in iPSCs and NPCs.
- https://cdn.elifesciences.org/articles/82555/elife-82555-fig1-data1-v3.pdf
-
Figure 1—source data 2
The lysosomal defects are rescued in edited INAD patient-derived NPCs.
- https://cdn.elifesciences.org/articles/82555/elife-82555-fig1-data2-v3.pdf
-
Figure 1—source data 3
Lipidomic assay of INAD patient derived NPCs.
- https://cdn.elifesciences.org/articles/82555/elife-82555-fig1-data3-v3.xlsx
-
Figure 1—source data 4
Raw gel images for Figure 1.
- https://cdn.elifesciences.org/articles/82555/elife-82555-fig1-data4-v3.zip
Figure 1—figure supplement 1
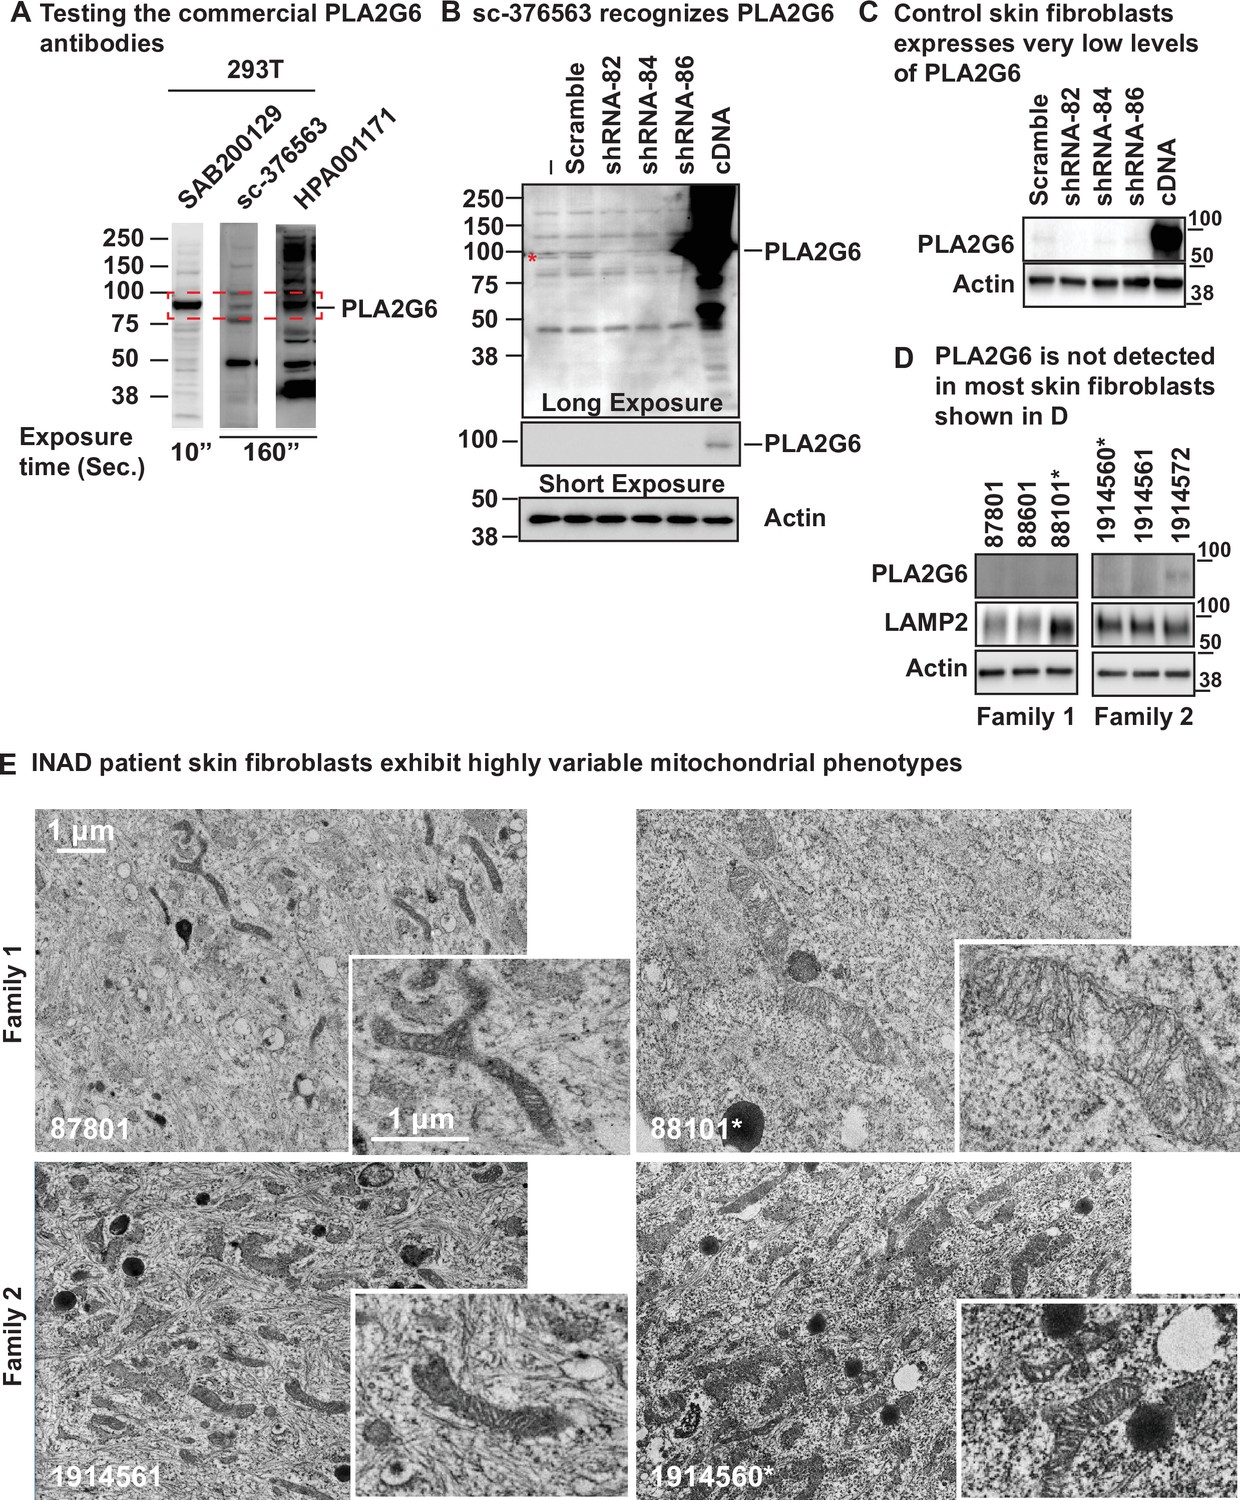
Human skin fibroblasts express no or very low levels of PLA2G6 and exhibit highly variable phenotypes.
(A) Identification of commercially available PLA2G6 antibodies that specifically recognize endogenous levels of PLA2G6 in HEK-293T cellular lysate. The SAB200129 antibody recognizes a major band at the predicted molecular weight (85/88 kDa) of PLA2G6. The sc-376563 antibody detects five major bands with one band at ~85/88 kDa. HPA001171 detects many bands at similar intensity, hence is not a proper antibody to be used. (B, C) sc-376563 specifically recognizes endogenous PLA2G6 in HEK-293T cells (B) and a control skin fibroblast line (C). The 85/88 kDa (the predicted molecular weight of PLA2G6) band detected by sc-376563 is significantly reduced upon PLA2G6 shRNA treatments, whereas the single band detected by SAB200129 does not. (D) PLA2G6 is not expressed in most skin fibroblasts shown in (Figure 1—figure supplement 1—source data 1). The experiments were conducted in blind of genotype. sc-376563 antibody was used to label PLA2G6. LAMP2 antibody was used to assess lysosomal accumulation. Actin was used as a loading control. (E) INAD patient skin fibroblasts exhibit highly variable mitochondrial phenotypes. Representative images are shown in this figure. Scale bar=1 µm.
-
Figure 1—figure supplement 1—source data 1
INAD patient skin fibroblast lines used in this study.
- https://cdn.elifesciences.org/articles/82555/elife-82555-fig1-figsupp1-data1-v3.xlsx
-
Figure 1—figure supplement 1—source data 2
Raw gel images for Figure 1—figure supplement 1.
- https://cdn.elifesciences.org/articles/82555/elife-82555-fig1-figsupp1-data2-v3.zip
-
Figure 1—figure supplement 1—source data 3
Skin fibroblasts derived from INAD patients exhibit highly variable phenotypes.
- https://cdn.elifesciences.org/articles/82555/elife-82555-fig1-figsupp1-data3-v3.pdf
Figure 1—figure supplement 2
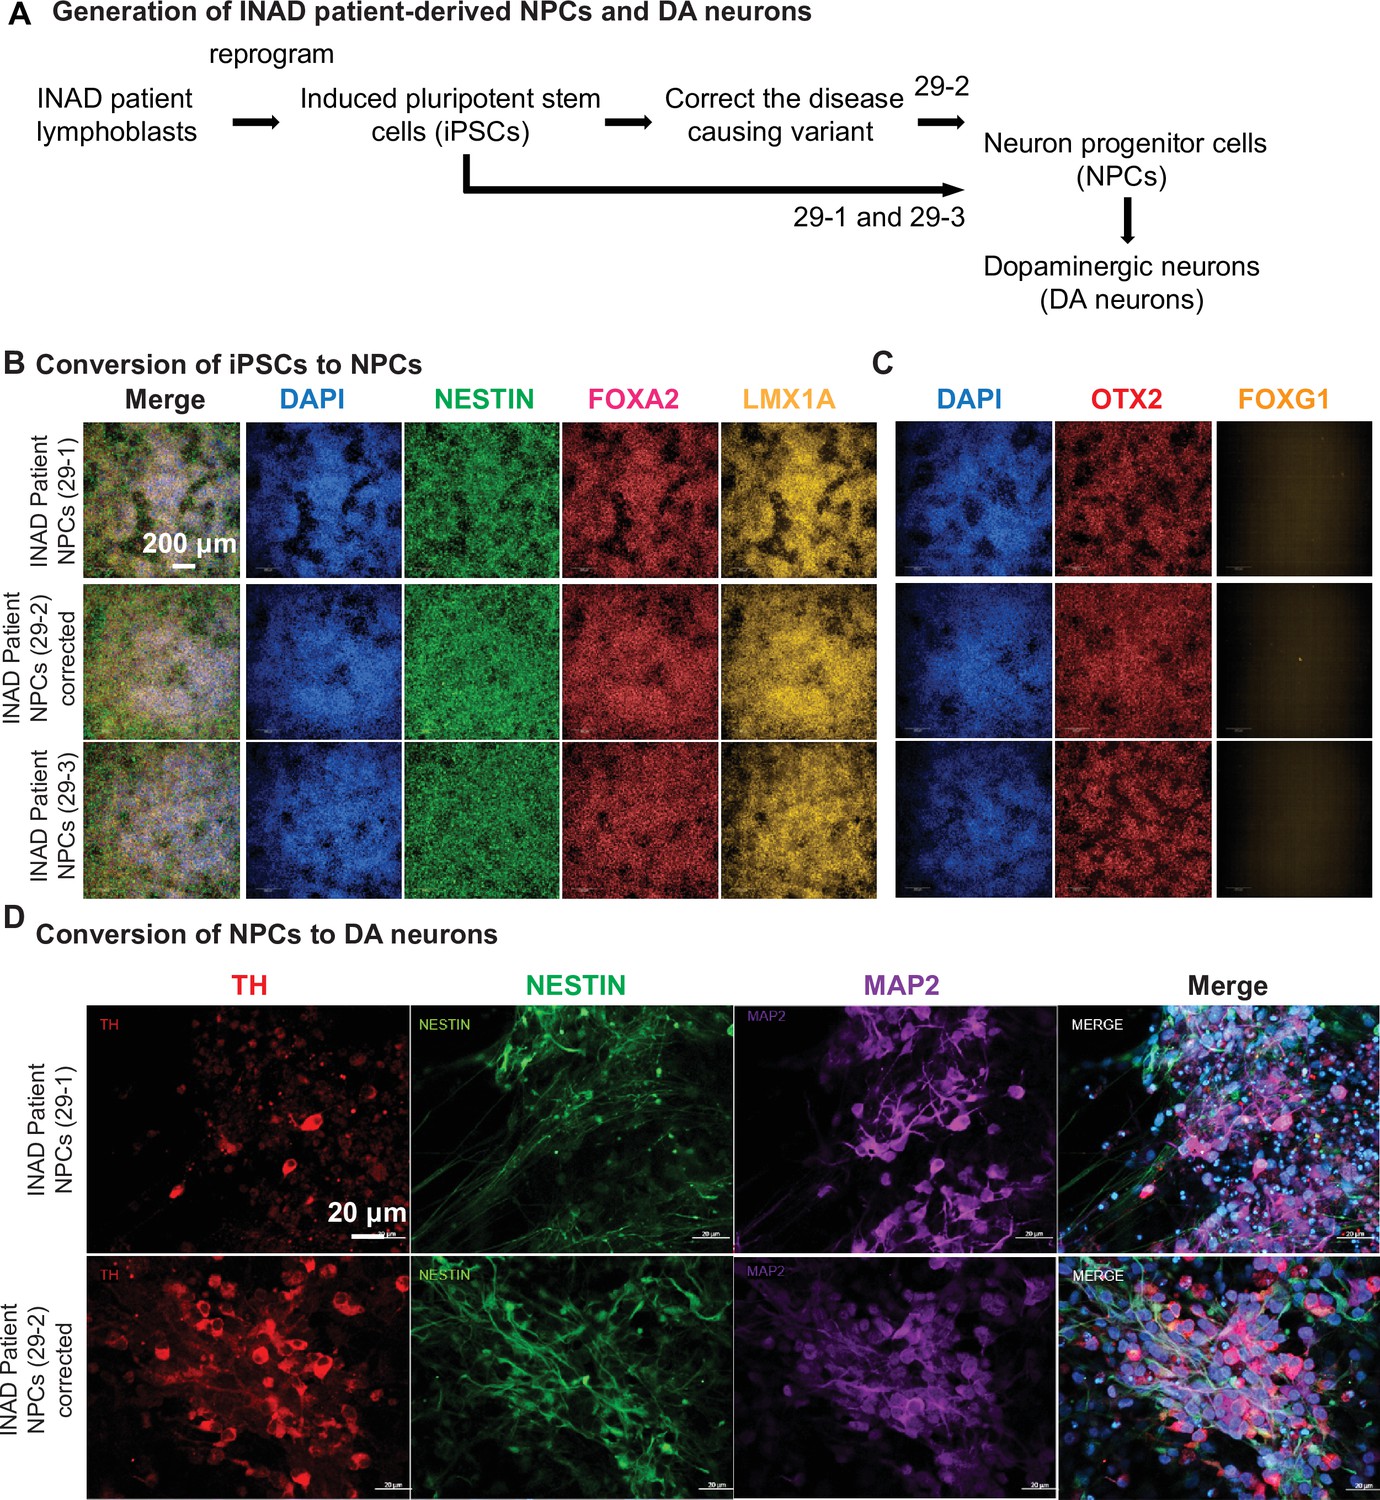
Generation and quality control of INAD patient-derived NPCs and DA neurons.
(A) Generation of INAD patient-derived NPCs and DA neurons. (B–D) Patient and isogenic control lines differentiate into comparable ventral midbrain floor plate neuron progenitor cells. (B, C) Day 22 cultures from an INAD patient-derived PLA2G6 mutant iPSC clone 29-1, isogenic PLA2G6 corrected iPSC clone 29-2 (derived from 29-1), and INAD patient-derived PLA2G6 mutant iPSC clone 29-3. (B) Uniformly express pan NPC intermediate filament marker NESTIN (green), nuclear (DAPI, blue), floor plate markers FOXA2 (red), and vM FP marker LMX1A. Scale bar = 200 µm (C) Sister wells show nuclei (DAPI, blue), uniformly express rostral-to-midbrain marker OTX2 (red) and do not express forebrain marker FOXG1 (yellow). 3×3 montage of representative randomly sampled 10× Phenix confocal fields. (D) The differentiated DA neurons are TH (red), NESTIN (green), and MAP2 (purple) positive. Representative images are shown in this figure. Scale bars = 20 µm. DA, dopaminergic; INAD, infantile neuroaxonal dystrophy; NPC, neural progenitor cell.
Figure 1—figure supplement 3
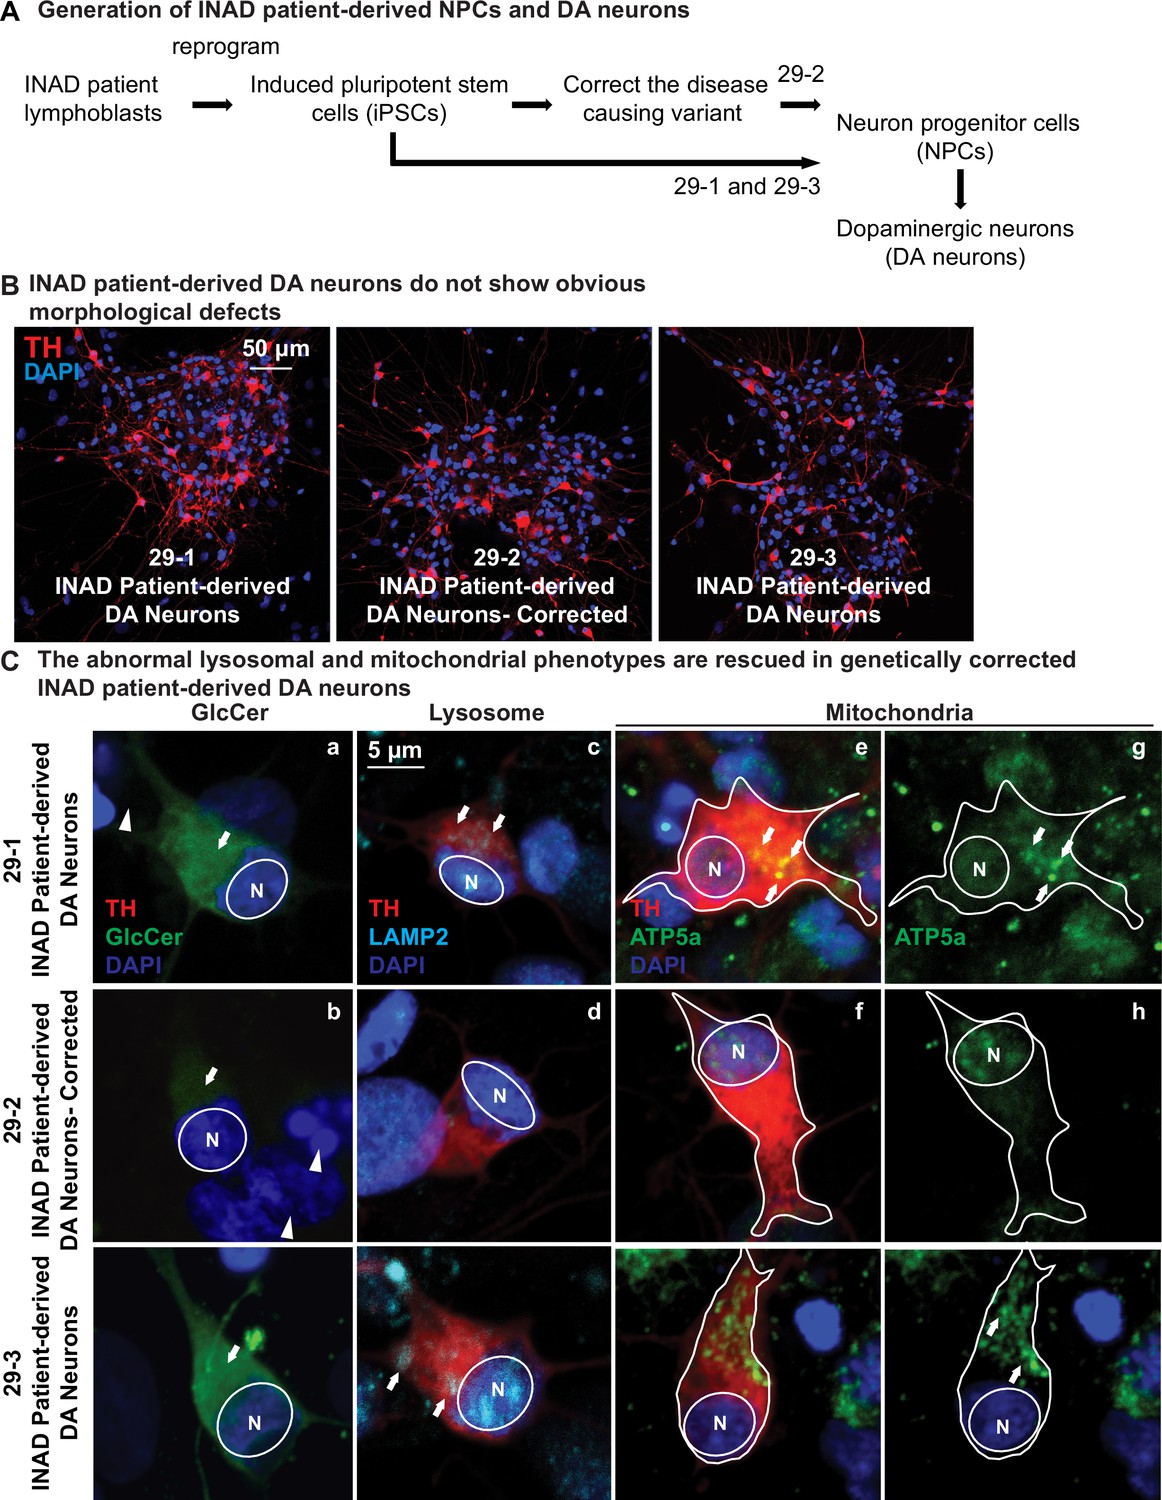
Ceramide accumulation, lysosomal expansion, and mitochondrial defects in INAD patient-derived DA neurons.
(A) Flow chart of generating INAD patient-derived NPCs and DA neurons from lymphoblasts. (B) INAD patient-derived DA neurons do not show obvious morphological defects. TH (Tyrosine Hydroxylase, red) antibody labels DA neurons. DAPI (blue) labels cell nuclei. Scale bar=50 µm. (B) The abnormal lysosomal and mitochondrial phenotypes are suppressed in genetically corrected INAD patient-derived DA neurons. GlcCer antibody (green; arrow in a and b), LAMP2 antibody (Cyan; arrows in c and d), and ATP5a antibody (green; arrows in e–h) were used to label GlcCer, lysosomes, and mitochondria, respectively. Arrowheads indicate the undifferentiated NPCs. Representative images are shown in this figure. Scale bar=5 µm. DA, dopaminergic; INAD, infantile neuroaxonal dystrophy; NPC, neural progenitor cell.
Figure 2 with 1 supplement
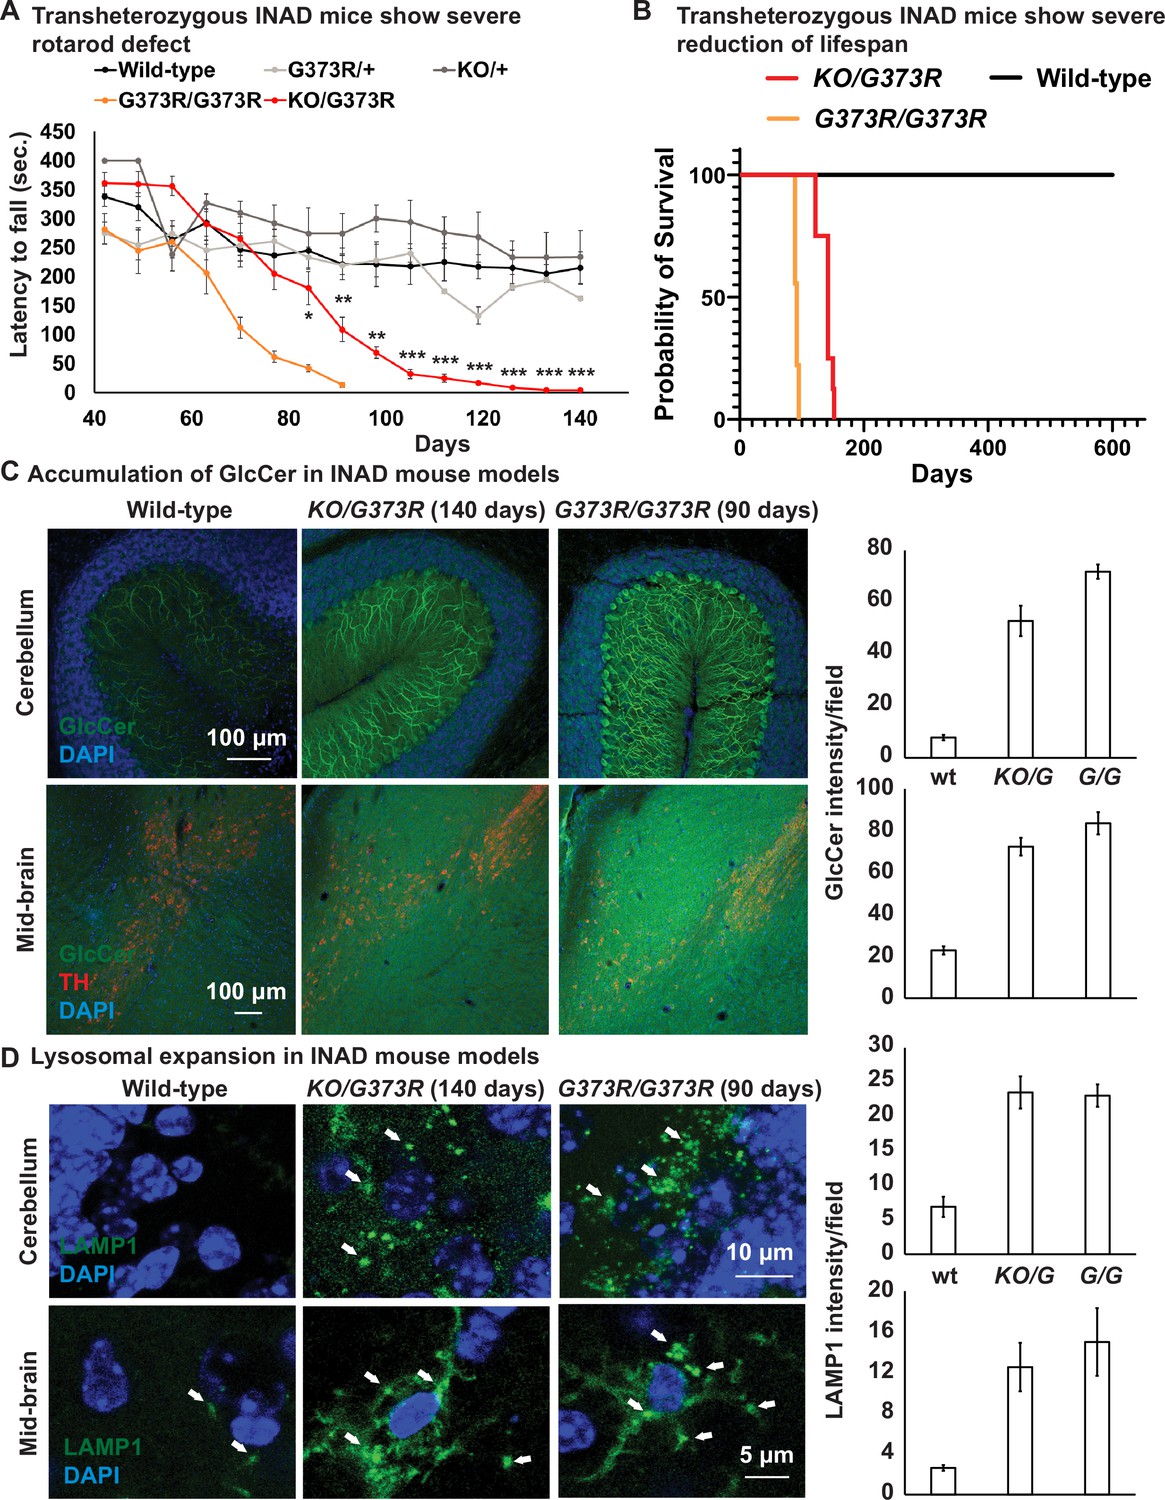
Ceramide accumulation, lysosomal expansion, and mitochondrial defects in mouse models of INAD.
(A) Both Pla2g6G373R/G373R and Pla2g6KO/G373R mice show severe rotarod defect. Rotarod performance of mice with the indicated genotypes was measured weekly. Wild-type (n=6); Pla2g6+/G373R (n=10); Pla2g6G373R/G373R (n=7); Pla2g6KO/+ (n=4); and Pla2g6KO/G373R (n=7). Error bars represent SEM. (B) Pla2g6G373R/G373R and Pla2g6KO/G373R mice fantile neuroaxonal dystrophy. A disease characterized by altered terminal axons and synaptic enshow a severe reduction of lifespan. Wild-type (n=6); Pla2g6G373R/G373R (n=9); and Pla2g6KO/G373R (n=8). (C) Accumulation of GlcCer in PLA2G6KO/G373R and PLA2G6G373R/G373R mice. Immunofluorescent staining of mouse cerebella and midbrain regions of the indicated genotypes. GlcCer antibody (green) was used to assess the levels of GlcCer. TH (Tyrosine Hydroxylase, red) antibody labels DA neurons in the midbrain region. Scale bar=100 µm. All assays were conducted in blind of genotypes and treatments. (D) Lysosomal expansion in INAD in Pla2g6KO/G373R and Pla2g6G373R/G373R mice. Immunofluorescent staining of mouse cerebella and midbrain regions of the indicated genotypes. LAMP1 antibody (green; arrows) labels lysosomes. DAPI (blue) labels nuclei. Representative images are shown in this figure. Quantifications are next to the images (n=3). Scale bar=10 µm (cerebellum) or 5 µm (midbrain). DA, dopaminergic; INAD, infantile neuroaxonal dystrophy.
-
Figure 2—source data 1
Lipidomic assay of the cerebellum of INAD mice.
- https://cdn.elifesciences.org/articles/82555/elife-82555-fig2-data1-v3.xlsx
Figure 2—figure supplement 1
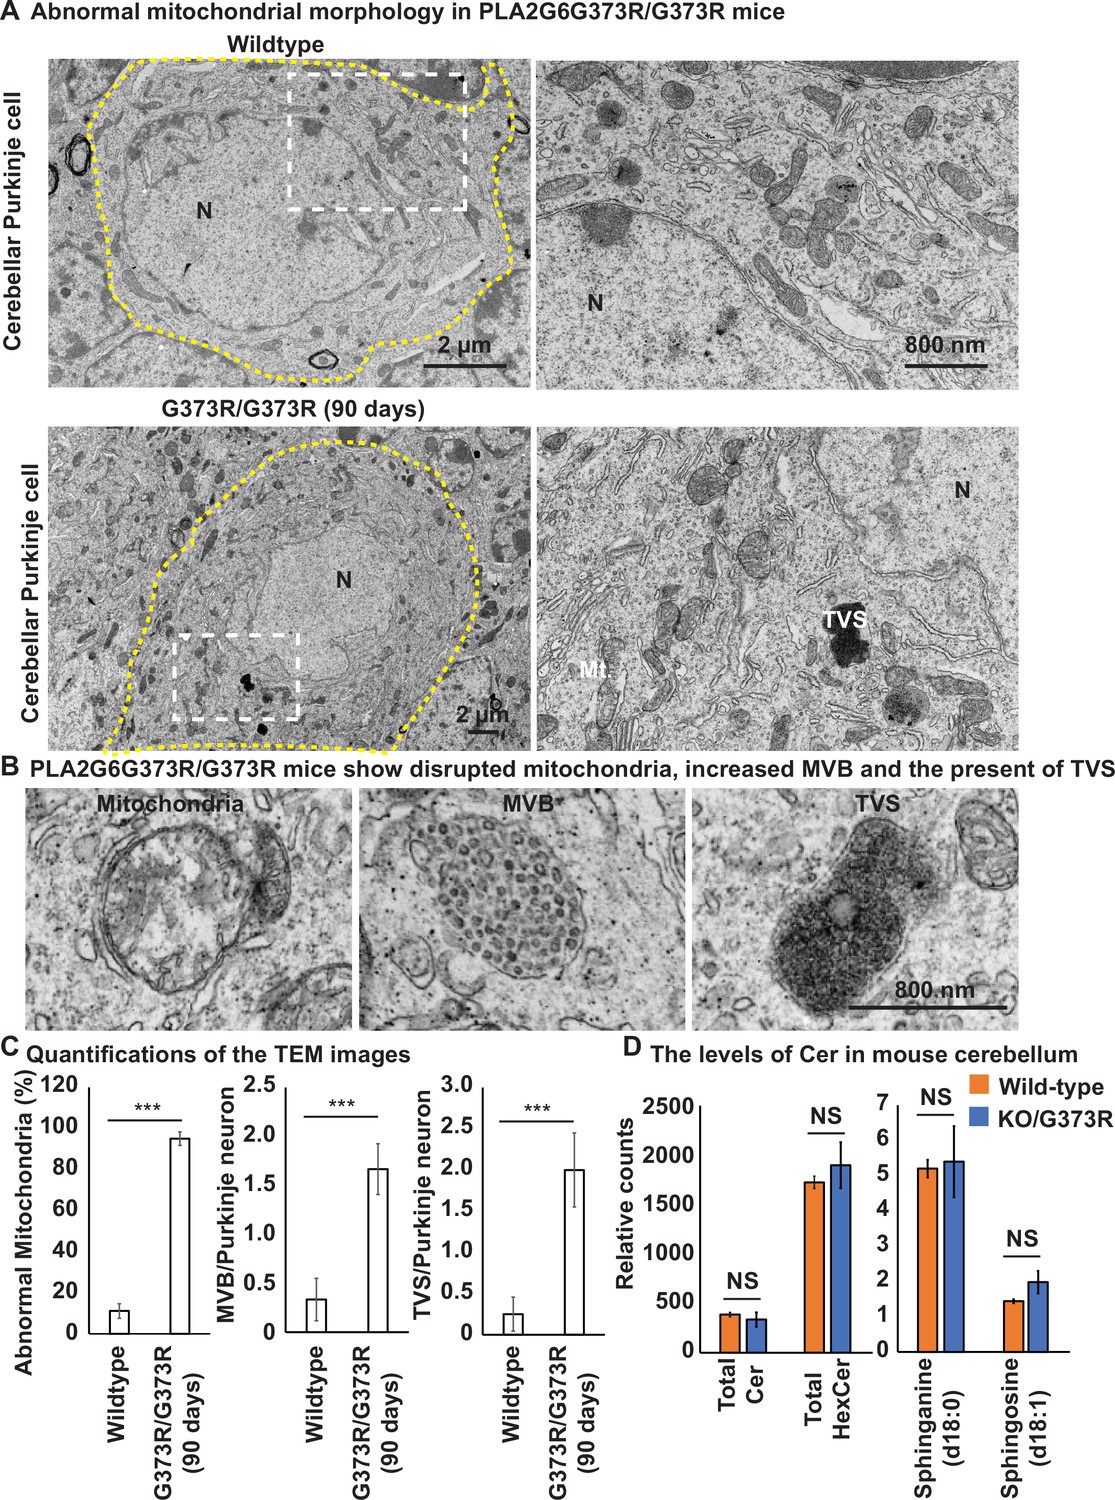
Pla2g6G373R/G373R mice show disrupted mitochondria, and increased MVB and TVS in Purkinje neurons.
(A) Abnormal mitochondrial morphology in Purkinje cells of Pla2g6G373R/G373R mice. The yellow dotted line circles a representative Purkinje cell. Scale bar=2 µm. The boxed regions are enlarged at right. Scale bar=800 nm. Mt, mitochondria; N, nuclei; TVS, tubulovesicular structure. (B) Pla2g6G373R/G373R mice show disrupted mitochondria and increased MVB and TVS. (C) The quantification of the disrupted mitochondria, number of MVB or TVS in the Purkinje cells of Pla2g6G373R/G373R mice. (D) The levels of the indicated ceramides in the cerebellum of KO/G373R mice (n=3). Representative images are shown in this figure. Error bars represent SEM. ***p<0.001; NS, not significant.
Figure 3 with 1 supplement
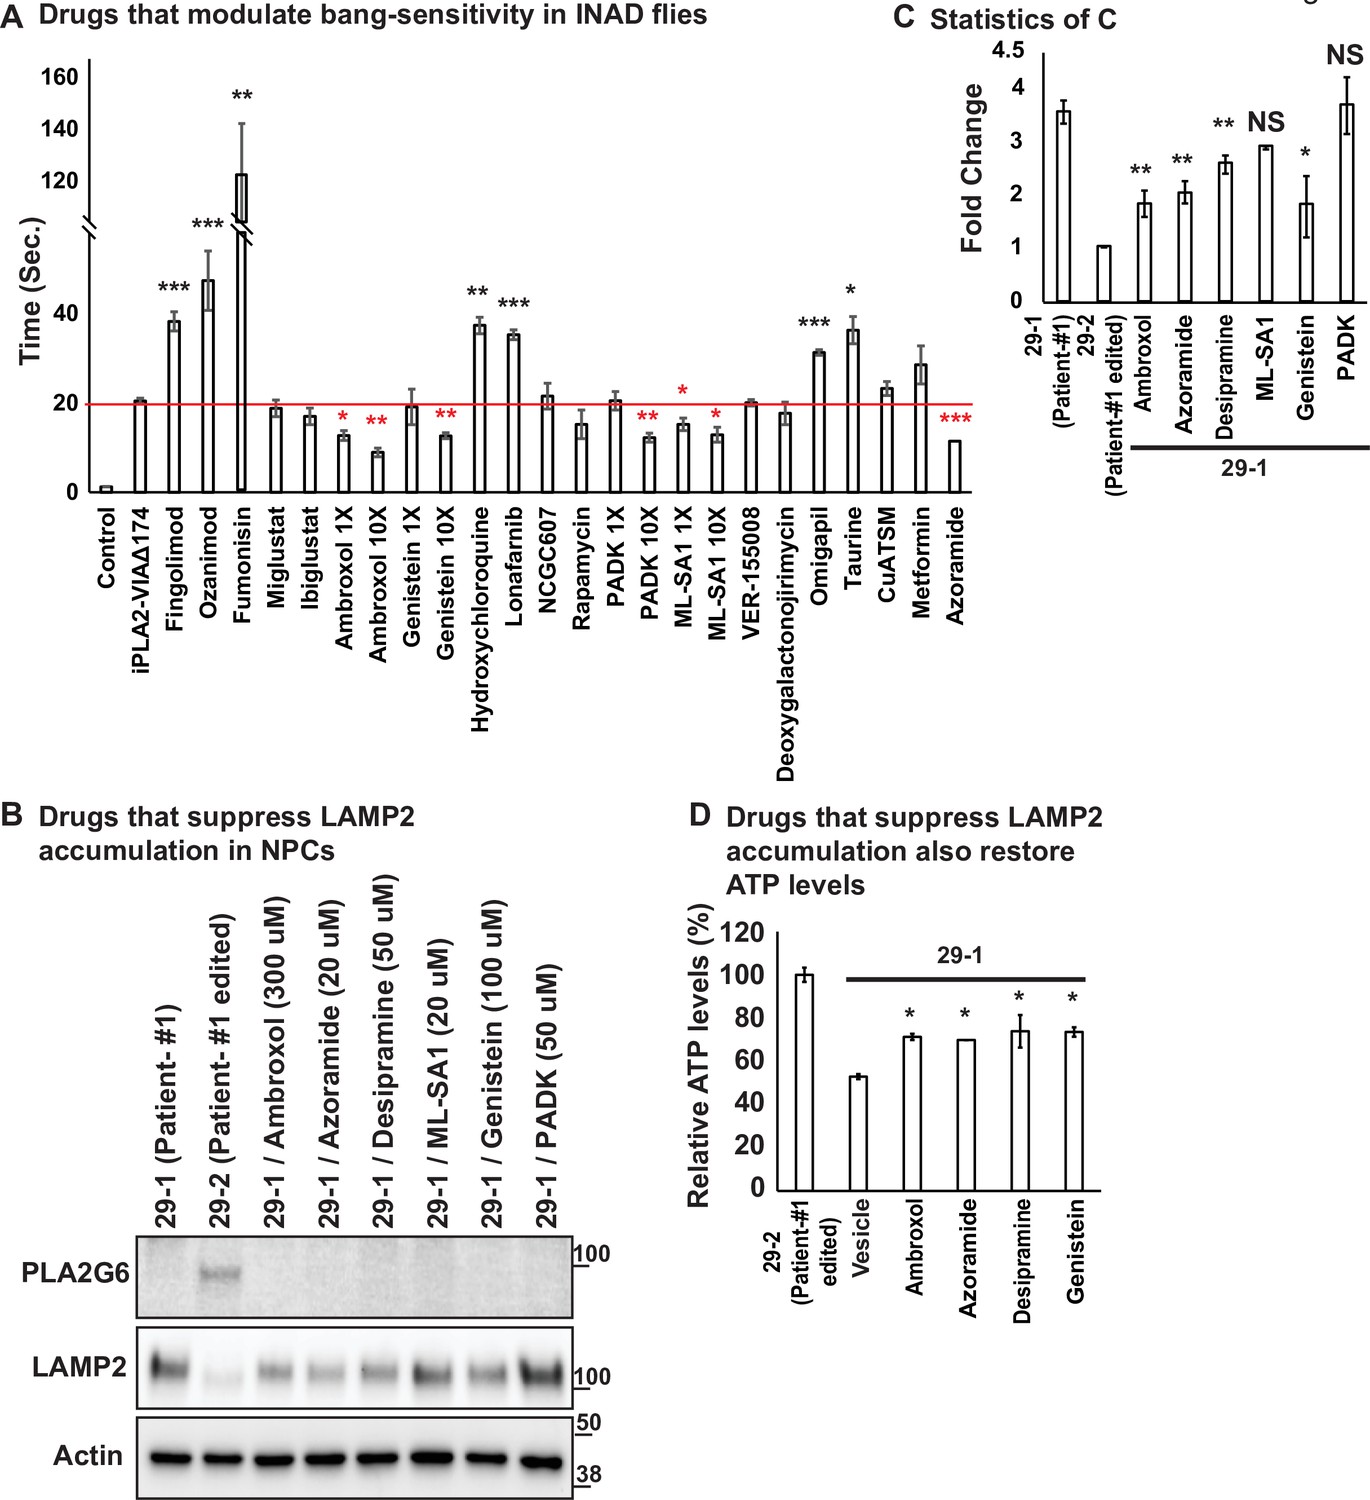
Ambroxol, Azoramide, Desipramine, and Genistein alleviate neurodegenerative phenotypes in INAD flies and patient-derived NPCs.
(A) Bang-sensitivity was used as a primary readout to select drugs that suppress neurodegeneration. Bang-sensitivity of control or INAD flies fed with the indicated drugs. Error bars represent SEM (n=3; 20 flies per assay). Redline highlights the time required for INAD flies to recover from bang-induced paralysis. Red ‘*‘ indicates drugs that significantly suppress bang-sensitivity. Black ‘*‘ indicates drugs that significantly promote bang-sensitivity (the p values were calculated between iPLA2-VIA∆174 and the indicated treatment). (B) Using INAD patient-derived NPCs to select drugs that suppress LAMP2 accumulation. PLA2G6 antibody was used to detect the endogenous PLA2G6 in the indicated cellular lysates. The intensity of the LAMP2/Actin is quantified at (C) (n=3). (D) Drugs that suppress LAMP2 accumulation also restore ATP levels. The relative amounts of ATP are measured in the indicated NPC lines with or without the treatment of the selected drugs (n=3). Error bars represent SEM; *p<0.05; **p<0.01; ***p<0.001; NS, not significant (the p values were calculated between the untreated patient NPCs (29-1) and the indicated treatment). References in Figure 3A: (Aflaki et al., 2016; Agostini et al., 2021; Alfonso et al., 2005; Desai et al., 2002; Fu et al., 2015; Hernandez et al., 2019; Hung et al., 2012; Hwang et al., 2019; Ke et al., 2020; Khanna et al., 2010; Liu et al., 2008; Magalhaes et al., 2018; Mauthe et al., 2018; Mistry et al., 2018; Moskot et al., 2014; Olanow et al., 2006; Rosen and Liao, 2003; Scott et al., 2016; Shen et al., 2012; Wang et al., 2021; Yang and Tohda, 2018; Zhu et al., 2019). INAD, infantile neuroaxonal dystrophy; NPC, neural progenitor cell.
-
Figure 3—source data 1
Ambroxol, Azoramide, Desipramine, or Genistein reduce LAMP2 levels in patient derived NPCs.
- https://cdn.elifesciences.org/articles/82555/elife-82555-fig3-data1-v3.pdf
-
Figure 3—source data 2
Selected drugs tested in an INAD fly model.
- https://cdn.elifesciences.org/articles/82555/elife-82555-fig3-data2-v3.xlsx
-
Figure 3—source data 3
Raw gel images for Figure 3.
- https://cdn.elifesciences.org/articles/82555/elife-82555-fig3-data3-v3.zip
Figure 3—figure supplement 1
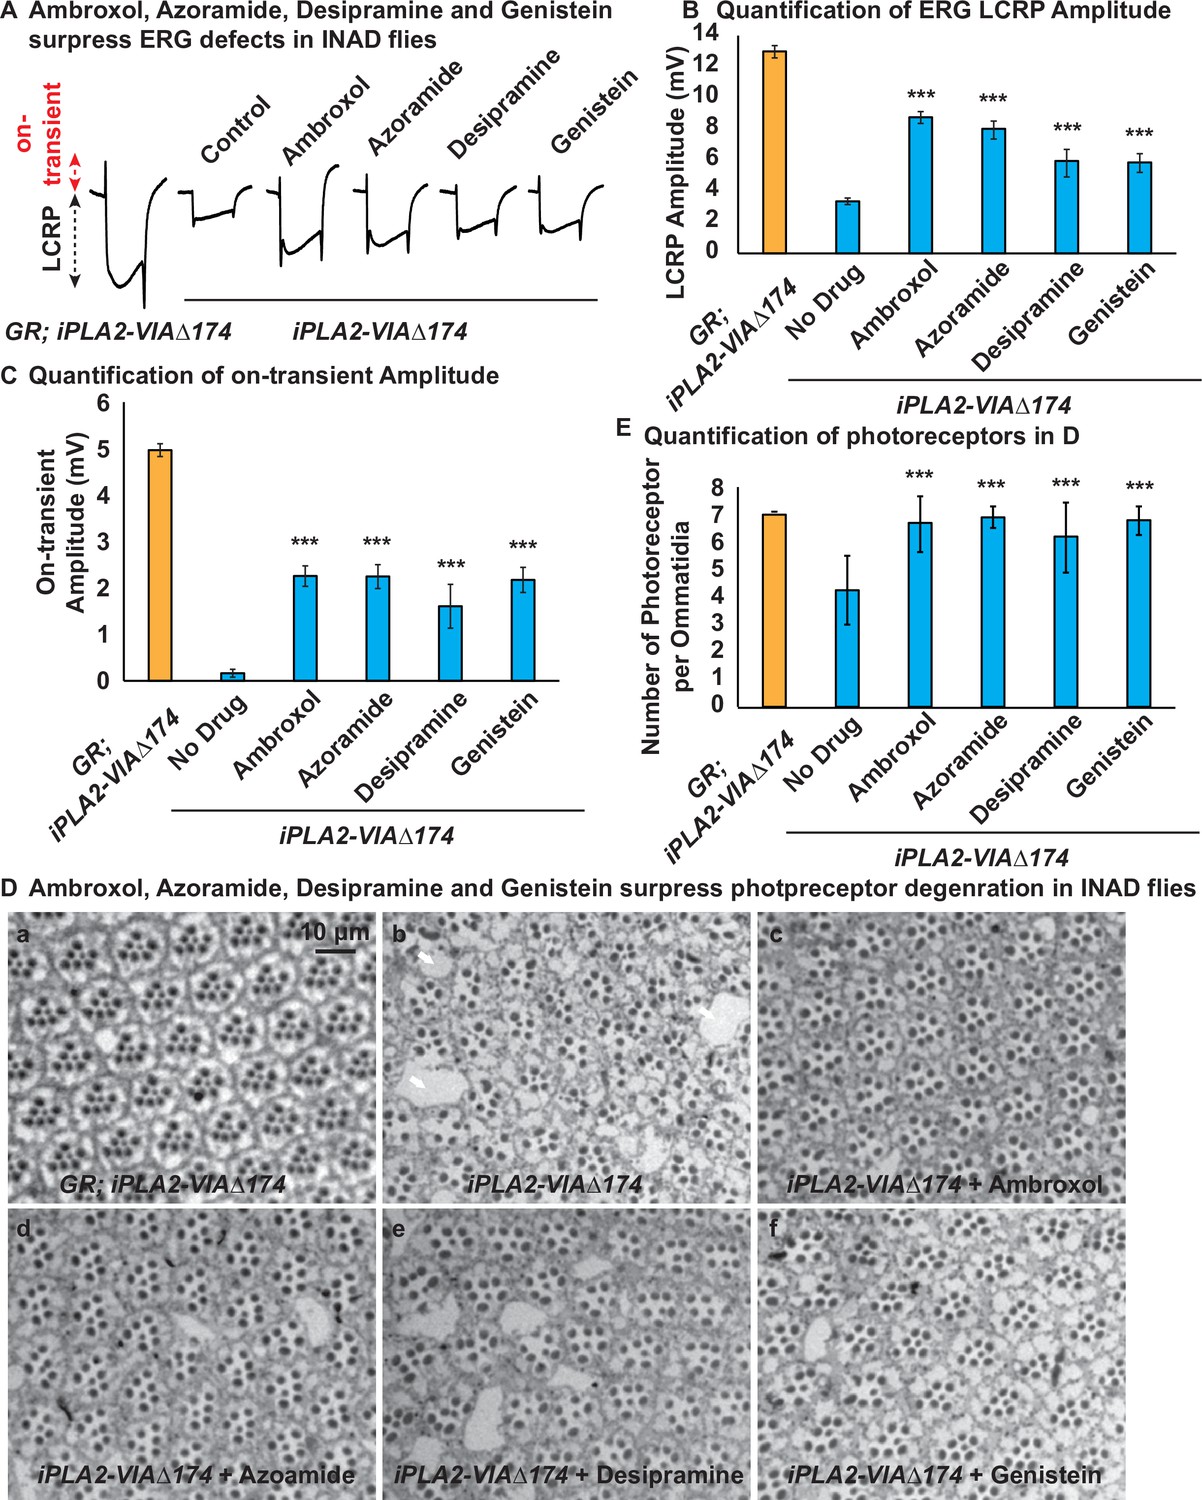
Ambroxol, Azoramide, Desipramine, or Genistein suppress ERG defects and the loss of photoreceptor in INAD flies.
(A) The ERG trace of the indicated genotypes and treatments. iPLA2-VIA∆174: the INAD flies; GR; iPLA2-VIA∆174: genomic rescued INAD flies (control) (Lin et al., 2018). (B) Quantifications of the LCRP amplitudes. (C) Quantifications of the on-transient amplitudes. (D) Ambroxol, Azoramide, Desipramine or Genistein reduce the loss of photoreceptor phenotype in INAD flies. Toluidine blue staining of the ommatidia of the flies with the indicated genotypes and treatment. Arrows indicate vacuoles. The number of photoreceptor per ommatidia is quantified in (E) (n=10). Scale bar=10 µm. Representative images are shown in this figure. Error bars represent SEM; ***p<0.001 (the p values were calculated between the untreated (No Drug) and the indicated column). ERG, electroretinogram; INAD, infantile neuroaxonal dystrophy; LCRP, light coincident receptor potential.
Figure 4 with 1 supplement
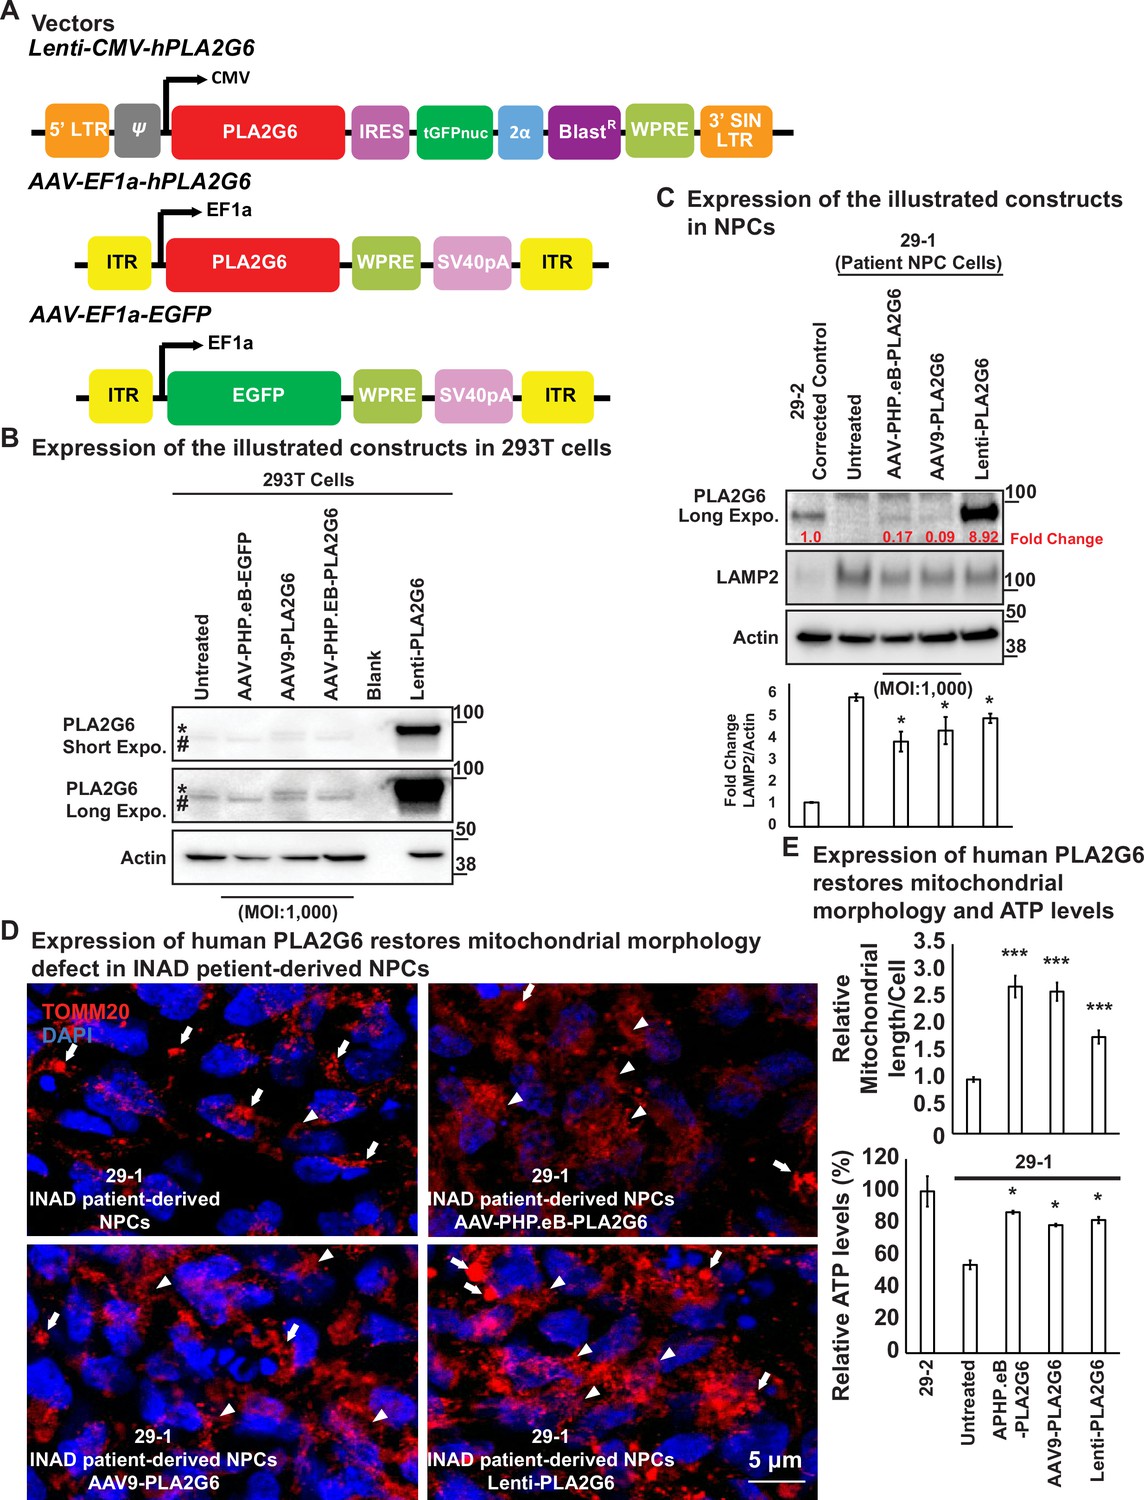
Expression of human PLA2G6 restores lysosomal and mitochondrial morphology defects in INAD patient-derived NPC lines.
(A) Vectors/constructs. (B) Expression levels of the constructs (A) in 293T cells. PLA2G6 antibody was used to detect the endogenous PLA2G6 of cellular lysates. * represents endogenous PLA2G6. # indicates a nonspecific band. All AAV constructs were used to infect 293T cell using a MOI of 1000. The MOI of the Lenti-viral-based construct was not determined. (C) Expression levels of the illustrated constructs (A) in NPCs. AAV constructs were used to infect NPCs at a MOI of 1000. The MOI of the Lenti-viral-based construct was not determined. The intensity of LAMP2/Actin is quantified below (n=3). (D) Expression of human PLA2G6 restores mitochondrial morphology defects in INAD patient-derived NPCs. Arrows indicate the fragmented and enlarged mitochondria. Arrowheads indicate the normal elongated network of mitochondria. (E) Expression of human PLA2G6 restores mitochondrial morphology and ATP levels. The length of the mitochondria in (D) is quantified in (E) (n=10; upper panel). The ATP levels are measure in the lower panel (n=3). Representative images are shown in this figure. Error bars represent SEM; *p<0.05; ***p<0.001 (the p values were calculated between the untreated patient NPCs (29-1) and the indicated treatment). INAD, infantile neuroaxonal dystrophy; MOI, multiplicity of infection; NPC, neural progenitor cell.
-
Figure 4—source data 1
Expression of human PLA2G6 in INAD patient derived NPCs.
- https://cdn.elifesciences.org/articles/82555/elife-82555-fig4-data1-v3.pdf
-
Figure 4—source data 2
Expression of human PLA2G6 restores lysosomal defects in INAD patient-derived NPCs.
- https://cdn.elifesciences.org/articles/82555/elife-82555-fig4-data2-v3.pdf
-
Figure 4—source data 3
Raw gel images for Figure 4.
- https://cdn.elifesciences.org/articles/82555/elife-82555-fig4-data3-v3.zip
Figure 4—figure supplement 1

Expression of EGFP in the indicated sites/tissues in AAV-EF1a-EGFP injected (ICV and IV at P40) (Left) or uninjected (Right) wild-type mice.
Anti-GFP antibody was used to detect EGFP in the indicated sites/tissues (n=3). Arrows indicate cells that express high levels of EGFP. Scale bar=200 µm.
Figure 5
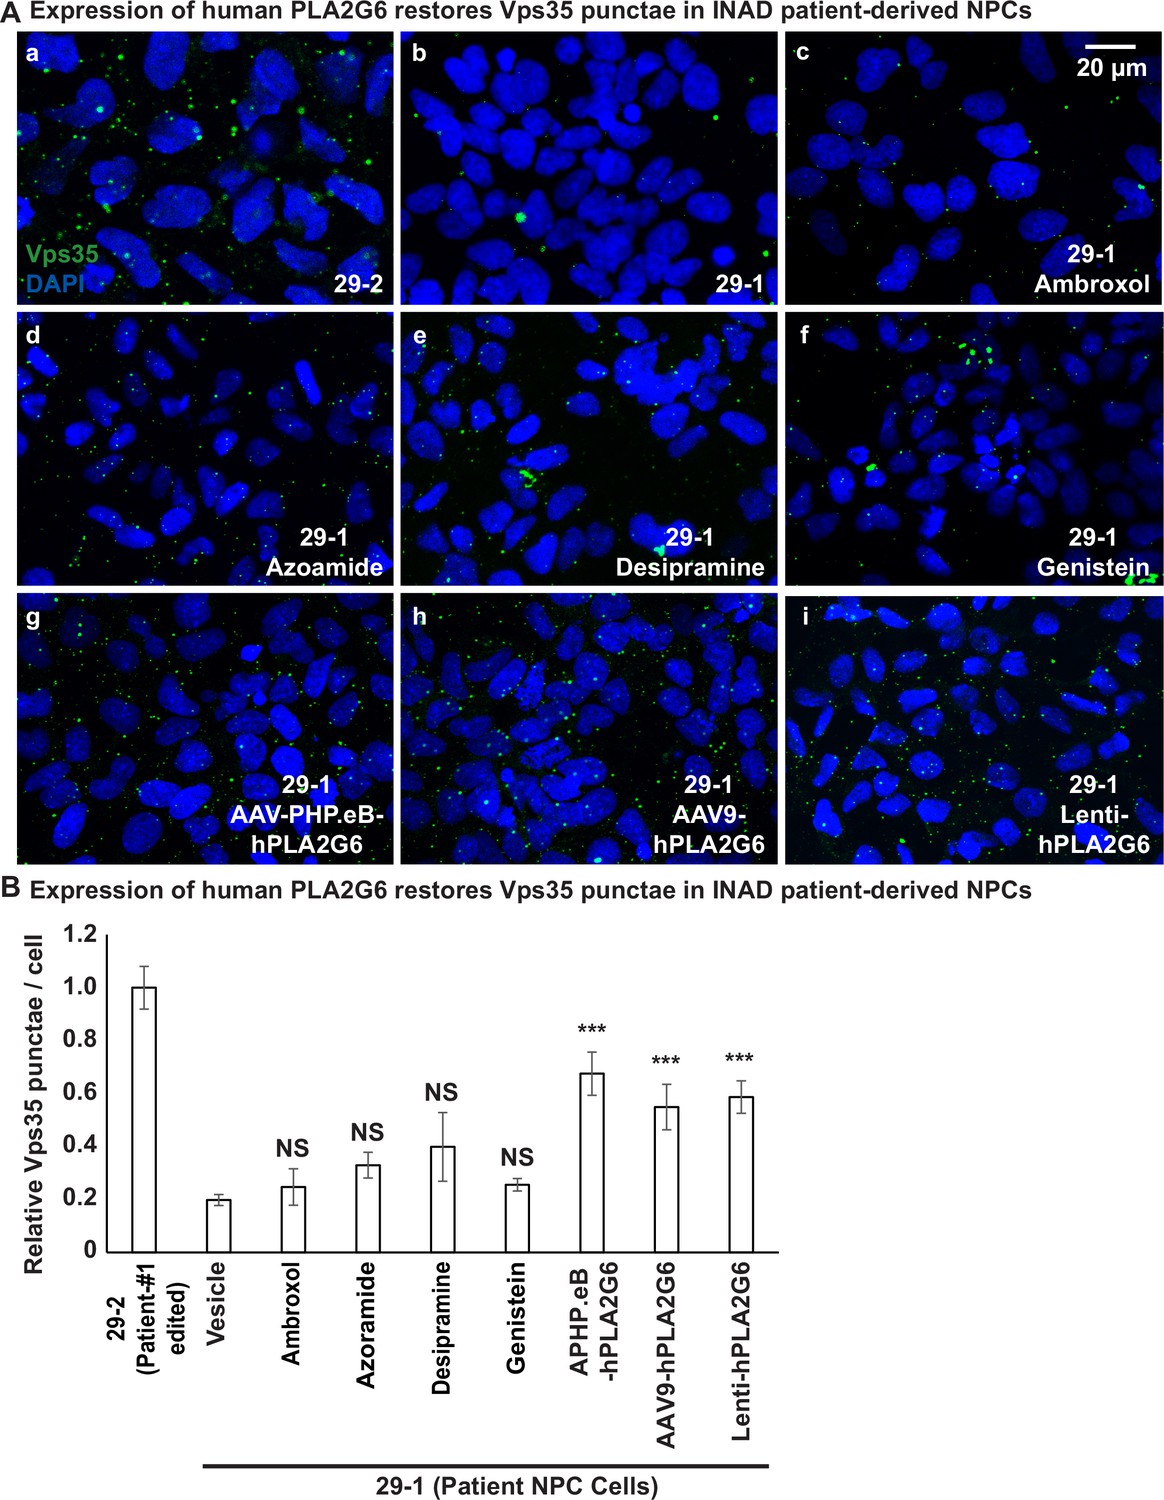
Expression of human PLA2G6 restores the number of Vps35 punctae in INAD patient-derived NPCs.
A (a, b) The number of Vps35 punctae is higher in the genetically corrected NPCs (29-2). Immunofluorescent staining of NPCs with the indicated genotypes and treatments. Vps35 antibody (green; arrows) labels retromers. DAPI (blue) labels nuclei. (c–f) The number of Vps35 punctae is not affected in the patient-derived NPCs (29-1) treated with the selected drugs. (g–i) The expression of human PLA2G6 restores the number of Vps35 punctae in INAD patient-derived NPCs. (B) Quantifications of the Vps35 punctae in (A) (n=8). Representative images are shown in this figure. Scale bar=20 µm. Error bars represent SEM; ***p<0.001; NS, not significant (the p values were calculated between the untreated patient NPCs (29-1) and the indicated treatment). INAD, infantile neuroaxonal dystrophy; NPC, neural progenitor cell.
Figure 6
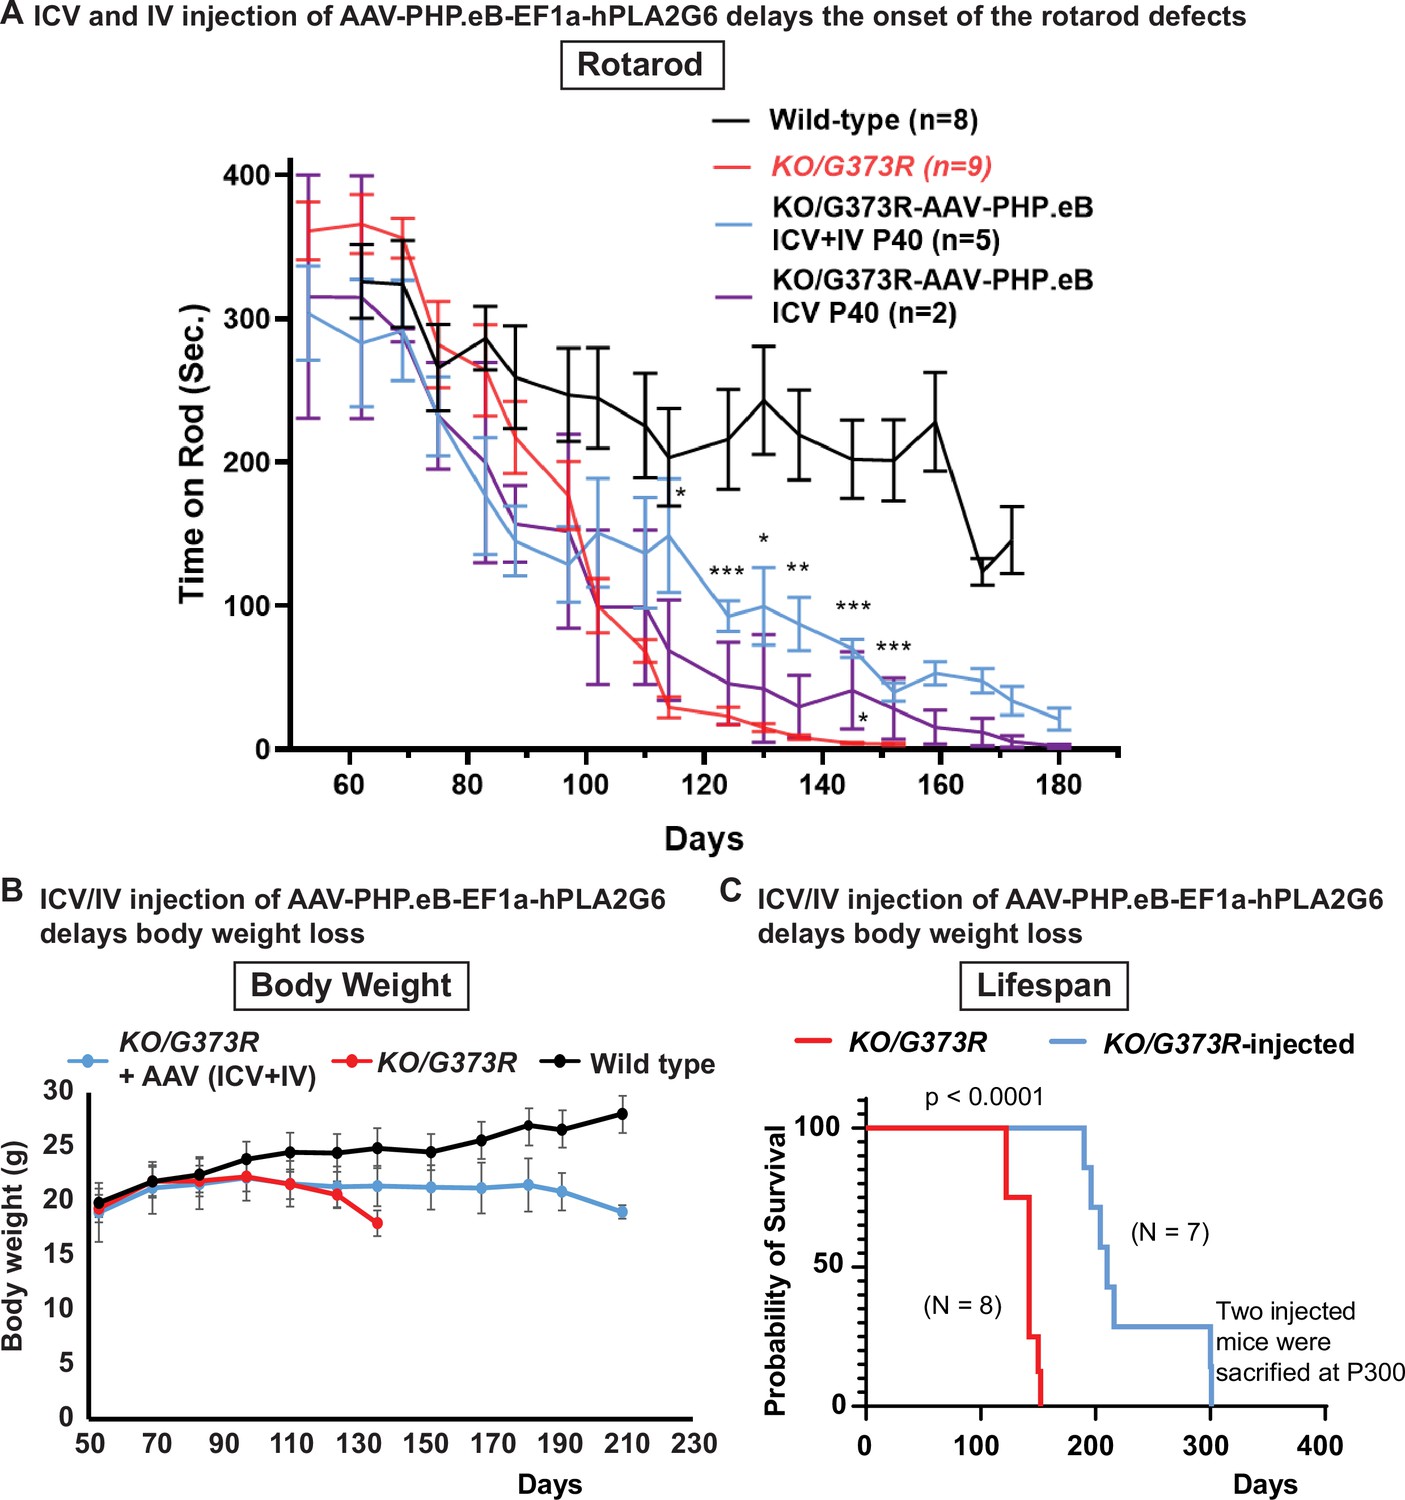
Pre-symptomatic injection of AAV-PHP.eB-PLA2G6 suppresses rotarod defect and prolongs lifespan in Pla2g6KO/G373R INAD mice.
(A) Rotarod defect in Pla2g6KO/G373R mice (genotype: Pla2g6KO/G373R) (n=6) are reduced by pre-symptomatic (P40) ICV + IV injection (n=5), but not ICV only (n=2). Wild-type (n=5); Pla2g6KO/G373R (n=10). Rotarod performance of mice with the indicated genotypes was measured weekly. (B) Pre-symptomatic (P40) ICV + IV injection of AAV-PHP.eB-hPLA2G6 stabilizes body weight of Pla2g6KO/G373R mice. Wild-type (n=5); Pla2g6KO/G373R (n=6); Pla2g6KO/G373R injected (n=3). (C) Pre-symptomatic (P40) ICV + IV injection of AAV-PHP.eB-PLA2G6 prolongs lifespan of the Pla2g6KO/G373R mice. Pla2g6KO/G373R (n=8); Pla2g6KO/G373R injected (n=8). Error bars represent SEM. * P<0.05; ** P<0.01; *** P<0.001. All assays were conducted in blind of genotypes and treatments.
Figure 7
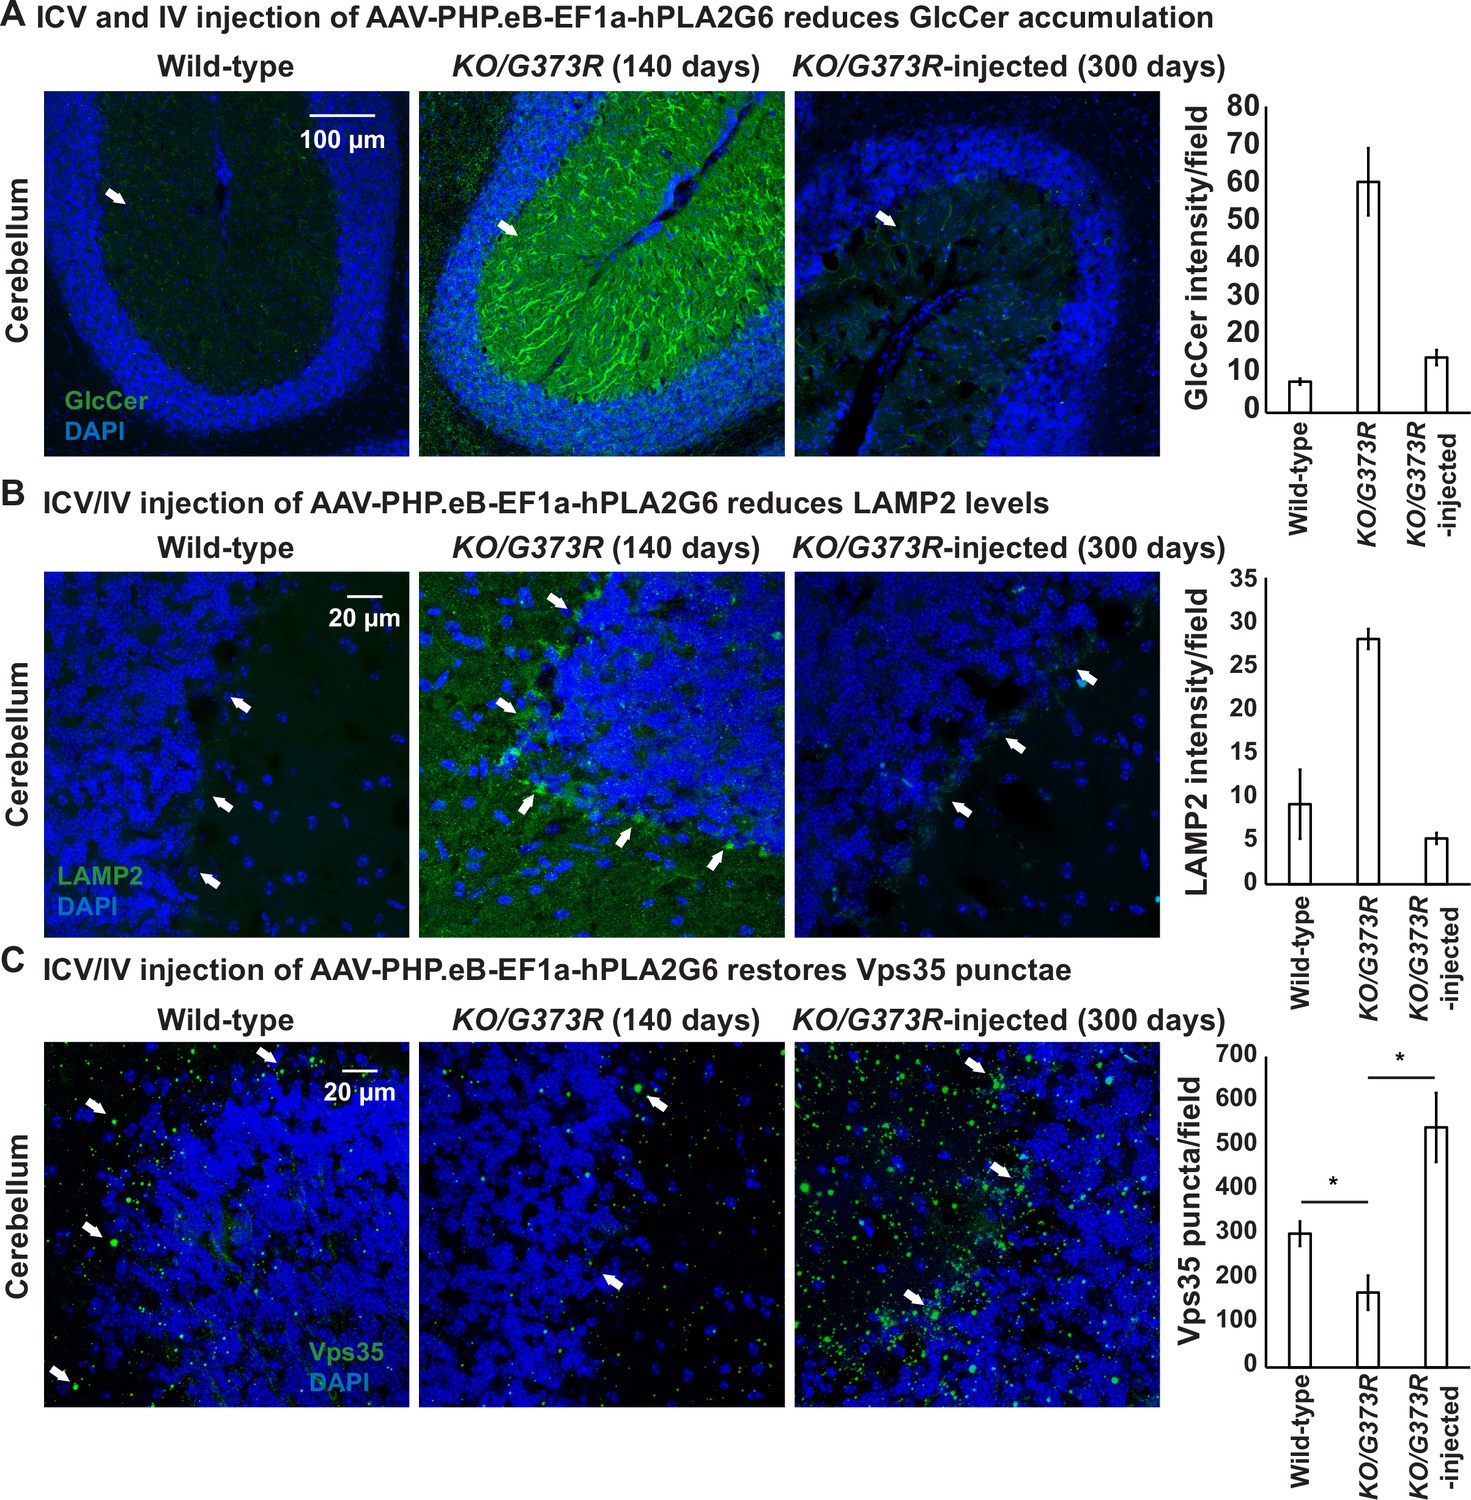
ICV and IV injection of AAV-PHP.eB-EF1a-PLA2G6 reduces GlcCer and LAMP2 accumulation and restores the number of Vps35 punctae.
(A) Immunofluorescent staining of mouse cerebella of the indicated genotypes and treatments. GlcCer antibody (green; arrows) was used to assess the levels of GlcCer. Scale bar=100 µm. All assays were conducted blind for genotypes and treatments. (B) Immunofluorescent staining of mouse cerebella of the indicated genotypes and treatments. LAMP2 antibody (green; arrows) labels lysosomes in the Purkinje cells. Scale bar=20 µm. (C) Immunofluorescent staining of mouse cerebella of the indicated genotypes and treatments. Vps35 antibody (green; arrows). Scale bar=20 µm. Representative images are shown in this figure. DAPI (blue) labels nuclei. Representative images are shown in this figure. Quantifications are shown next to the images (n=3 for wild-type and Pla2g6KO/G373R mice; n=2 for Pla2g6KO/G373R-injected mice). Error bars represent SEM; *p<0.05; **p<0.01. ICV, intracerebroventricular; IV, intravenous.
Videos
Video 1
The injected Pla2g6KO/G373R mice (at ~P300) behaved relatively normal in their home cage.
Additional files
Download links
A two-part list of links to download the article, or parts of the article, in various formats.
Downloads (link to download the article as PDF)
Open citations (links to open the citations from this article in various online reference manager services)
Cite this article (links to download the citations from this article in formats compatible with various reference manager tools)
Exploring therapeutic strategies for infantile neuronal axonal dystrophy (INAD/PARK14)
eLife 12:e82555.
https://doi.org/10.7554/eLife.82555


