An acetylation-mediated chromatin switch governs H3K4 methylation read-write capability
- Department of Biochemistry and Biophysics, University of North Carolina at Chapel Hill of Medicine, United States
- Lineberger Comprehensive Cancer Center, University of North Carolina at Chapel Hill, School of Medicine, United States
- EpiCypher, Inc, United States
- Verna & Marrs McLean Department of Biochemistry and Molecular Biology, Baylor College of Medicine, United States
- Curriculum in Genetics and Molecular Biology, University of North Carolina at Chapel Hill, School of Medicine, United States
- Pennsylvania State University, United States
- Department of Biochemistry and Molecular Biology, Upstate Medical University, United States
Figures
Figure 1 with 1 supplement
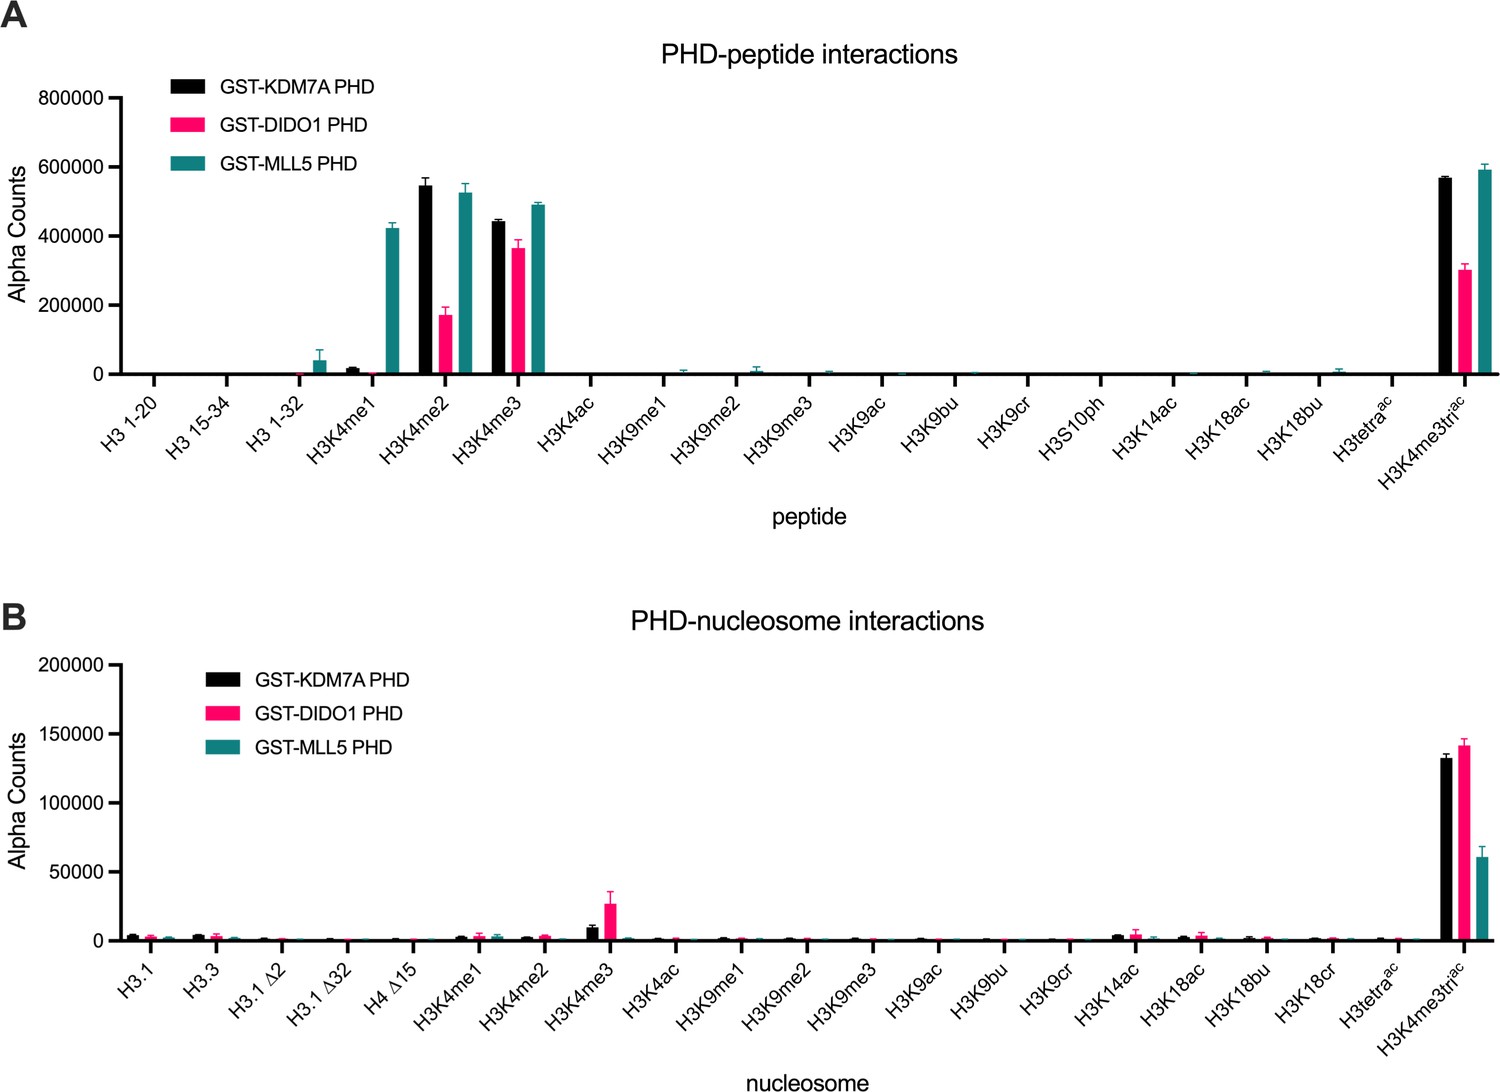
PHD finger reader domains show restricted binding on post-translational modification (PTM)-defined peptides vs. nucleosomes.
dCypher assay alpha counts for the interaction of GST-PHD queries (9.5 nM KDM7A (Uniprot #Q6ZMT4; residues 1–100); 2.4 nM DIDO1 (Uniprot #Q9BTC0; residues 250–340); 18 nM MLL5 (Uniprot #Q8IZD2; residues 100–180)) with PTM-defined peptides (A) vs. nucleosomes (B) (the potential targets). All error bars represent the range of two replicates. Key: H3.1 ∆2, H3.1 ∆32, and H4 ∆15 are nucleosomes assembled with histones lacking the indicated N-terminal residues of H3.1 or H4. All data were plotted using GraphPad Prism 9.0. Of note, each reader query showed minimal interaction-free DNA (147 bp or 199 bp: Figure 1—figure supplement 1B).
Figure 1—figure supplement 1
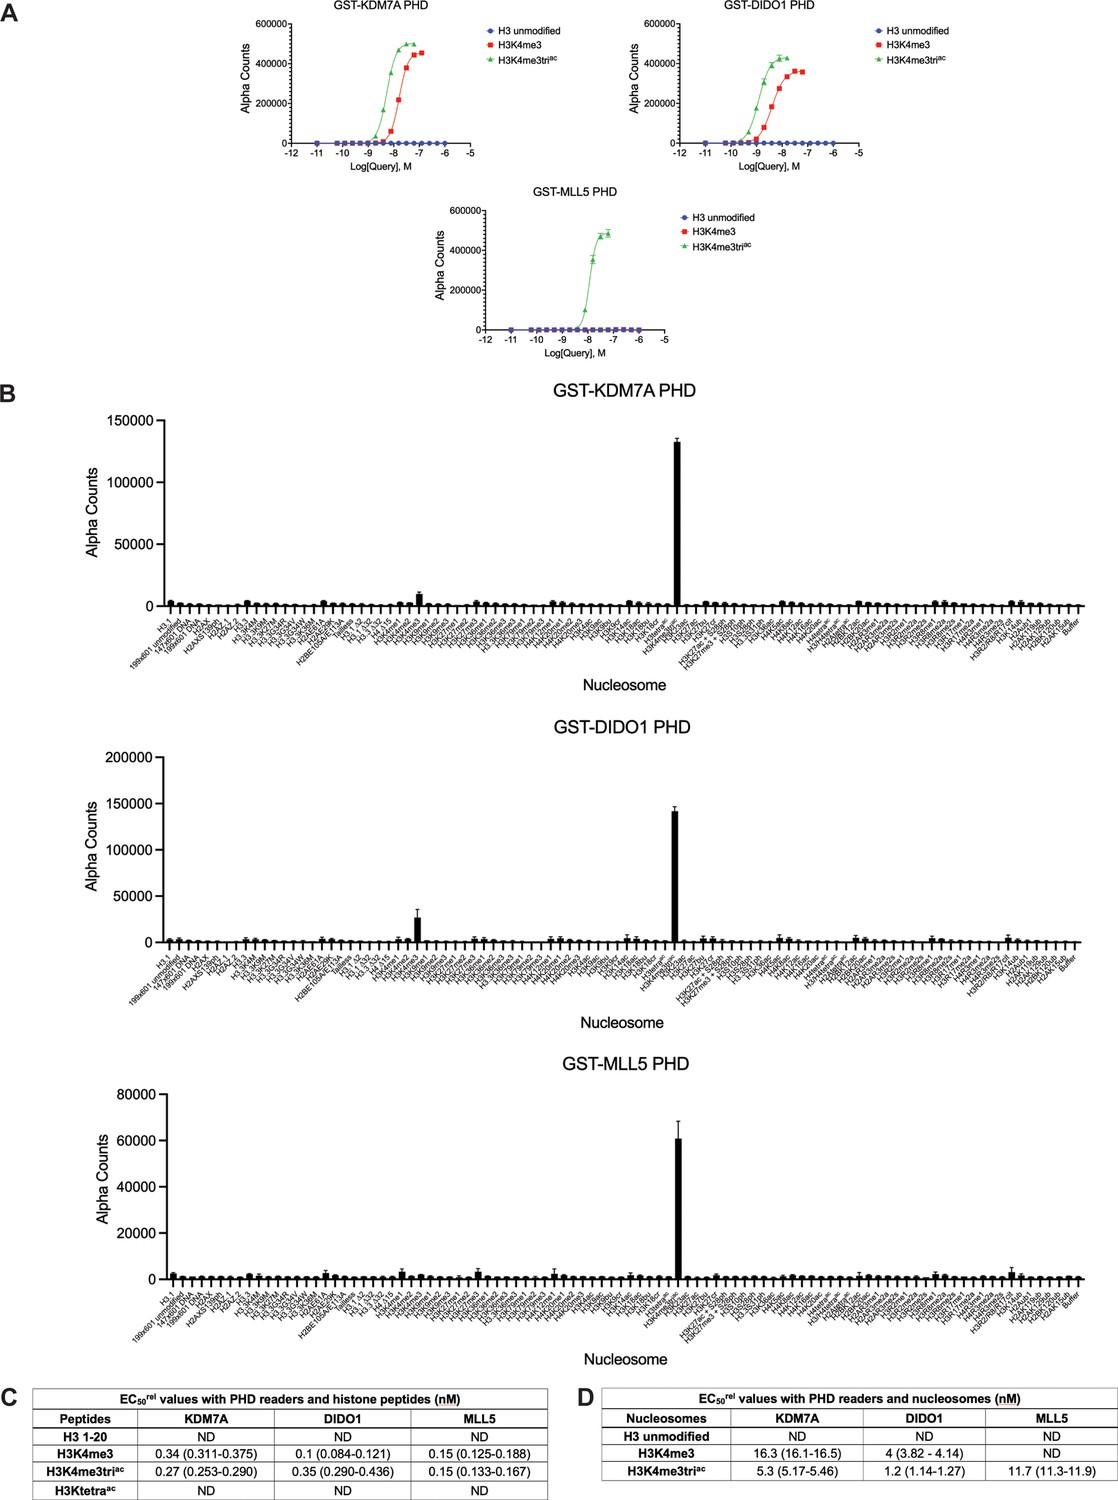
dCypher assays with PHD finger reader domains.
(A) Binding curves to determine the optimal concentration for screening reader queries (GST-KDM7A PHD, GST-DIDO1 PHD, and GST-MLL5 PHD) to indicate post-translational modification (PTM)-defined nucleosome targets. (B) Library binding screen with indicated GST-PHD queries and PTM-defined nucleosome or free DNA (147 bp (Widom 601 sequence) or 199 bp (Widom 601 sequence flanked by 21 bp linkers)) targets. Error bars represent the range of two replicates. Key: H3.1N ∆2, H3.1N ∆32, and H4N ∆15 are nucleosomes assembled with histones lacking the indicated N-terminal residues of H3.1 or H4. (C) Relative EC50 (EC50Rel) binding values (in nM) (calculated as in Methods) between GST-PHD reader proteins and select histone peptides; 95% confidence intervals are represented parenthetically. (D) EC50Rel binding values (in nM) between GST-PHD proteins and select nucleosomes; 95% confidence intervals are represented parenthetically. ND = not determined.
-
Figure 1—figure supplement 1—source data 1
EC50Rel binding values (in nM) for GST-PHD proteins with histone peptides and nucleosomes.
- https://cdn.elifesciences.org/articles/82596/elife-82596-fig1-figsupp1-data1-v2.xlsx
Figure 2 with 1 supplement

MLL1 complex (MLL1C) methylation activity on nucleosomal H3K4 is significantly enhanced by co-incident H3triac.
(A) Endpoint methylation assays of H3K4me0 [H3 • H3]-me1-me2-me3 nucleosomes and their cognate H3K9ac14ac18ac (H3triac) partners (all 100 nM) with MLL1 Complex (MLL1C; 4 nM). Reactions performed in triplicate with error bars as SEM. p-values were determined using a two-tailed t-test: ****=<0.0001, ***=0.0008, **=0.0038. (B) MLL1C (4 nM) methylation activity on H3K4me0-me1-me2-me3 nucleosomes and their cognate H3triac partners (all substrates: 1.5-fold serial dilution, 0–0.4 μM). Reactions performed in triplicate with error bars as SEM (see also Figure 2—figure supplement 1). (C) MLL1C does not differentially associate with post-translational modification (PTM)-defined nucleosome substrates under study conditions. dCypher binding curves of hexahistidine (6HIS)-tagged MLL1C (concentrations noted) with PTM-defined nucleosomes (20 nM). Error bars represent the range of two replicates. (D) MLL1C-mediated methylation is enhanced on cis but not trans-acetylated nucleosomal H3 tails. Endpoint methylation assays of MLL1C (4 nM) with homotypic [H3 • H3] vs. heterotypic (e.g., [H3 • H3tetraac]; see Methods) nucleosome substrates (all 100 nM). Reactions performed in triplicate with error bars as SEM. p-values were determined using a two-tailed t-test: ****=<0.0001. Key: H3triac = H3K9acK14acK18ac. H3tetraac = H3K4acK9acK14acK18ac.
Figure 2—figure supplement 1
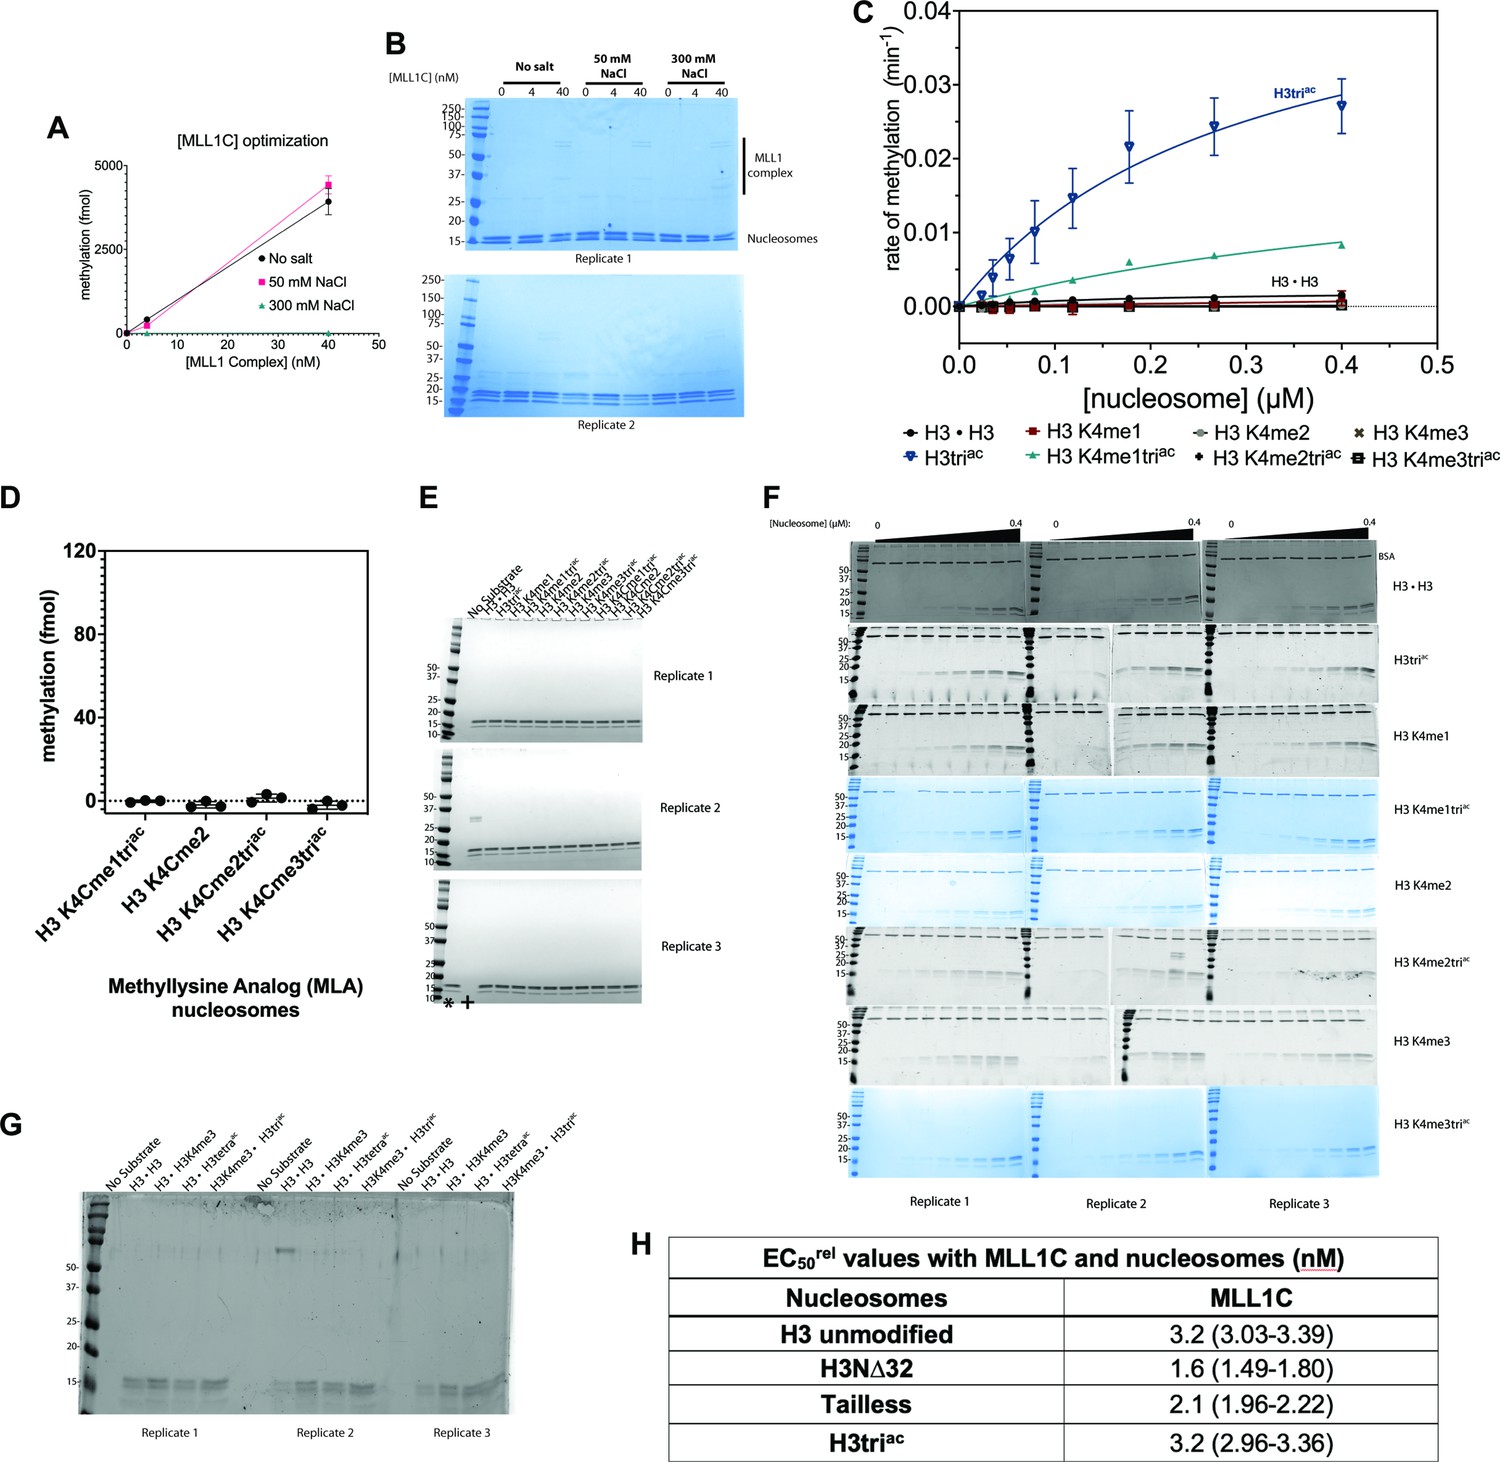
Methylation assays with MLL1 complex (MLL1C) and nucleosome substrate.
(A) MLL1C activity on 2 μg chicken oligonucleosomes (2 μg) was 2D-titration tested by enzyme [0, 4, and 40 nM] and salt [0, 50, and 300 mM NaCl] in the presence of [methyl-3H]-SAM donor. Methylation (in fmol) is graphed as a function of [MLL1C]. N=2 and error bars are SD. (B) Replicate SDS-PAGE Coomassie-stained gels for methylation data from panel (A). Resolved subunits of MLL1C and nucleosomes are indicated. (C) Steady-state kinetic data for MLL1C activity with nucleosome substrates as shown in Figure 2B but fit to the Michaelis-Menten equation. (D) Endpoint methylation activity of MLL1C (4 nM) with MLA (methyl-lysine analog) nucleosome substrates (100 nM) in triplicate; error bars are SD. (E) Replicate SDS-PAGE Coomassie-stained gels for methylation data from panel (D); Lanes marked with ‘*’ and ‘+’ in the Replicate three gel are switched. (F) Replicate SDS-PAGE Coomassie-stained gels for methylation data from Figure 2B and (C). 0.5 μg BSA was loaded as a lane marker to each quenched reaction (except for H3K4me3triac). (G) SDS-PAGE Coomassie-stained gel for methylation data from Figure 2C. (H) EC50rel binding values (in nM) between MLL1C and select nucleosomes; 95% confidence intervals (CI) are represented parenthetically. Note: gel images in grayscale and blue are both Coomassie-stained gels. All data were plotted using GraphPad Prism 9.0.
-
Figure 2—figure supplement 1—source data 1
Files of raw Coomassie gel images are used in Figure 2—figure supplement 1.
Individual files, as well as a composite labeled file, of all raw Coomassie gels for images in Figure 2—figure supplement 1. Each raw image file name is labeled with the panel to which it corresponds in Figure 2—figure supplement 1 except for the composite labeled image, which has each image labeled with the corresponding panel within the composite image.
- https://cdn.elifesciences.org/articles/82596/elife-82596-fig2-figsupp1-data1-v2.xlsx
-
Figure 2—figure supplement 1—source data 2
EC50rel binding values (in nM) for MLL1C and nucleosomes.
- https://cdn.elifesciences.org/articles/82596/elife-82596-fig2-figsupp1-data2-v2.zip
Figure 3 with 1 supplement

Middle-down mass spectrometric (MS) analysis reveals a hierarchical dependence between H3K4 methylation and cis H3 acetylation in MCF-7 cells.
(A) Occupancy of H3K4 methyl states (me0-1-2-3) within each H3 acetyl state (0ac to 5ac) in asynchronous MCF-7 cells. (B) Occupancy of H3K4 methyl states within each H3 acetyl state after butyrate treatment (60 min). Asterisks represent <i>p-values <0.05. (C) Representative tandem mass spectra of the targeted C4+1 fragment ion series (474 m/z unmodified; 488 m/z me1; 502 m/z me1; 516 m/z me3). Each spectrum is an average of MS2 spectra of the indicated H3 acetyl states after 60 min of butyrate treatment. K4 occupancy stoichiometry is directly correlated with H3 acetylation state and the targeted MS approach provides excellent signal-to-noise for confident quantitation. (D) Time course of H3K4me3 accumulation with respect to each H3 acetyl state after butyrate treatment. See Methods for further information on data acquisition and analysis. All data were collected in biological triplicate with error bars representing SEM.
Figure 3—figure supplement 1
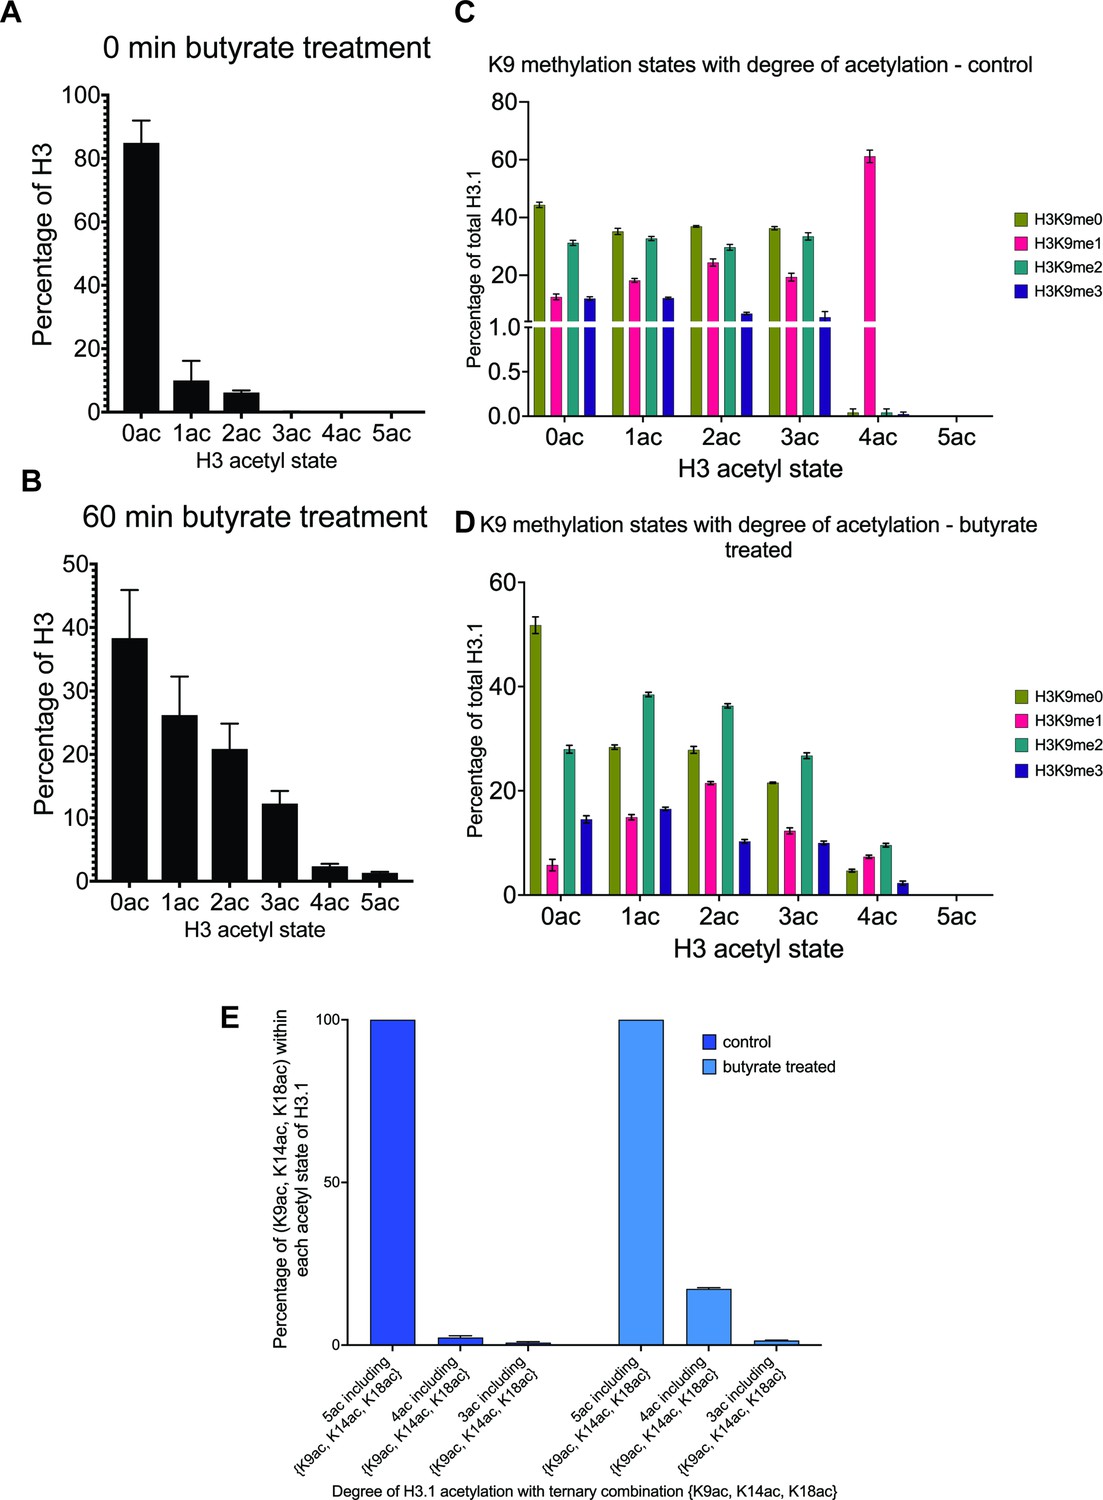
H3 acetylation states with sodium butyrate treatment.
(A - B) Each acetyl state of acid-extracted H3 from 0ac to 5ac is represented as a percent of total H3 before/after 60 min treatment of asynchronous MCF-7 cells with 5 mM sodium butyrate. (C) Occupancy of H3K4 methyl states (me0-1-2-3) within each H3 acetyl state (0ac to 5ac) in asynchronous HEK-293 cells. (D) Occupancy of H3K4 methyl states within each H3 acetyl state after butyrate treatment (120 min) in asynchronous HEK-293 cells. (E) Percentage of (K9ac, K14ac, K18ac) proteoforms within 3ac to 5ac acetyl states of H3.1 ± butyrate treatment in HEK-293 cells. N=3 and error bars are SEM for all data.
Figure 4
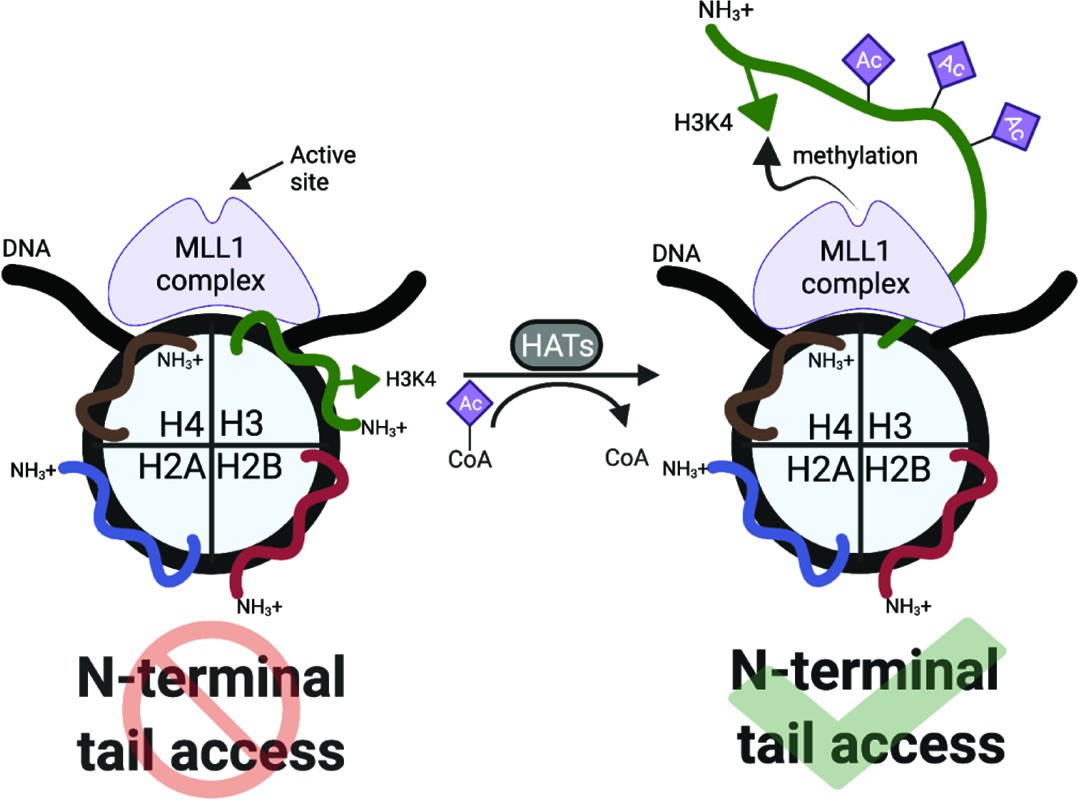
Regulation of H3K4 methylation by cis-tail H3 acetylation.
Nucleosomal DNA is represented in black; each histone is labeled, with the core histone N-terminal tails colored to distinguish. MLL1 complex (MLL1C) is in purple.
Tables
Table 1
Steady-state Hill kinetic parameters.
| Substrate | K0.5 (μM) | kcat (min–1) | h (Hill coefficient) | R2 |
|---|---|---|---|---|
| H3 • H3 | 0.13 ± 0.06 | 0.0018 ± 0.0004 | 1.213 ± 0.3430 | 0.8810 |
| H3 K9ac/14ac/18ac | 0.12 ± 0.02 | 0.0304 ± 0.0036 | 1.741 ± 0.3528 | 0.9228 |
| H3K4me1 | n.d.* | n.d.* | n.d.* | 0.3186 |
| H3K4me1 K9ac/14ac/18ac | 0.14 ± 0.008 | 0.0092 ± 0.0004 | 2.032 ± 0.1333 | 0.9920 |
| H3K4me2 | n.d.* | n.d.* | n.d.* | –0.1746 |
| H3K4me2 K9ac/14ac/18ac | 0.042 ± 0.005 | 0.0005 ± 0.00004 | 5.349 ± 2.682 | 0.8155 |
| H3K4me3 | n.d.* | n.d.* | n.d.* | n.d.* |
| H3K4me3 K9ac/14ac/18ac | n.d.* | n.d.* | n.d.* | n.d.* |
-
*
= methylation signal was indistinguishable from the background: kinetic parameters could not be determined.
Additional files
-
Supplementary file 1
Steady-state Michaelis-Menten kinetic parameters.
a = methylation signal observed was indistinguishable from the background and thus kinetic parameters could not be determined.
- https://cdn.elifesciences.org/articles/82596/elife-82596-supp1-v2.xlsx
-
Supplementary file 2
Mass Spectrometric data for H3K4 methylation and H3 acetylation in asynchronous MCF-7 cells as a function of butyrate treatment.
(See Excel file).
- https://cdn.elifesciences.org/articles/82596/elife-82596-supp2-v2.xls
-
Supplementary file 3
Mass Spectrometric data for H3K9 methylation and H3 acetylation in asynchronous HEK-293 cells as a function of butyrate treatment.
(See Excel file).
- https://cdn.elifesciences.org/articles/82596/elife-82596-supp3-v2.xlsx
-
Supplementary file 4
Mass Spectrometric data for H3K9acK14acK18ac abundance within H3 acetyl states in asynchronous HEK-293 cells as a function of butyrate treatment.
(See Excel file).
- https://cdn.elifesciences.org/articles/82596/elife-82596-supp4-v2.xlsx
-
Supplementary file 5
A table resource detailing recombinant protein constructs, peptides, and nucleosomes used in this study.
(See Excel file).
- https://cdn.elifesciences.org/articles/82596/elife-82596-supp5-v2.xlsx
-
MDAR checklist
- https://cdn.elifesciences.org/articles/82596/elife-82596-mdarchecklist1-v2.pdf
Download links
A two-part list of links to download the article, or parts of the article, in various formats.
Downloads (link to download the article as PDF)
Open citations (links to open the citations from this article in various online reference manager services)
Cite this article (links to download the citations from this article in formats compatible with various reference manager tools)
An acetylation-mediated chromatin switch governs H3K4 methylation read-write capability
eLife 12:e82596.
https://doi.org/10.7554/eLife.82596


