The effect of variation of individual infectiousness on SARS-CoV-2 transmission in households
- WHO Collaborating Centre for Infectious Disease Epidemiology and Control, School of Public Health, Li Ka Shing Faculty of Medicine, The University of Hong Kong, China
- Laboratory of Data Discovery for Health, China
- Mathematical Modelling of Infectious Diseases Unit, Institut Pasteur, France
Figures
Figure 1
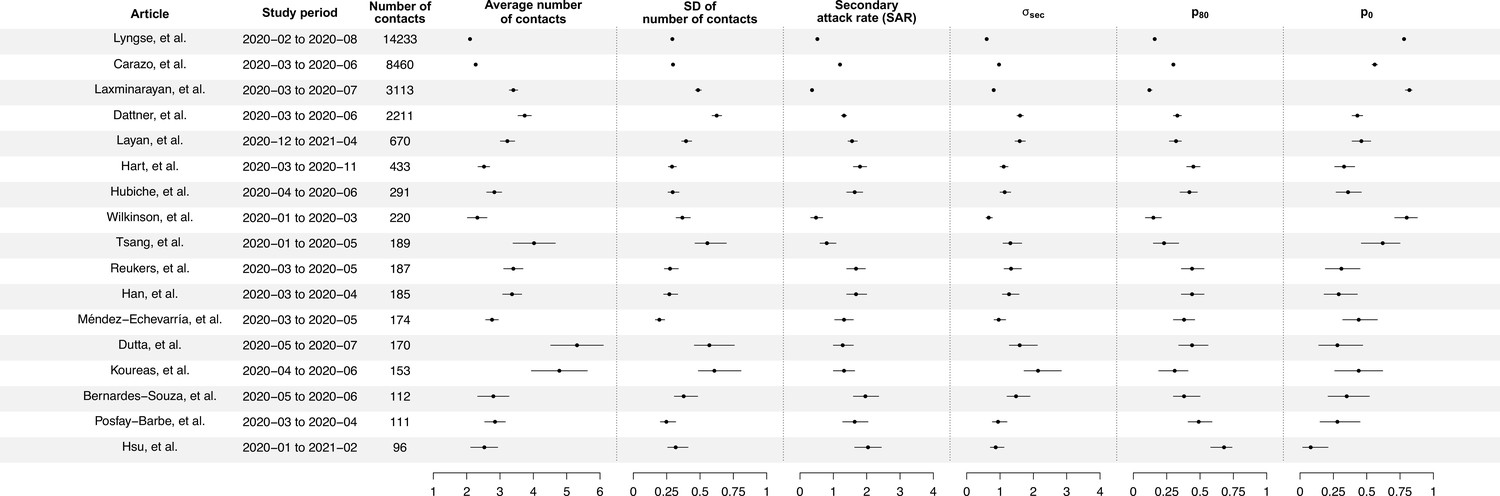
Summary of statistics for 17 identified studies.
Figure shows the average number of contacts and standard deviation (SD) of number of contact, SD of number of secondary cases per index cases (), and secondary attack rate (SAR) for 17 identified studies.
Figure 2
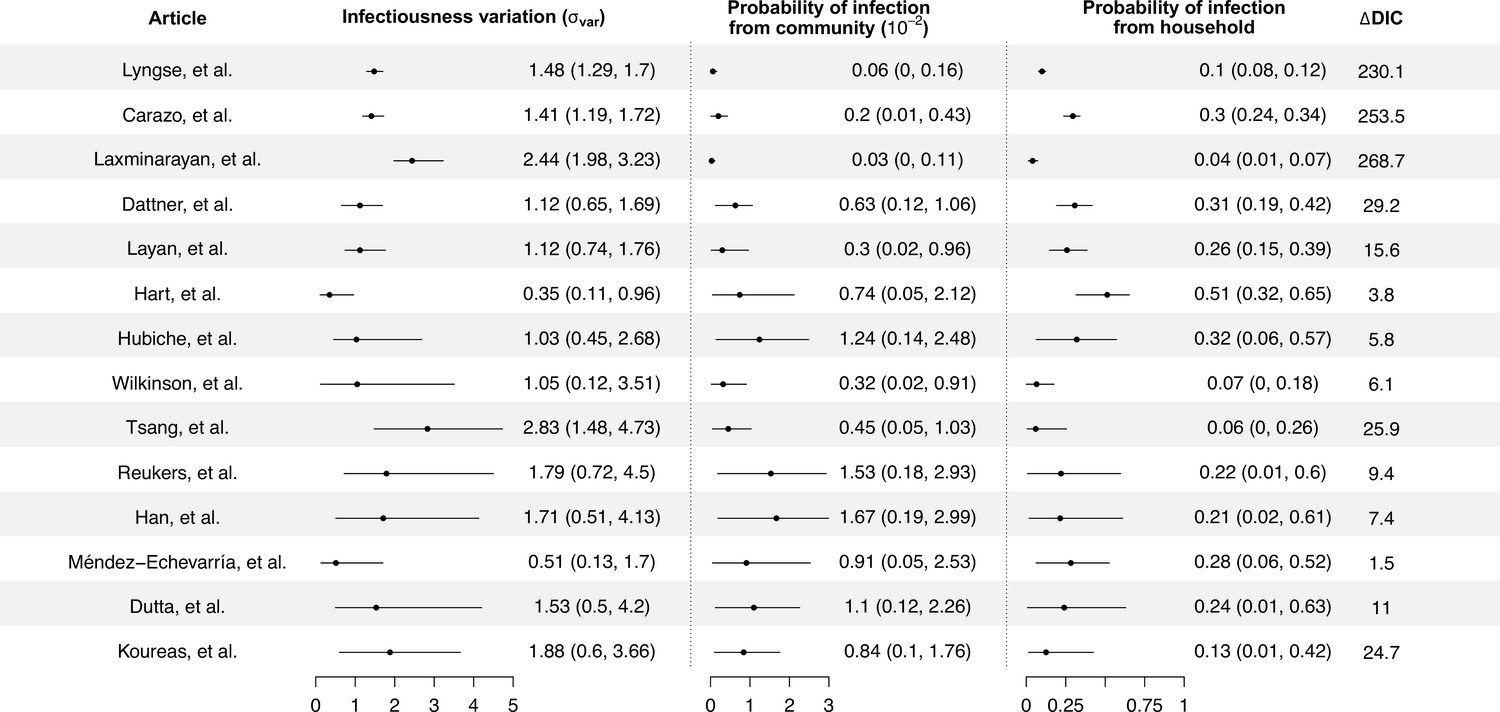
Modeling results of household transmission dynamics and infectiousness variation.
Figure shows the estimates of infectiousness variation (), the estimated probability of infection from community and estimated probability of infection from households, and the reduction in deviance information criteriion (DIC) compared with the model without infectiousness variation. Models are fitted separately to 14 household transmission studies.
Figure 3

Estimate distribution of relative infectiousness based on the pooled estimate.
Red line indicates the estimated distribution and the gray lines indicate the associated uncertainty. Black dashed line indicates average infectiousness (relative infectiousness equal to 1), while the purple and blue dashed lines indicate top 20% and 10% infectiousness, respectively.
Figure 4
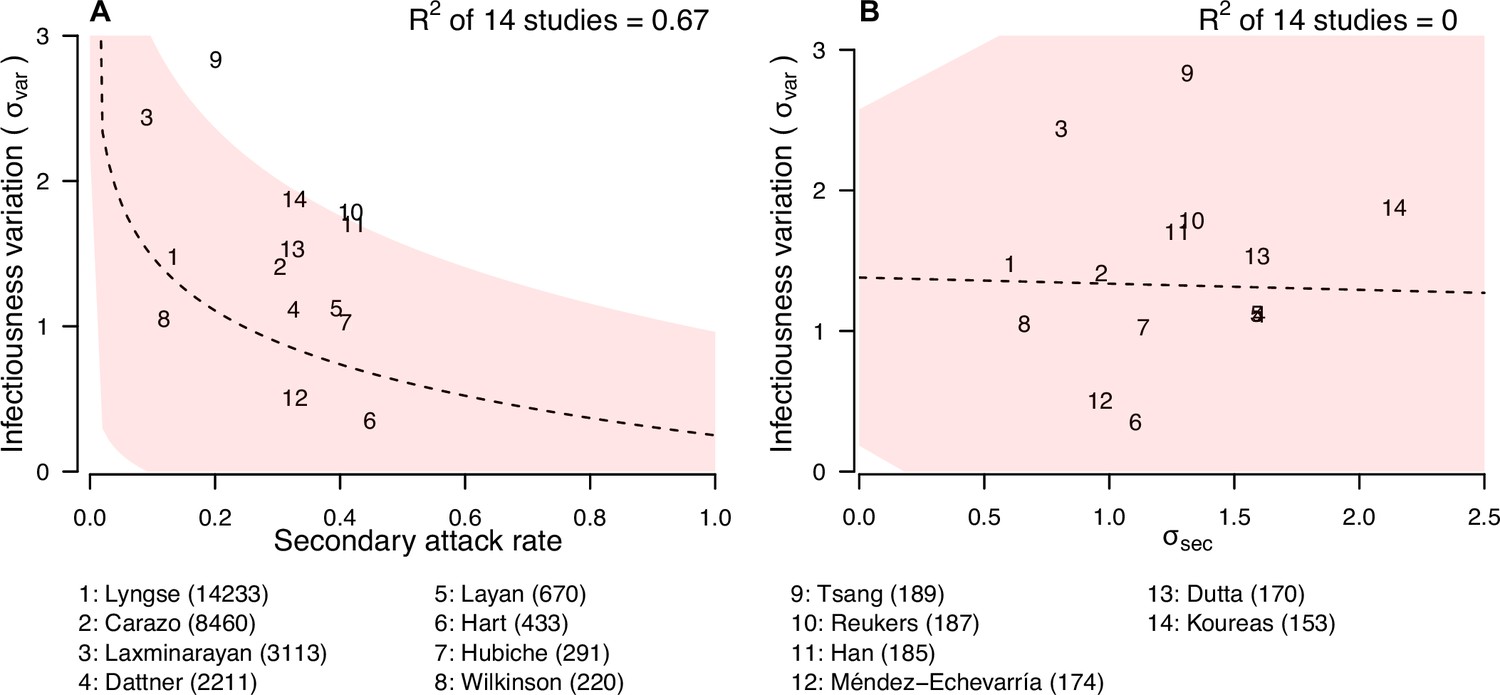
Relationship between infectiousness variation and statistic.
In each panel, numbers represent the observed corresponding relationship for the identified studies. Panels A and B show the relationship between infectiousness variation () and secondary attack rate (SAR) and standard deviation (SD) of number of secondary cases per index cases (). In the bottom, numbers in bracket indicate the number of household contacts in corresponding studies.
Appendix 1—figure 1
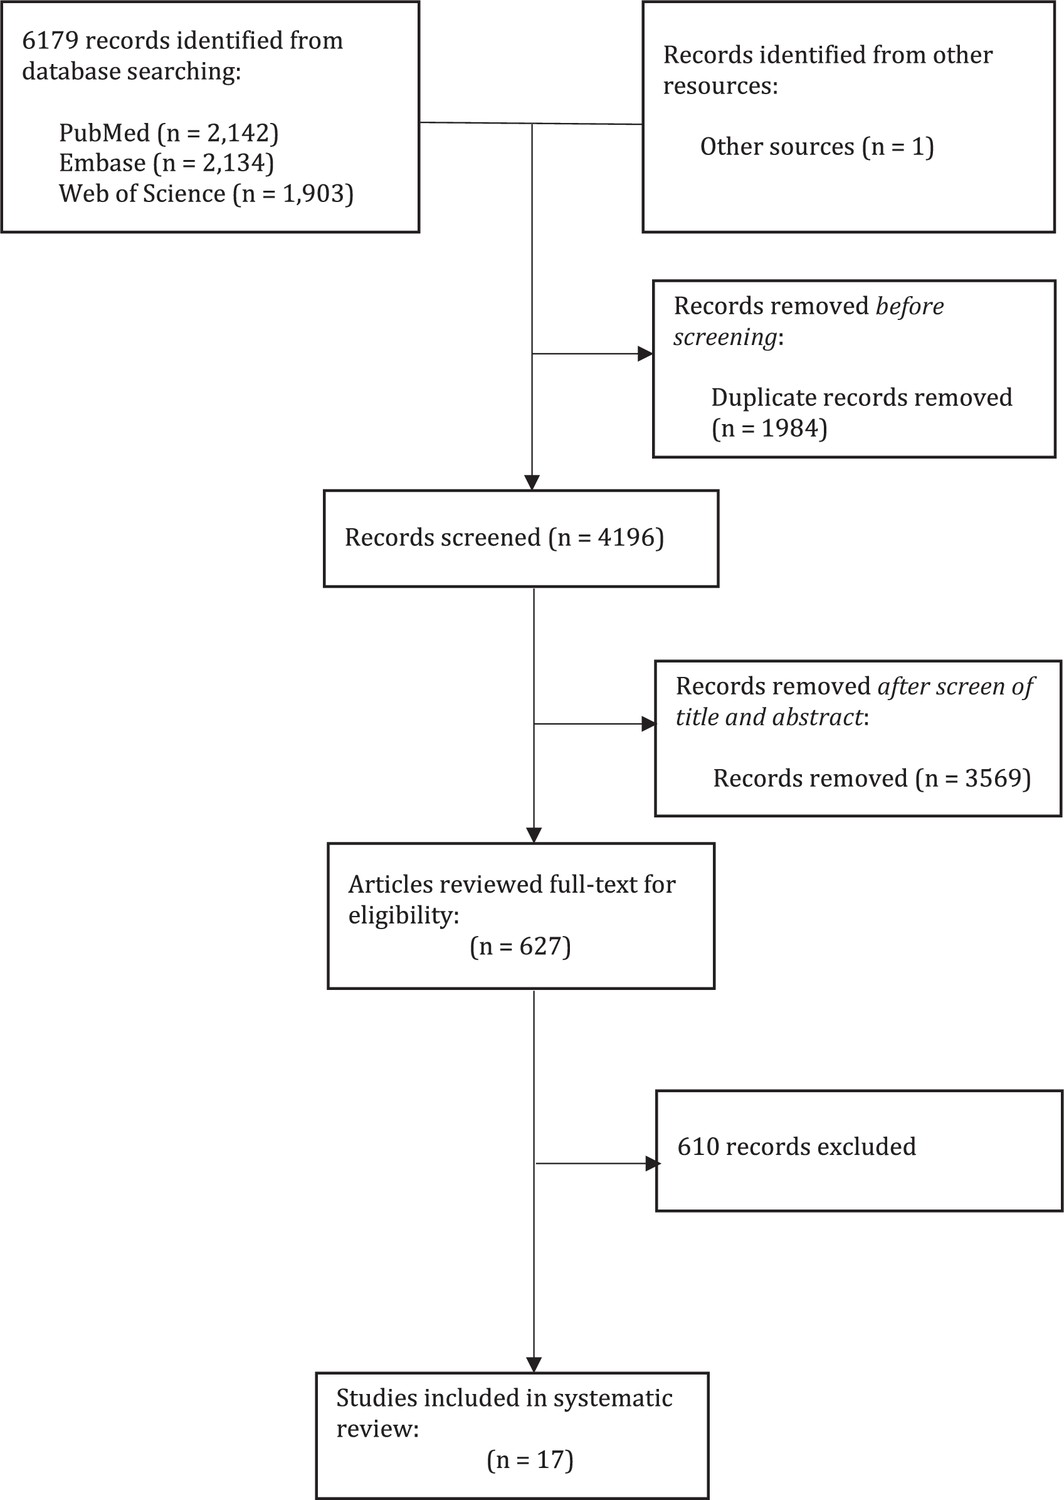
Process of systematic review.
Appendix 1—figure 2
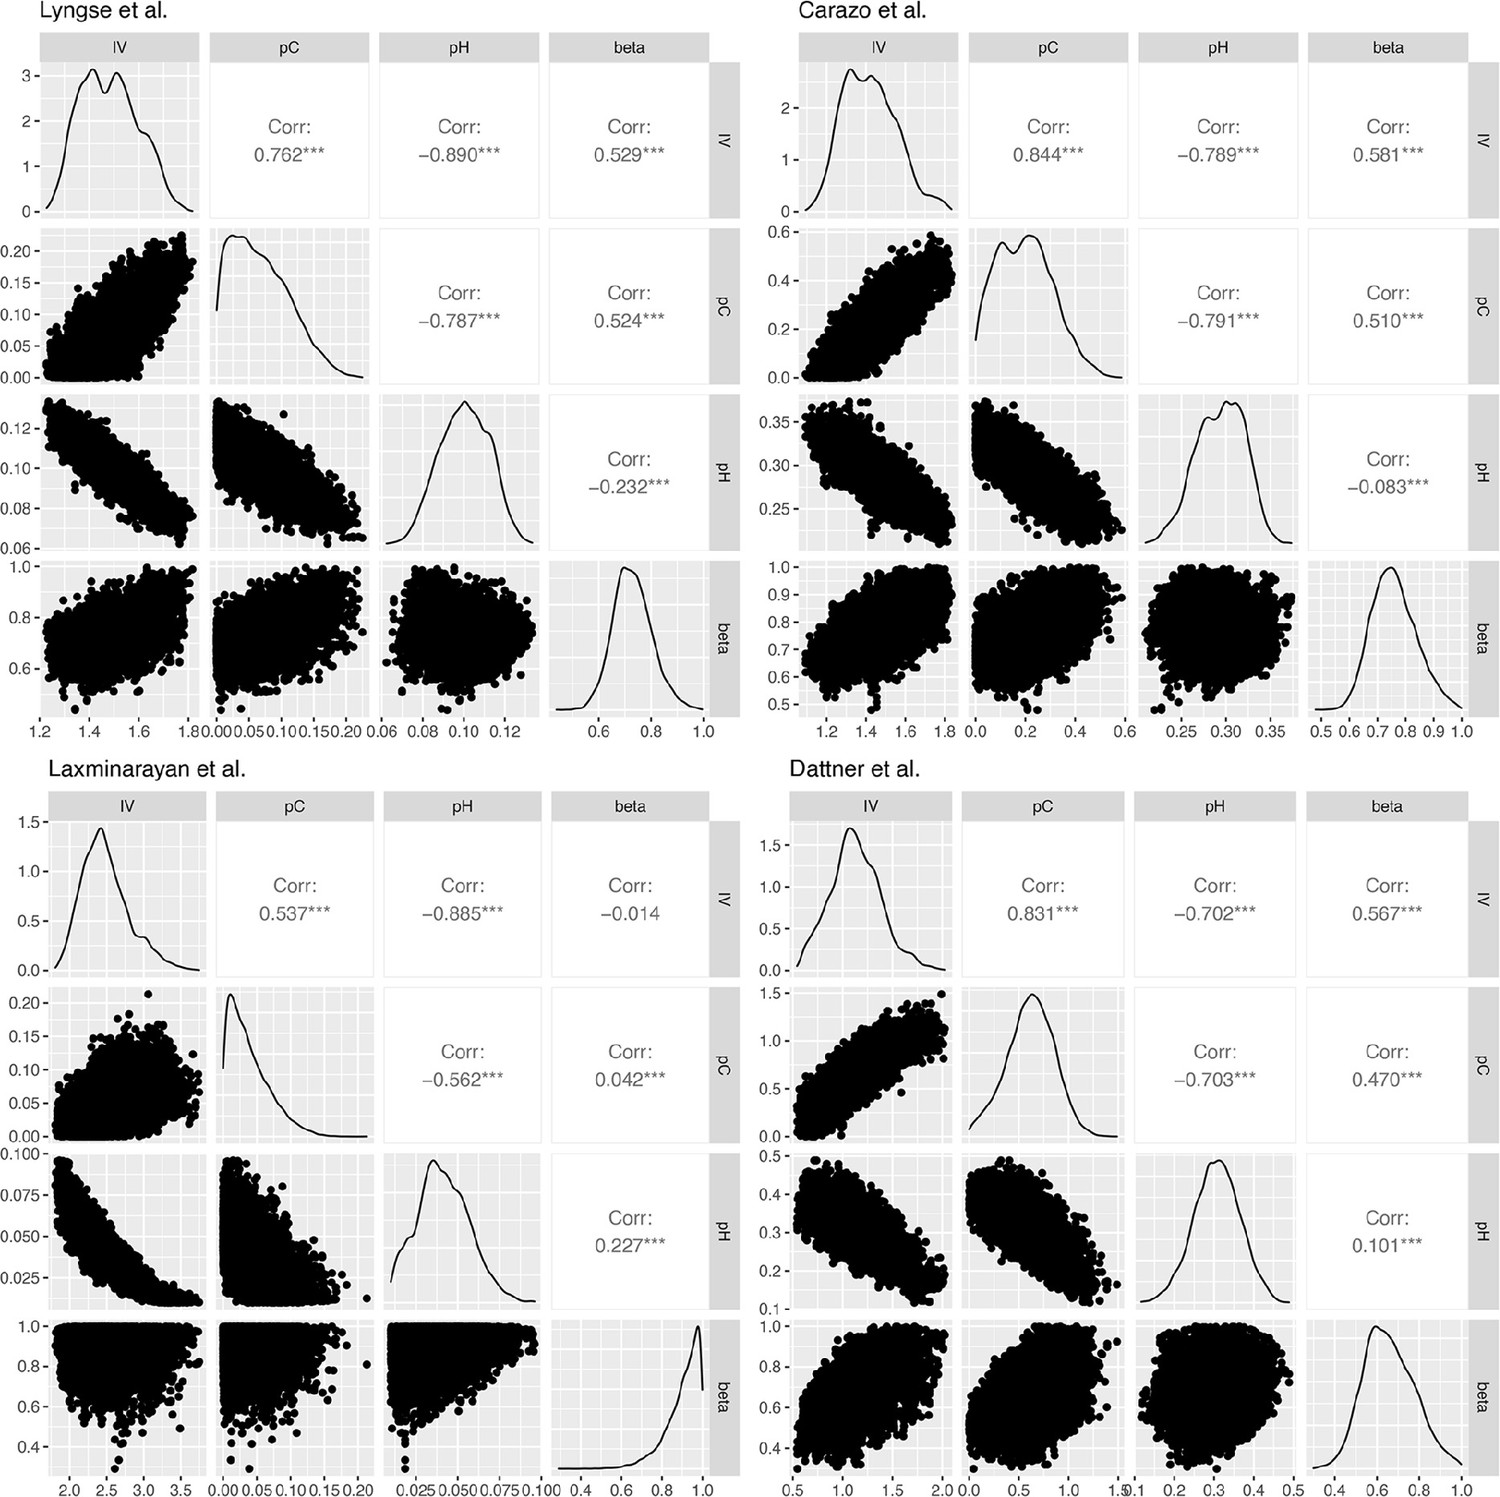
Correlation plots for the posterior distribution of model parameters in Lyngse et al., Carazo et al., Laxminarayan et al., and Dattner et al.
Appendix 1—figure 3
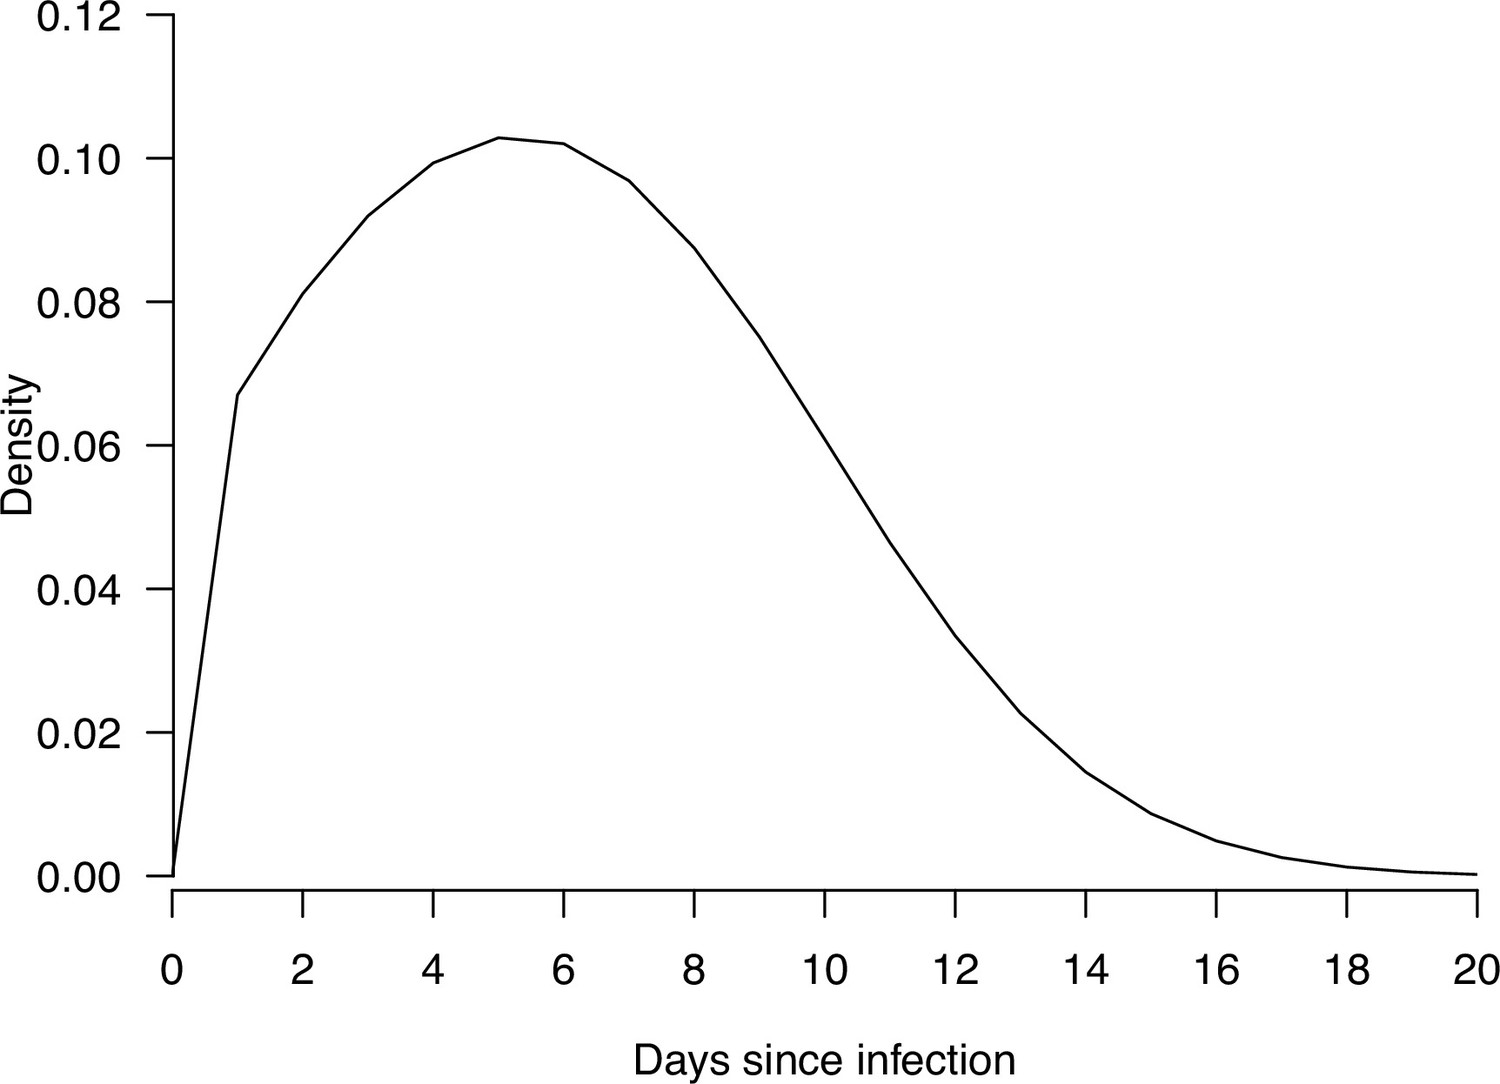
The density plot of the distribution of infectiousness profile since infections, used in the modeling analysis.
Tables
Appendix 1—table 1
Summary of characteristic of identified studies.
| Author (year) | Location | Study period | Case ascertainment method | Test coverage of identified contacts | SARS-COV-2 variant | Public health and social measures |
|---|---|---|---|---|---|---|
| Lyngse et al., 2022 | Denmark | February 2020 to August 2020 | Index: RT-PCR Secondary: RT-PCR | All contacts were tested | Ancestral strains | Lockdown |
| Carazo et al., 2022 | Canada | March 2020 to June 2020 | Index: RT-PCR Secondary: Symptom-based | NA | Ancestral strains | Handwashing, mask-wearing, and physical distancing |
| Laxminarayan et al., 2020 | India | March 2020 to July 2020 | Index: RT-PCR Secondary: RT-PCR | All contacts were tested | Ancestral strains | Lockdown, social distancing, contact tracing |
| Dattner et al., 2021 | Israel | March 2020 to June 2020 | Index: RT-PCR and Serology Secondary: RT-PCR and Serology | All contacts were tested | Ancestral strains | Lockdown |
| Layan et al., 2022 | Israel | December 2020 to April 2021 | Index: RT-PCR Secondary: RT-PCR | All contacts were tested | Ancestral strains, alpha | Vaccination |
| Hart et al., 2022 | UK | March 2020 to November 2020 | Index: RT-PCR Secondary: RT-PCR and antibody test | All contacts were tested | Ancestral strains | Isolation |
| Hubiche et al., 2021 | Canada | April 2020 to June 2020 | Index: Symptom-based and RT-PCR and serology Secondary: Symptom-based and RT-PCR and serology | NA | Ancestral strains | Closure of school |
| Wilkinson et al., 2021 | Manitoba, Canada | Mid-January 2020 to late March 2020 | Index: NAAT assay Secondary: NAAT assay | Only symptomatic contacts were tested | Ancestral strains | Isolation and contact tracing |
| Tsang et al., 2022 | Shandong Province, China | January 2020 to May 2020 | Index: RT-PCR Secondary: RT-PCR | All contacts were tested | Ancestral strains | Isolation, mask-waring, social distancing |
| Reukers et al., 2021 | Netherlands | March 2020 to May 2020 | Index: RT-PCR Secondary: RT-PCR | NA | Ancestral strains | Social distancing |
| Han et al., 2022 | Netherlands | March 2020 to April 2020 | Index: RT-PCR and serology Secondary: RT-PCR and serology | All contacts were tested | Ancestral strains | Social distancing, self-quarantine and self-isolation orders, closure of schools, bars and restaurants, and urging people to work from home |
| Méndez-Echevarría et al., 2021 | Madrid, Spain | March 2020 to May 2020 | Index: RT-PCR and serology Secondary: RT-PCR and serology | All contacts were tested | Ancestral strains | Lockdown |
| Dutta et al., 2020 | Rajasthan, India | May 2020 to July 2020 | Index: RT‐PCR Secondary: RT‐PCR | All contacts were tested | Ancestral strains | Lockdown and stay-at-home orders, physical distancing |
| Koureas et al., 2021 | Greece | April 2020 to June 2020 | Index: RT-PCR Secondary: RT-PCR | All contacts were tested | Ancestral strains | Quarantine, screening, movement restrictions and gathering prohibition, isolation |
| Bernardes-Souza et al., 2021; Méndez-Echevarría et al., 2021 | Brazil | May 2020 to June 2020 | Index: Serology and RT-PCR Secondary: Serology | All contacts were tested | Ancestral strains | Lockdown, gathering restrictions and face mask mandates |
| Posfay-Barbe et al., 2020 | Switzerland | March 2020 to April 2020 | Index: RT-PCR Secondary: RT-PCR | NA | Ancestral strains | Closure of schools, daycares, restaurants, bars, and shops, social distancing |
| Hsu et al., 2021 | Taiwan, China | January 2020 to February 2021 | Index: RT-PCR Secondary: RT-PCR | Only symptomatic contacts were tested | Ancestral strains, alpha | Mask-wearing, hand washing, and social distancing |
Appendix 1—table 2
Summary of model estimates.
| Article | Estimates of infectiousness variation | Estimates of probability of infection from community (10–2) | Estimates of probability of infection from household | Relationship between transmission and number of contacts ( |
|---|---|---|---|---|
| Lyngse et al. | 1.48 (1.29, 1.7) | 0.06 (0, 0.16) | 0.1 (0.08, 0.12) | 0.72 (0.59, 0.89) |
| Carazo et al. | 1.41 (1.19, 1.72) | 0.2 (0.01, 0.43) | 0.3 (0.24, 0.34) | 0.75 (0.62, 0.93) |
| Laxminarayan et al. | 2.44 (1.98, 3.23) | 0.03 (0, 0.11) | 0.04 (0.01, 0.07) | 0.92 (0.69, 1) |
| Dattner et al. | 1.12 (0.65, 1.69) | 0.63 (0.12, 1.06) | 0.31 (0.19, 0.42) | 0.65 (0.45, 0.91) |
| Layan et al. | 1.12 (0.74, 1.76) | 0.3 (0.02, 0.96) | 0.26 (0.15, 0.39) | 0.2 (0.01, 0.6) |
| Hart et al. | 0.35 (0.11, 0.96) | 0.74 (0.05, 2.12) | 0.51 (0.32, 0.65) | 0.72 (0.32, 0.98) |
| Hubiche et al. | 1.03 (0.45, 2.68) | 1.24 (0.14, 2.48) | 0.32 (0.06, 0.57) | 0.67 (0.13, 0.98) |
| Wilkinson et al. | 1.05 (0.12, 3.51) | 0.32 (0.02, 0.91) | 0.07 (0, 0.18) | 0.43 (0.02, 0.97) |
| Tsang et al. | 2.83 (1.48, 4.73) | 0.45 (0.05, 1.03) | 0.06 (0, 0.26) | 0.66 (0.06, 0.99) |
| Reukers et al. | 1.79 (0.72, 4.5) | 1.53 (0.18, 2.93) | 0.22 (0.01, 0.6) | 0.67 (0.07, 0.98) |
| Han et al. | 1.71 (0.51, 4.13) | 1.67 (0.19, 2.99) | 0.21 (0.02, 0.61) | 0.69 (0.07, 0.99) |
| Méndez-Echevarría et al. | 0.51 (0.13, 1.7) | 0.91 (0.05, 2.53) | 0.28 (0.06, 0.52) | 0.57 (0.04, 0.98) |
| Dutta et al. | 1.53 (0.5, 4.2) | 1.1 (0.12, 2.26) | 0.24 (0.01, 0.63) | 0.78 (0.15, 0.99) |
| Koureas et al. | 1.88 (0.6, 3.66) | 0.84 (0.1, 1.76) | 0.13 (0.01, 0.42) | 0.44 (0.02, 0.96) |
Appendix 1—table 3
Model adequacy check for Lyngse et al.
Each element of the table has the format observed frequency – expected (posterior mean) frequency (95% credible interval).
| Number of household contacts | Number of infected household contacts | |||||
|---|---|---|---|---|---|---|
| 0 | 1 | 2 | 3 | 4 | 5 | |
| 1 | 2366–2377 (2319, 2433) | 569–558 (502, 616) | NA | NA | NA | NA |
| 2 | 1117–1105 (1070, 1138) | 227–227 (198, 259) | 77–88 (69, 109) | NA | NA | NA |
| 3 | 1135–1118 (1077, 1156) | 214–235 (203, 267) | 89–86 (67, 106) | 41–41 (27, 56) | NA | NA |
| 4 | 521–528 (501, 555) | 119–115 (94, 137) | 40–42 (30, 56) | 25–19 (11, 30) | 11–10 (4, 18) | NA |
| 5 | 161–167 (152, 181) | 42–38 (27, 50) | 14–14 (7, 22) | 7–7 (2, 12) | 7–3 (0, 8) | 0–2 (0, 5) |
Appendix 1—table 4
Model adequacy check for Carazo et al.
Each element of the table has the format observed frequency – expected (posterior mean) frequency (95% credible interval).
| Number of household contacts | Number of infected household contacts | |||||
|---|---|---|---|---|---|---|
| 0 | 1 | 2 | 3 | 4 | 5 | |
| 1 | 803–814 (765, 862) | 532–521 (473, 570) | NA | NA | NA | NA |
| 2 | 476–454 (423, 485) | 179–186 (160, 212) | 154–169 (144, 195) | NA | NA | NA |
| 3 | 518–520 (483, 557) | 201–202 (175, 232) | 132–130 (107, 155) | 133–131 (106, 158) | NA | NA |
| 4 | 217–221 (197, 245) | 85–87 (70, 106) | 52–52 (39, 67) | 43–39 (27, 52) | 45–41 (28, 56) | NA |
| 5 | 76–74 (61, 88) | 30–30 (20, 41) | 20–18 (10, 26) | 13–12 (6, 20) | 7–10 (5, 17) | 10–11 (5, 18) |
Appendix 1—table 5
Model adequacy check for Laxminarayan et al.
Each element of the table has the format observed frequency – expected (posterior mean) frequency (95% credible interval).
| Number of household contacts | Number of infected household contacts | |||||||||
|---|---|---|---|---|---|---|---|---|---|---|
| 0 | 1 | 2 | 3 | 4 | 5 | 6 | 7 | 8 | 9 | |
| 1 | 124–134 (122, 144) | 37–27 (17, 39) | NA | NA | NA | NA | NA | NA | NA | NA |
| 2 | 135–137 (125, 147) | 12–18 (10, 27) | 20–12 (6, 20) | NA | NA | NA | NA | NA | NA | NA |
| 3 | 188–176 (163, 188) | 13–22 (13, 33) | 11–9 (4, 16) | 5–9 (4, 17) | NA | NA | NA | NA | NA | NA |
| 4 | 127–118 (108, 128) | 11–15 (8, 23) | 5–5 (1, 11) | 3–3 (0, 7) | 1–4 (1, 10) | NA | NA | NA | NA | NA |
| 5 | 75–76 (67, 84) | 12–10 (4, 16) | 3–3 (0, 8) | 1–2 (0, 5) | 1–1 (0, 4) | 3–2 (0, 6) | NA | NA | NA | NA |
| 6 | 41–40 (34, 46) | 7–5 (1, 10) | 2–2 (0, 5) | 0–1 (0, 3) | 0–0 (0, 3) | 0–0 (0, 2) | 1–1 (0, 3) | NA | NA | NA |
| 7 | 32–31 (25, 36) | 3–4 (1, 9) | 2–1 (0, 4) | 1–1 (0, 3) | 1–0 (0, 2) | 0–0 (0, 2) | 0–0 (0, 2) | 0–0 (0, 3) | NA | NA |
| 8 | 10–13 (10, 16) | 2–2 (0, 5) | 3–0 (0, 2) | 1–0 (0, 2) | 0–0 (0, 1) | 1–0 (0, 1) | 0–0 (0, 1) | 0–0 (0, 1) | 0–0 (0, 1) | NA |
| 9 | 14–16 (12, 20) | 2–2 (0, 6) | 1–1 (0, 3) | 2–0 (0, 2) | 1–0 (0, 2) | 0–0 (0, 1) | 0–0 (0, 1) | 0–0 (0, 1) | 0–0 (0, 1) | 1–0 (0, 2) |
Appendix 1—table 6
Model adequacy check for Dattner et al.
Each element of the table has the format observed frequency – expected (posterior mean) frequency (95% credible interval).
| Number of household contacts | Number of infected household contacts | |||||||||
|---|---|---|---|---|---|---|---|---|---|---|
| 0 | 1 | 2 | 3 | 4 | 5 | 6 | 7 | 8 | 9 | |
| 1 | 85–93 (77, 108) | 73–65 (50, 81) | NA | NA | NA | NA | NA | NA | NA | NA |
| 2 | 46–42 (32, 52) | 21–25 (17, 34) | 19–19 (11, 28) | NA | NA | NA | NA | NA | NA | NA |
| 3 | 38–29 (21, 38) | 13–18 (11, 25) | 9–12 (6, 19) | 8–9 (4, 15) | NA | NA | NA | NA | NA | NA |
| 4 | 24–24 (16, 32) | 19–15 (9, 23) | 11–10 (5, 17) | 8–7 (3, 13) | 1–5 (1, 11) | NA | NA | NA | NA | NA |
| 5 | 25–21 (14, 30) | 15–15 (9, 22) | 12–10 (5, 17) | 7–7 (3, 13) | 3–5 (2, 10) | 2–4 (1, 9) | NA | NA | NA | NA |
| 6 | 13–16 (9, 23) | 19–12 (6, 18) | 3–8 (3, 14) | 5–6 (2, 11) | 3–5 (1, 9) | 5–3 (0, 7) | 5–2 (0, 6) | NA | NA | NA |
| 7 | 5–9 (4, 15) | 6–7 (3, 13) | 5–5 (2, 10) | 7–4 (1, 8) | 4–3 (0, 7) | 4–2 (0, 6) | 4–2 (0, 5) | 0–1 (0, 4) | NA | NA |
| 8 | 10–8 (3, 14) | 7–7 (3, 12) | 3–5 (1, 10) | 4–4 (1, 8) | 0–3 (0, 7) | 3–2 (0, 6) | 3–2 (0, 5) | 4–1 (0, 4) | 0–1 (0, 4) | NA |
| 9 | 6–6 (2, 12) | 3–6 (2, 10) | 4–4 (1, 9) | 6–3 (0, 7) | 4–3 (0, 6) | 1–2 (0, 5) | 2–2 (0, 5) | 2–1 (0, 4) | 2–1 (0, 3) | 0–0 (0, 3) |
Appendix 1—table 7
Comparison of model estimates from 100k Markov chain Monte Carlo (MCMC) iterations and 500k MCMC iterations.
| Article | Number of MCMC iterations | Estimates of infectiousness variation | Estimates of probability of infection from community (10–2) | Estimates of probability of infection from household | Relationship between transmission and number of contacts ( |
|---|---|---|---|---|---|
| Lyngse et al. | 100,000 | 1.48 (1.29, 1.7) | 0.06 (0, 0.16) | 0.11 (0.08, 0.13) | 0.72 (0.59, 0.89) |
| 500,000 | 1.49 (1.29, 1.84) | 0.07 (0, 0.2) | 0.1 (0.07, 0.13) | 0.74 (0.6, 0.92) | |
| Carazo et al. | 100,000 | 1.41 (1.19, 1.72) | 0.2 (0.01, 0.43) | 0.35 (0.27, 0.42) | 0.75 (0.62, 0.93) |
| 500,000 | 1.44 (1.19, 1.78) | 0.21 (0.02, 0.46) | 0.34 (0.26, 0.41) | 0.77 (0.62, 0.95) | |
| Laxminarayan et al. | 100,000 | 2.44 (1.98, 3.23) | 0.03 (0, 0.11) | 0.04 (0.01, 0.08) | 0.92 (0.69, 1) |
| 500,000 | 2.47 (1.99, 3.23) | 0.03 (0, 0.11) | 0.04 (0.01, 0.07) | 0.92 (0.67, 1) | |
| Dattner et al. | 100,000 | 1.12 (0.65, 1.69) | 0.63 (0.12, 1.06) | 0.37 (0.21, 0.54) | 0.65 (0.45, 0.91) |
| 500,000 | 1.06 (0.65, 1.55) | 0.57 (0.1, 1) | 0.38 (0.24, 0.54) | 0.63 (0.43, 0.88) |
Appendix 1—table 8
Simulation study for validating the estimates and the corresponding power.
| Parameter | Simulation value | Mean estimate | Proportion covered (over 50) |
|---|---|---|---|
| Lyngse et al. | |||
| : Infectiousness variation | 1.48 | 1.57 | 0.94 |
| : hazard of infection from outside the household (10–2) | 0.06 | 0.12 | 0.88 |
| : hazard of infection from an infected household member | 0.11 | 0.09 | 0.92 |
| relationship between number of household contacts and transmission rate | 0.72 | 0.75 | 0.96 |
| Carazo et al. | |||
| : Infectiousness variation | 1.41 | 1.49 | 0.94 |
| : hazard of infection from outside the household (10–2) | 0.2 | 0.24 | 0.96 |
| : hazard of infection from an infected household member | 0.35 | 0.33 | 0.92 |
| relationship between number of household contacts and transmission rate | 0.75 | 0.77 | 0.96 |
| Laxminarayan et al. | |||
| : Infectiousness variation | 2.44 | 2.6 | 0.94 |
| : hazard of infection from outside the household (10–2) | 0.03 | 0.05 | 0.96 |
| : hazard of infection from an infected household member | 0.04 | 0.03 | 0.9 |
| relationship between number of household contacts and transmission rate | 0.92 | 0.82 | 1 |
| Dattner et al. | |||
| : Infectiousness variation | 1.12 | 1.18 | 0.92 |
| : hazard of infection from outside the household (10–2) | 0.63 | 0.69 | 0.92 |
| : hazard of infection from an infected household member | 0.37 | 0.36 | 0.96 |
| relationship between number of household contacts and transmission rate | 0.65 | 0.68 | 0.98 |
Appendix 1—table 9
A sensitivity analysis of using normal distribution (main analysis) instead of lognormal distribution (sensitivity analysis) for individual infectiousness.
| Article | Model | Estimates of infectiousness variation | Estimates of probability of infection from community (10–2) | Estimates of probability of infection from household | Relationship between transmission and number of contacts ( | Difference in DIC |
|---|---|---|---|---|---|---|
| Lyngse et al. | Main analysis | 1.48 (1.29, 1.7) | 0.06 (0, 0.16) | 0.11 (0.08, 0.13) | 0.72 (0.59, 0.89) | |
| Sensitivity analysis | 0.93 (0.84, 1.03) | 0.03 (0, 0.11) | 0.06 (0.05, 0.07) | 0.7 (0.58, 0.83) | 2821 | |
| Carazo et al. | Main analysis | 1.41 (1.19, 1.72) | 0.2 (0.01, 0.43) | 0.35 (0.27, 0.42) | 0.75 (0.62, 0.93) | |
| Sensitivity analysis | 1.05 (0.92, 1.21) | 0.06 (0, 0.24) | 0.18 (0.16, 0.2) | 0.71 (0.59, 0.84) | 2569 | |
| Laxminarayan et al. | Main analysis | 2.44 (1.98, 3.23) | 0.03 (0, 0.11) | 0.04 (0.01, 0.08) | 0.92 (0.69, 1) | |
| Sensitivity analysis | 1.31 (1.14, 1.48) | 0.02 (0, 0.08) | 0.05 (0.03, 0.06) | 0.91 (0.66, 1) | 818 | |
| Dattner et al. | Main analysis | 1.12 (0.65, 1.69) | 0.63 (0.12, 1.06) | 0.37 (0.21, 0.54) | 0.65 (0.45, 0.91) | |
| Sensitivity analysis | 0.66 (0.47, 0.88) | 0.3 (0.02, 0.71) | 0.18 (0.13, 0.22) | 0.56 (0.4, 0.75) | 908 |
Appendix 1—table 10
Summary of characteristic of identified studies.
SD: standard deviation.
| Article | Number of households | Number of contacts | Number of secondary cases | Mean number of contacts | SD of number of contact | Secondary attack rate (SAR) | SD of number of secondary cases () |
|---|---|---|---|---|---|---|---|
| Lyngse et al. | 6782 | 14,233 | 1902 | 2.1 (2.07, 2.13) | 1.17 (1.15, 1.19) | 0.13 (0.13, 0.14) | 0.6 (0.59, 0.61) |
| Carazo et al. | 3727 | 8460 | 2574 | 2.27 (2.23, 2.31) | 1.19 (1.16, 1.21) | 0.3 (0.29, 0.31) | 0.97 (0.95, 0.99) |
| Laxminarayan et al. | 915 | 3113 | 283 | 3.4 (3.28, 3.53) | 1.94 (1.86, 2.04) | 0.09 (0.08, 0.1) | 0.81 (0.77, 0.85) |
| Dattner et al. | 591 | 2211 | 720 | 3.74 (3.54, 3.94) | 2.5 (2.36, 2.65) | 0.33 (0.31, 0.35) | 1.6 (1.51, 1.7) |
| Layan et al. | 208 | 670 | 264 | 3.22 (3.01, 3.44) | 1.58 (1.45, 1.75) | 0.39 (0.36, 0.43) | 1.59 (1.45, 1.76) |
| Hart et al. | 172 | 433 | 194 | 2.52 (2.34, 2.69) | 1.16 (1.05, 1.29) | 0.45 (0.4, 0.5) | 1.11 (1, 1.24) |
| Hubiche et al. | 103 | 291 | 119 | 2.83 (2.6, 3.05) | 1.18 (1.04, 1.37) | 0.41 (0.35, 0.47) | 1.14 (1, 1.32) |
| Wilkinson et al. | 95 | 220 | 26 | 2.32 (2.02, 2.61) | 1.47 (1.28, 1.71) | 0.12 (0.08, 0.17) | 0.66 (0.58, 0.77) |
| Tsang et al. | 47 | 189 | 38 | 4.02 (3.39, 4.66) | 2.22 (1.85, 2.79) | 0.2 (0.15, 0.27) | 1.31 (1.09, 1.65) |
| Reukers et al. | 55 | 187 | 78 | 3.4 (3.11, 3.69) | 1.1 (0.93, 1.35) | 0.42 (0.35, 0.49) | 1.33 (1.12, 1.64) |
| Han et al. | 55 | 185 | 78 | 3.36 (3.08, 3.65) | 1.08 (0.91, 1.33) | 0.42 (0.35, 0.5) | 1.27 (1.07, 1.57) |
| Méndez-Echevarría et al. | 63 | 174 | 57 | 2.76 (2.57, 2.95) | 0.78 (0.66, 0.94) | 0.33 (0.26, 0.4) | 0.96 (0.82, 1.17) |
| Dutta et al. | 32 | 170 | 55 | 5.31 (4.52, 6.1) | 2.28 (1.83, 3.03) | 0.32 (0.25, 0.4) | 1.59 (1.28, 2.12) |
| Koureas et al. | 32 | 153 | 50 | 4.78 (3.94, 5.62) | 2.43 (1.95, 3.23) | 0.33 (0.25, 0.41) | 2.14 (1.72, 2.84) |
| Bernardes-Souza et al. | 40 | 112 | 55 | 2.8 (2.33, 3.27) | 1.51 (1.23, 1.93) | 0.49 (0.4, 0.59) | 1.48 (1.21, 1.9) |
| Posfay-Barbe et al. | 39 | 111 | 46 | 2.85 (2.54, 3.16) | 0.99 (0.81, 1.27) | 0.41 (0.32, 0.51) | 0.94 (0.77, 1.21) |
| Hsu et al. | 38 | 96 | 49 | 2.53 (2.12, 2.93) | 1.27 (1.03, 1.64) | 0.51 (0.41, 0.61) | 0.87 (0.71, 1.12) |
Appendix 1—table 11
Association between infectiousness variation estimated from household transmission models, and other statistics from 17 household studies, based on meta-regression.
| Statistic | Infectiousness variation (*) | Standard deviation (SD) of the distribution of number of secondary cases () | Secondary attack rate (SAR) |
|---|---|---|---|
| Pooled estimates | 1.33 (0.95, 1.70) | 1.19 (1.03, 1.35) | 0.35 (0.28, 0.44) |
| I2 | 78.4 | 99.2 | 99.1 |
| Factors | |||
| Estimate | β | β | exp (β) |
| Mean number of contacts | 0.31 (−0.16, 0.78) | 0.35 (0.22, 0.48) | 1.09 (0.83, 1.43) |
| SD number of contacts | 0.55 (−0.12, 1.21) | 0.42 (0.15, 0.69) | 0.80 (0.51, 1.25) |
| Implementation of lockdown | 0.16 (−0.61, 0.93) | –0.06 (−0.40, 0.28) | 0.69 (0.43, 1.10) |
| Index cases are confirmed by PCR only | 0.48 (−0.32, 1.29) | 0.02 (−0.33, 0.38) | 1.09 (0.65, 1.85) |
| Secondary cases are confirmed by PCR only | 0.78 (0.13, 1.43) | 0.03 (−0.30, 0.35) | 0.88 (0.55, 1.41) |
| Only ancestral strains are circulating in study period | 0.76 (−0.03, 1.55) | 0.07 (−0.31, 0.45) | 0.75 (0.43, 1.30) |
| All household contacts were tested | 0.03 (−0.87, 0.93) | 0.28 (−0.04, 0.59) | 0.96 (0.58, 1.58) |
-
*
Estimates based on results from 14 studies
Appendix 1—table 12
Pooled estimates for duration of viral shedding for COVID-19 from 11 systematic reviews.
| Study | Sampling site | Laboratory method | Pooled estimates (mean/median) | 95% CI | Range | I2 |
|---|---|---|---|---|---|---|
| Cevik | Upper respiratory tract | PCR | 17.0 | 15.5–18.6 | 6.0–53·9 | |
| Cevik | Lower respiratory tract | PCR | 14.6 | 9.3–20.0 | 6.2–22.7 | 97% |
| Cevik | Stool | Viral culture | 17.2 | 14.4–20.1 | 9.8–27.9 | 96.6% |
| Cevik | Serum/blood | Viral culture | 16.6 | 3.6–29.7 | 10.0–23.3 | 99% |
| Fontana | Respiratory sources | PCR | 18.4* | 15.5–21.3 | 5.5–53.5 | 98.87% |
| Fontana | Rectal/stool | PCR | 22.1* | 14.4–29.8 | 11–33 | 95.86% |
| Okita | Upper respiratory tract (nasal swab+throat swab) | PCR | 18.29 | 17.00–19.89 | 8.33–39.97 | 99% |
| Okita | Sputum | PCR | 23.79 | 20.43–27.16 | 15.50–32.00 | 93% |
| Okita | Blood | PCR | 14.60 | 12.16–17.05 | 11.00–17.58 | 88% |
| Okita | Stool | PCR | 22.38 | 18.40–26.35 | 10.67–51.40 | 97% |
| Qutub | Respiratory tract | Viral culture | 28.75/11** | 8.5–14.5 | ||
| Rahmani | Respiratory tract | PCR | 27.90 | 23.27–32.52 | 7.40–132.00 | 99.1% |
| Xu | Respiratory tract (symptomatic cases) | PCR | 11.1±5.8*** | 0–24 | ||
| Xu | Gastrointestinal tract (symptomatic cases) | PCR | 23.6±8.8*** | 10–33 | ||
| Yan | Unrestricted | PCR | 16.8 | 14.8–19.4 | 99.56% | |
| Yan | Stool | PCR | 30.3 | 23.1–39.2 | 92.09% | |
| Yan | Respiratory tract | PCR | 17.5 | 14.9–20.6 | 99.67% | |
| Yan | Upper respiratory tract | PCR | 17.5 | 14.6–21.0 | 99.53% | |
| Diaz | Stool | PCR | 22* | 19–25 | ||
| Chen | (Asymptomatic infections) | 14.14* | 11.25–17.04 | 11.00–17.25 | ||
| Li | Upper respiratory tract (nasopharyngeal/throat swabs) | PCR | 11.43 | 10.1–12.77 | 75.3% | |
| Zhang | Stool | PCR | 21.8 | 16.4–27.1 | ||
| Zhang | Respiratory tract | PCR | 14.7 | 9.9–19.5 |
-
*
Median estimate, **median/grouped median, ***this study analyzed by cases, and reported mean ± SD.
Appendix 1—table 13
Pooled estimates for duration of viral shedding for COVID-19 in subgroups from seven systematic reviews.
| Study | Sampling site (subgroups) | Laboratory method | Pooled estimates (mean/median) | 95% CI | Range | I2 |
|---|---|---|---|---|---|---|
| Fontana | Respiratory sources (among severely ill patients) | PCR | 19.8* | 16.2–23.5 | 11–31 | 96.42% |
| Fontana | Respiratory sources (in mild-to-moderate illness) | PCR | 17.2* | 14.0–20.5 | 8–25 | 95.64% |
| Okita | Upper respiratory tract (nasal swab) | PCR | 19.34 | 16.60–22.07 | 99% | |
| Okita | Upper respiratory tract (throat swab) | PCR | 17.85 | 16.43–19.26 | 98% | |
| Okita | Upper respiratory tract (age < 60) | PCR | 16.95 | 13.56–20.35 | 8.62–35.67 | 98% |
| Okita | Upper respiratory tract (age ≥ 60) | PCR | 21.24 | 14.06–28.41 | 8.25–40.33 | 99% |
| Okita | Upper respiratory tract (with comorbidities) | PCR | 20.26 | 17.60–22.92 | 9.67–34.00 | 93% |
| Okita | Upper respiratory tract (without comorbidities) | PCR | 14.66 | 12.63–16.69 | 10.82–27.25 | 85% |
| Okita | Upper respiratory tract (severe patients) | PCR | 20.79 | 18.03–23.55 | 14.00–38.33 | 98% |
| Okita | Upper respiratory tract (nonsevere patients) | PCR | 16.36 | 14.07–18.66 | 8.00–37.33 | 99% |
| Okita | Upper respiratory tract (severe patients) (for studies with mean age ≥ 40 + comorbidity > 30%) | PCR | 21.53 | 17.57–25.50 | 14.00–29.50 | 91% |
| Okita | Upper respiratory tract (severe patients) (for studies with mean age ≥ 40 + comorbidity >30%) | PCR | 20.08 | 15.87–24.29 | 13.12–33.67 | 100% |
| Okita | Upper respiratory tract (treated with glucocorticoid) | PCR | 19.72 | 17.92–21.52 | 13.87–33.67 | 92% |
| Okita | Upper respiratory tract (treated without glucocorticoid) | PCR | 15.64 | 14.18–17.10 | 8.33–31.60 | 96% |
| Okita | Upper respiratory tract (treated with glucocorticoid) (for studies with mean age: 30–60+comorbidity > 50%) | PCR | 21.98 | 16.48–27.48 | 14.25–33.67 | 94% |
| Okita | Upper respiratory tract (treated without glucocorticoid) (for studies with mean age: 30–60+comorbidity > 50%) | PCR | 16.14 | 12.60–19.68 | 13.22–24.44 | 92% |
| Okita | Upper respiratory tract (Asian) | PCR | 18.10 | 16.95–19.25 | 8.33–34.75 | 98% |
| Okita | Upper respiratory tract (European) | PCR | 19.27 | 11.59–26.95 | 8.50–39.97 | 100% |
| Okita | Upper respiratory tract (Asian) (for studies with mean age ≥ 40 + comorbidity >40%) | PCR | 20.66 | 18.18–23.14 | 12.00–32.00 | 96% |
| Okita | Upper respiratory tract (European) (for studies with mean age ≥ 40 + comorbidity > 40%) | PCR | 23.68 | 10.85–36.51 | 13.00–39.97 | 100% |
| Qutub | Respiratory tract (severe patients) | Viral culture | 47.5/20** | 9.0–53.0 | ||
| Qutub | Respiratory tract (severe patients were not specified of excluded) | Viral culture | 10/9** | 8.0–13.0 | ||
| Qutub | Respiratory tract (immunocompromised patients) | Viral culture | 54.36/20** | 9.0–85.98 | ||
| Qutub | Respiratory tract (immunocompromised patients were not specified of excluded) | Viral culture | 11.67/9** | 8.2–13.3 | ||
| Rahmani | Not specific (immunocompetent individuals) | PCR | 26.54 | 21.44–31.64 | 7.40–91.20 | 99.3% |
| Rahmani | Not specific (immunocompromised individuals) | PCR | 36.28 | 21.93–50.63 | 15.90–132.00 | 94.2% |
| Xu | Respiratory tract (asymptomatic cases) | PCR | 9.4±5.1*** | |||
| Xu | Gastrointestinal tract (asymptomatic cases) | PCR | 16.8±9.8*** | |||
| Yan | Unrestricted (symptomatic cases) | PCR | 19.7 | 17.2–22.7 | 99.34% | |
| Yan | Unrestricted (asymptomatic cases) | PCR | 10.9 | 8.3–14.3 | 98.89% | |
| Yan | Unrestricted (severe patients) | PCR | 24.3 | 18.9–31.1 | 91.88% | |
| Yan | Unrestricted (nonsevere patients) | PCR | 22.8 | 16.4–32.0 | 99.81% | |
| Yan | Unrestricted (females) | PCR | 19.4 | 9.5–39.4 | 93.93% | |
| Yan | Unrestricted (males) | PCR | 11.9 | 8.4–16.9 | 87.83% | |
| Yan | Unrestricted (adults) | PCR | 23.2 | 19.0–28.4 | 99.24% | |
| Yan | Unrestricted (children) | PCR | 9.9 | 8.1–12.2 | 85.74% | |
| Yan | Unrestricted (with chronic diseases) | PCR | 24.2 | 19.2–30.2 | 84.07% | |
| Yan | Unrestricted (without chronic diseases) | PCR | 11.5 | 5.3–25.0 | 82.11% | |
| Yan | Unrestricted (treated with corticosteroid) | PCR | 28.3 | 25.6–31.2 | 0.00% | |
| Yan | Unrestricted (treated without corticosteroid) | PCR | 16.2 | 11.5–22.5 | 92.27% | |
| Yan | Unrestricted (antiviral treatment) | PCR | 17.6 | 13.4–22.2 | 98.99% | |
| Yan | Unrestricted (mono-antiviral treatment) | PCR | 21.2 | 15.3–29.2 | 90.04% | |
| Yan | Unrestricted (multiantiviral treatment) | PCR | 20.3 | 13.7–30.3 | 99.46% | |
| Chen | Unrestricted (asymptomatic infections) | PCR or serum antibody | 14.14* | 11.25–17.04 | 11.00–17.25 |
-
*
Median estimate, **median/grouped median, ***this study analyzed by cases, and reported mean ± SD.
Appendix 1—table 14
Pooled estimates for duration of infectious period for COVID-19 in subgroups from two systematic reviews.
| Study | Sampling site (subgroups) | Laboratory method | Pooled estimates | 95% CI | Range | I2 |
|---|---|---|---|---|---|---|
| Rahmani | Replicant competent virus isolation | Viral culture | 7.27 | 5.70–8.84 | 3.40–89.00 | 92.2% |
| Wang | Not specific | Not specific | 6.25 | 5.09–7.51 | ||
| Rahmani | Replicant competent virus isolation (immunocompetent individuals) | Viral culture | 6.33 | 4.92–7.75 | 3.00–13.00 | 92.4% |
| Rahmani | Replicant competent virus isolation (immunocompromised individuals) | Viral culture | 29.50 | 12.46–46.53 | 13.80–89.00 | 84.8% |
Appendix 1—table 15
Probability distributions of the incubation period and relative infectivity levels during the infectious period.
For the infectious period, day 0 corresponds to the symptom onset day. These two distributions are used to generate the infectiousness profile since infections.
| Day | Incubation period | Infectious period | |
|---|---|---|---|
| Mean = 5 days | Day | Max = 13 days | |
| 1 | 0.058 | −5 | 1.0 |
| 2 | 0.11 | −4 | 1.0 |
| 3 | 0.14 | −3 | 1.0 |
| 4 | 0.16 | −2 | 1.0 |
| 5 | 0.15 | −1 | 1.0 |
| 6 | 0.13 | 0 | 1.0 |
| 7 | 0.10 | 1 | 1.0 |
| 8 | 0.068 | 2 | 1.0 |
| 9 | 0.044 | 3 | 0.8 |
| 10 | 0.026 | 4 | 0.6 |
| 11 | 0.014 | 5 | 0.4 |
| 12 | 0.0072 | 6 | 0.2 |
| 13 | 0.0034 | 7 | 0.1 |
| 14 | 0.0015 | 8 |
Author response table 1
| Study | Pearson’s correlation | Shearman’s correlation |
|---|---|---|
| Lyngse, et al. | 0.00 (-0.02, 0.03) | 0.00 (-0.03, 0.02) |
| Carazo, et al. | 0.00 (-0.03, 0.04) | 0.00 (-0.03, 0.03) |
| Laxminarayan, et al. | 0.00 (-0.07, 0.05) | -0.02 (-0.08, 0.03) |
| Dattner, et al. | 0.01 (-0.07, 0.09) | 0.00 (-0.08, 0.09) |
Additional files
Download links
A two-part list of links to download the article, or parts of the article, in various formats.
Downloads (link to download the article as PDF)
Open citations (links to open the citations from this article in various online reference manager services)
Cite this article (links to download the citations from this article in formats compatible with various reference manager tools)
The effect of variation of individual infectiousness on SARS-CoV-2 transmission in households
eLife 12:e82611.
https://doi.org/10.7554/eLife.82611


