Mouse B2 SINE elements function as IFN-inducible enhancers
- Department of Molecular, Cellular, and Developmental Biology and BioFrontiers Institute, University of Colorado Boulder, United States
Figures
Figure 1 with 2 supplements
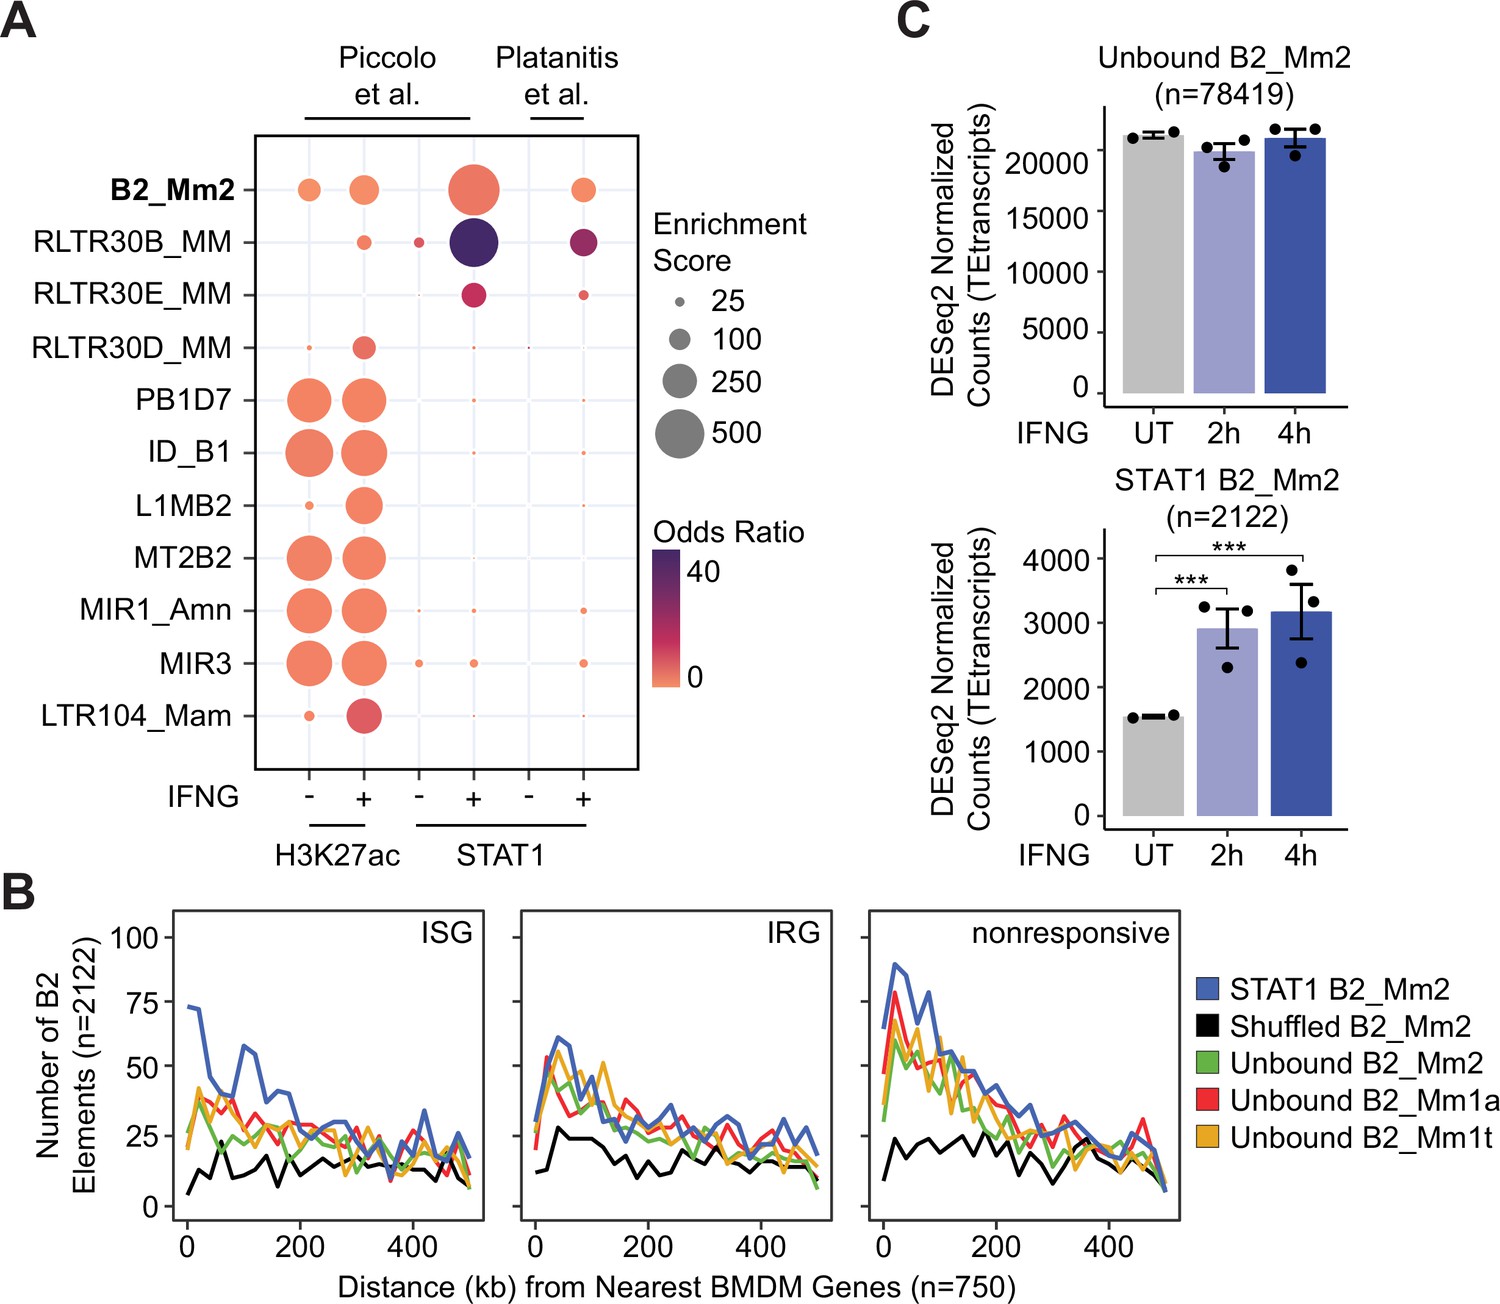
Identification of transposon-derived enhancers in innate immunity.
(A) Bubble plot showing family-level enrichment of transposons within ChIP-seq peak regions. TE families enriched for STAT1 and H3K27ac ChIP-seq peaks are sorted by descending median Kimura distance. GIGGLE enrichment score is a composite of the product of both -log10(p-value) and log2(odds ratio). (B) Frequency histogram of absolute distances from STAT1-bound B2_Mm2 (blue, n=2,122), randomly shuffled B2_Mm2 (black, n=2,122), and randomly subset unbound B2_Mm2 (green, n=2,122), B2_Mm1a (red, n=2,122), and B2_Mm1t (yellow, n=2,122) elements to the nearest ISG (n=750), IRG (n=750), or nonresponsive gene (n=750). Data shown for (Piccolo et al., 2017) comparing expression in BMDMs stimulated with IFNG for 4 hr relative to untreated. (C) DESeq2 normalized counts showing immune-stimulated expression of unbound B2_Mm2 (top, n=78,419) and STAT1-bound B2_Mm2 (bottom, n=2122) elements in murine BMDMs. Data shown for untreated (n=2) BMDMs and BMDMs stimulated with IFNG for 2 hr (n=3) or 4 hr (n=3). Treatments are indicated by color. ***DESeq2 FDR adjusted p-value <0.0001. Error bars designate SEM. Data shown for (Piccolo et al., 2017). ISG: Interferon-stimulated gene; IRG: Interferon-repressed gene. BMDMs: Bone marrow derived macrophages. SEM: Standard error of mean.
Figure 1—figure supplement 1
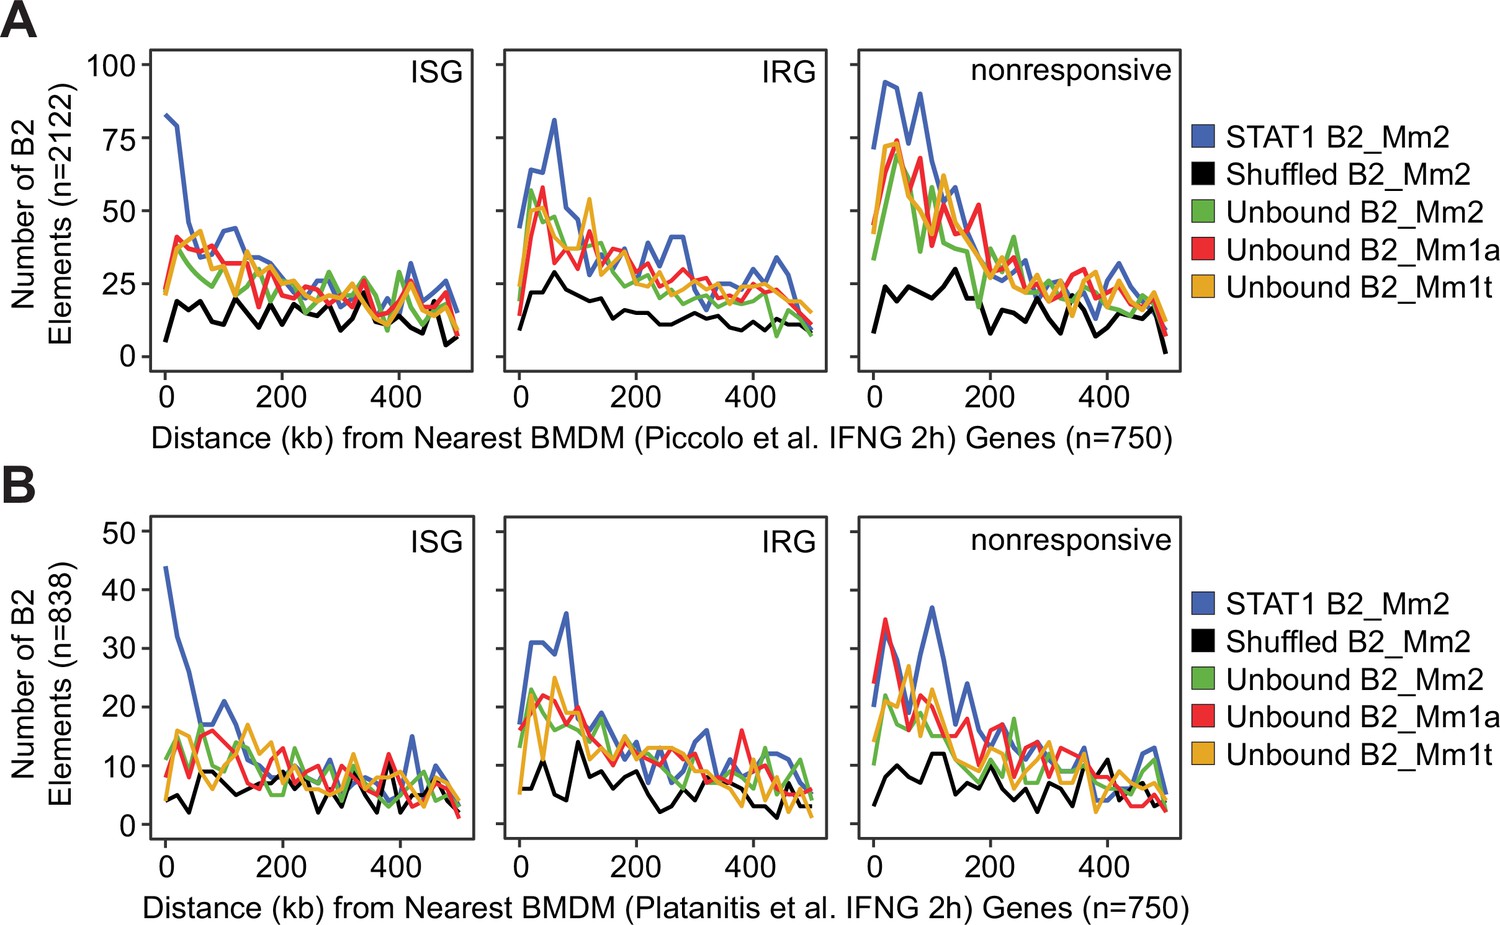
Distances from each B2 element to the nearest ISG.
(A) Frequency histogram of absolute distances from size-normalized sets of B2 elements to the nearest ISG (n=750), IRG (n=750), or nonresponsive gene (n=750). STAT1-bound B2_Mm2 (blue, n=2,122), randomly shuffled B2_Mm2 (black, n=2,122), and randomly subset unbound B2_Mm2 (green, n=2122), B2_Mm1a (red, n=2,122), and B2_Mm1t (yellow, n=2,122) elements. Data shown for Piccolo et al., 2017 where bone-marrow-derived macrophages were stimulated with IFNG for 2 hr. (B) Same as in (A) but for a subset of B2 elements (n=838) marked by STAT1. Data shown for Platanitis et al., 2019 where macrophages were stimulated with IFNG for 2 hr. ISG: Interferon Stimulated Gene.
Figure 1—figure supplement 2
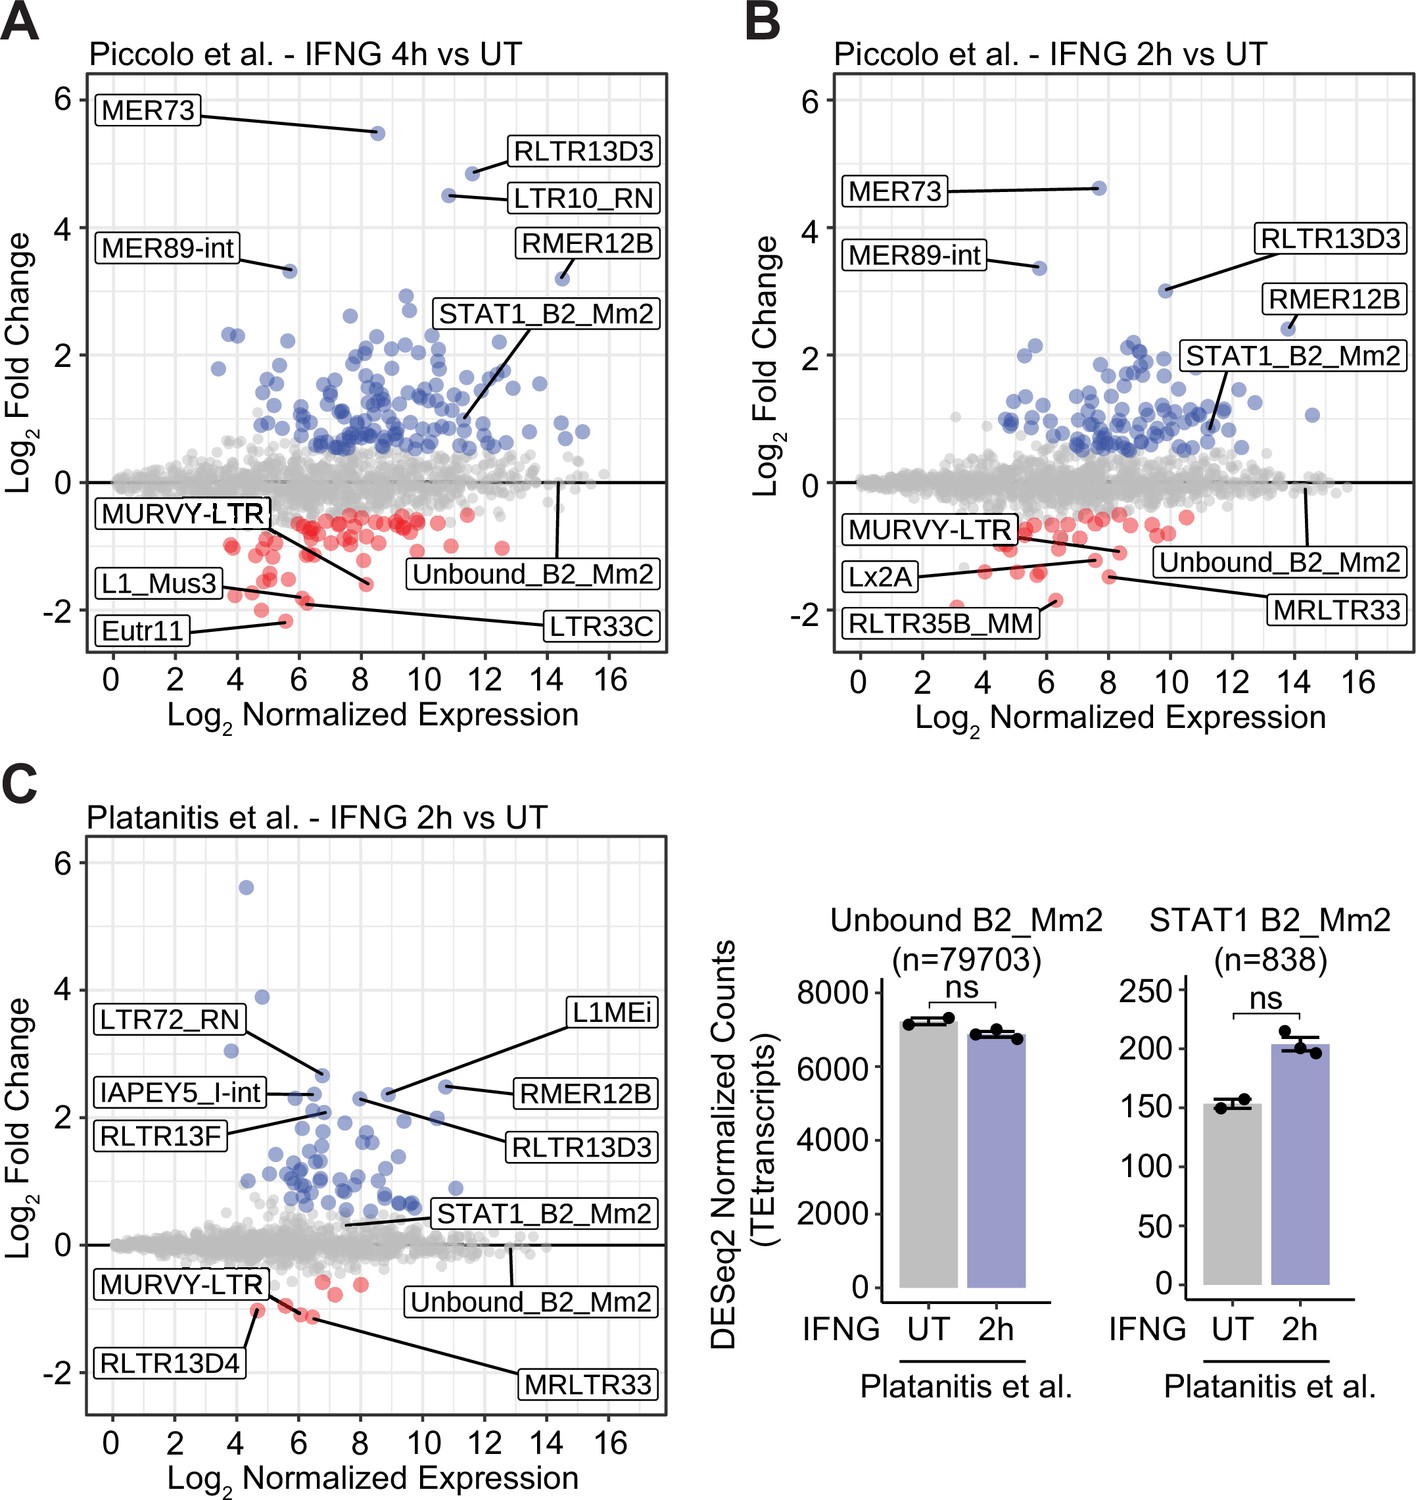
IFNG-inducible TE expression in murine BMDMs.
(A) MA plot visualizing immune-stimulated changes in TE family-level expression according to DESeq2-normalized RNA-seq data from murine BMDMs stimulated with IFNG for 4 hr. Unbound B2_Mm2 (n=78,419) and STAT1-bound B2_Mm2 (n=2,122, defined through Piccolo et al., 2017 IFNG 2 hr ChIP-seq) are designated separately. Significantly downregulated (log2FC <–0.50, FDR <0.05) families are shown in red while significantly upregulated (log2FC >0.50, FDR <0.05) families are shown in blue. (B) Same as in (A) but using RNA-seq from BMDMs stimulated with IFNG for 2 hr. (C) MA plot (left) and DESeq2 normalized counts (right) visualizing immune-stimulated changes in TE family-level expression according to RNA-seq from murine BMDMs stimulated with IFNG for 2 hr. Unbound B2_Mm2 (n=79,703) and STAT1-bound B2_Mm2 (n=838, defined through Platanitis et al., 2019 IFNG 1.5 hr ChIP-seq) are designated separately. Individual points are colored as in (A). DESeq2-normalized counts shown for untreated (n=2) BMDMs and BMDMs stimulated with IFNG for 2 hr (n=3). Error bars designate SEM. BMDM: Bone-marrow-derived macrophage.
Figure 2 with 3 supplements

Epigenomic profiling of B2_Mm2.
(A) Heatmaps showing CPM-normalized ChIP-seq signal and motif signal centered over B2_Mm2 elements bound only by STAT1 (n=1,203); B2_Mm2 bound by both STAT1 and CTCF (n=893); B2_Mm2 bound only by CTCF (n=4,143); and a random subset of unbound B2_Mm2 (n=1,000). Regions are sorted by descending mean CPM signal. Signal intensity is indicated below. CTCF track derived from Gualdrini et al., 2022. RAD21 track derived from Cuartero et al., 2018. (B) Schematic of GAS (blue) and CTCF (green) motifs present within extant B2_Mm2 (left, n=80,541), B2_Mm1a (middle, n=16,321), and B2_Mm1t (right, n=35,812) sequences. Heatmap intensity corresponds to motif matches based on the log likelihood ratio. Heatmaps are sorted by descending mean signal. Position weight matrices were obtained from JASPAR (Fornes et al., 2020). CPM: Counts per million. GAS: Gamma-IFN activated sequence.
Figure 2—figure supplement 1
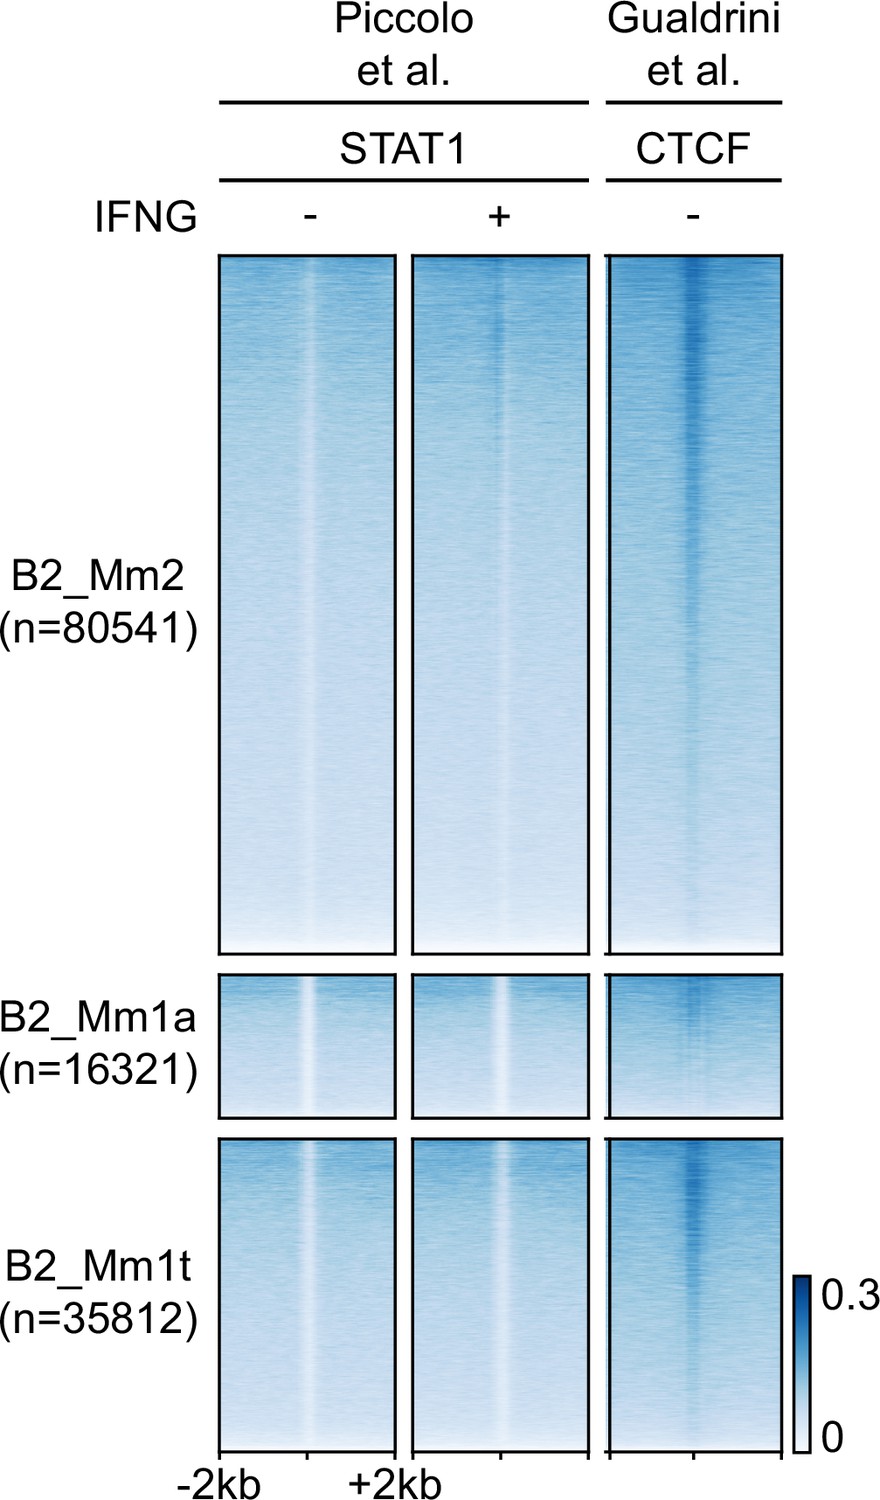
STAT1 and CTCF occupancy overlapping all B2 elements in murine BMDMs.
Heatmaps showing CPM-normalized ChIP-seq signal over B2_Mm2 (n=79,073), B2_Mm1a (n=16,223), and B2_Mm1t elements (n=35,428) over a 4 kb window. Elements without overlapping ChIP-seq signal were excluded. Regions are sorted by descending mean CPM signal. Signal intensity is indicated to the right. STAT1 tracks derived from Piccolo et al., 2017. CTCF track derived from Gualdrini et al., 2022. CPM: Counts per million.
Figure 2—figure supplement 2
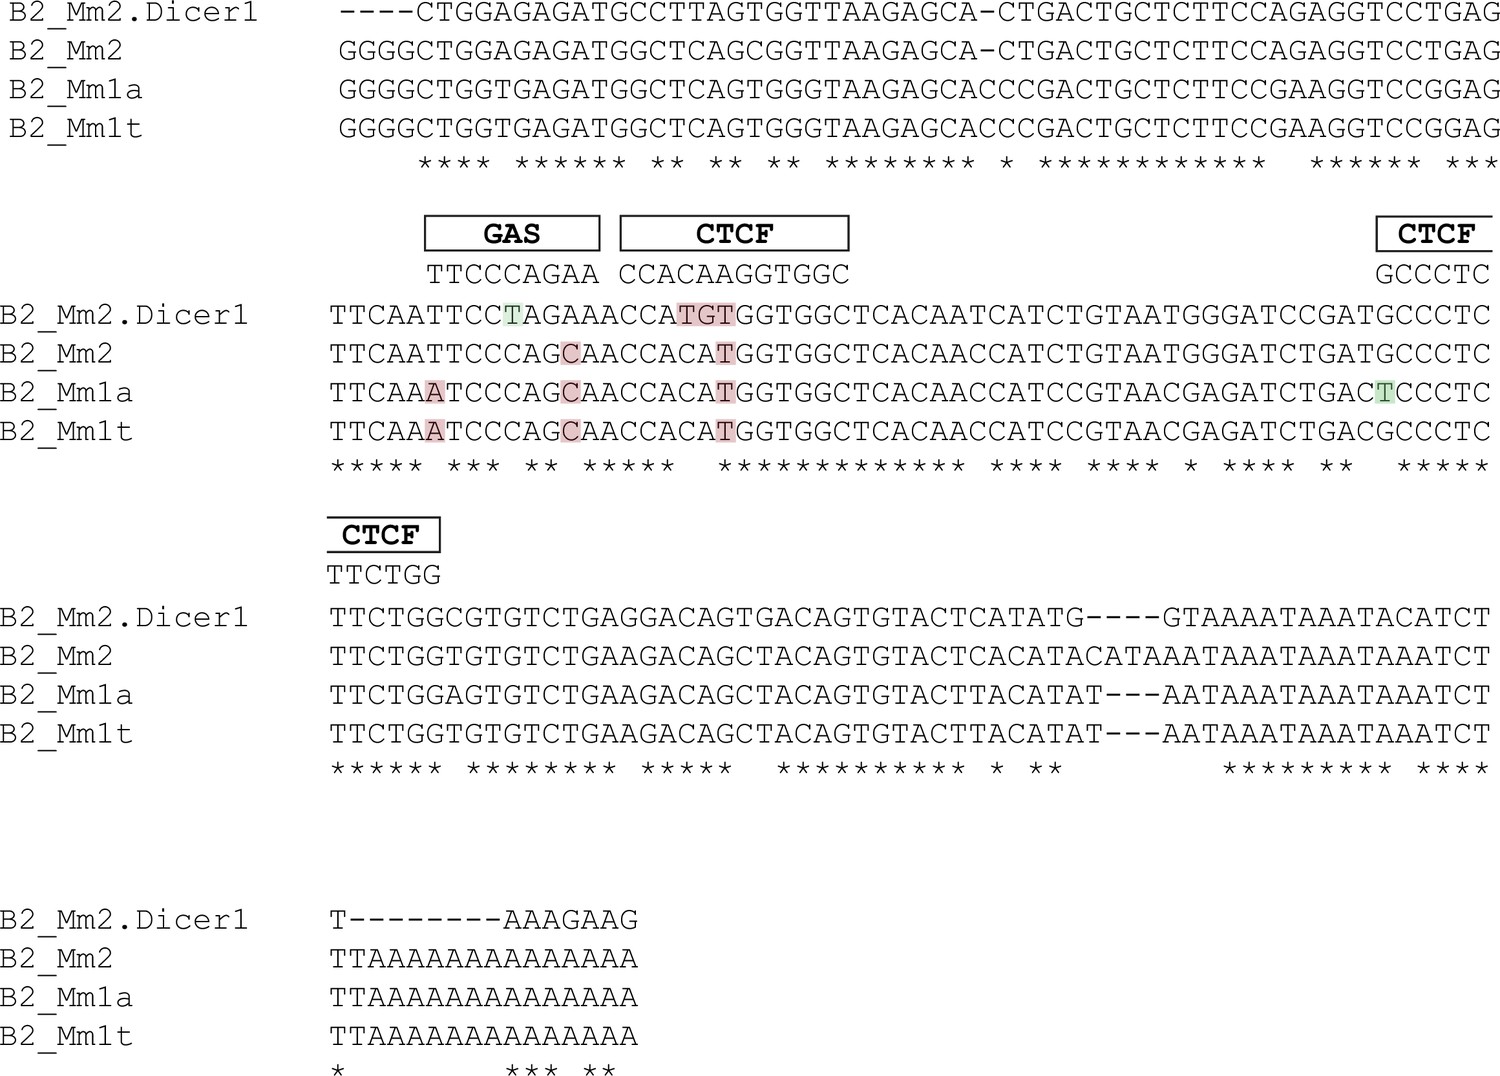
Multiple sequence alignment of B2 consensus sequences and B2_Mm2.Dicer1.
Multiple sequence alignment of consensus sequences for B2_Mm2, B2_Mm1a, and B2_Mm1t as well as the sequence for a B2_Mm2 element intronic to Dicer1. Predicted GAS and CTCF motifs (FIMO p-value <1 × 10⁻⁴) are indicated above. Base changes relative to the motif consensus corresponding to poorly weighted positions in the motif position weight matrix are highlighted in green. Base changes in positions that are canonically important for transcription factor binding and weighted heavily in the position weight matrix are highlighted in red. GAS: Gamma-interferon activated site motif.
Figure 2—figure supplement 3
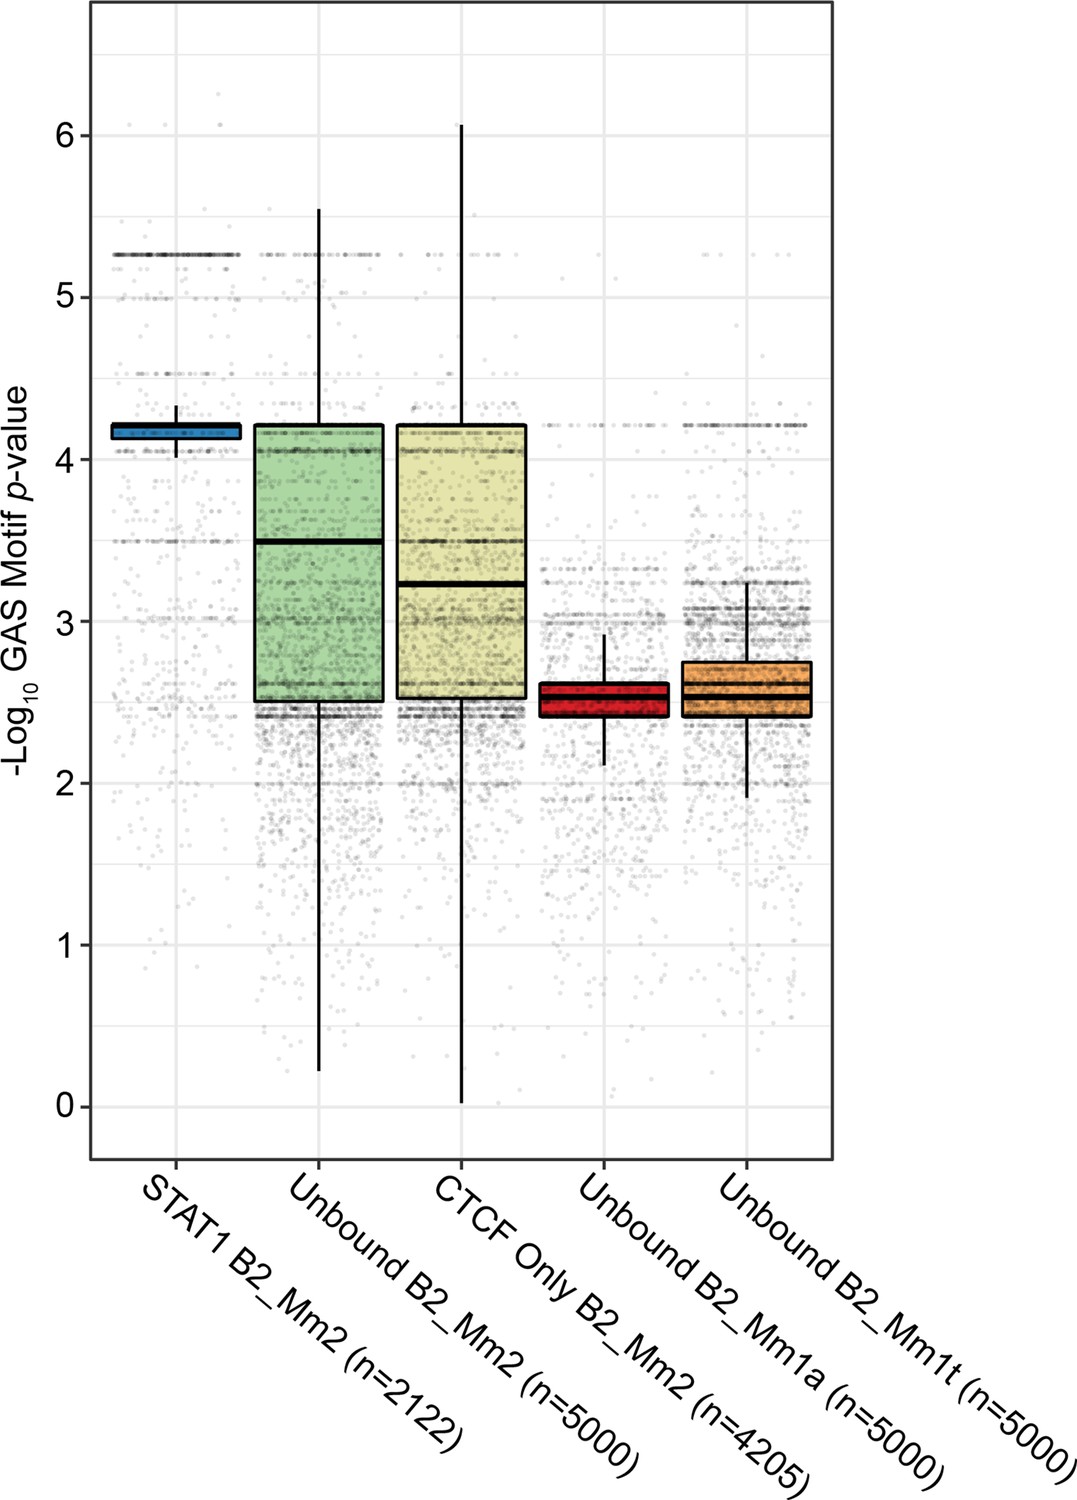
Distribution of p-values for GAS motifs overlapping B2 elements.
Box-and-whisker plot visualizing the distribution of FIMO p-values for GAS motifs overlapping B2 elements. B2 elements were classified as follows: STAT1-bound B2_Mm2 (n=2,122, blue); B2_Mm2 not bound by CTCF nor STAT1 (n=5,000, green); B2_Mm2 bound by CTCF but not STAT1 (n=4,205, yellow); unbound B2_Mm1a (n=5,000, red); and unbound B2_Mm1t (n=5,000, orange). Each dot represents the p-value for the most significant predicted GAS motif overlapping one B2 element. The median, lower quartile, and upper quartile are as indicated. GAS: Gamma-IFN activated site motif.
Figure 3 with 5 supplements
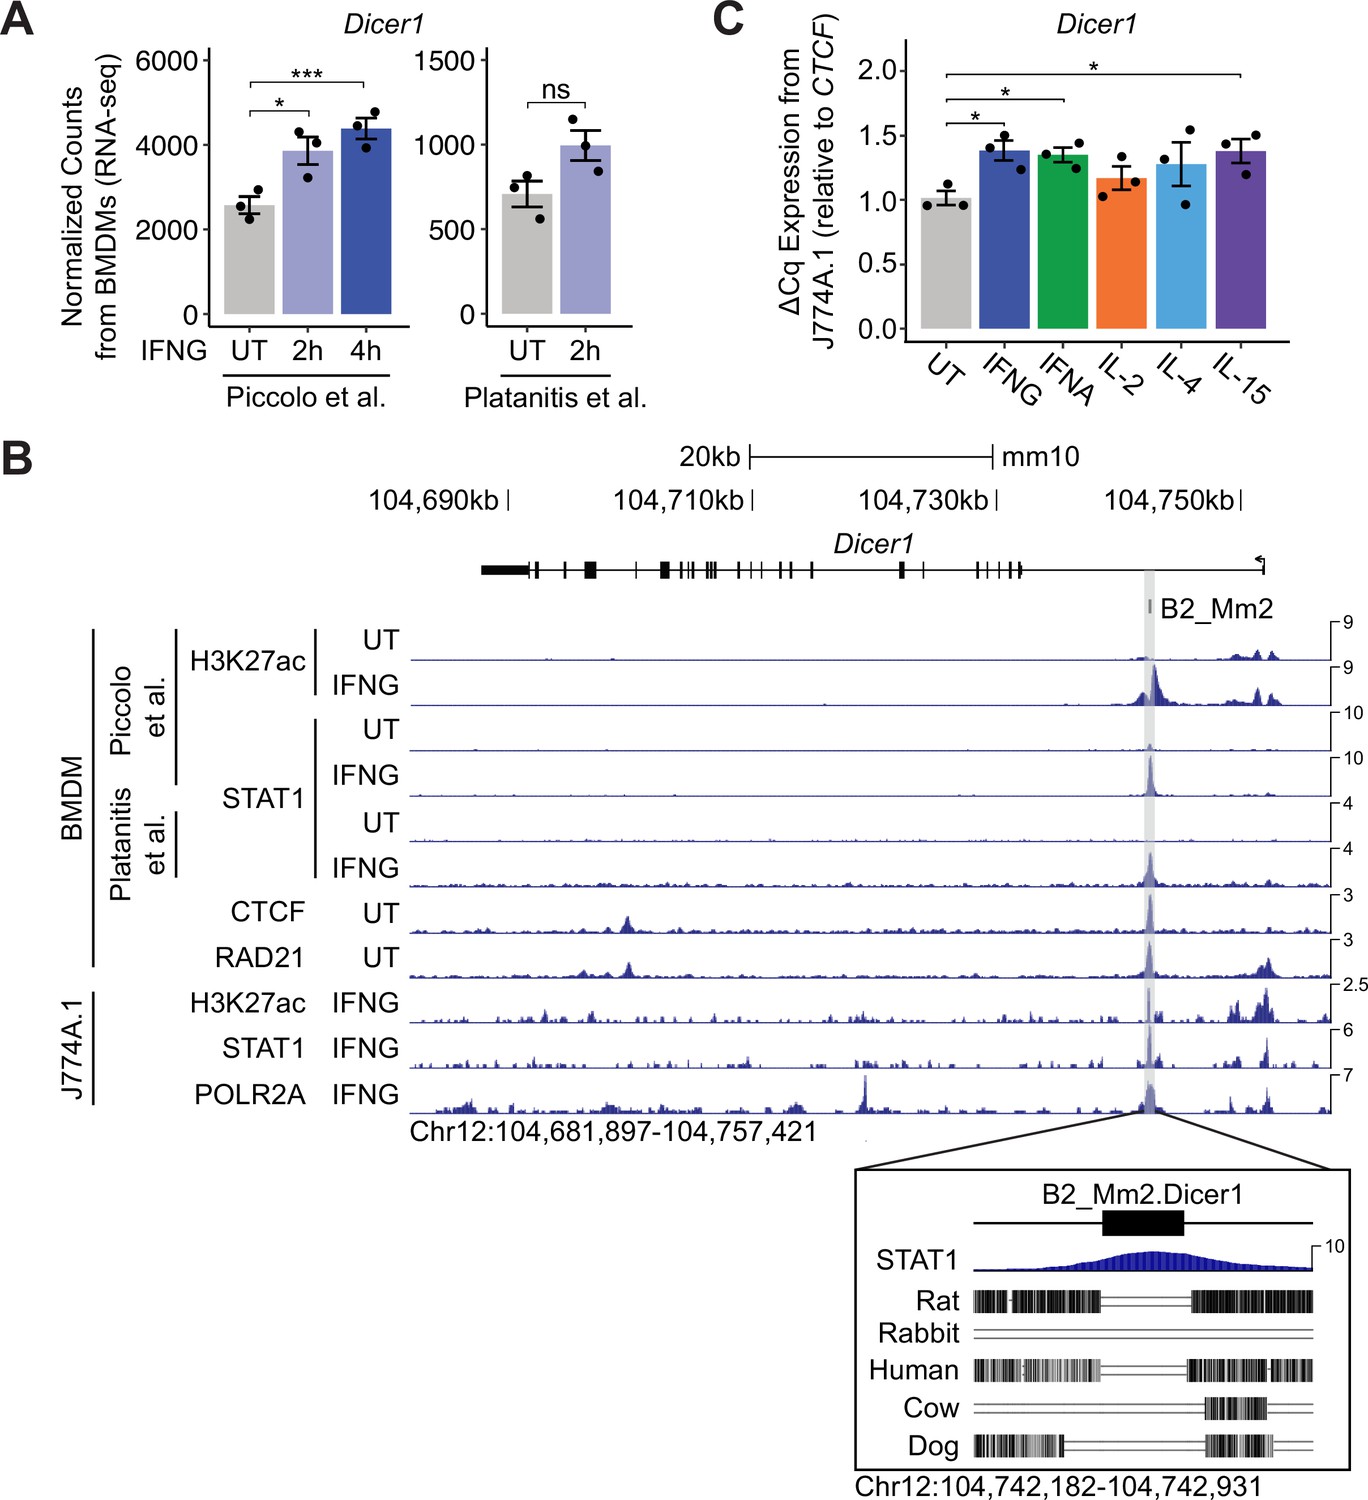
Identification of a putative B2_Mm2-derived enhancer for Dicer1.
(A) DESeq2 normalized counts showing immune-stimulated expression of Dicer1 in primary murine BMDMs. Data shown for untreated (n=3) BMDMs and BMDMs stimulated with IFNG for 2 hr (n=3) or 4 hr (n=3). ***DESeq2 FDR adjusted p-value <0.001, *DESeq2 FDR adjusted p-value <0.05. Error bars designate SEM. (B) Genome browser screenshot (http://genome.ucsc.edu) of the Dicer1 locus (Chr12:104,681,897–104,757,421) showing CPM-normalized ChIP-seq tracks for primary murine BMDMs and immortalized macrophage line J774A.1. B2_Mm2.Dicer1 (Chr12:104,742,467–104,742,646) is highlighted in gray. Values on the right of each track correspond to signal maxima. Bottom inset shows B2_Mm2.Dicer1 with accompanying STAT1 (IFNG 2 h Piccolo et al.) ChIP-seq signal and conservation tracks for rat, rabbit, human, cow, and dog. CTCF track derived from Gualdrini et al., 2022. RAD21 track derived from Cuartero et al., 2018. (C) RT-qPCR of wild type untreated (gray, n=3) J774A.1 cells and J774A.1 cells stimulated with IFNG (blue, n=3), IFNA (green, n=3), IL-2 (orange, n=3), IL-4 (light blue, n=3), or IL-15 (purple, n=3) for 4 hr. Treatments are indicated by color. *p-value <0.05, Student’s paired two-tailed t-test. BMDM: Bone-marrow-derived macrophage. SEM: Standard error of mean. CPM: Counts per million.
Figure 3—figure supplement 1
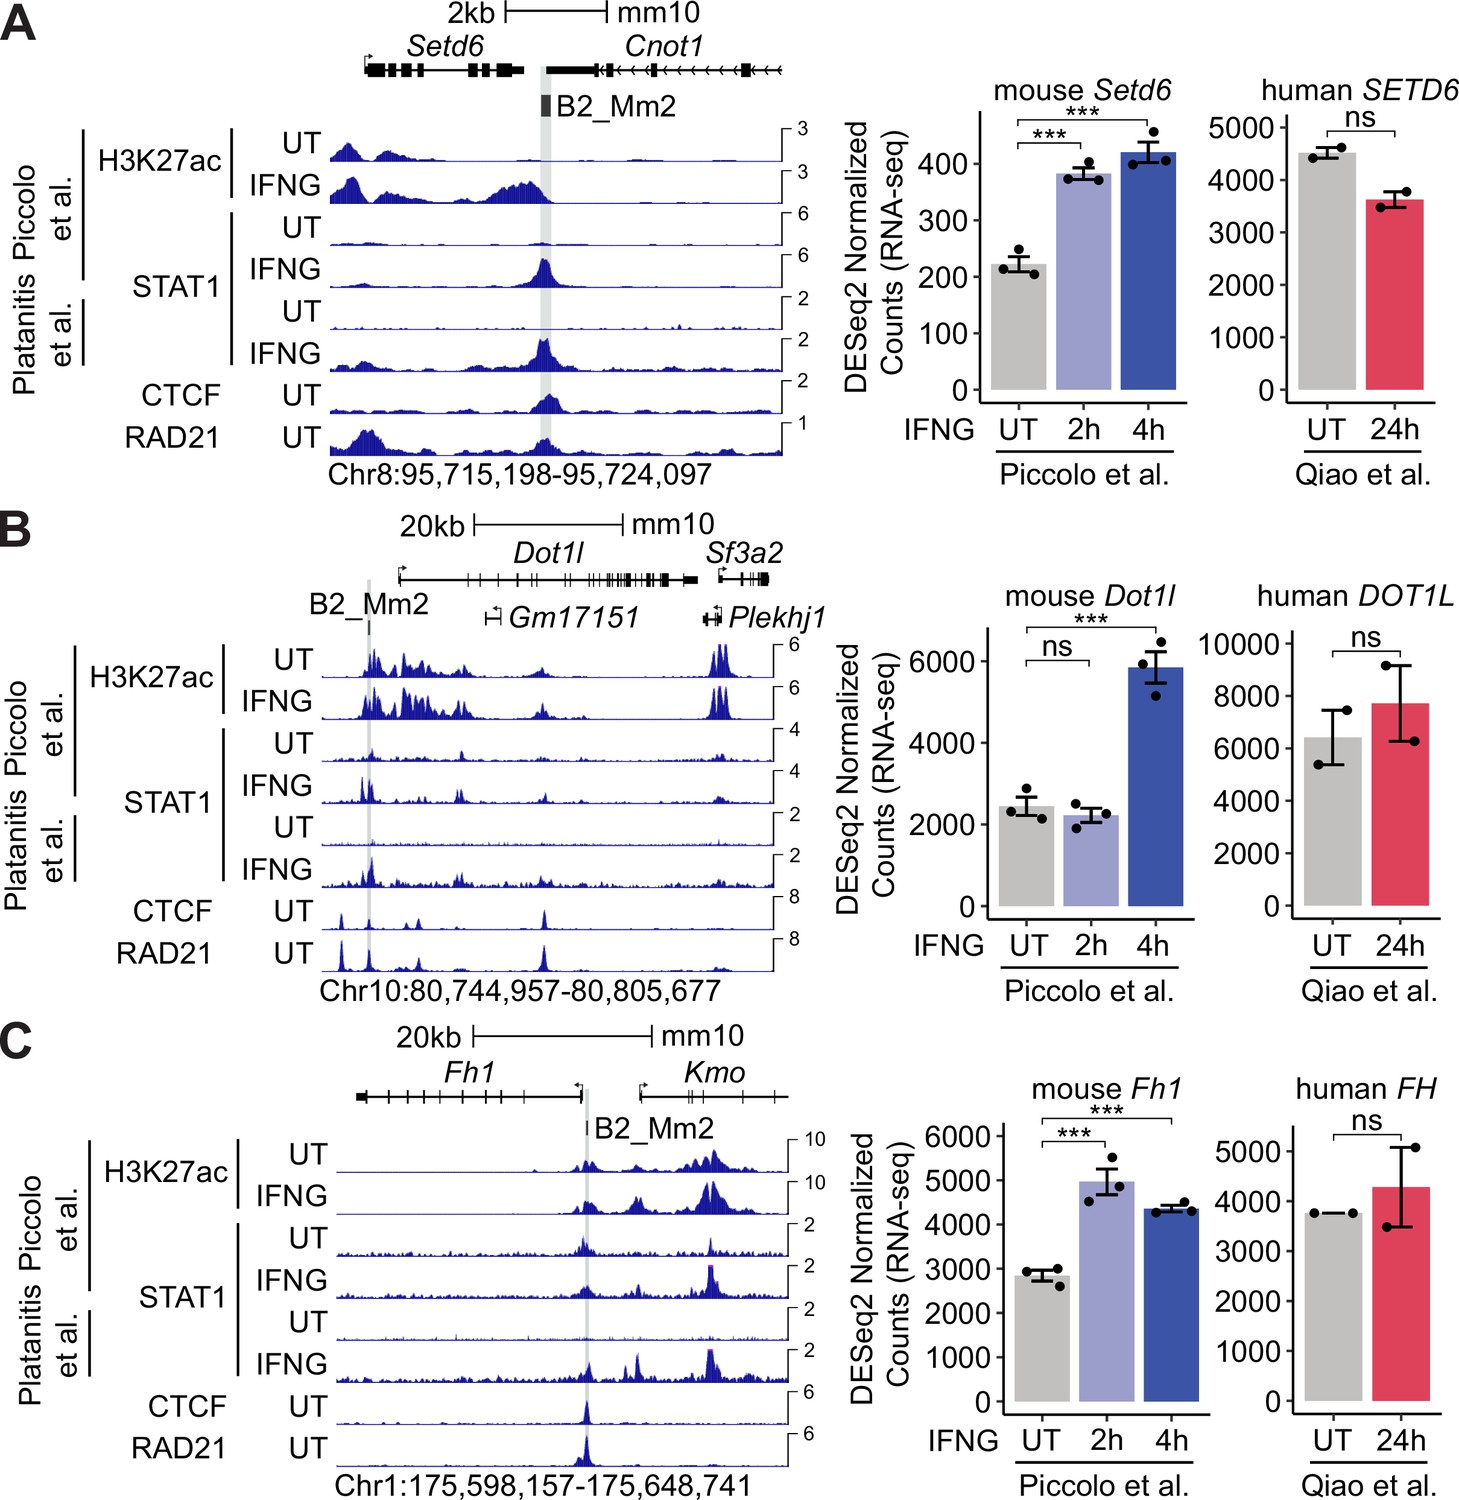
Predicted B2_Mm2 enhancers associated with mouse-specific ISGs Setd6, Dot1l, and Fh1.
(A) Genome browser screenshot (left) of mouse Setd6 (Chr8:95,715,198–95,724,097) visualizing H3K27ac and STAT1 (Piccolo et al., 2017), CTCF (Gualdrini et al., 2022), and RAD21 (Cuartero et al., 2018) ChIP-seq signal from murine BMDM cells that were either untreated or stimulated with IFNG for 2 hr or 4 hr. B2_Mm2 elements that are bound by STAT1 in IFNG-stimulated BMDM cells and predicted by the Activity-by-Contact model to interact with Setd6 are highlighted in gray. Values on the right of each track correspond to signal maxima. DESeq2 normalized counts (right) showing immune-stimulated expression of Setd6 in primary murine BMDMs that were unstimulated (n=3) or stimulated with IFNG for 2 hr (n=3) or 4 hr (n=3) and the human ortholog, SETD6, in primary human CD14+ monocytes that were unstimulated (n=2) or stimulated with IFNG for 24 hr (n=2). (B) and (C) same as in (A) but visualizing data for mouse Dot1l and Fh1 relative to human orthologs DOT1L and FH. ***DESeq2 FDR adjusted p-value <0.001. Error bars designate SEM. BMDM: Bone-marrow-derived macrophage. ISG: Interferon Stimulated Gene. CPM: Counts per million.
Figure 3—figure supplement 2
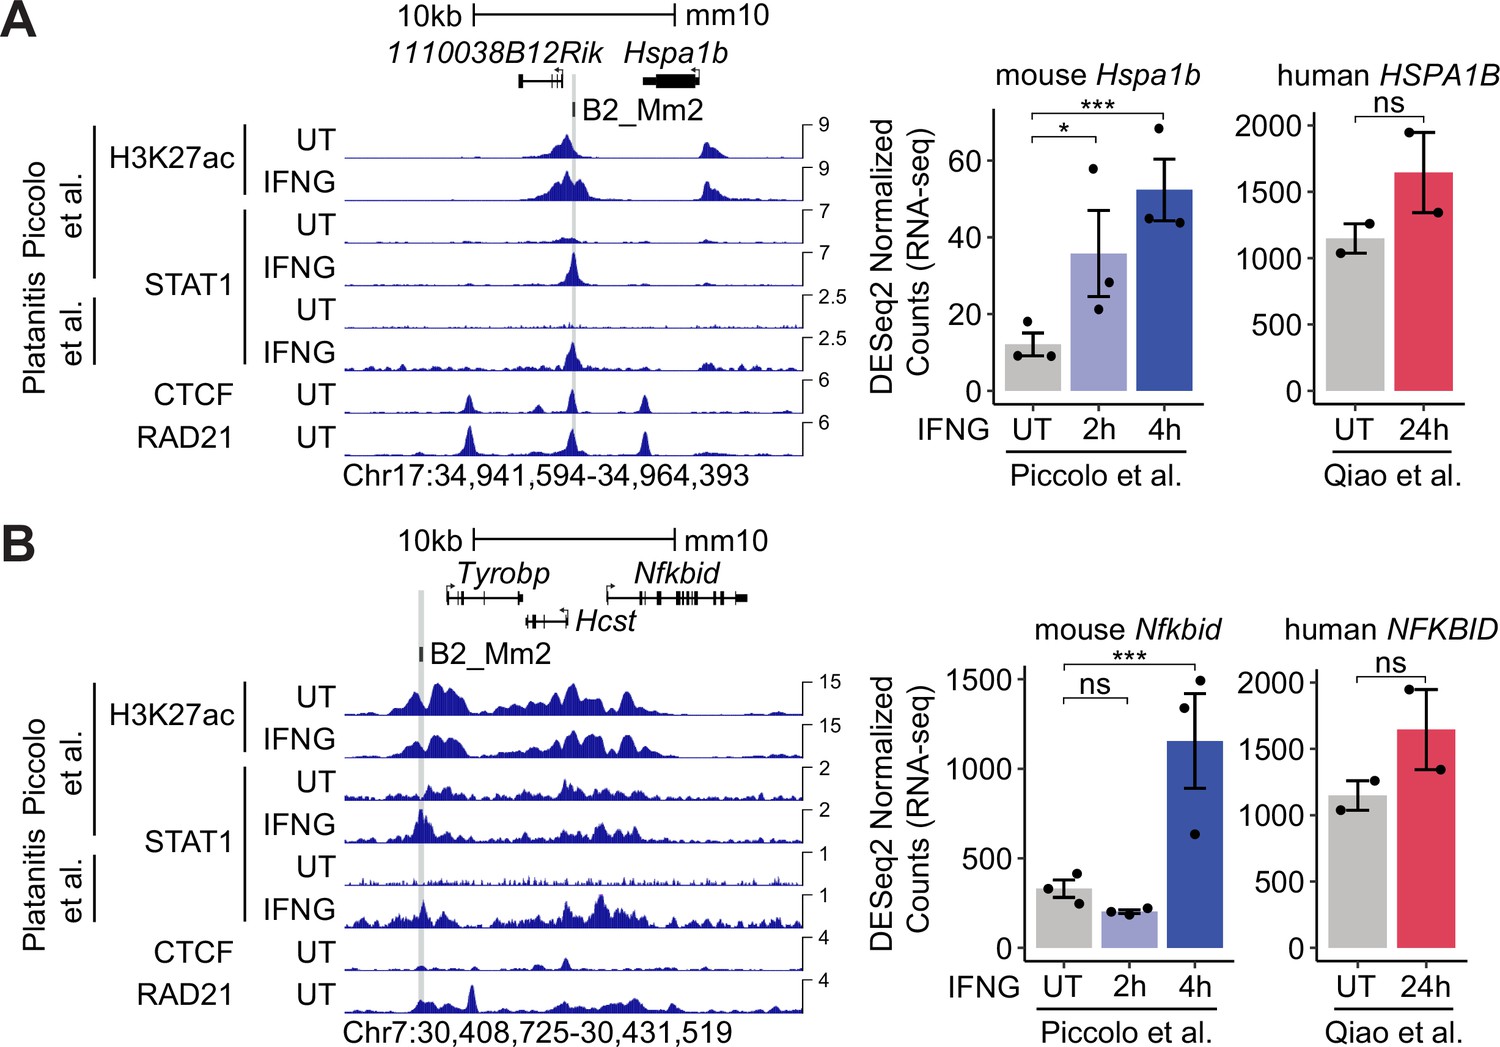
Predicted B2_Mm2 enhancers associated with mouse-specific ISGs Hspa1b and Nfkbid.
(A) Genome browser screenshot (left) of mouse Hspa1b (Chr17:34,941,594–34,964,393) visualizing H3K27ac and STAT1 (Piccolo et al., 2017), CTCF (Gualdrini et al., 2022), and RAD21 (Cuartero et al., 2018) ChIP-seq signal from murine BMDM cells that were either untreated or stimulated with IFNG for 2 hr or 4 hr. B2_Mm2 elements that are bound by STAT1 in IFNG-stimulated BMDM cells and predicted by the Activity-by-Contact model to interact with Hspa1b are highlighted in gray. Values on the right of each track correspond to signal maxima. DESeq2 normalized counts (right) showing immune-stimulated expression of Hspa1b in primary murine BMDMs that were unstimulated (n=3) or stimulated with IFNG for 2 hr (n=3) or 4 hr (n=3) and the human ortholog, HSPA1B, in primary human CD14+ monocytes that were unstimulated (n=2) or stimulated with IFNG for 24 hr (n=2). (B) same as in (A) but visualizing data for mouse Nfkbid relative to human ortholog NFKBID. ***DESeq2 FDR adjusted p-value <0.001, *DESeq2 FDR adjusted p-value <0.05. Error bars designate SEM. BMDM: Bone-marrow-derived macrophage. ISG: Interferon Stimulated Gene. CPM: Counts per million.
Figure 3—figure supplement 3
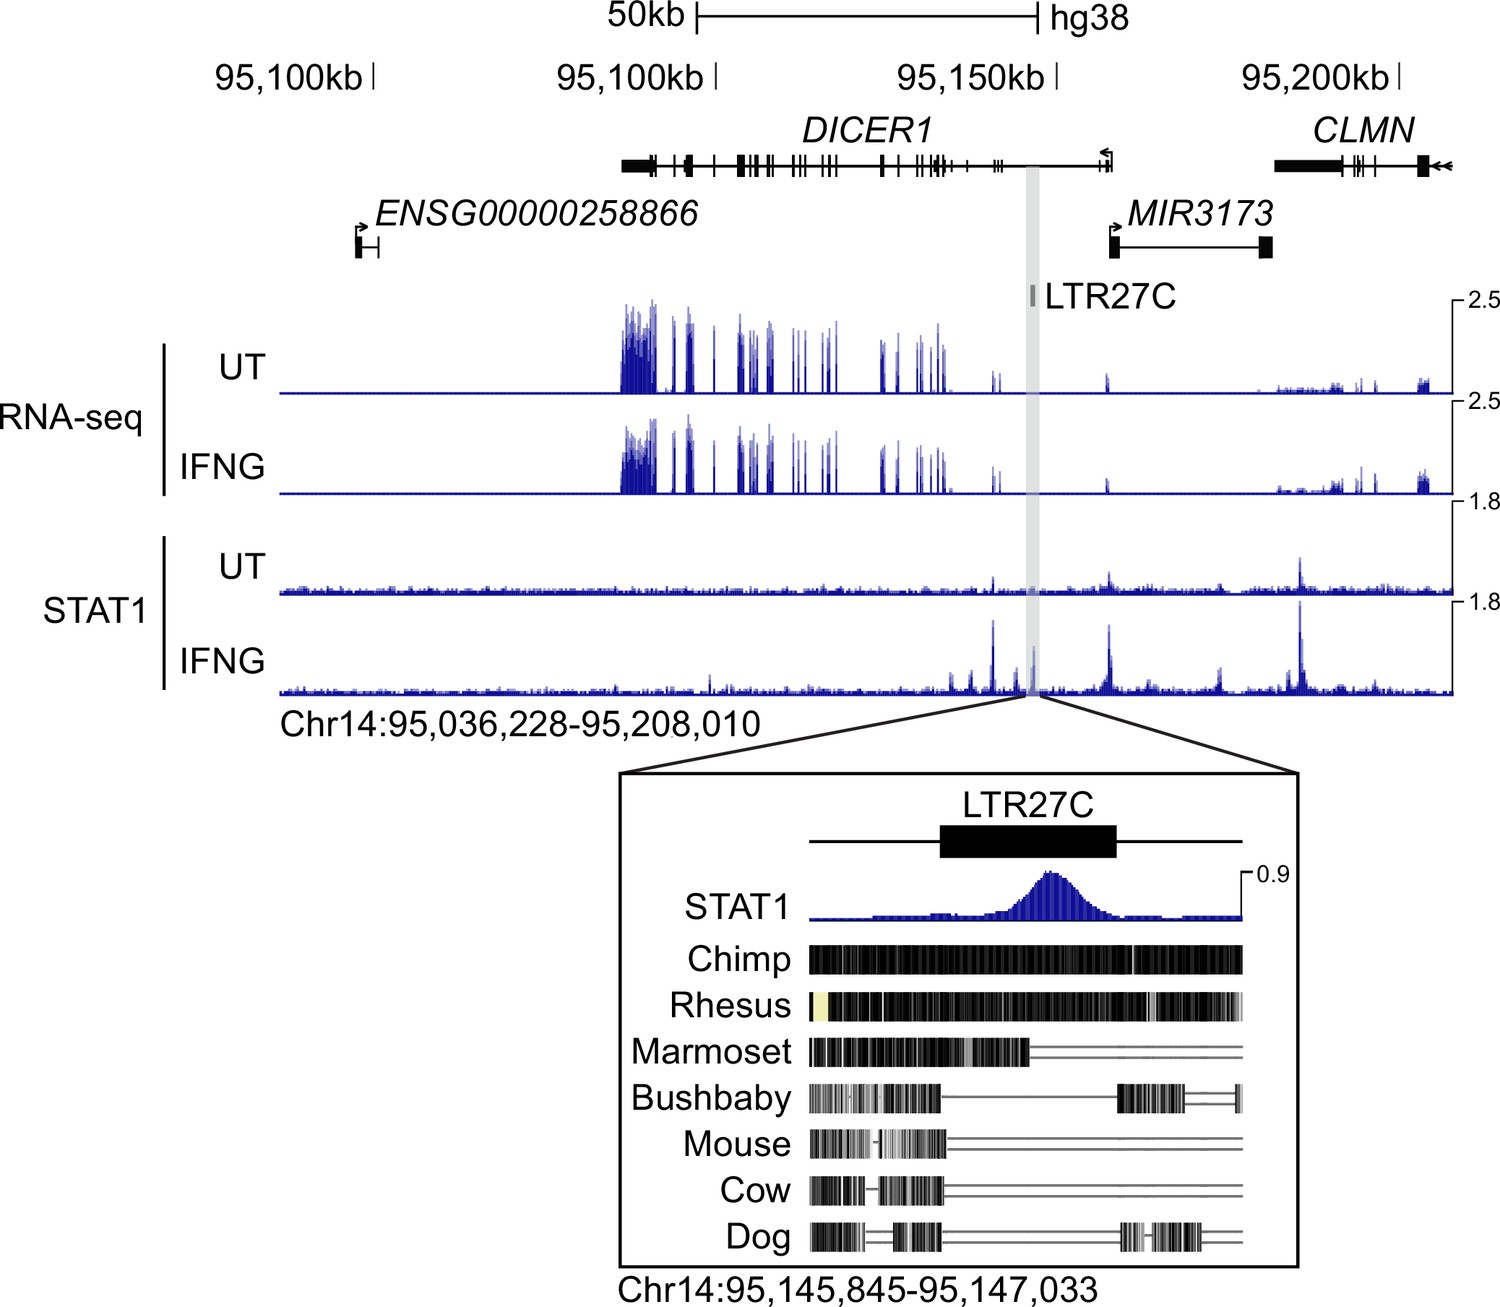
Constitutive expression of human DICER1.
Genome browser shot of the human DICER1 locus (Chr14:95,036,228–95,208,010) visualizing CPM-normalized RNA-seq (Qiao et al., 2016) and STAT1 ChIP-seq (Qiao et al., 2013) data from human CD14+ monocytes stimulated with IFNG for 24 hr. Bottom inset (Chr14:95,145,845–95,147,033) shows intronic LTR27C element with accompanying STAT1 ChIP-seq signal and conservation tracks for chimp, rhesus, marmoset, bushbaby, mouse, cow, and dog. Values on the right of each track correspond to signal maxima. CPM: Counts per million.
Figure 3—figure supplement 4
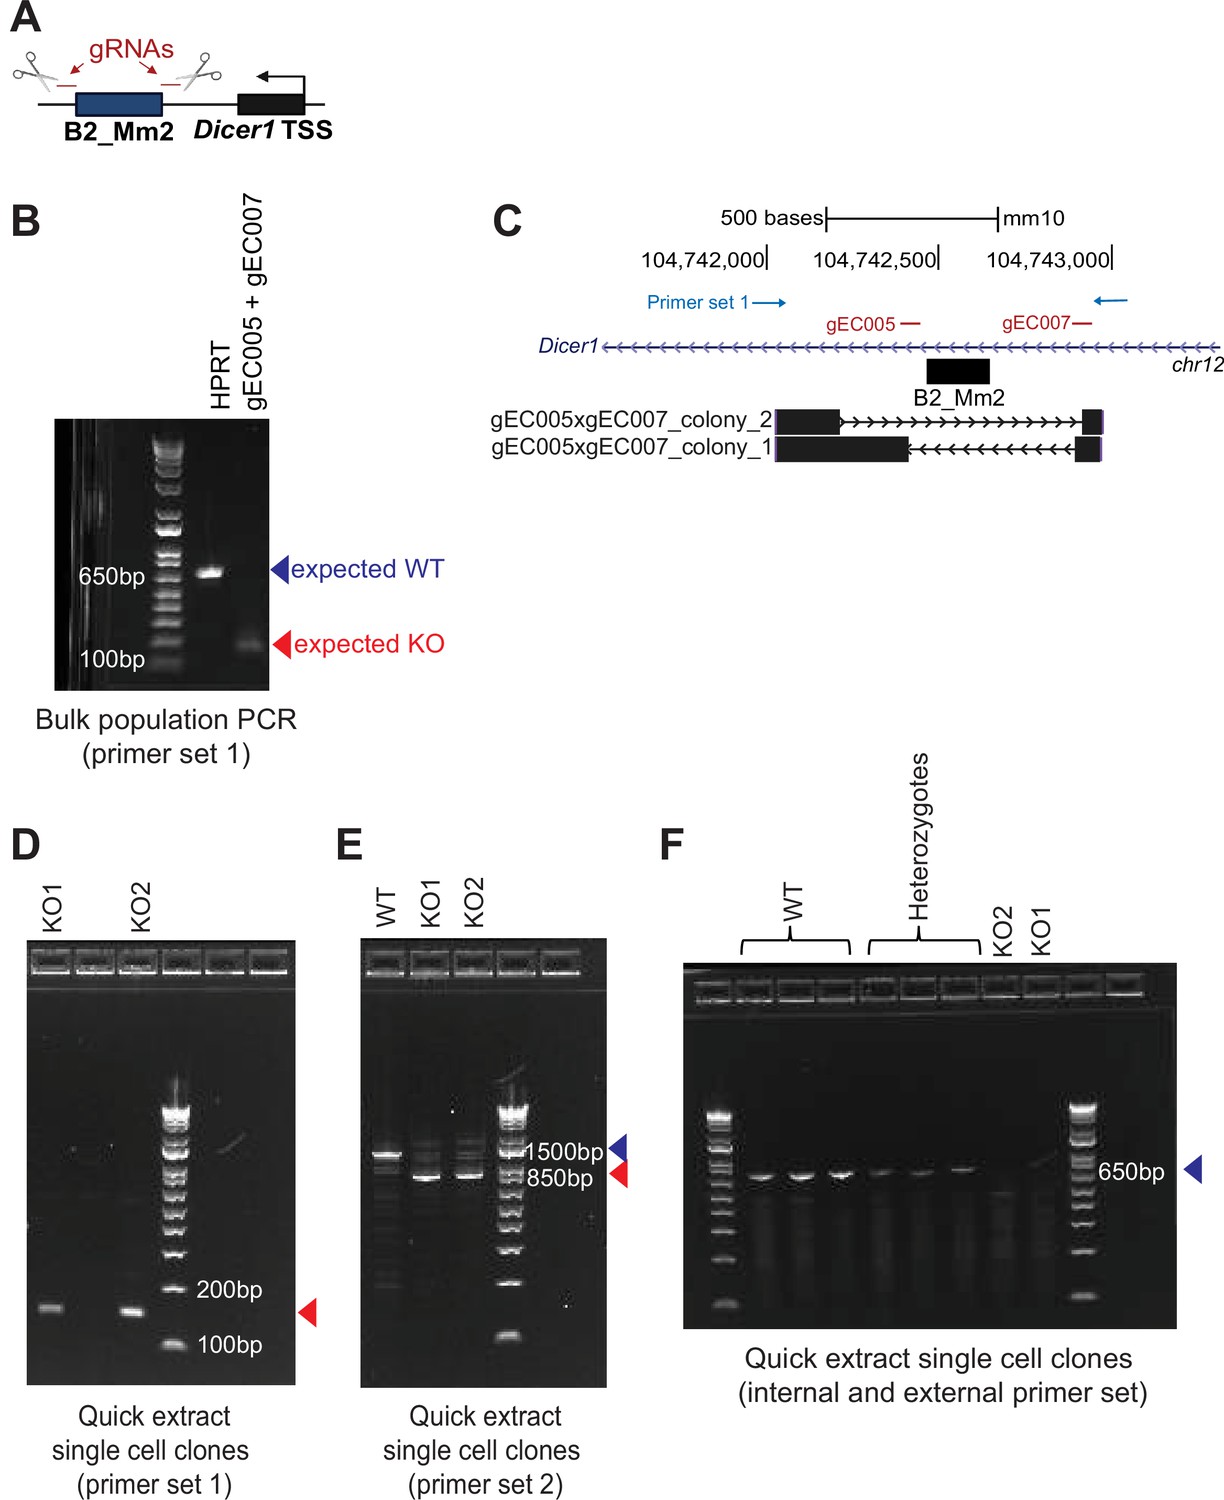
Validation of CRISPR B2_Mm2 knockout in J774.A1 cells.
(A) Schematic showing design of guide RNAs (gRNAs) flanking the B2_Mm2.Dicer1 element. (B) PCR validation of CRISPR/Cas9-mediated knockout of B2_Mm2.Dicer1 in bulk J774A.1 cells. HPRT- serves as a control with an expected WT band at 627 bp. Successful KO is shown as indicated by the expected gEC005xgEC007 amplicon at 127 bp. (C) Genome browser track showing Sanger sequencing results from the bulk cell population aligned using BLAT (Kent, 2002). Sequencing of different E. coli clones derived from the same bulk cell population reflects presence of two distinct KO alleles. Positions of gRNAs and PCR primers are indicated in red and blue, respectively. (D, E) PCR validation of B2_Mm2.Dicer1 KO in clonal J774A.1 cells using two distinct primer sets external to B2_Mm2.Dicer1. (F) Same as in (D) and (E) but using a pair of internal and external primers.
-
Figure 3—figure supplement 4—source data 1
Uncropped gel image from Figure 3—figure supplement 4B.
- https://cdn.elifesciences.org/articles/82617/elife-82617-fig3-figsupp4-data1-v2.zip
-
Figure 3—figure supplement 4—source data 2
Uncropped gel image from Figure 3—figure supplement 4D.
- https://cdn.elifesciences.org/articles/82617/elife-82617-fig3-figsupp4-data2-v2.zip
-
Figure 3—figure supplement 4—source data 3
Uncropped gel image from Figure 3—figure supplement 4E.
- https://cdn.elifesciences.org/articles/82617/elife-82617-fig3-figsupp4-data3-v2.zip
-
Figure 3—figure supplement 4—source data 4
Uncropped gel image from Figure 3—figure supplement 4F.
- https://cdn.elifesciences.org/articles/82617/elife-82617-fig3-figsupp4-data4-v2.zip
-
Figure 3—figure supplement 4—source data 5
Uncropped, labeled gel images from Figure 3—figure supplement 4.
(A) Uncropped, labeled gel from Figure 3—figure supplement 4B. (B) Uncropped, labeled gel from Figure 3—figure supplement 4D. Unknown genotype indicates the band length did not correspond with either WT, heterozygote, or KO genotype or product from a single cell colony was loaded but no band appeared. (C) Uncropped, labeled gel from Figure 3—figure supplement 4E. (D) Uncropped, labeled gel from Figure 3—figure supplement 4F.
- https://cdn.elifesciences.org/articles/82617/elife-82617-fig3-figsupp4-data5-v2.zip
Figure 3—figure supplement 5
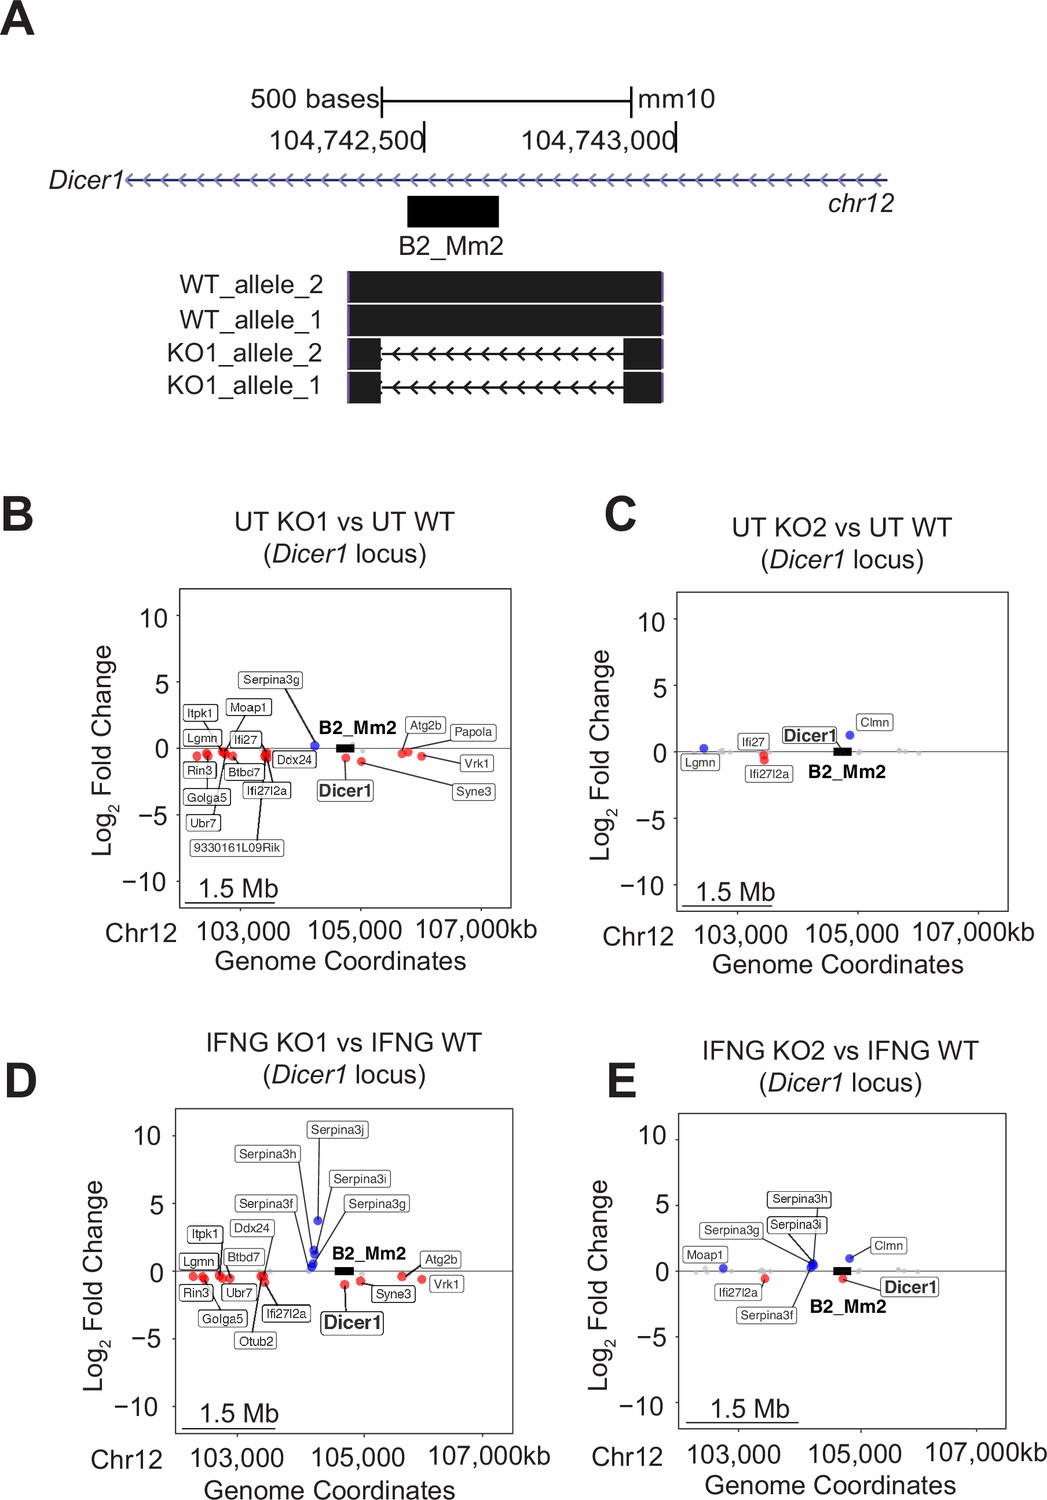
B2_Mm2 KO effect on the genomic landscape.
(A) Genome browser shot showing Sanger sequencing validation from WT and KO1 J774A.1 cells aligned using BLAT (Kent, 2002). (B) Scatter plot showing changes in gene expression within a 5 Mb window of B2_Mm2.Dicer1 in untreated KO #1 cells relative to pooled WT cells. (C) As in (B) but with untreated KO #2 cells relative to pooled WT cells. (D) As in (B) but with IFNG-treated KO #1 cells relative to pooled WT cells. (E) As in (B) but with IFNG-treated KO #2 cells relative to pooled WT cells. (D) Significantly downregulated (log2FC <0, FDR <0.05) genes are shown in red, and significantly upregulated (log2FC >0, FDR <0.05) genes are shown in blue. B2_Mm2.Dicer1 is represented as a black box (not drawn to scale). UT: Untreated. KO: Knockout.
Figure 4
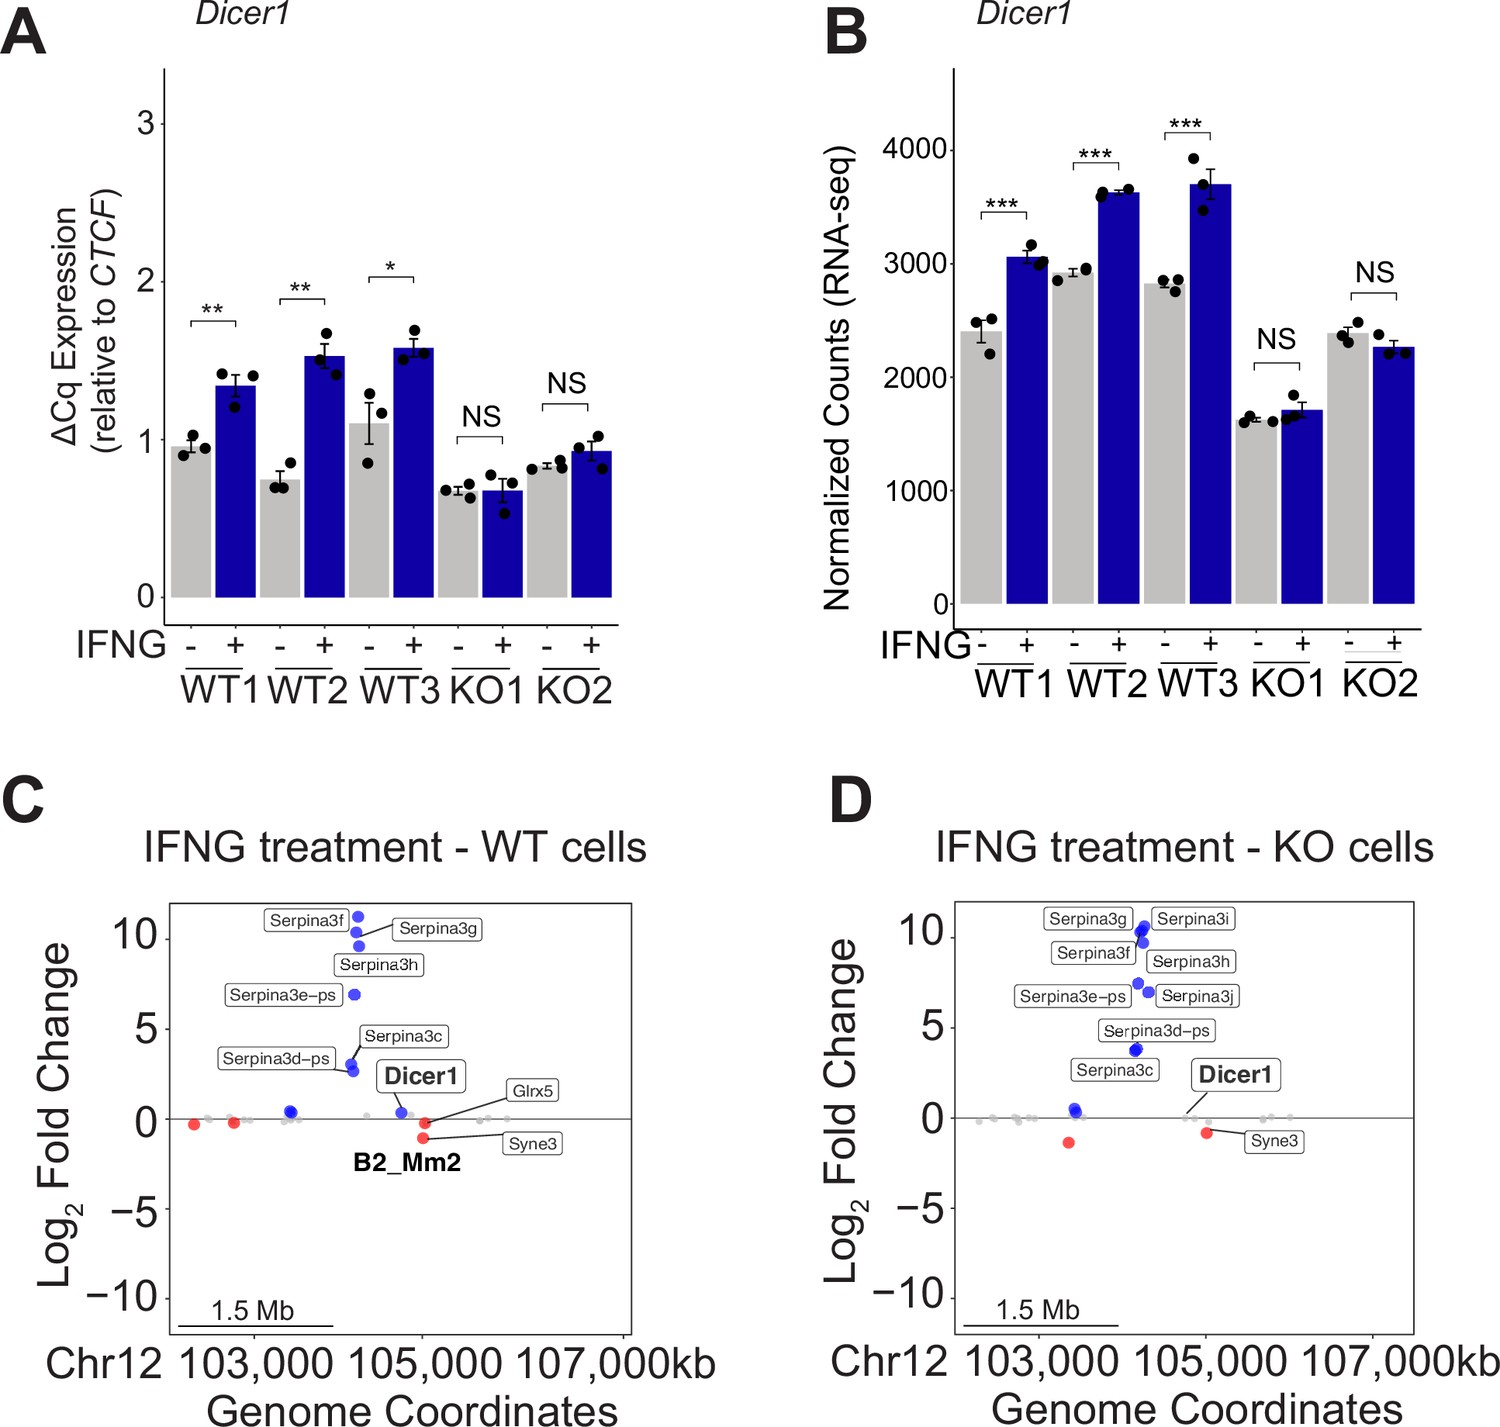
B2_Mm2 in the genomic landscape.
(A) RT-qPCR of Dicer1 expression in untreated and IFNG-treated cell lines across 3 clonal WT lines J774A.1 cells and 2 B2_Mm2.Dicer1 knockout (KO) lines, with three replicate treatments per cell line. Dicer1 expression was normalized relative to CTCF. Treatments are indicated by color. *p-value <0.05, **p-value <0.01, ***p-value <0.001, Student’s paired two-tailed t-test. (B) DESeq2 normalized counts of Dicer1 expression in each clonal WT and B2_Mm2.Dicer1 KO J774A.1 cell line. Treatments are indicated by color. ***DESeq2 FDR adjusted p-value <0.001. (C) Distance plot visualizing changes in gene expression in wild type J774A.1 cells in response to IFNG over a 5 Mb window centered on B2_Mm2.Dicer1. Significantly downregulated (log2FC <0, FDR adjusted p-value <0.05) genes are shown in red while significantly upregulated (log2FC >0, FDR adjusted p-value <0.05) genes are shown in blue. Dicer1 is labeled, as well as significantly IFNG-regulated genes within 1 Mb. (D) Same as in (C) but visualizing changes in gene expression in KO J774A.1 cells in response to IFNG.
Figure 5
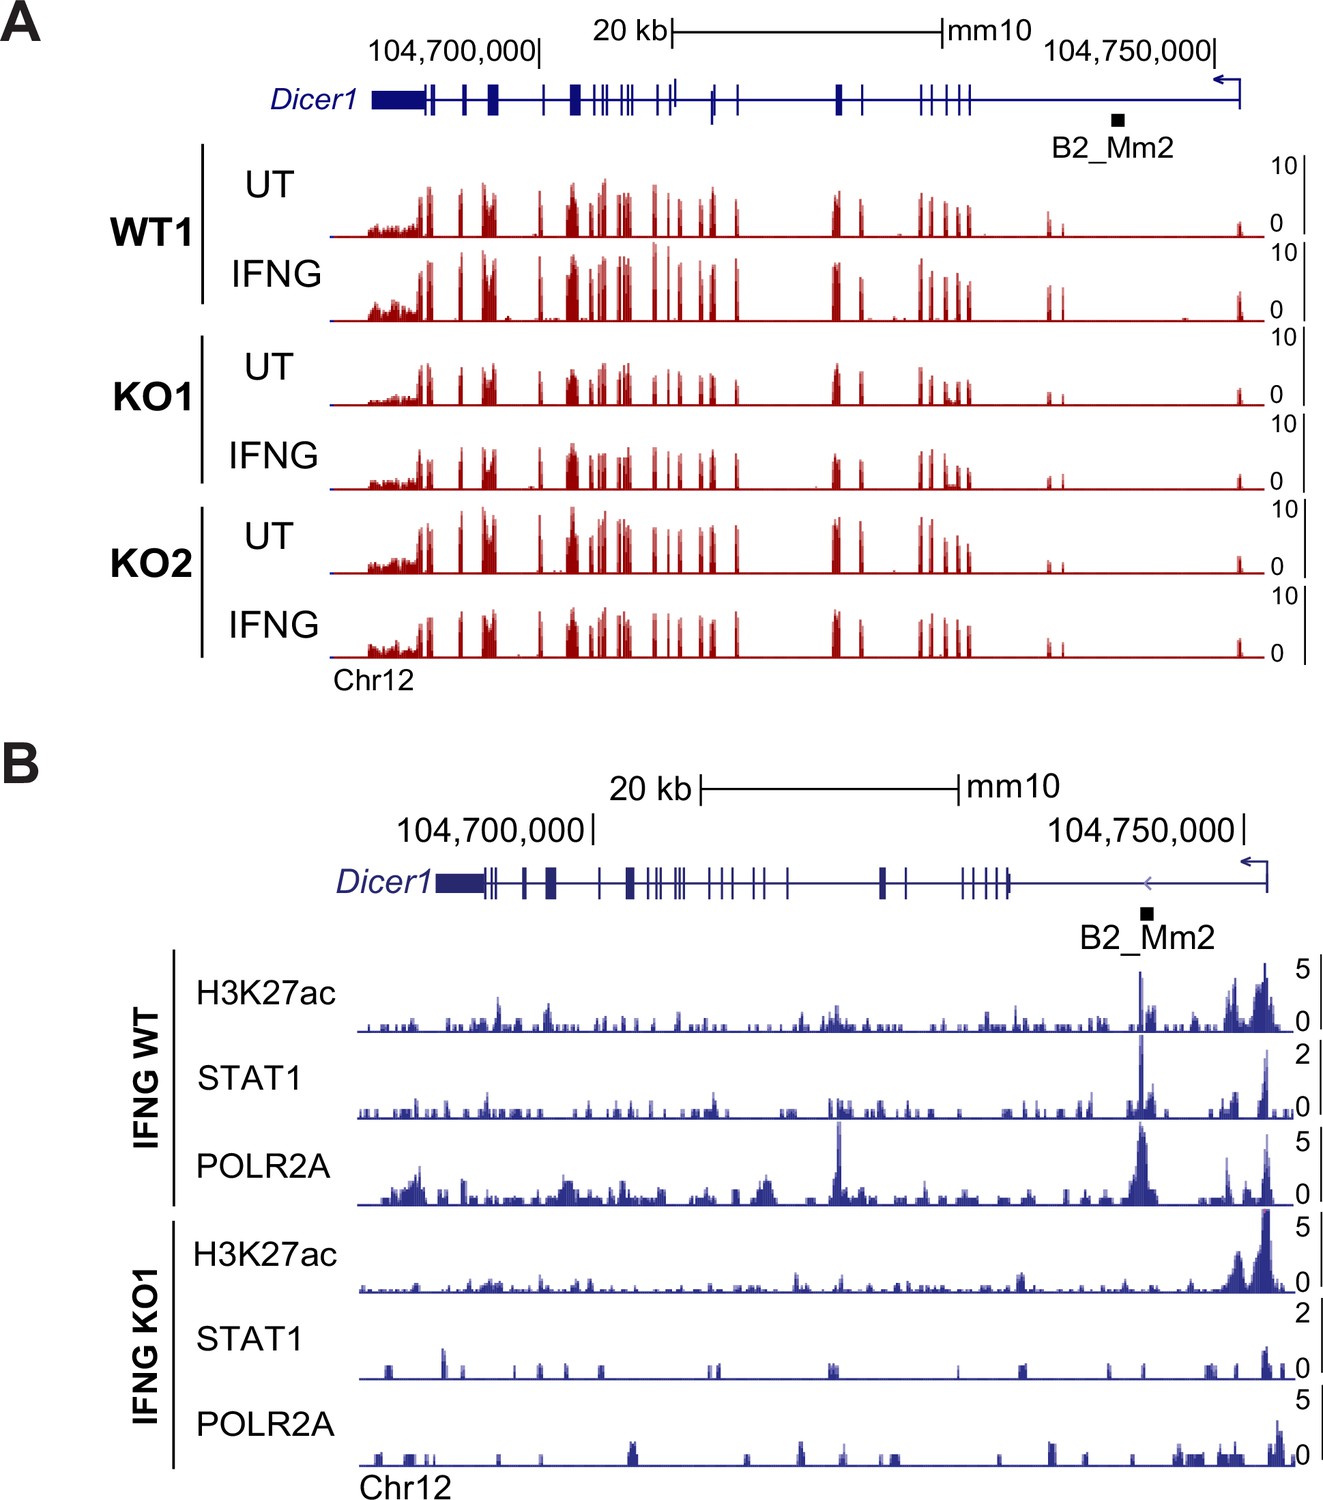
B2_Mm2 impacts local chromatin profile.
(A) Genome browser screenshot of the Dicer1 locus visualizing CPM-normalized expression in WT and B2_Mm2.Dicer1 KO J774A.1 cells. Values on the right of each track correspond to signal maxima. B2_Mm2.Dicer1 is represented as a black box (not drawn to scale). (B) Genome browser screenshot of the Dicer1 locus showing CUT&TAG data from bulk WT and B2_Mm2.Dicer1 KO J774A.1 cells. CPM: Counts per million.
Author response image 1
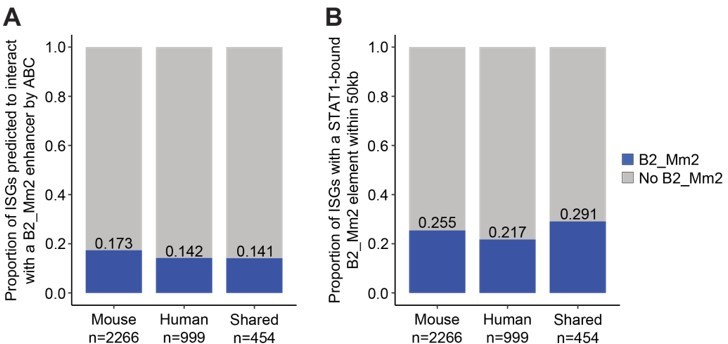
Activity-by-Contact (ABC) analysis of B2_Mm2 enhancers and ISGs.
(A) Proportions of ISGs (mouse-specific, human-specific, shared) predicted to be regulated by a B2_Mm2 enhancer. (B) Proportions of ISGs within 50 kb of a STAT1-bound B2_Mm2 element.
Author response image 2
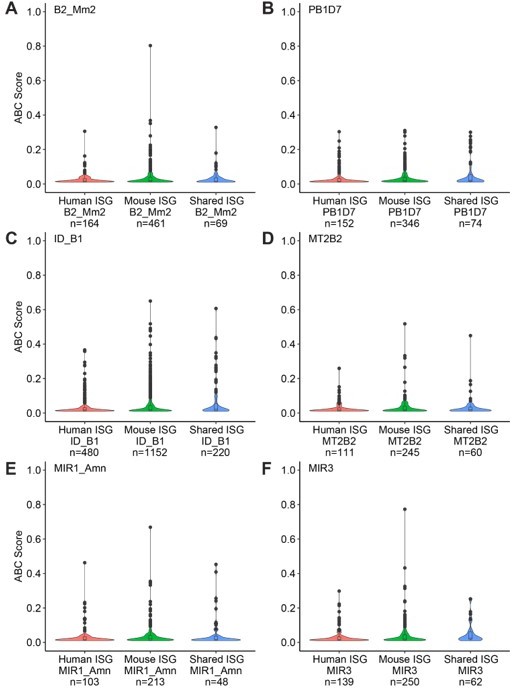
Distribution of Activity-by-Contact scores in mouse IFNΓ-stimulated bone-marrow derived macrophages between various TE families and mouse-specific/human-specific/shared ISGs.
(A) B2_Mm2. (B) PB1D7. (C) ID_B1. (D) MT2B2. (E) MIR1_AMN. (F) MIR3.
Author response image 3
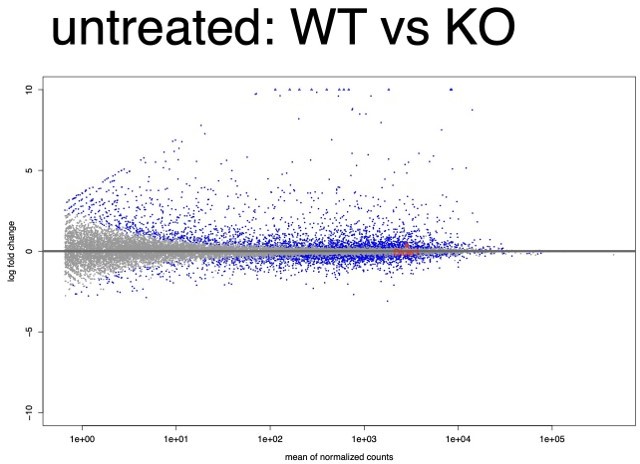
MA plot of all WT replicates vs all KO replicates in the untreated condition.
Dicer1 is labeled and is highly expressed and modestly but significantly downregulated (log2FC = -0.43, FDR adjusted p-value = 9×10⁻⁴).
Author response image 4
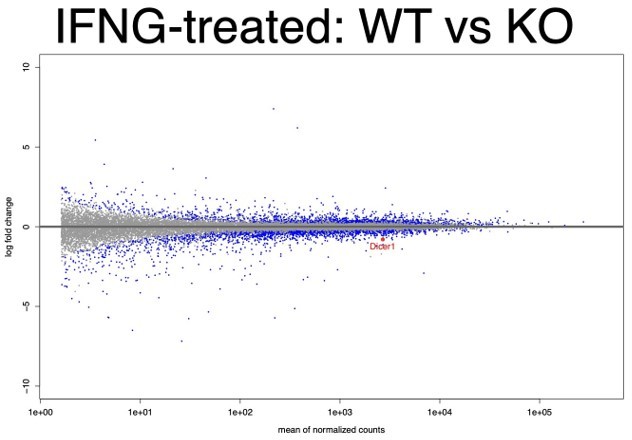
MA plot of all WT replicates vs all KO replicates in the IFNΓ-treated condition.
Dicer1 is labeled and is highly expressed and significantly downregulated (log2FC = -0.43, FDR adjusted p-value = 9×10⁻⁴).
Author response image 5
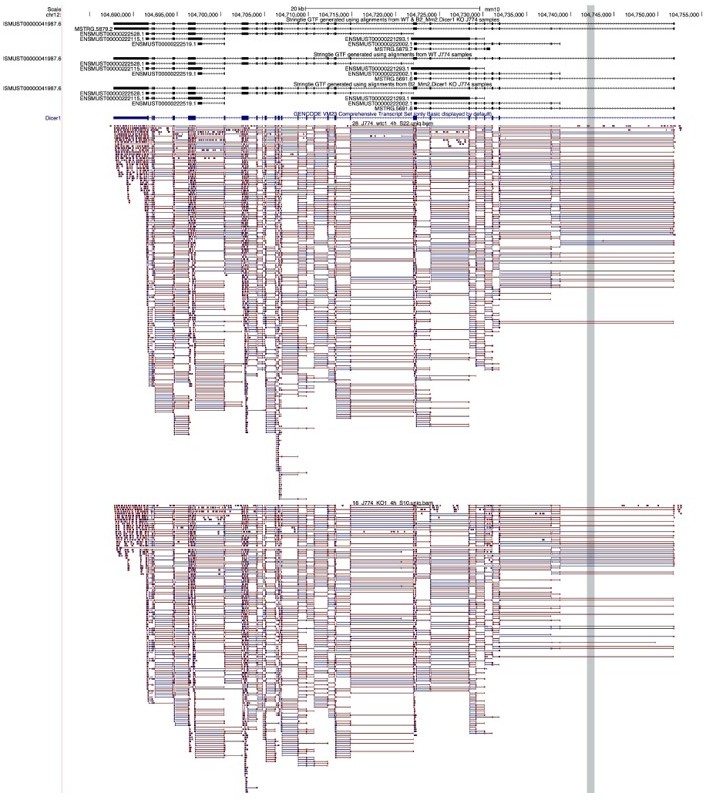
UCSC Snapshot of the Dicer1 locus in mouse, with custom Stringtie transcript-level annotation (top three tracks), GENCODE gene-level annotation (fourth track), and alignments from clonal WT (fifth track) and B2_Mm2.
Dicer1 KO (sixth track) J774.A1 cells.
Author response image 6

IGV Snapshot of the Dicer1 locus in mouse, with PRO-Seq of WT and NELF KO (pause-release deficient) mouse bone-marrow derived macrophages from (Yu et al., 2020).
Additional files
-
Supplementary file 1
DESeq2& GO results for murine BMDMs genes stimulated with IFNG for 2 or 4 hours.
- https://cdn.elifesciences.org/articles/82617/elife-82617-supp1-v2.xlsx
-
Supplementary file 2
Murine BMDM ChIP-seq motif enrichment using XSTREME.
- https://cdn.elifesciences.org/articles/82617/elife-82617-supp2-v2.xlsx
-
Supplementary file 3
Coordinates for STAT1-bound TEs in murine BMDMs.
- https://cdn.elifesciences.org/articles/82617/elife-82617-supp3-v2.xlsx
-
Supplementary file 4
Family level TE enrichment over murine BMDM ChIP-seq using GIGGLE.
- https://cdn.elifesciences.org/articles/82617/elife-82617-supp4-v2.xlsx
-
Supplementary file 5
DESeq2 results for TE expression in murine BMDMs stimulated with IFNG for 2 or 4 hours.
- https://cdn.elifesciences.org/articles/82617/elife-82617-supp5-v2.xlsx
-
Supplementary file 6
Differential B2_Mm2 motif enrichment analysis using AME.
- https://cdn.elifesciences.org/articles/82617/elife-82617-supp6-v2.xlsx
-
Supplementary file 7
Putative B2_Mm2 enhancers identified using the Activity-by-Contact model or by proximity.
- https://cdn.elifesciences.org/articles/82617/elife-82617-supp7-v2.xlsx
-
Supplementary file 8
DESeq2 gene-level results for IFNG-stimulated WT and B2_Mm2.Dicer1 KO J774A.1 cells.
- https://cdn.elifesciences.org/articles/82617/elife-82617-supp8-v2.xlsx
-
Supplementary file 9
DESeq2 transcript-level results for IFNG-stimulated WT and B2_Mm2.Dicer1 KO J774A.1 cells.
- https://cdn.elifesciences.org/articles/82617/elife-82617-supp9-v2.xlsx
-
Supplementary file 10
Primer and gRNA sequences used in this study.
- https://cdn.elifesciences.org/articles/82617/elife-82617-supp10-v2.xlsx
-
MDAR checklist
- https://cdn.elifesciences.org/articles/82617/elife-82617-mdarchecklist1-v2.docx
Download links
A two-part list of links to download the article, or parts of the article, in various formats.
Downloads (link to download the article as PDF)
Open citations (links to open the citations from this article in various online reference manager services)
Cite this article (links to download the citations from this article in formats compatible with various reference manager tools)
Mouse B2 SINE elements function as IFN-inducible enhancers
eLife 12:e82617.
https://doi.org/10.7554/eLife.82617


