Genetic architecture of heart mitochondrial proteome influencing cardiac hypertrophy
- Department of Pharmacology and Systems Physiology, University of Cincinnati College of Medicine, United States
- Department of Integrative Biology and Physiology, Field Systems Biology, Sciences Sorbonne Université, France
- Biochemistry Department, University of Wisconsin-Madison, United States
- Department of Surgery/Division of Cardiac Surgery, University of Southern California Keck School of Medicine, United States
- Metabolic Systems Biology Laboratory, Charles Perkins Centre, School of Life and Environmental Sciences, University of Sydney, Australia
- Jackson Laboratory, United States
- Cardiovascular Biology Research Program, Oklahoma Medical Research Foundation, United States
- Department of Medicine/Division of Cardiology, University of California, Los Angeles, United States
- Division of Oral Biology and Medicine, UCLA School of Dentistry, United States
- UCLA Institute for Quantitative and Computational Biosciences, United States
- Department of Chemistry, University of California, United States
- Department of Integrative Biology and Physiology, University of California, United States
- Department of Physiology, University of Oklahoma Health Sciences Center, United States
- Center for Epigenetics and Metabolism, United States
- Department of Biological Chemistry, University of California, United States
- Department of Anatomy and Physiology, University of Melbourne, Australia
- Department of Human Genetics, University of California, United States
- Department of Microbiology, Immunology and Molecular Genetics, University of California, United States
Figures
Figure 1
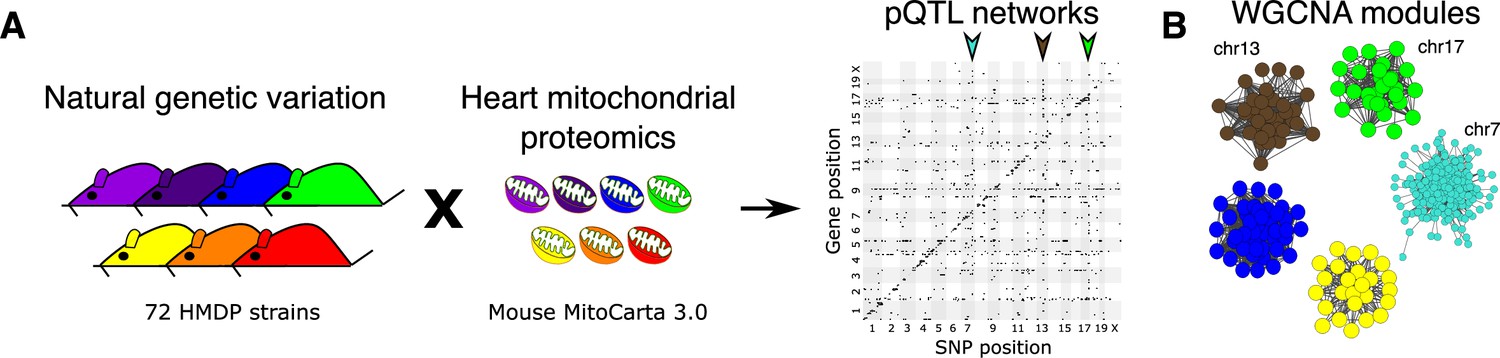
Genetic architecture of heart mitochondrial proteome.
(A) High-resolution association mapping of 848 heart mitochondrial proteins from 72 HMDP strains to identify pQTL networks. Associations between protein abundance levels and genetic variants located within 1 Mb of the respective gene location were considered as cis-pQTLs (p<1E-05) shown along the diagonal axis and the rest were considered as trans-pQTLs (p<1E-06). Three trans-pQTL hotspots are indicated by arrows. (B) Five WGCNA modules and the respective trans-pQTL hotspots are shown. HMDP, hybrid mouse diversity panel; pQTL, protein quantitative trait locus; WGCNA, weighted gene co-expression network analysis.
Figure 2
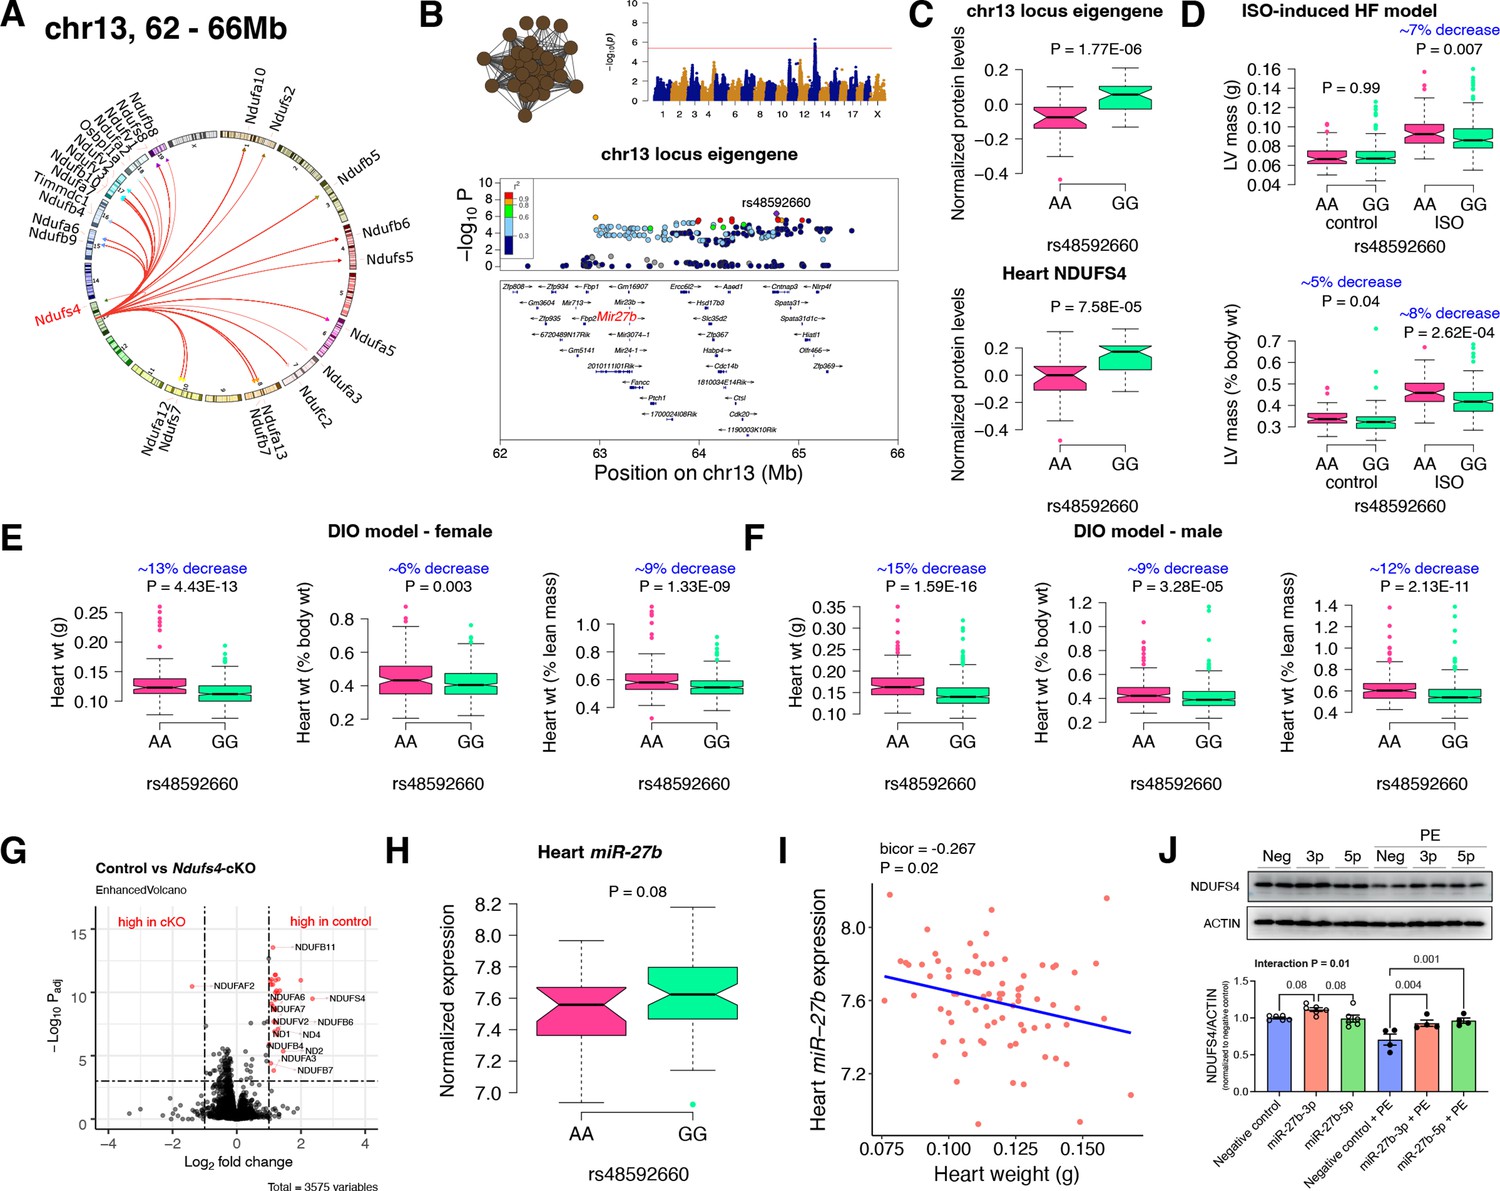
Chr13 locus controls mitochondrial complex-I via miR-27b/NDUFS4 axis.
(A) Circos plot showing chr13 hotspot. Each line signifies a significant association between the genetic variants and the respective protein levels with candidate genes being highlighted. (B) Manhattan and regional plots of chr13 locus (brown module) eigengene, respectively. Red line signifies genome-wide significance threshold (p<4.1E-06). The peak SNPs and the candidate genes are highlighted. Genotype distribution plots of (C) protein levels and eigengenes, and cardiac phenotypes from (D) ISO-induced HF model and (E) female and (F) male DIO model at peak SNP (rs48592660) associated with chr13 locus. (G) Volcano plot showing differentially expressed protein levels between control and heart-specific Ndufs4-cKO mice (n=5 mice/group). Significantly different proteins (significance cutoff: abs[log2FC]>1 and Padj <0.001) are highlighted in red. (H) Genotype distribution plots of heart miR-27b expression at peak SNP (rs48592660) associated with chr13 locus. (I) Gene-by-trait correlation plot between heart weight phenotype and heart miR-27b expression. (J) Immunoblot analyses of NDUFS4 protein levels in NRVMs transfected with mature miR-27b in the presence or absence of PE treatment. Data are presented as (C–F and H) boxplots showing median and interquartile range with outliers shown as circles (n=68–72 strains for protein levels; n=92–95 strains for ISO-model; n=92–100 strains for DIO-model; n=78 strains for miRNA levels) or (J) mean ± SEM (n=4–6 per group). p Values were calculated using (A and B) FaST-LMM that uses Likelihood-Ratio test; (C–F and H) Unpaired two-tailed Student’s t test; (I) BicorAndPvalue function of the WGCNA R-package that uses Unpaired two-tailed Student’s t test; (J) two-factor ANOVA corrected by post-hoc “Holm-Sidak’s” multiple comparisons test. ISO, isoproterenol; HF, heart failure; DIO, diet-induced obesity; NRVMs, neonatal rat ventricular myocytes; PE, phenylephrine.
-
Figure 2—source data 1
Uncropped blots for Figure 2, panel J.
Uncropped immunoblots probed for NDUFS4 (left) and ACTIN (right) protein levels in NRVMs transfected with mature miR-27b in the presence or absence of PE treatment. Corresponding molecular weight markers are labelled on the right side of each blot.
- https://cdn.elifesciences.org/articles/82619/elife-82619-fig2-data1-v2.pdf
-
Figure 2—source data 2
Raw unedited and uncropped blots for Figure 2, panel J.
- https://cdn.elifesciences.org/articles/82619/elife-82619-fig2-data2-v2.zip
Figure 3
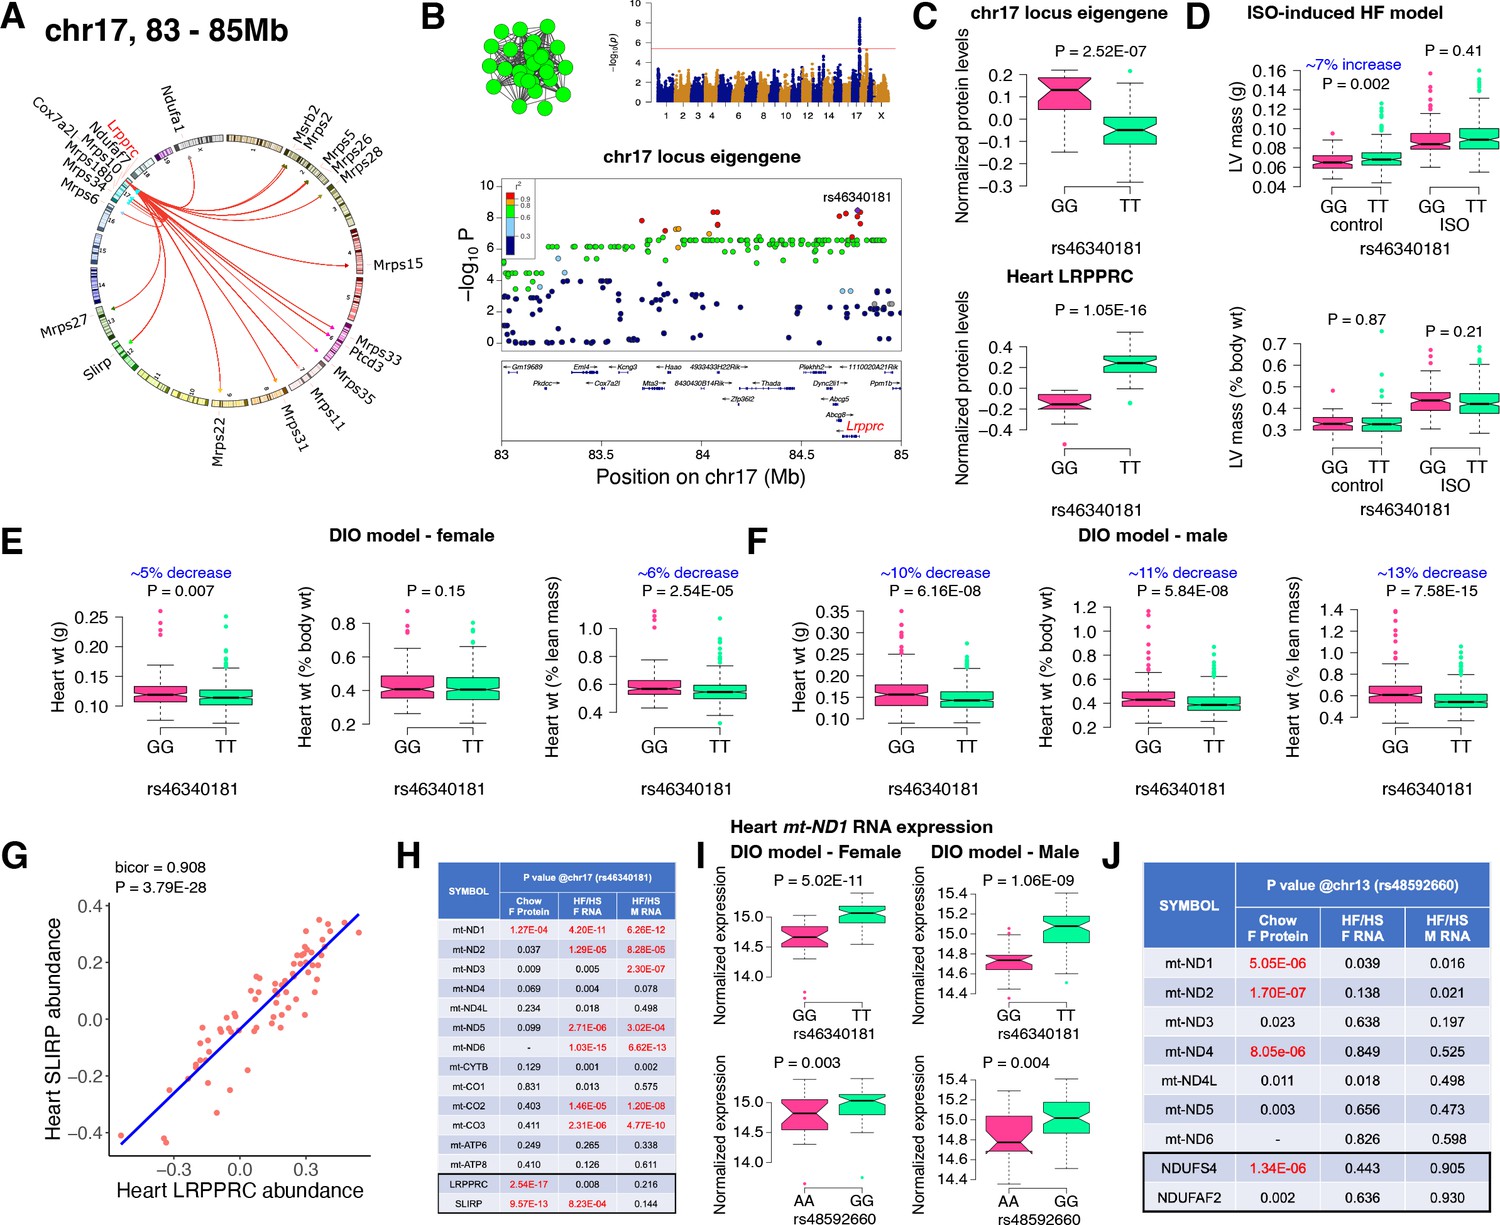
Chr17 locus controls mitoribosomes via LRPPRC/SLIRP.
(A) Circos plot showing chr17 hotspot. Each line signifies a significant association between the genetic variants and the respective protein levels with candidate genes being highlighted. (B) Manhattan and regional plots of chr17 locus (green module) eigengene, respectively. Red line signifies genome-wide significance threshold (P<4.1E-06). The peak SNPs and the candidate genes are highlighted. Genotype distribution plots of (C) protein levels and eigengenes, and cardiac phenotypes from (D) ISO-induced HF model and (E) female and (F) male DIO model at peak SNP (rs46340181) associated with chr17 locus. (G) Protein-by-protein correlation plot between heart LRPPRC and SLIRP abundance levels. (H) Association p values between mtDNA-encoded mRNA expression or protein abundance levels and peak SNP (rs46340181) associated with chr17 locus in both sexes of HMDP. (I) Genotype distribution plots of heart mt-ND1 mRNA expression from female and male DIO model at peak SNPs associated with chr17 (rs46340181) or chr13 (rs48592660) loci, respectively. (J) Association p values between mtDNA-encoded complex-I related mRNA expression or protein abundance levels and peak SNP (rs48592660) associated with chr13 locus in both sexes of HMDP. Data are presented as (C–F and I) boxplots showing median and interquartile range with outliers shown as circles (n=68–72 strains for protein levels; n=92–95 strains for ISO-model; n=92–100 strains for DIO-model). p Values were calculated using (A, B, H and J) FaST-LMM that uses Likelihood-Ratio test; (C–F and I) Unpaired two-tailed Student’s t test; (G) BicorAndPvalue function of the WGCNA R-package that uses Unpaired two-tailed Student’s t test.
-
Figure 3—source data 1
Raw data for Figure 3, panel H.
Association p values between mtDNA-encoded mRNA expression or protein abundance levels and peak SNP (rs46340181) associated with chr17 locus in both sexes of HMDP. p Values were calculated using FaST-LMM that uses Likelihood-Ratio test.
- https://cdn.elifesciences.org/articles/82619/elife-82619-fig3-data1-v2.xlsx
-
Figure 3—source data 2
Raw data for Figure 3, panel J.
Association p values between mtDNA-encoded complex-I related mRNA expression or protein abundance levels and peak SNP (rs48592660) associated with chr13 locus in both sexes of HMDP. p Values were calculated using FaST-LMM that uses Likelihood-Ratio test.
- https://cdn.elifesciences.org/articles/82619/elife-82619-fig3-data2-v2.xlsx
Figure 4 with 1 supplement
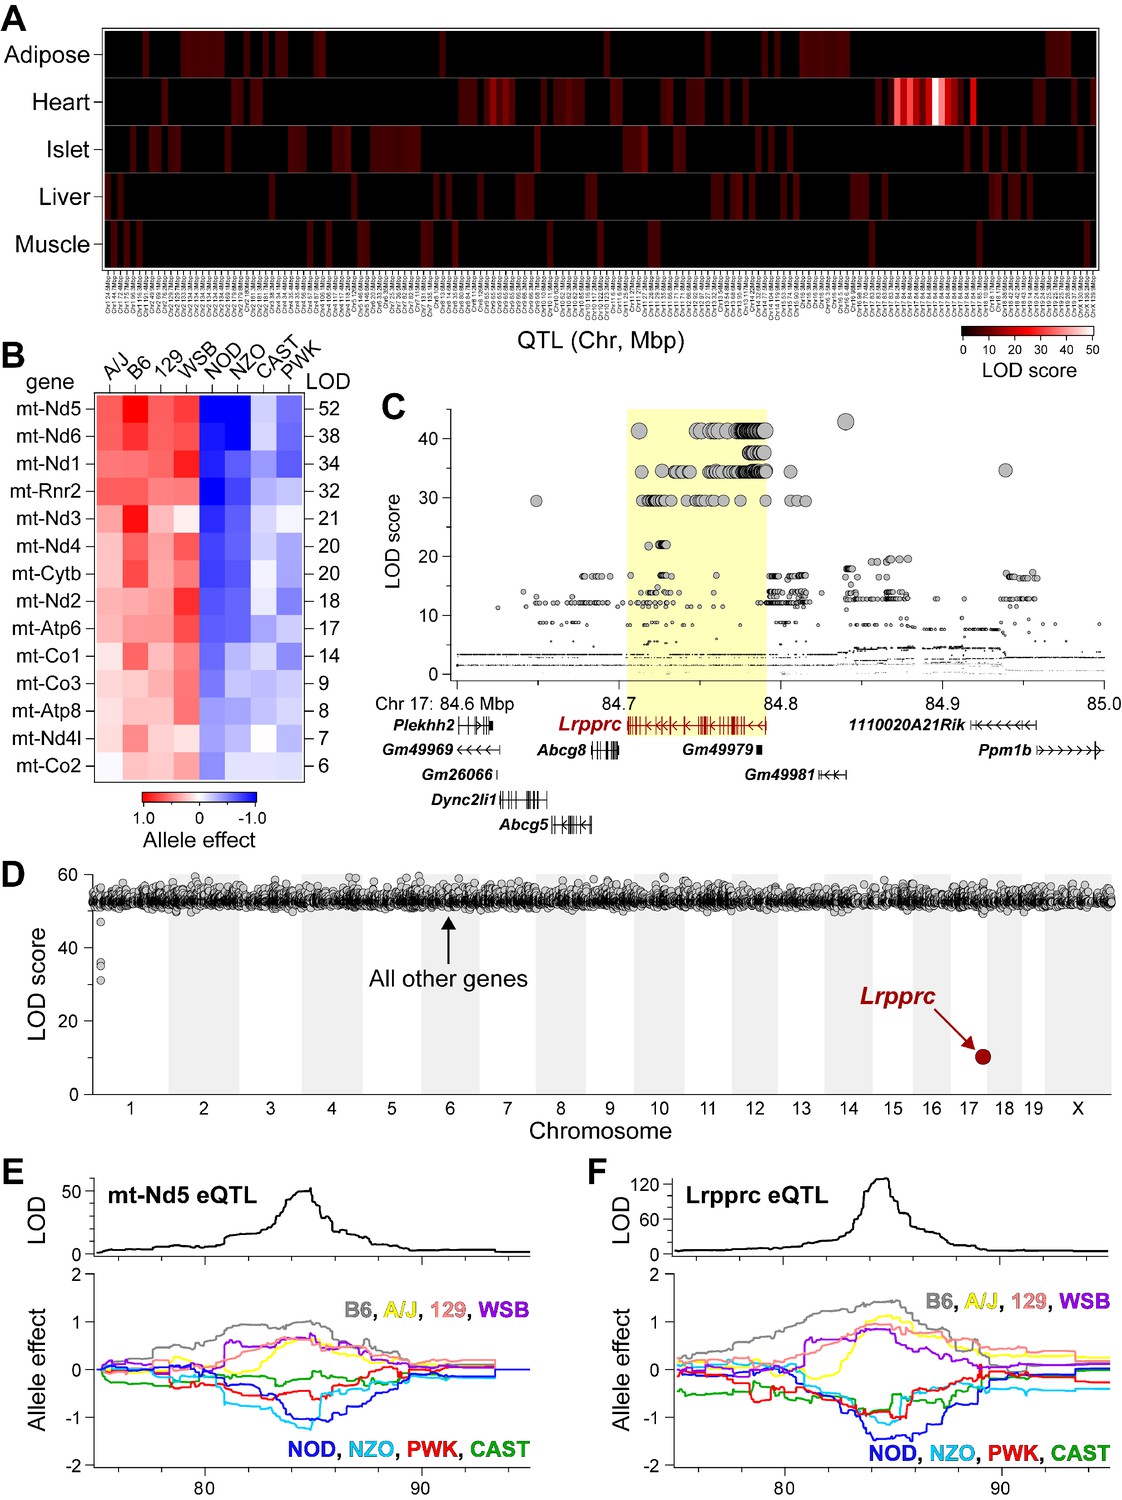
Lrpprc regulates an mt-encoded eQTL hotspot specifically in heart of DO mice.
(A) Heatmap illustrates all eQTL (LOD >6) for mt-encoded transcripts that were identified in Adipose (Wang et al., 2012), Heart (Ruzzenente et al., 2012), Islet (Gu et al., 2016), Liver (Rath et al., 2021), and Muscle (Wang et al., 2016) from Diversity Outbred mice maintained on a Western-style diet. Mt-eQTL are arranged along x-axis according to genomic position from chr1 to chrX; z-axis depicts LOD score, highlighting a hotspot on chr17 at ~85 Mbp. (B) Allele effect patterns for mt-eQTL mapping to chr17 hotspot in heart. Red illustrates alleles associated with increased expression; blue, decreased expression. LOD scores are shown along right margin. (C) SNP association profile for mt-Nd5 eQTL in heart. Lrpprc contains SNPs with strongest association, yellow highlighted region. (D) Mediation of mt-Nd5 eQTL against all transcripts in heart. The LOD score for mt-Nd5 is significantly reduced when conditioned on a Lrpprc cis-eQTL, consistent with genetic regulation of Lrpprc being required for the regulation of mt-Nd5. The mt-Nd5 eQTL (E) and Lrpprc cis-eQTL (F) in heart demonstrate matched and concordant allele effect patterns, suggesting Lrpprc is a positive driver of mt-Nd5.
Figure 4—figure supplement 1

Mediation analysis identifies Lrpprc as a driver for the heart-specific mt- eQTL hotspot on chr17.
LOD scores for 14 mt-eQTL at ~85 Mbp on chr17 before and after conditioning on Lrpprc cis-eQTL in the heart. The average percent drop in the LOD score for the mt-eQTL upon condition to Lrpprc was 79%, with a range of 51% (mt-Co2) to 94% (mt-Rnr2).
Figure 5
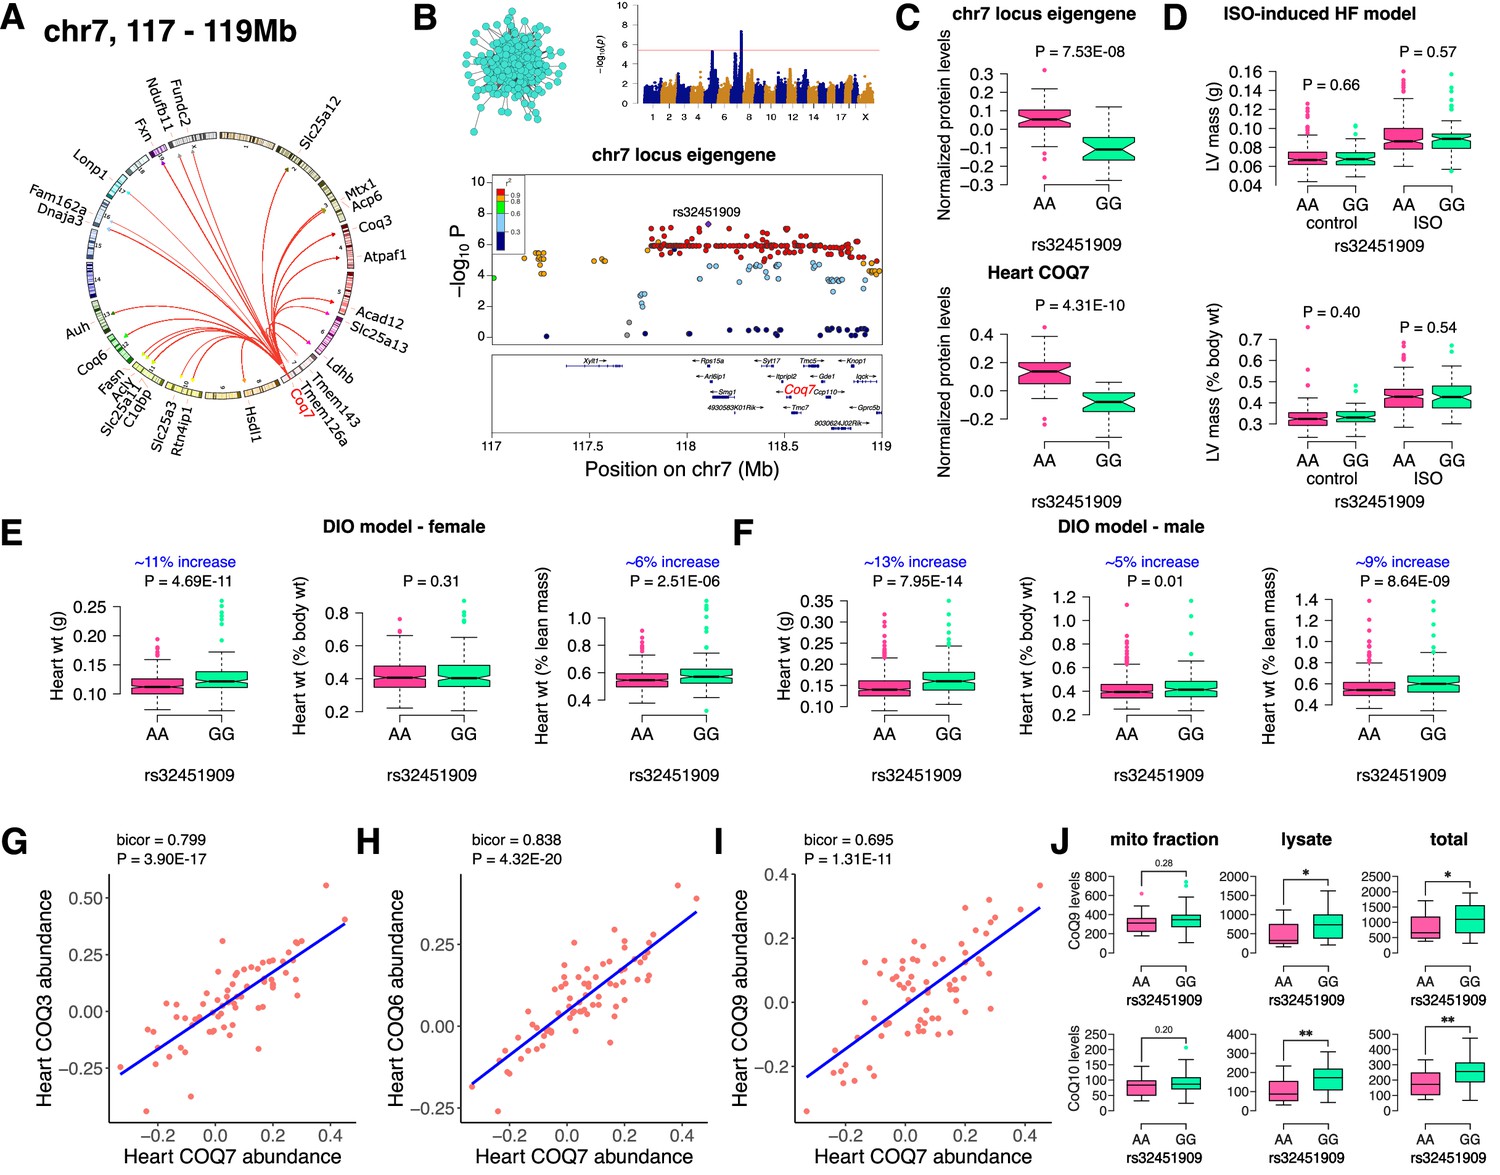
Chr7 locus affects CoQ metabolism via COQ7.
(A) Circos plot showing chr7 hotspot. Each line signifies a significant association between the genetic variants and the respective protein levels with candidate genes being highlighted. (B) Manhattan and regional plots of chr7 locus (turquoise module) eigengene, respectively. Red line signifies genome-wide significance threshold (p<4.1E-06). The peak SNPs and the candidate genes are highlighted. Genotype distribution plots of (C) protein levels and eigengenes, and cardiac phenotypes from (D) ISO-induced HF model and (E) female and (F) male DIO model at peak SNP (rs32451909) associated with chr7 locus. Protein-by-protein correlation plots between heart COQ7 and (G) COQ3, (H) COQ6 and (I) COQ9 abundance levels. (J) Genotype distribution plots of CoQ9 or CoQ10 levels in both the mitochondrial fractions and total heart lysates from female DIO model at peak SNPs associated with chr7 (rs32451909) locus. Data are presented as (C–F and J) boxplots showing median and interquartile range with outliers shown as circles (n=68–72 strains for protein levels; n=92–95 strains for ISO-model; n=92–100 strains for DIO-model; n=15 strains for CoQ9 and CoQ10 levels). p Values were calculated using (A and B) FaST-LMM that uses Likelihood-Ratio test; (C–F and J) Unpaired two-tailed Student’s t test; (G–I) BicorAndPvalue function of the WGCNA R-package that uses Unpaired two-tailed Student’s t test.
Additional files
-
Supplementary file 1
Supplementary tables.
(a) List of HMDP strains used for proteomic analyses and their respective genotypes at the three loci. (b) Five modules of WGCNA and their corresponding proteins. (c) List of proteins associated with chr13 locus listed in Figure 2A. The associated P values between the respective proteins and chr13 locus eigengene pSNP are listed. (d) List of proteins associated with chr17 locus listed in Figure 3A. The associated P values between the respective proteins and chr17 locus eigengene pSNP are listed. (e) List of proteins associated with chr7 locus listed in Figure 4A. The associated P values between the respective proteins and chr7 locus eigengene pSNP are listed. (f) Scoring of miRNA targeting Ndufs4 by nine algorithms and one dataset of experimental validation. (g) List of differentially abundant proteins between the control and Ndufs4-cKO groups, and their P values shown in Figure 2. Only proteins that passed the signifcant cut-off (abs[log2FC]>1 and Padj <0.001) are listed. Proteins overlapping chr13 locus are shown in blue font. (h) List of 157 mt-eQTL (LOD >6) across five tissues in the DO mice as shown in Figure 4A. (i) SNP association profile for mt-Nd5 in heart as shown in Figure 4C. (j) Protein-protein correlations between the three candidates and known hypertrophic markers. The bicor P values between the respective markers and each locus candidate gene are listed.
- https://cdn.elifesciences.org/articles/82619/elife-82619-supp1-v2.xlsx
-
Supplementary file 2
Expression values for mt-encoded transcripts and/or Lrpprc in skeletal muscle (2 a), adipose (2b), islets (2 c), liver (2d) and heart (2e).
- https://cdn.elifesciences.org/articles/82619/elife-82619-supp2-v2.xlsx
-
Transparent reporting form
- https://cdn.elifesciences.org/articles/82619/elife-82619-transrepform1-v2.docx
Download links
A two-part list of links to download the article, or parts of the article, in various formats.
Downloads (link to download the article as PDF)
Open citations (links to open the citations from this article in various online reference manager services)
Cite this article (links to download the citations from this article in formats compatible with various reference manager tools)
Genetic architecture of heart mitochondrial proteome influencing cardiac hypertrophy
eLife 12:e82619.
https://doi.org/10.7554/eLife.82619


