Piezo1 as a force-through-membrane sensor in red blood cells
- Laboratory of Molecular Neurobiology and Biophysics, Howard Hughes Medical Institute, The Rockefeller University, United States
- Bio-Imaging Resource Center, The Rockefeller University, United States
- Department of Physics and Astronomy and Department of Quantitative and Computational Biology, University of Southern California, United States
Figures
Figure 1 with 2 supplements
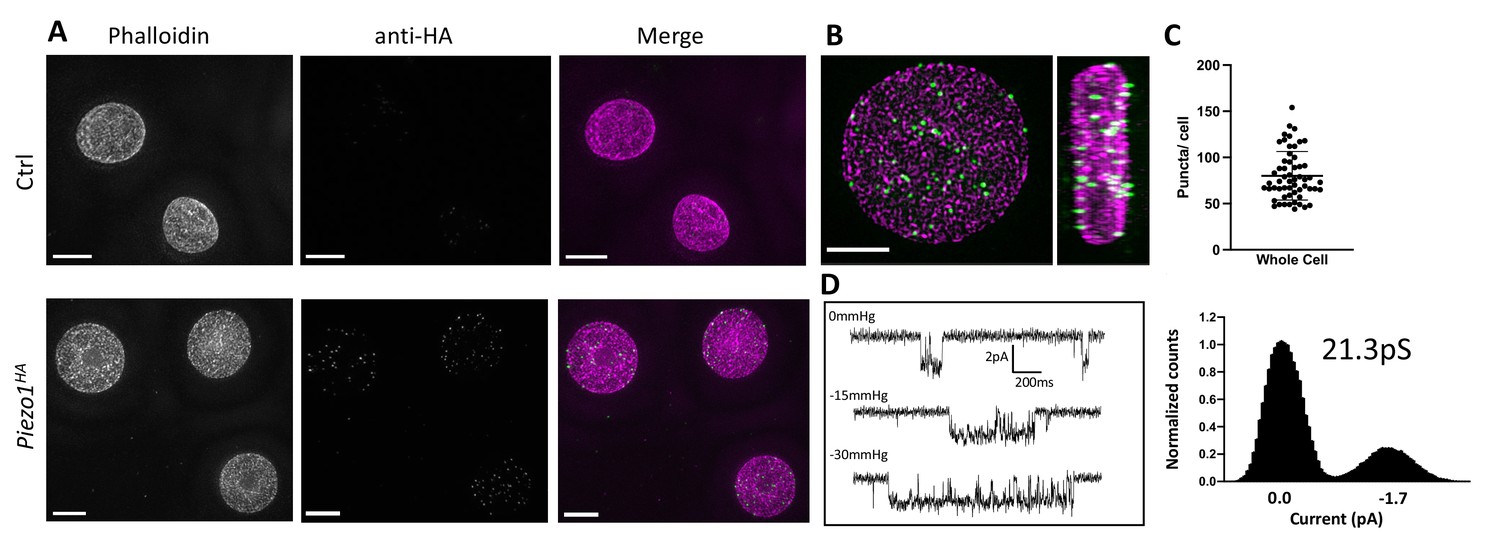
Detection of Piezo1 in RBCs.
(A) Reconstructed 3D-structured illumination microscopy (3D-SIM) images of red blood cells (RBCs), shown as maximum projections of z-stacks, from control (Ctrl, top row) or Piezo1HA (bottom row) mice labeled using rhodamine phalloidin (magenta) and an antibody directed against the HA tag of Piezo1 (green). Scale bar, 3 μm. (B) 3D volume rendering of a representative labeled Piezo1-HA-KI mouse RBC displayed as XY (left) and XZ (right) axis views, showing the distribution of Piezo1. Scale bar, 2 μm. (C) Quantification of the number of Piezo1 spots per cell from 3D-SIM maximum projections. Mean ± standard deviation (SD) = 80.2 ± 26 spots per cell. Numbers were calculated on individual cells (n = 57) using Imaris spot detection. (D) Representative single channel traces from excised inside-out patch recordings of RBCs in symmetric 150 mM NaMethanesulfonate. The patch was clamped at −80 mV and negative pressure (0 to −30 mm Hg) was applied to the patch pipette. Amplitude histogram (right) enables estimation of single channel conductance. Showing one trace from n = 4 recordings.
Figure 1—figure supplement 1
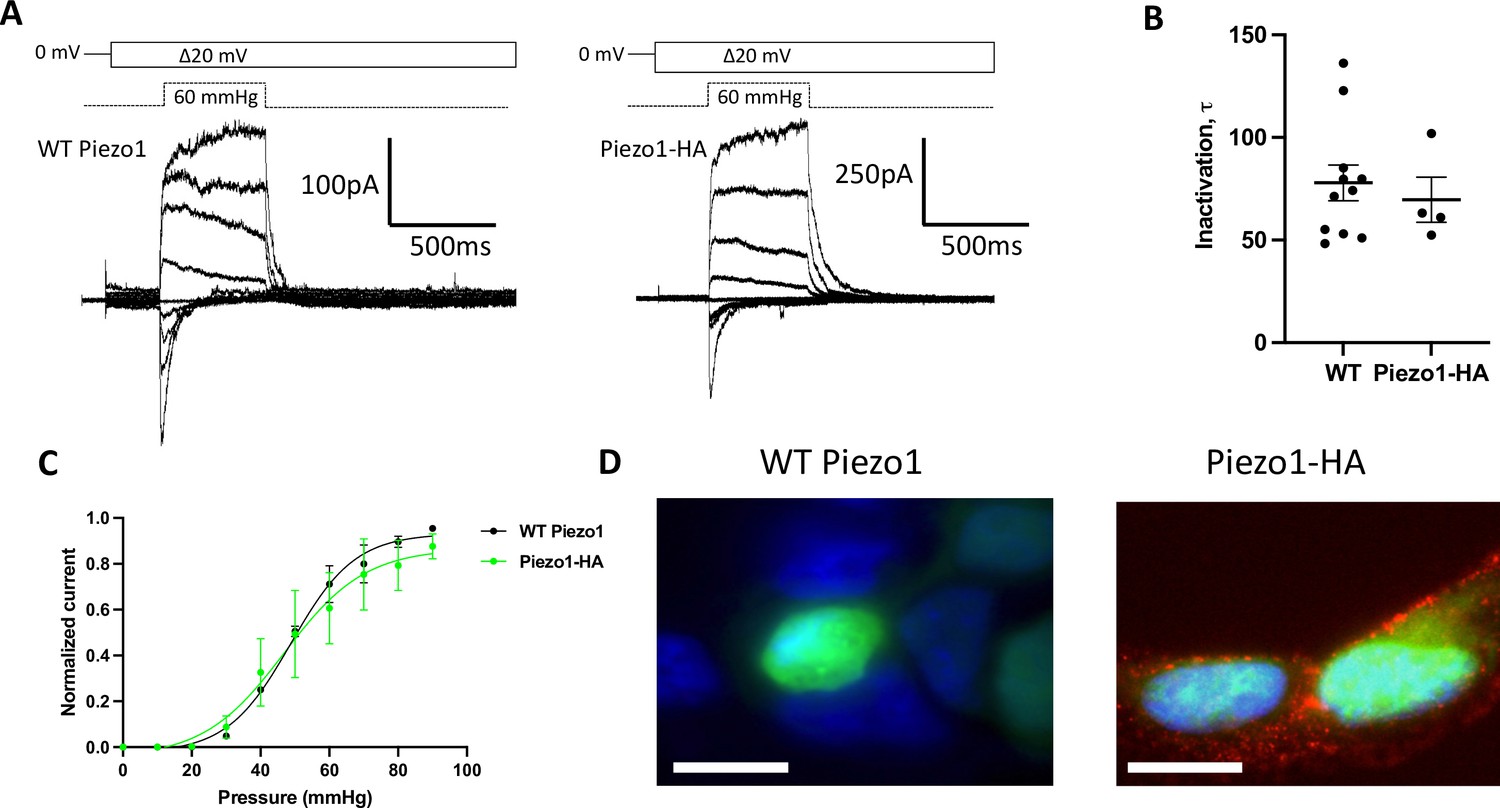
In HEK293 cells HA-tagged Piezo1 behaves like wildtype Piezo1 in electrophysiology recordings and can be specifically detected by immunostaining.
(A) Representative traces of currents elicited at 60 mm Hg pressure and increasing voltages (in 20 mV steps from −80 to +80 mV) in symmetrical NaCl from excised outside-out patches of HEK293 Piezo1 KO cells overexpressing wildtype (left) or HA-tagged mPiezo1 (right). (B) Inactivation time-constants for wildtype and HA-tagged mouse Piezo1 with a holding voltage −80 mV and pressure pulses of +60 mm Hg. (C) Outside-out patches were held at +60 mV and subjected to 500-ms pulses of increasing pressure. Normalized mean current–pressure relations are shown. For each individual patch, currents were normalized to the peak current for that patch. (D) Immunofluorescence in HEK293 Piezo KO cells expressing wildtype or HA-tagged mPiezo1 in a Piezo1-IRES-GFP (green) vector stained with anti-HA primary antibody and Alexa 568-conjugated secondary antibody (red). Membranes were not permeabilized and nuclear stain 4’,6’-diamidino-2-phenylindole (DAPI) (blue) was used for nuclear staining. Scale bars, 10 µm.
Figure 1—figure supplement 2

Representative images of XY and XZ two dimensional slice views from SIM images of immunostained red blood cells (RBCs) from Piezo1-HA mice.
Piezo1 is in green and actin stained by phalloidin is in magenta. Piezo1 spots are observed adjacent to the actin signal, which is a proxy for the membrane in RBCs. Scale bars, 1 μm.
Figure 2 with 2 supplements
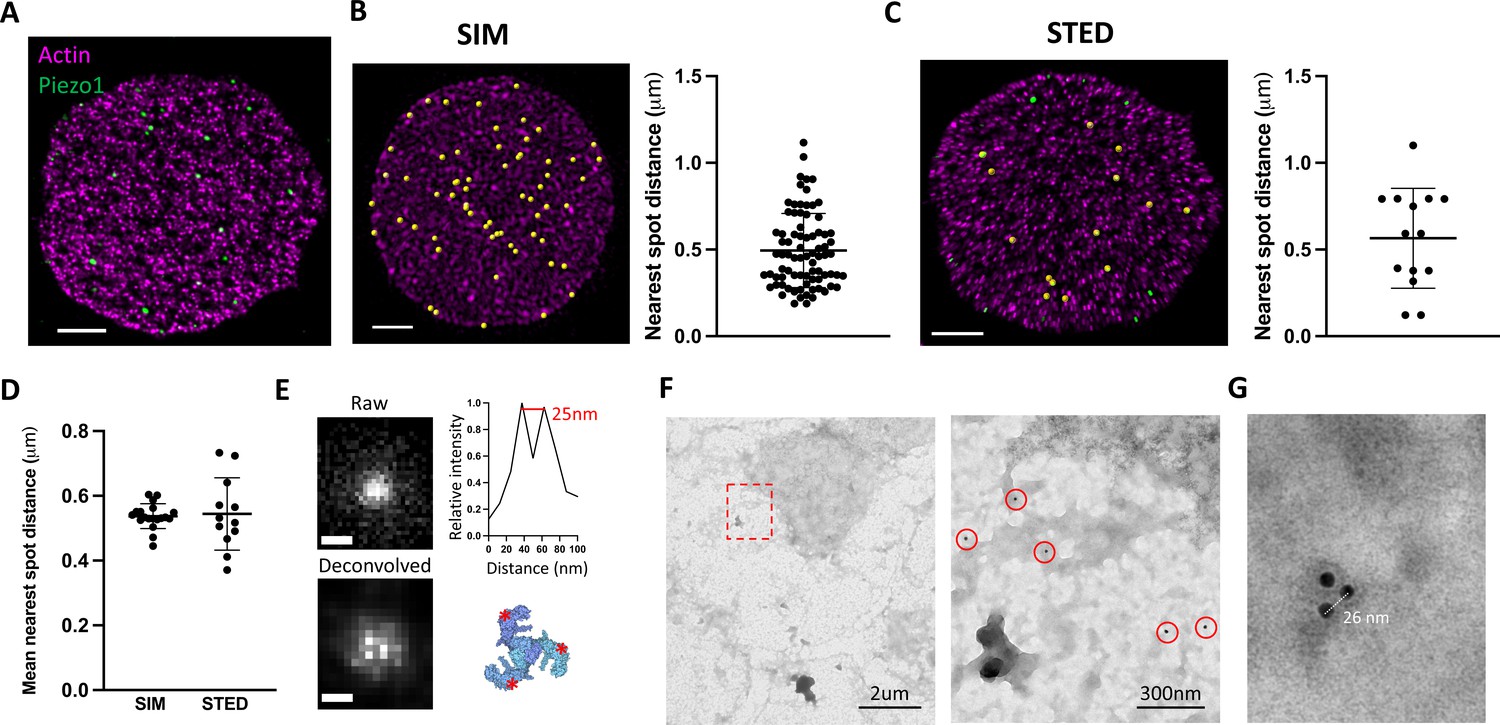
Piezo1 does not cluster in red blood cells (RBCs).
(A) Representative 2D stimulated emission depletion (STED) image of an unroofed RBC immunostained with an anti-HA tag antibody for Piezo1 (green) and labeled with phalloidin STAR 580 for F-actin (magenta). Scale bar, 1 μm. (B) 3D reconstruction from SIM imaging of immunostained RBCs, where Piezo1 spots are detected by the spot detector function in Imaris and are colored yellow. The distance from each Piezo1 spot to the nearest Piezo1 spot in this cell was calculated in Imaris and is shown on the right. Scale bar, 1 μm. (C) The same analysis as in (B) was carried out on a 2D STED image of an unroofed RBC, but here Piezo1 spots at the edge of the membrane were masked out from spot detection to prevent edge-based artifacts in estimating nearest neighbor distances. Scale bar, 1 μm. (D) The mean nearest spot distance was calculated for SIM and STED analyses and plotted. For SIM the mean is 540 ± 37 nm (n = 19 cells) and for STED the mean is 544 ± 106 nm (n = 12 cells). (E) (Left) Huygens deconvolution of a Piezo1 puncta, imaged by 2D STED, resolving into a triplet after deconvolution, scale bar is 50 nm. (Bottom right) A top-down view of the Piezo1 channel structure with red asterisks indicating the positions of antibody binding. (Top right) An intensity profile of fluorescent signal from a line-scan of two adjacent bright pixels from the bottom left image, showing a distance of ~25 nm. (F) Negative stain electron microscopy of an unroofed RBC immunostained with an anti-HA tag primary antibody and a secondary antibody conjugated to 18-nm gold. Low magnification image of an unroofed RBC (left) with a region highlighted in red imaged at medium magnification (right). 18-nm gold particles corresponding to labeled Piezo1 channels are highlighted by red circles. As in fluorescence microscopy images, Piezo1 channels do not appear to cluster. (G) Negative stain electron microscopy image at high magnification of a triple-labeled Piezo1 channel.
Figure 2—figure supplement 1
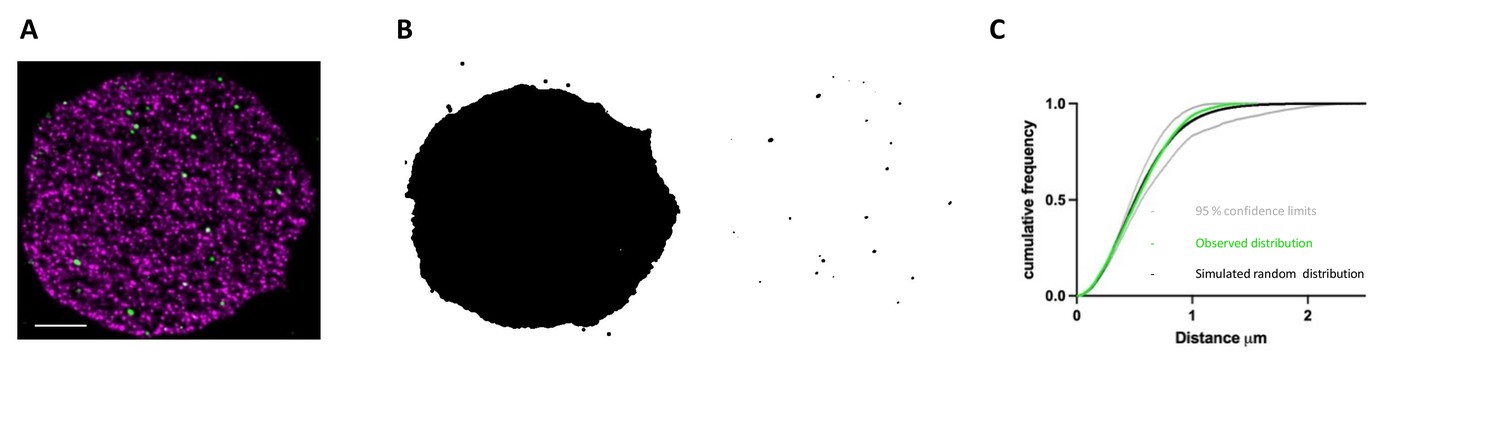
Cluster analysis of fluorescent Piezo1 spots in a 2D stimulated emission depletion (STED) image of a labeled unroofed red blood cell (RBC) membrane.
(A) Representative 2D STED image of an unroofed RBC membrane immunostained with an anti-HA tag antibody for Piezo1 (green) and labeled with phalloidin STAR 580 for F-actin (magnta). Scal bar, 1 μm. (B) Binarized mask of the RBC membrane using thresholding of the rhodamine–phalloidin (left) and binarized thresholding of fluorescent Piezo1 spots (right). (C) Cluster analysis using the spatial statistics 2D/3D ImageJ plugin. The cumulative distribution frequency of the distance between a typical position within the masked reference structure and its nearest point in the pattern is plotted on the y-axis against the distance, x-axis, for a simulated random spatial distribution (black) with 95% confidence limits (gray) compared to the observed experimental distribution (green). There is no statistical difference between the simulated randomly distributed data and observed data. N = 1 cell.
Figure 2—figure supplement 2
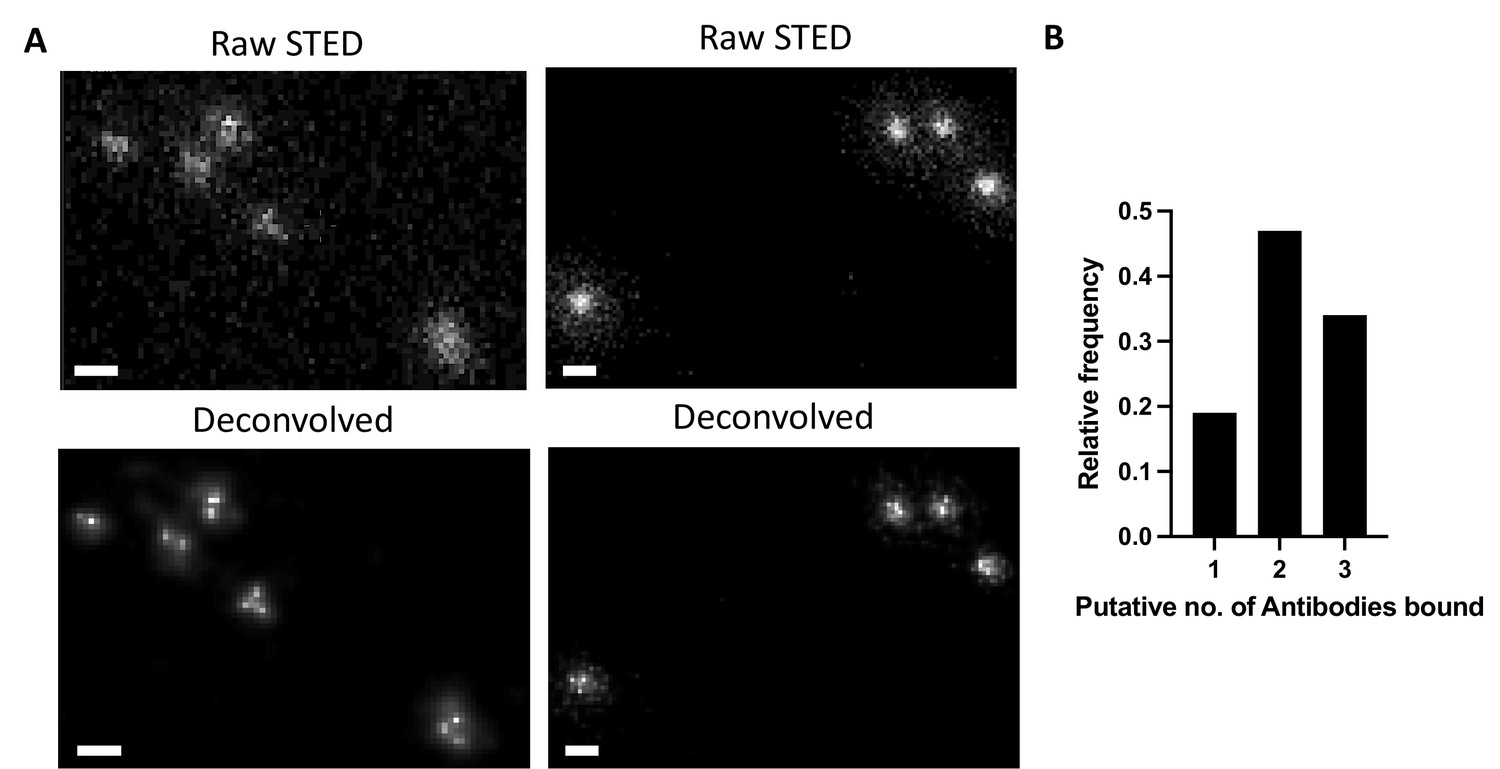
2D STED and Huygens deconvolution analysis of immunolabelled Piezo1 in unroofed RBCs.
(A) Two representative sets of images of Piezo1 fluorescent spots after stimulated emission depletion (STED) data collection (top panels) followed by Huygens deconvolution (bottom panels) Piezo1 spots resolve into singlets, doublets, or triplets, with the bright pixels separated by approximately 25 nm. Scale bar, 50 nm. (B) After selecting Piezo1 fluorescent puncta with a max intensity above 20,000 arbitrary units we counted the putative number of antibodies bound based on resolved bright pixels where n = 33 fluorescent puncta from 3 unroofed cells. Here, we show a relative frequency distribution for 1, 2, or 3 antibodies bound. Assuming a binomial distribution for antibody binding, our data are consistent with approximately 60% antibody binding.
Figure 3 with 2 supplements
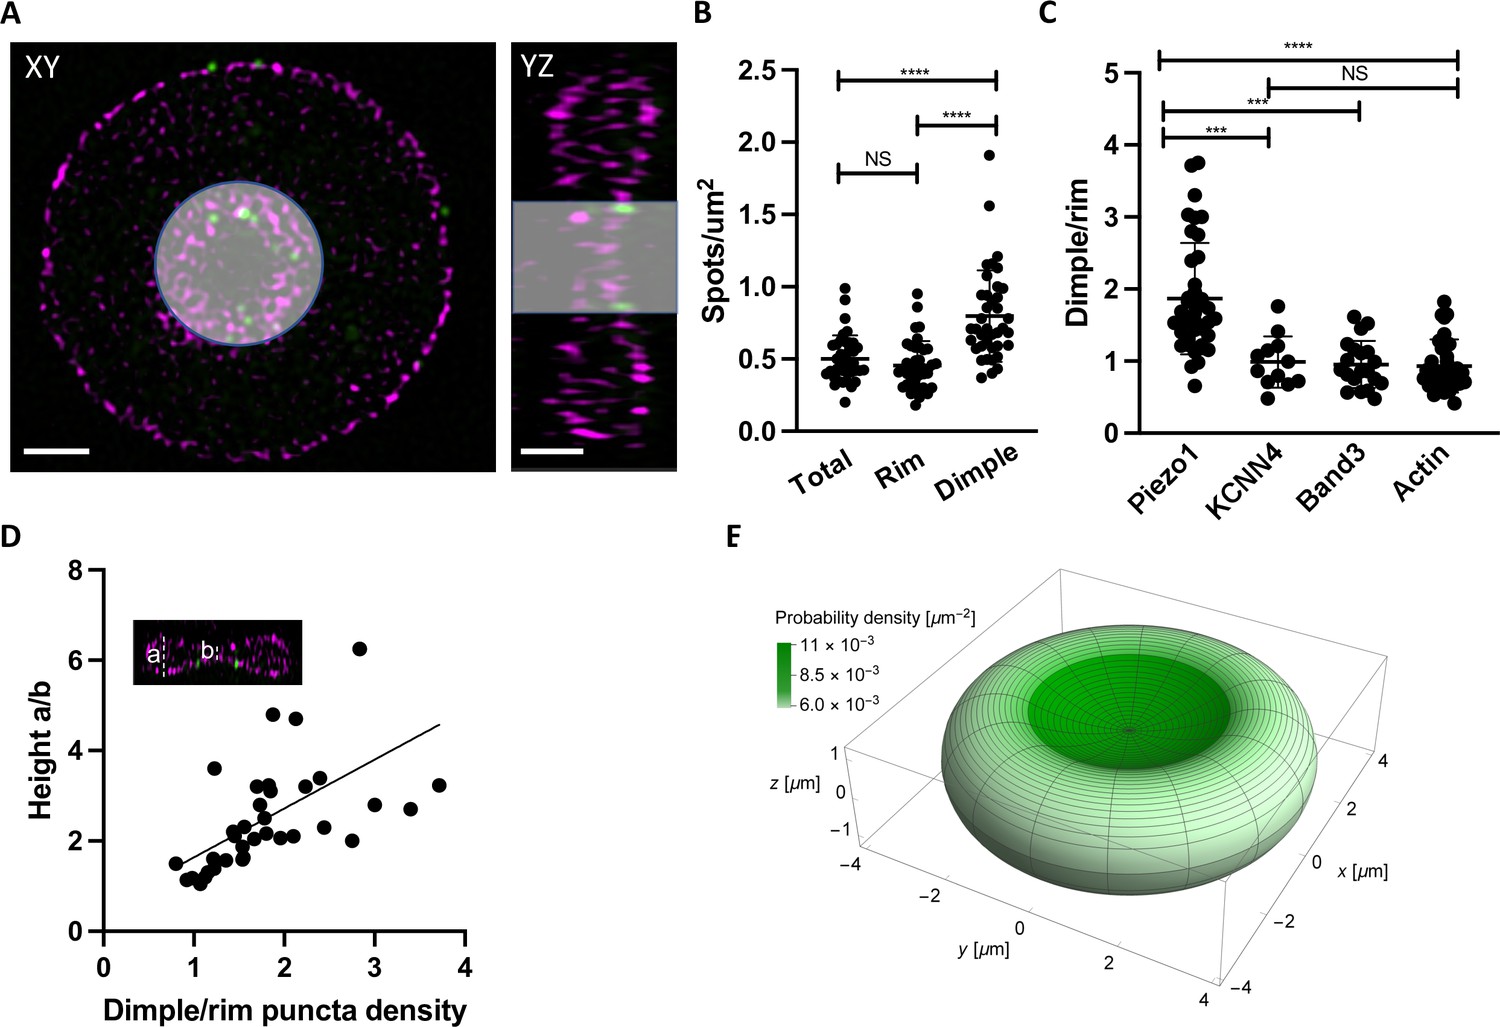
Piezo1 localization is enriched in the curved dimple regions of the red blood cell .
(A) Two dimensional slices in XY and YZ views from SIM images illustrating volume segmentation of RBCs and Piezo1 puncta distribution after labeling with an antibody against Piezo1-HA (green) and rhodamine–phalloidin for F-actin (magenta). Cells were segmented and masked in Imaris as shown. Scale bar, 1 μm. (B) Distribution of Piezo1 puncta in RBCs. The RBC dimple has a higher density of Piezo1 puncta than whole RBCs (Total) (p = <0.0001) and the rim region (p = <0.0001) by the one-way analysis of variance (ANOVA) test with Tukeys post hoc analysis, as indicated on the graph by asterisks where *** indicates p<0.001 and **** indicates p<0.0001. N = 39 cells (C) The ratio of Piezo1 spot density (1.87 ± 0.76, N = 39 cells) in the dimple and rim region of RBCs compared to that of KCNN4 (0.99 ± 0.36, N = 12 cells), Band3 (0.95 ± 0.33, N = 20 cells), and Actin (0.93 ± 0.36, N = 31 cells). The dimple over rim ratio is higher for Piezo1 than KCNN4 (p = 0.0003) and Band3 (p = 0.0003) and Actin (p < 0.0001). (D) Scatterplot of ratio of Piezo1 puncta density in dimple over rim plotted against RBC biconcavity, measured as height ratio a/b (see inset). N = 37 cells. Data are fit by linear regression with equation y = 1.08x + 0.55, R2 = 0.34 and p = 0.0001. (E) Probability per unit area for finding a Piezo1 channel at a given RBC membrane location, calculated from a physical model of Piezo1 curvature coupling (see methods) and plotted over the RBC membrane surface. The RBC shape corresponds to Beck’s model of for RBC discocytes (Beck, 1978).
Figure 3—figure supplement 1
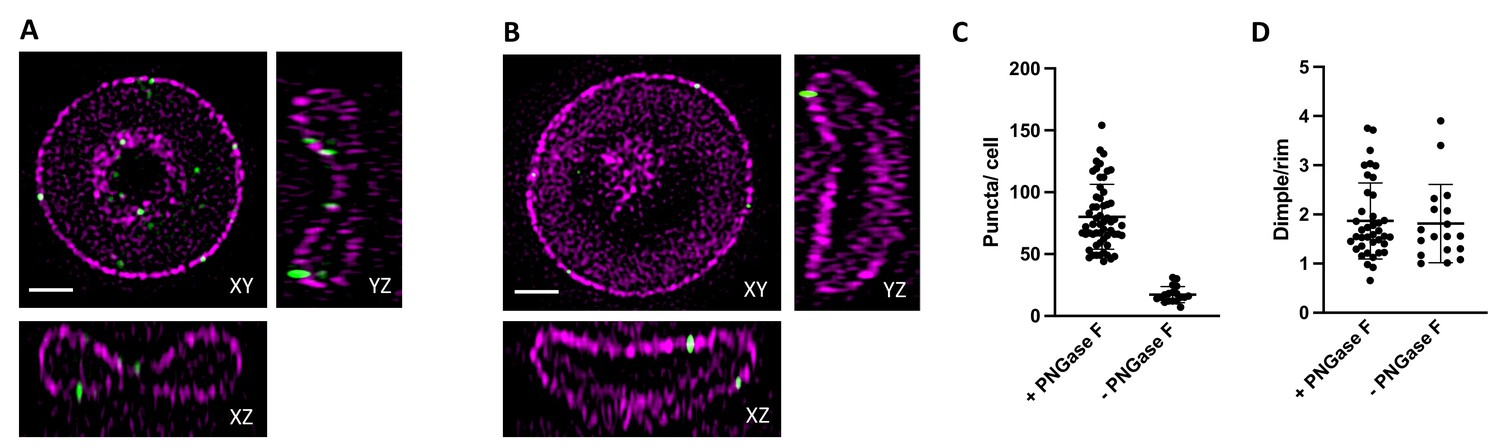
Examples of two cells with different biconcavities and analysis of PNGase F treatment on Piezo1 distribution.
(A) 2D slices of a red blood cell (RBC) with a biconcavity (measured as the ratio of maximum to minimum heights of the RBC along a central XZ slice) of 6.25 and a relative dimple to rim Piezo1 spot density of 2.83. (B) As in (A) but of a RBC with a biconcavity of 1.1 and a relative dimple to rim density of 1.05. Scale bar, 1 μm. (C) Comparison of the number of Piezo1 spots per cell from 3D-structured illumination microscopy (3D-SIM) maximum projections of RBCs prepared with or without PNGase F treatment. For cells treated with PNGase F mean ± standard deviation (SD) = 80.2 ± 26.0 spots per cell (N = 57 cells) and for cells not treated with PNGase F mean ± SD = 17.3 ± 6.3.0 spots per cell (n = 19 cells). (D) Comparison of the Piezo1 spot density in the dimple over rim region of RBCs prepared with or without PNGase F treatment. For cells treated with PNGase F mean ± SD = 1.87 ± 0.76 (N = 39 cells) and for cells not treated with PNGase F mean ± SD = 1.81 ± 0.77 (N = 18 cells).
Figure 3—figure supplement 2
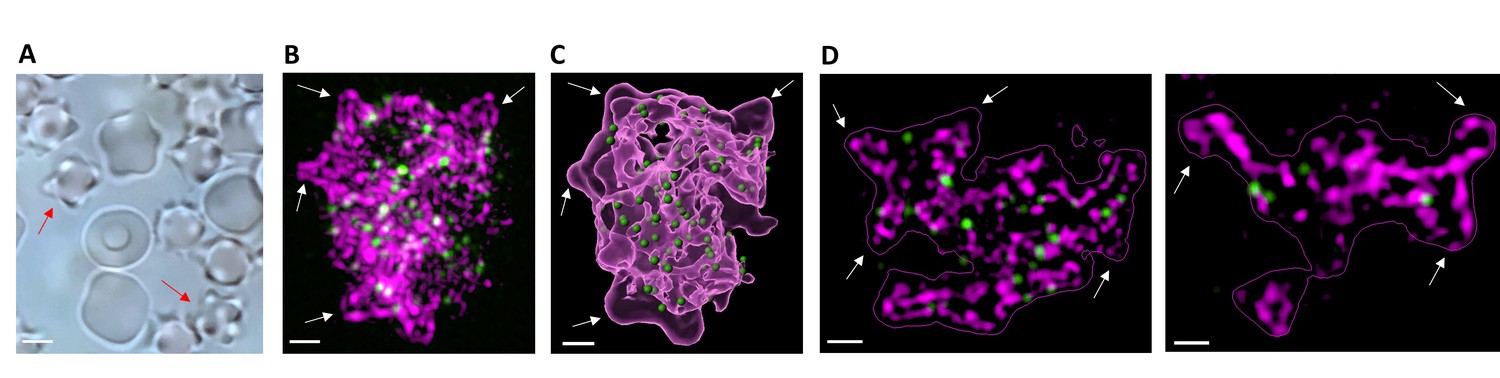
Piezo1 is depleted from membrane regions of high positive curvature in echinocytes.
(A) Brightfield imaging of red blood cells (RBCs) treated with 10 mM NaSalicylate to generate echinocytes. Two examples of echinocytes are indicated with red arrows. Scale bar, 2 μm. (B) Example of an echinocyte labeled with an anti-HA antibody against Piezo1 (green) and rhodamine–phalloidin to label F-actin (magenta). White arrows indicate membrane protrusions of positive curvature where Piezo1 is clearly excluded. Scale bar, 500 nm. (C) as in (B) but with the F-actin signal shown as a translucent surface representation (magenta) and the fluorescent Piezo1 spots in green for easier visualization of exclusion of Piezo1 from membrane protrusions. Scale bar, 500 nm. (D) Left and right are two different Z-slice images from the echinocyte in (B) to illustrate in 2D the exclusion of Piezo1 from membrane protrusions. Scale bar, 500 nm.
Figure 4 with 2 supplements
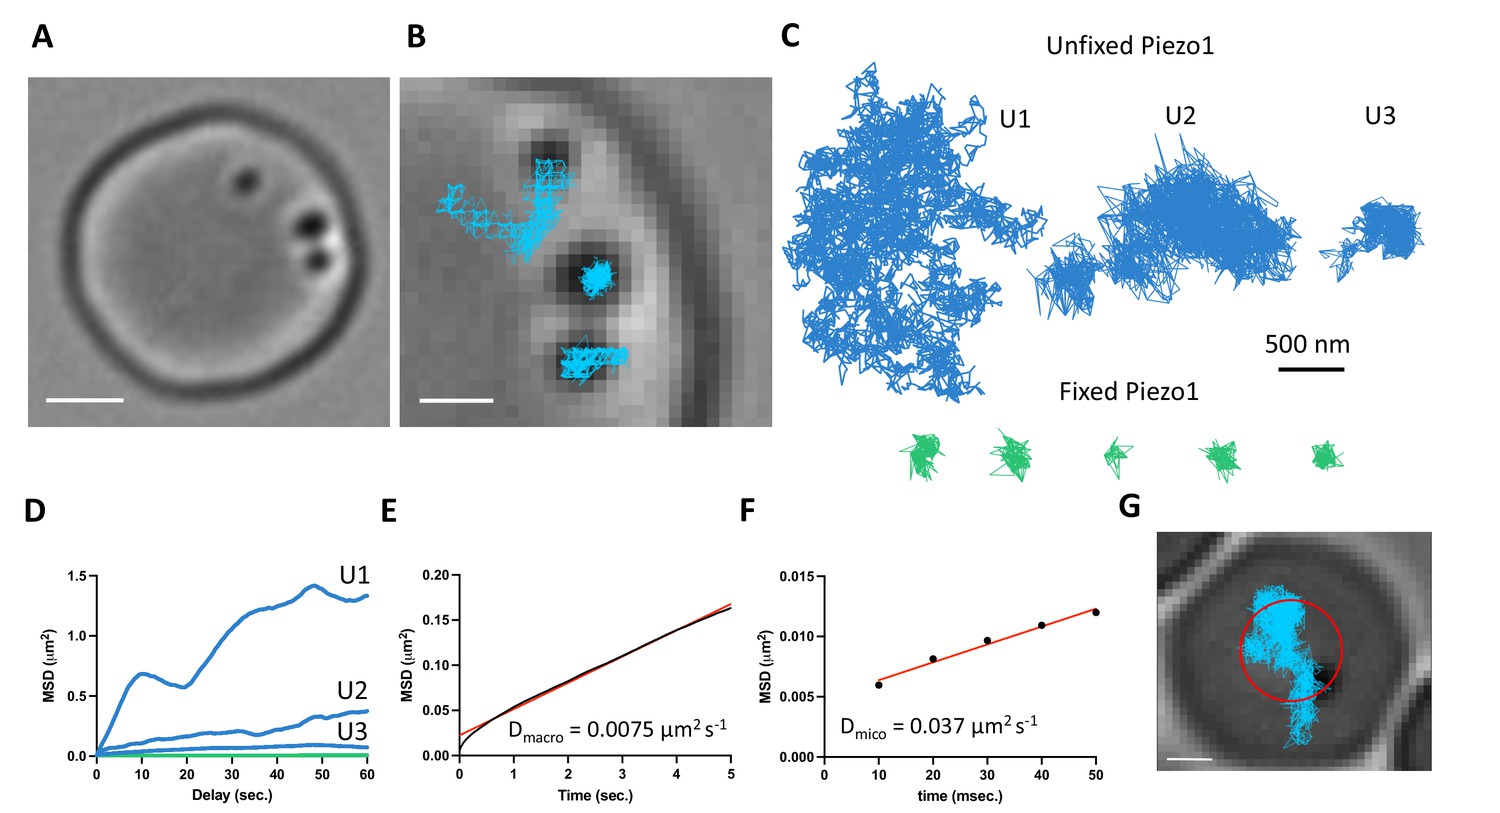
Gold-particle tracking of Piezo1 reveals its lateral mobility in the red blood cell membrane.
(A) Example of a RBC imaged under DIC microscopy showing three 40-nm gold particle-labeled Piezo1 channels. Scale bar, 2 μm. (B) Close-up image of the gold particles with trajectories from a 2-min recording at 100 Hz frequency. Scale bar, 1 μm. (C) Representative trajectories corresponding to distinct Piezo1 diffusive behaviors in unfixed conditions, shown in blue (trajectories U1, U2, and U3). The green trajectories correspond to labeled Piezo1 in cells fixed with paraformaldehyde (PFA). (D) MSD against time for the first 60 s of the trajectories U1, U2, and U3 in C corresponding to unfixed conditions (blue) and an average of n = 5 fixed trajectories (green). (E) MSD against time for the first 5 s of an average of 14 trajectories. The data are fit to a straight line with a slope corresponding to a 2D diffusion coefficient of 0.0075 μm2 s−1. R2 for linear fit to data is 0.99. (F) MSD against time for the first 50 ms of an average of 14 trajectories. The data are fit to a straight line with a slope corresponding to a 2D diffusion coefficient of 0.037 μm2 s−1. R2 for linear fit to data is 0.98. (G) Image of a RBC with a single gold-labeled Piezo1 channel that was recorded for 1 hr at 1 Hz frequency. Superimposed are the final tracking result (blue) and a circle (red) indicating the approximate segmentation of the RBC dimple. Scale bar, 1 μm.
Figure 4—figure supplement 1
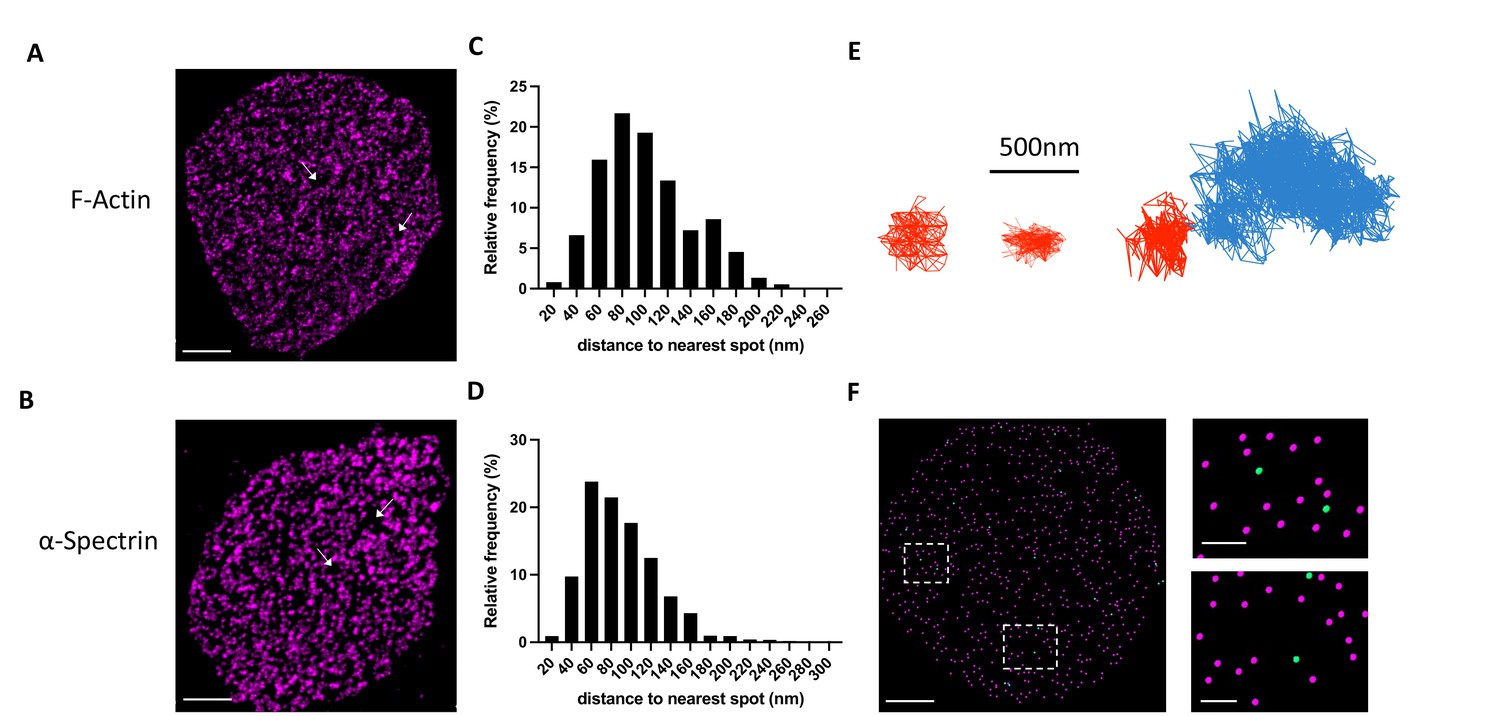
The observed diffusion behavior of Piezo1 is consistent with the organization of the actin–spectrin skeleton in red blood cells.
(A) 2D stimulated emission depletion (STED) image of an unroofed RBC stained with phalloidin to label F-actin filaments. White arrows indicate voids deficient in phalloidin staining. These voids are approximately 200–500 nm in size. (B) As in (A) but with immunostaining against α-Spectrin. Scale bar, 1 μm. (C, D) Frequency distributions for the nearest-neighbor distance for F-actin (C) and α-Spectrin (D). (E) Example tracks of Piezo1 exhibiting confined diffusion in spaces <500 nm (red tracks). The right panel shows a track of a Piezo1 channel that becomes trapped in a <500-nm confinement radius (red portion of the track) toward the end of the recording. (F) (left) Imaris spot detection was used to detect spots of actin (magenta) and Piezo1 (green) from a 2D STED image of an unroofed RBC. Dashed squares indicate regions of focus (right) where Piezo1 is found in smaller (above) and larger (below) confinement spaces. Scale bars, 1 μm (left) and 200 nm (right).
Figure 4—figure supplement 2

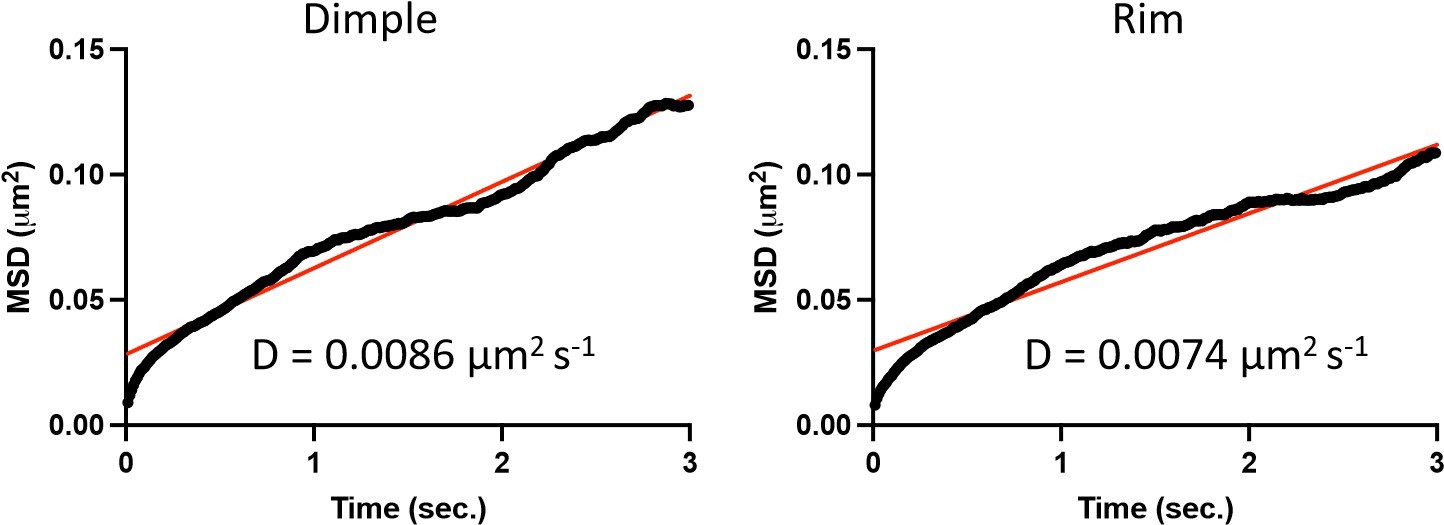
The diffusion behavior of Piezo1 is comparable in the dimple and rim of the red blood cell.
(A) Mean squared displacement (MSD) against time for the first 3 s of an average of n = 6 trajectories from tracks at the red blood cell (RBC) dimple and n = 8 trajectories from tracks at the RBC rim. R2 for linear fits is 0.98 for dimple measurements and 0.94 for rim measurements. (B) Comparison of diffusion coefficients measured from the slopes of MSD analysis of n = 6 trajectories from tracks at the RBC dimple and n = 8 trajectories from tracks at the RBC rim. The mean and standard error of the mean (SEM) are plotted and there is no statistically significant difference between mean diffusion coefficients at the dimple and the rim as determined by unpaired t-test analysis.
Figure 5
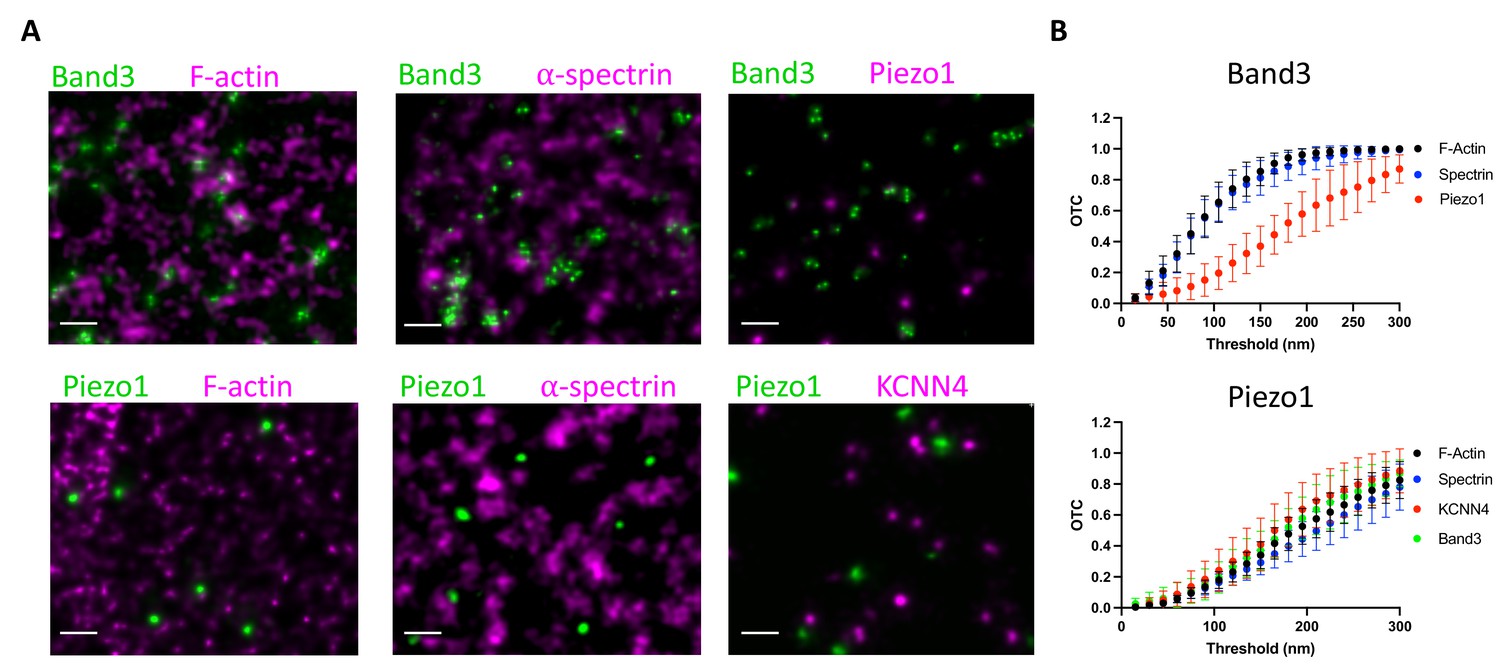
Piezo1 does not appear to interact with the membrane skeleton.
(A) Exemplary STED microscopy images assessing interactions of Band3 (upper panels) and Piezo1 (lower panels) with known members of the RBC membrane skeleton as well as with each other and with KCNN4. Close spatial proximity for Band3 with actin and spectrin can be observed in STED images but not for Piezo1. Scale bar, 200 nm. (B) OTCanalysis including 95% confidence error bars of STED microscopy image sections (Band3/F-actin, n = 11; Band3/Spectrin, n = 10; Band3/Piezo1, n = 7; Piezo1/F-actin, n = 10; Piezo1/Spectrin, n = 7; Piezo1/KCNN4, n = 8).
Author response image 1
Videos
Video 1
Example video recording of a RBC from a Piezo1HA mouse immunolabeled with three 40-nm gold particles and imaged under DIC.
The recording was made at 100 Hz frequency and lasted 2 min. Scale bar, 1 µm. Video is sped up 2x.
Video 2
Example video recording of a RBCfrom a Piezo1HA mouse immunolabeled with a 40-nm gold particle and imaged under differential interference contrast (DIC).
The recording was made at 1 Hz frequency and lasted 1 hr. Scale bar, 1 µm. Video is sped up 100x.
Additional files
Download links
A two-part list of links to download the article, or parts of the article, in various formats.
Downloads (link to download the article as PDF)
Open citations (links to open the citations from this article in various online reference manager services)
Cite this article (links to download the citations from this article in formats compatible with various reference manager tools)
Piezo1 as a force-through-membrane sensor in red blood cells
eLife 11:e82621.
https://doi.org/10.7554/eLife.82621


