Targeted multi-omic analysis of human skin tissue identifies alterations of conventional and unconventional T cells associated with burn injury
- Division of Infectious Disease, Department of Internal Medicine, University of Utah, United States
- Division of Microbiology & Immunology, Department of Pathology, University of Utah, United States
- Department of Surgery, School of Medicine, University of Utah, United States
Figures
Figure 1 with 2 supplements
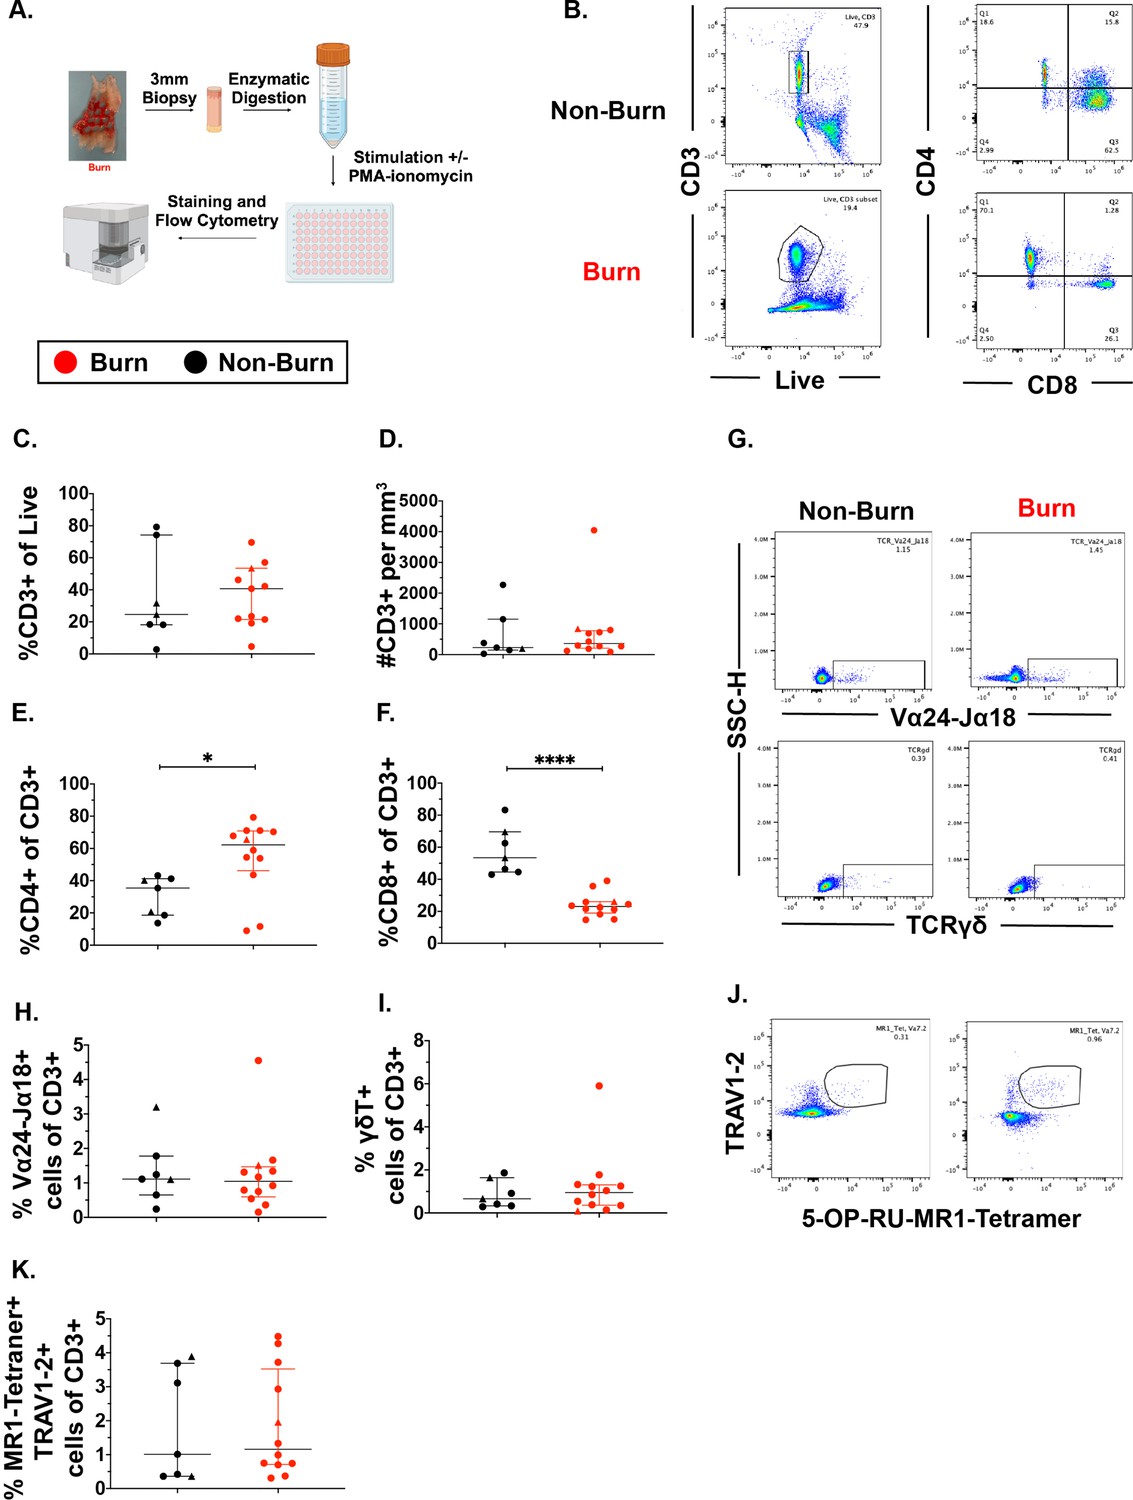
Conventional CD8 +T cell populations are lower and CD4 +T cells populations are higher in burn tissue compared to non-burn tissue.
Overview of the processing and analysis of T cells in burn and non-burn skin tissue for flow cytometry (A). Representative gating of CD3+, CD4+ and CD8+ T cells from live cells from non-burn tissue and burn tissue (B). Frequency of CD3+ T cells from live cells in burn or non-burn tissue measured by flow cytometry (C). Absolute count of CD3+ T cells from specific volume of burn or non-burn tissue measured by flow cytometry (D). Frequency of CD8+ and CD4+ T cells by flow cytometry (E–F). Frequency and gating strategy of unconventional T cell populations: iNKT (G,H), γδ T cells (G,I), or MAIT cells (J,K). Error bars shown are of median with interquartile range. Differences between burn and non-burn were calculated using Mann-Whitney U test with *p<0.05, ** p<0.01, ****p<0.0001.
Figure 1—figure supplement 1
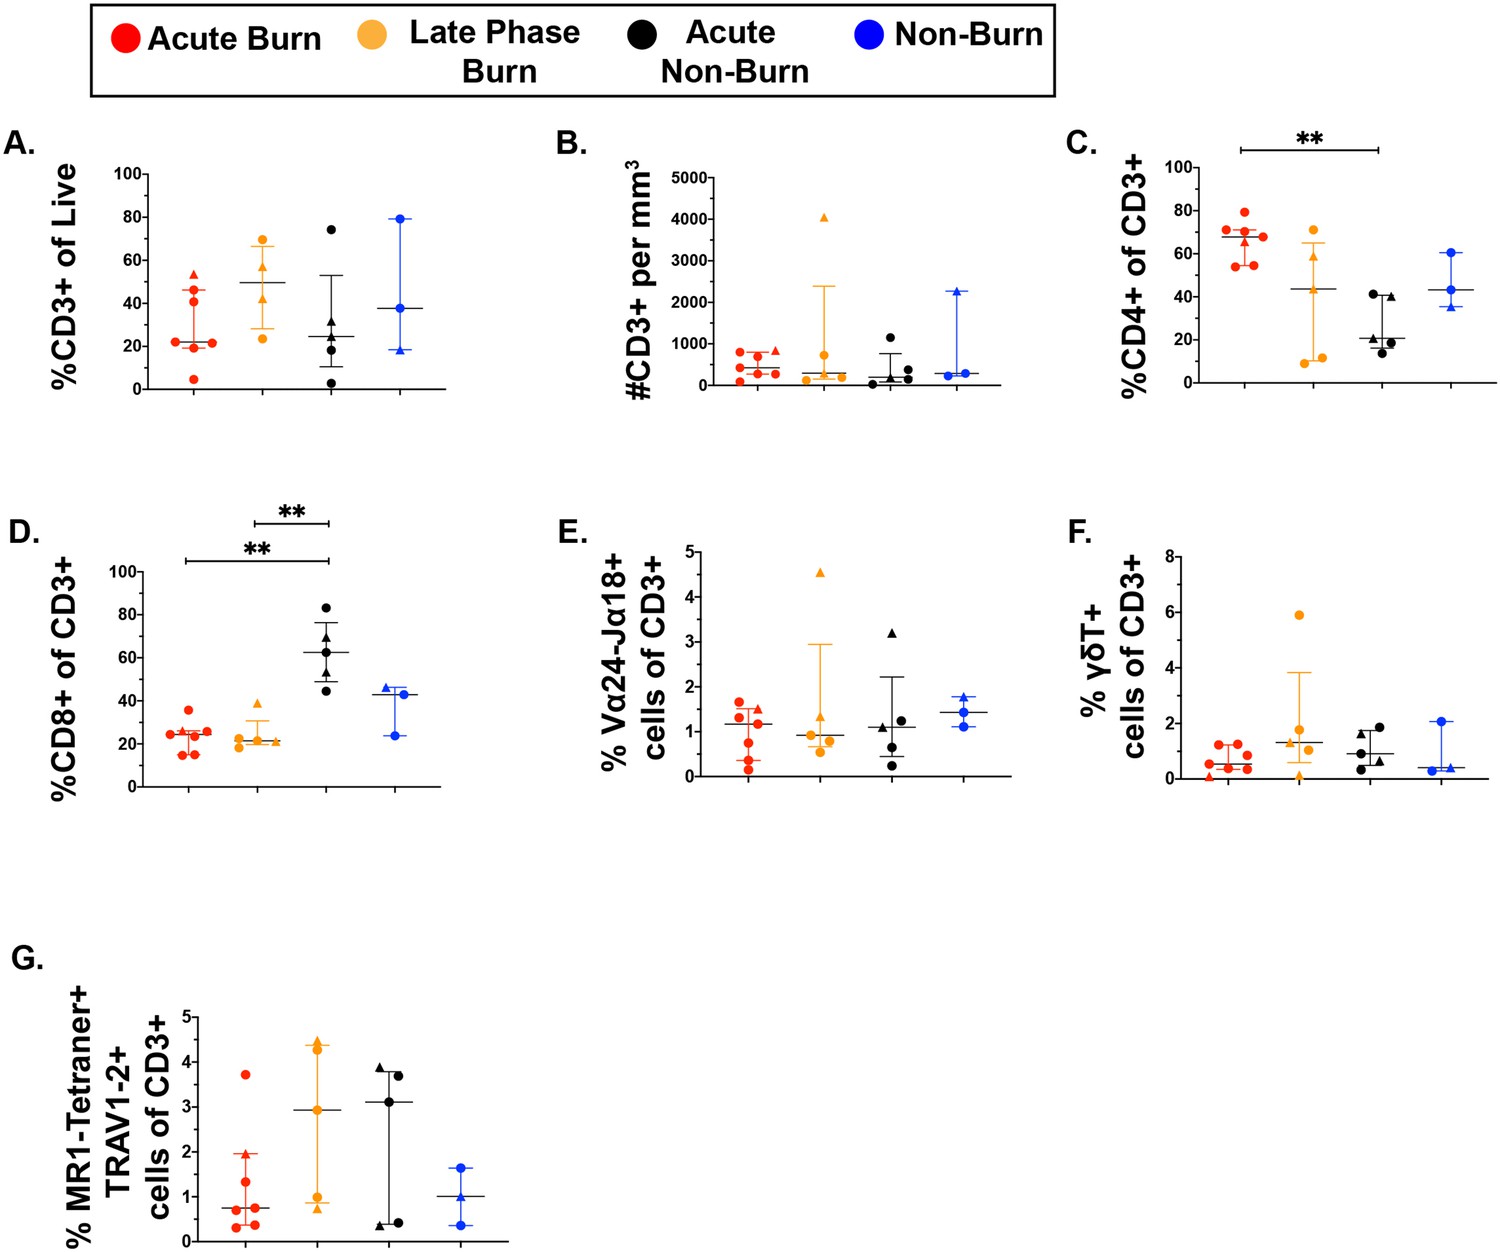
Conventional CD8+ T cell populations are lower and CD4+ T cells populations are higher in acute burn tissue compared to acute non-burn tissue.
Frequency of CD3+ T cells from live cells in burn or non-burn tissue measured by flow cytometry (A). Absolute count of CD3+ T cells from specific volume of burn or non-burn tissue measured by flow cytometry (B). Frequency of CD8+ and CD4+ T cells by flow cytometry (C,D). Frequency and gating strategy of unconventional T cell populations: iNKT (E), γδ T cells(F), or MAIT cells (G). Error bars shown are of median with interquartile range. Differences between groups were calculated using Mann-Whitney U test with *p<0.05, **p<0.01.
Figure 1—figure supplement 2
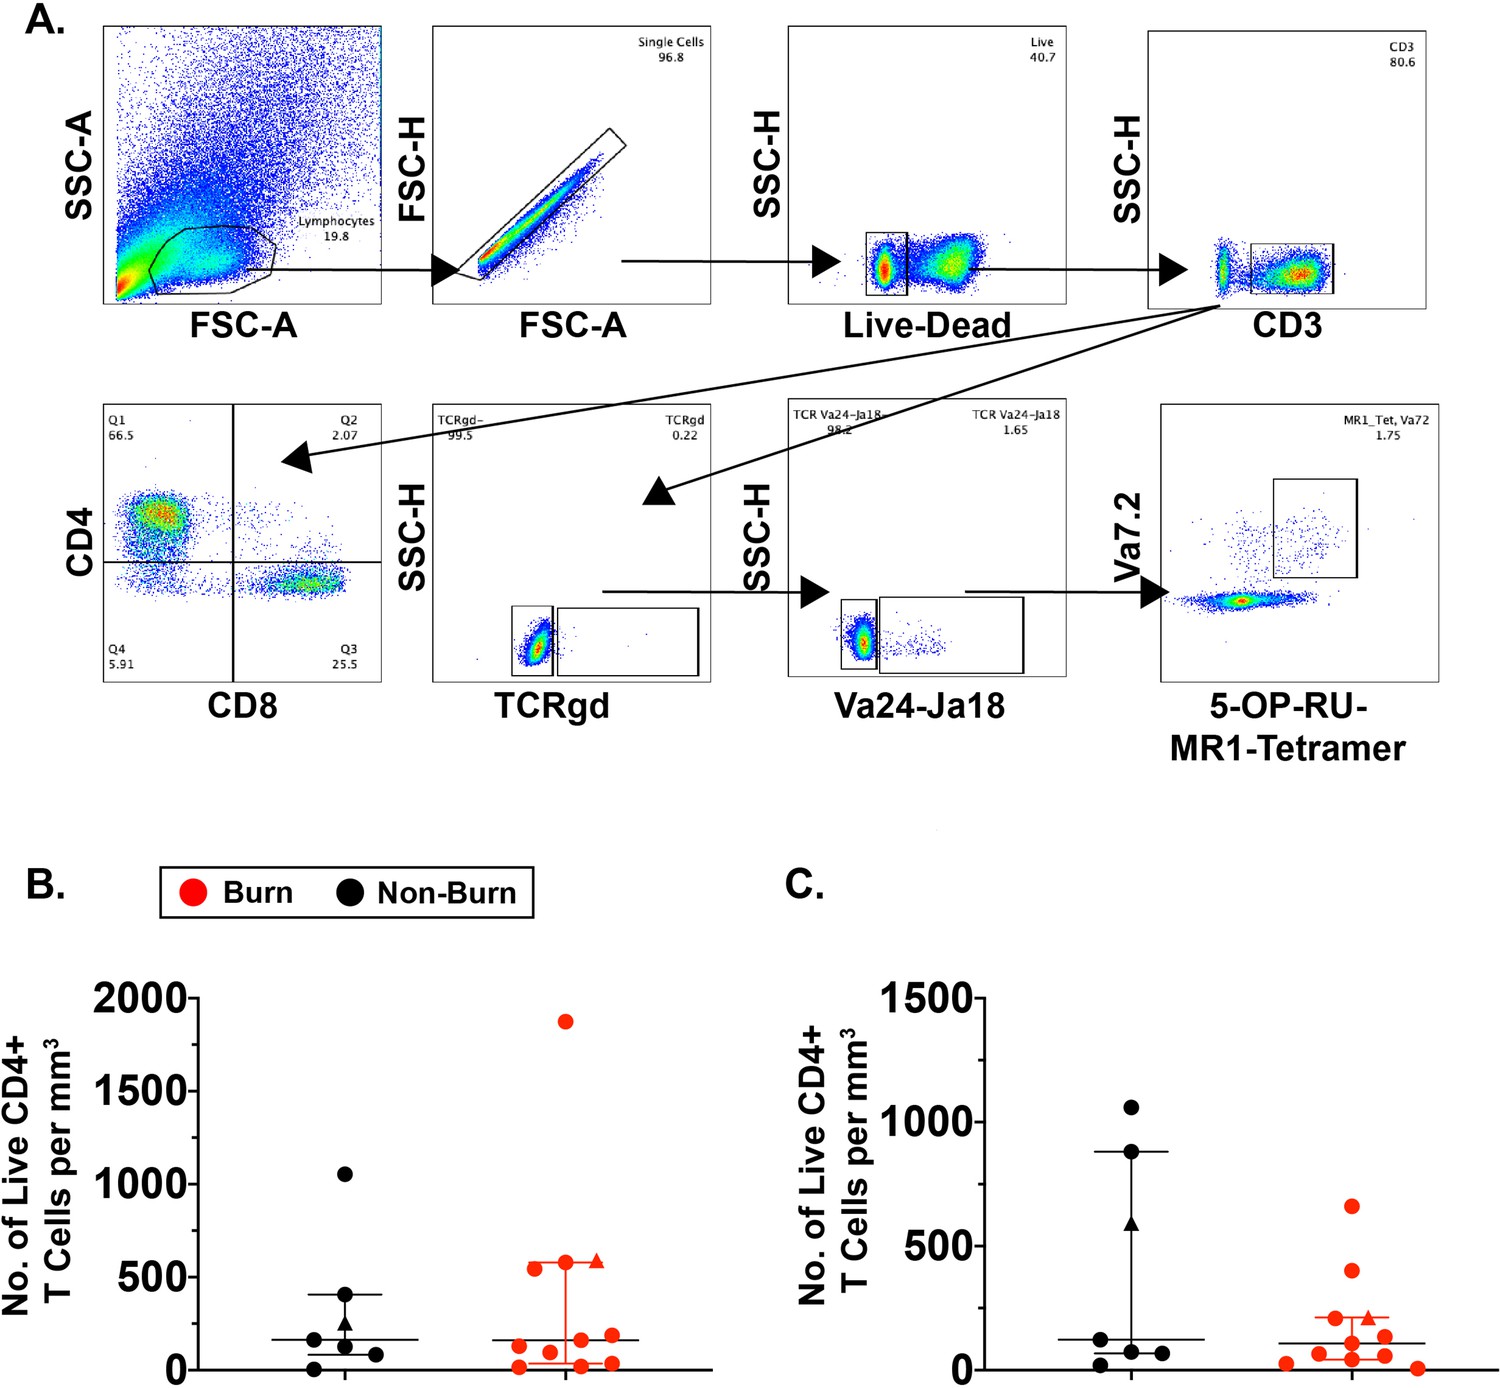
Conventional CD4+ and CD8+ T cell absolute numbers are not significantly different between burn and non-burn tissue.
Gating strategy used in this paper, from forward scatter by side scatter, of conventional and unconventional T cells (A). Absolute number of live CD4+ and CD8+ T cells per mm3 in burn and non-burn tissues (B–C). Error bars shown are of median with interquartile range. Differences between burn and non-burn were calculated using Mann-Whitney U test.
Figure 2 with 1 supplement
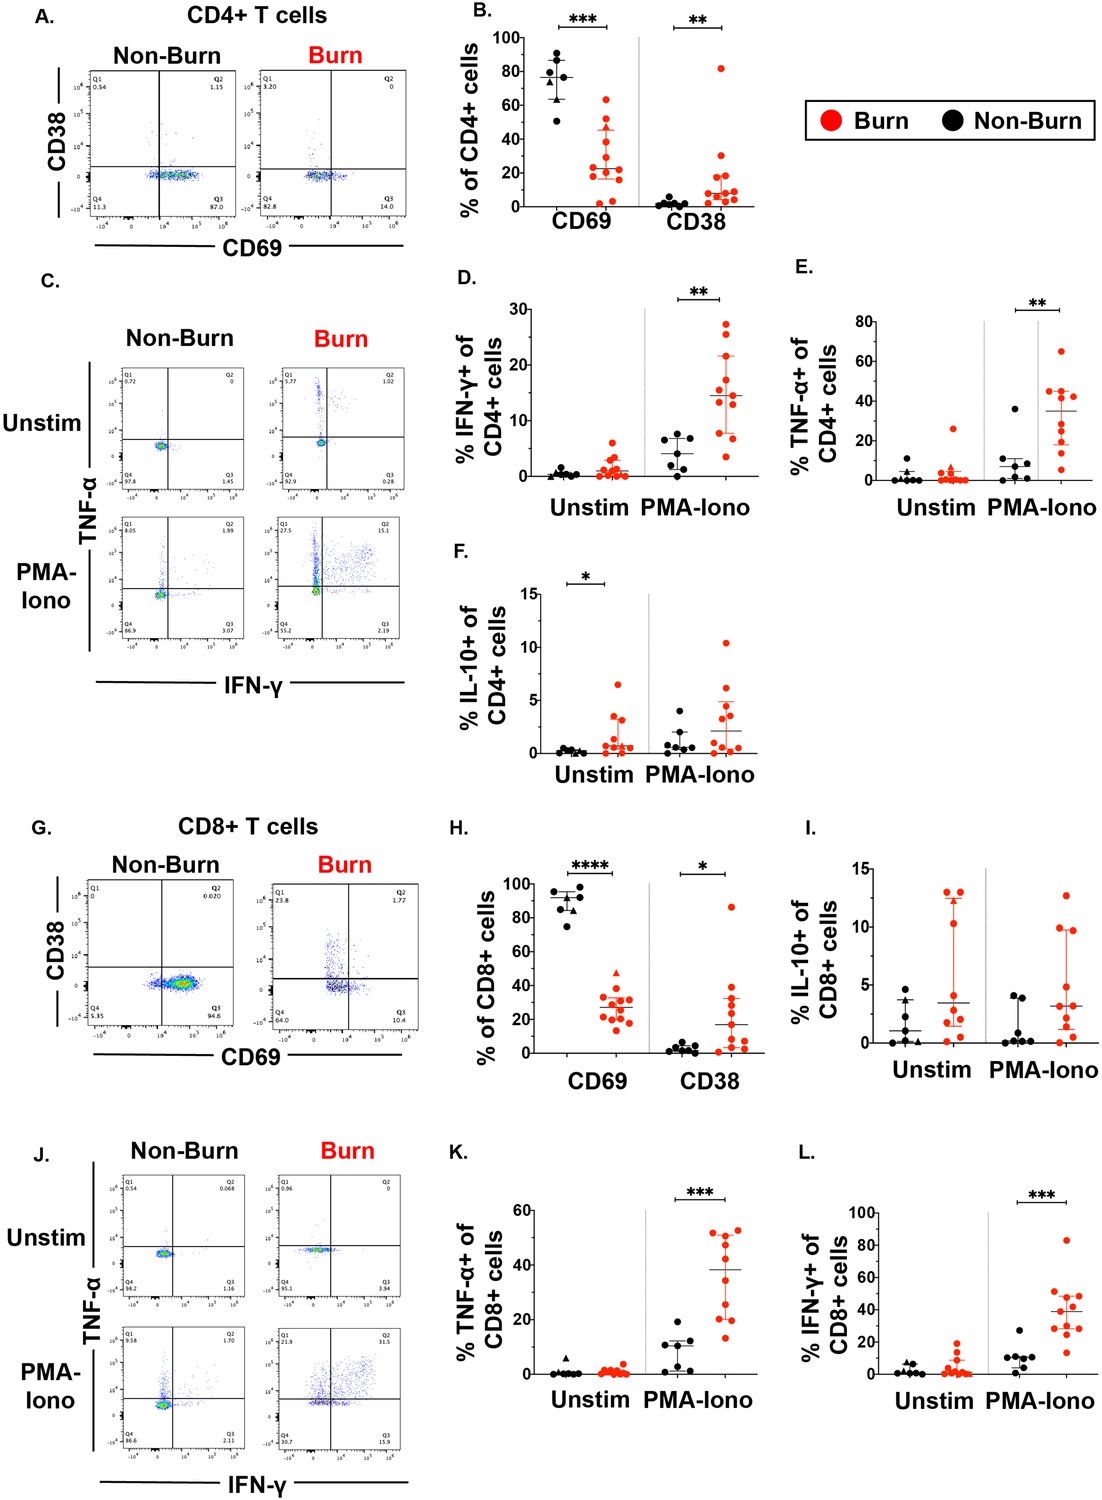
Conventional CD4 +and CD8+T cells in burn tissue produce more pro-inflammatory cytokines upon stimulation compared to those from non-burn tissue.
Representative gating of CD69 and CD38 of CD4+ T cells and frequency of CD69+ and CD38+ CD4+ T cells in burn and non-burn tissue (A,B). Representative gating of IFN-γ+and TNF-α+ CD4+ T cells in unstimulated conditions and after 2 hr PMA-ionomycin stimulation in burn tissue and non-burn tissue (C). Quantification of frequency of IFN-γ+, TNF-α+, and IL-10+ CD4+T cells between burn and non-burn tissue in unstimulated conditions and after 2 hr PMA-ionomycin stimulation (D–F). Representative gating of CD69 and CD38 of CD8+ T cells and frequency of CD69+ and CD38+ CD8+T cells in burn and non-burn tissue (G,H). Representative gating of IFN-γ+ and TNF-α+ CD8+T cells in unstimulated conditions and after 2 hr PMA-ionomycin stimulation in burn tissue and non-burn tissue (J). Quantification of frequency of IFN-γ+, TNF-α+, and IL-10+ CD8+T cells between burn and non-burn tissue in unstimulated conditions and after 2 hr PMA-ionomycin stimulation (I, K, L). Error bars shown are of median with interquartile range. Differences between burn and non-burn were calculated using Mann-Whitney U test with *p<0.05, **p<0.01, ***p<0.001, ****p<0.0001.
Figure 2—figure supplement 1
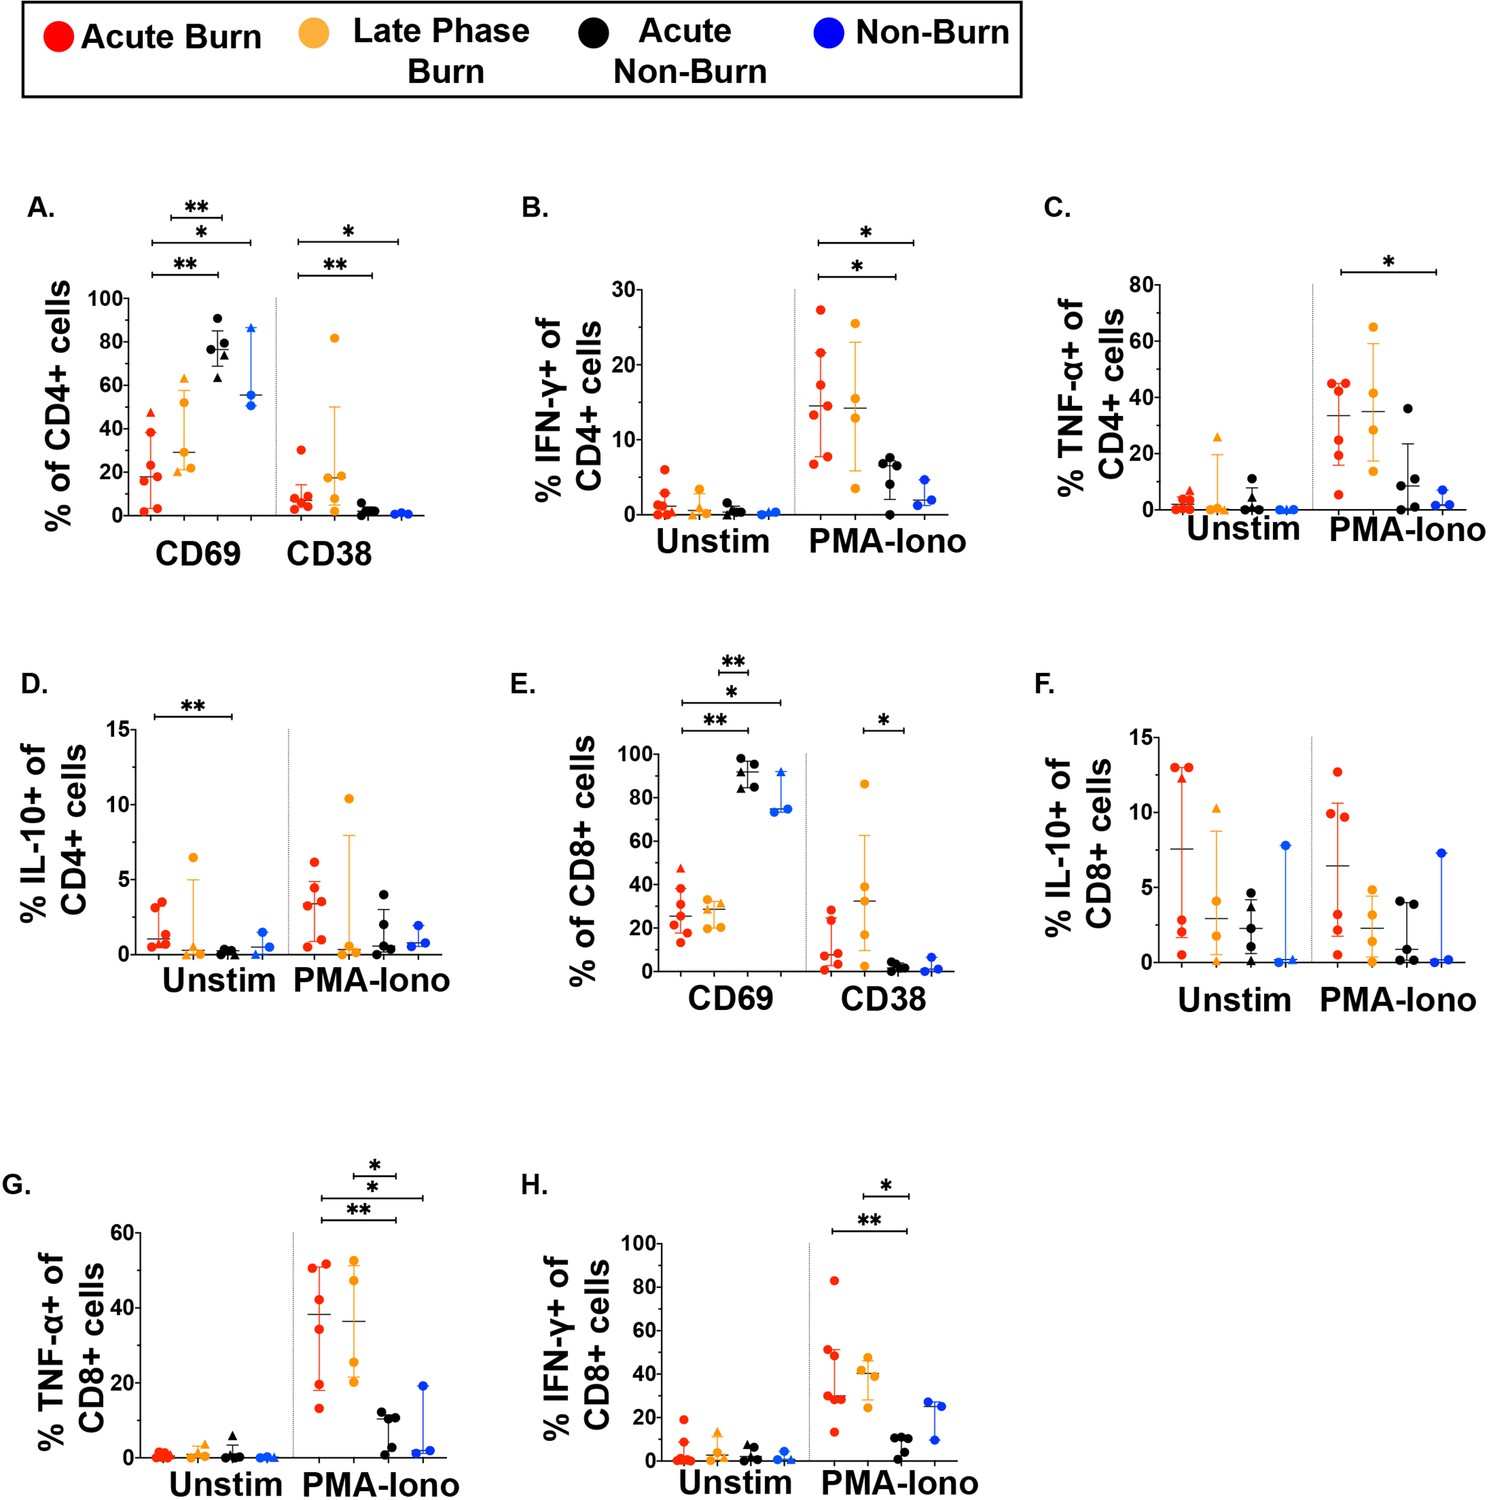
Conventional CD4 +and CD8+T cells in acute burn tissue and late phase burn tissue produce more pro-inflammatory cytokines upon stimulation compared to those from acute non-burn tissue.
Frequency of CD69 +and CD38+CD4+T cells in burn and non-burn tissue (A). Quantification of frequency of IFN-γ+, TNF-α+, and IL-10 +CD4+T cells between burn and non-burn tissue in unstimulated conditions and after 2 hr PMA-ionomycin stimulation (B–D). Frequency of CD69 +and CD38+CD8+T cells in burn and non-burn tissue (E). Quantification of frequency of IFN-γ+, TNF-α+, and IL-10 +CD8+T cells between burn and non-burn tissue in unstimulated conditions and after 2 hr PMA-ionomycin stimulation (F–H). Error bars shown are of median with interquartile range. Differences between groups were calculated using Mann-Whitney U test with *p<0.05, **p<0.01.
Figure 3 with 1 supplement

Unconventional T cells in burn tissue produce more IFN-γ and TNF-α upon stimulation compared to non-burn tissue.
Representative gating of CD69+ and CD38+ MAIT cells in burn tissue and non-burn tissue (A) Frequency of CD69 +and CD38+ MAIT cells in burn tissue and non-burn tissue (B). Representative gating of IFN-γ+ and TNF-α+ of unstimulated MAIT cells and stimulated MAIT cells following 2 hr PMA-ionomycin stimulation in burn tissue and non-burn tissue (C). Frequency of IFN-γ+, TNF-α+, IL-10+, and IL-17A+ in unstimulated and stimulated MAIT cells after 2 hr PMA-ionomycin in burn tissue and non-burn tissue (E–G). Representative gating of CD69+ and CD38+ γδ T cells and quantification of frequency of CD69+ and CD38+ γδ T cells in burn tissue and non-burn tissue (H,I). Frequency of IL-17A+ in unstimulated and stimulated γδ T cells after 2 hr PMA-ionomycin in burn tissue and non-burn tissue (J). Representative gating of IFN-γ+ and TNF-α+ of unstimulated γδ T cells and stimulated γδ T cells and quantification of frequency of IFN-γ+ and TNF-α+ γδ T cells in burn tissue and non-burn tissue (K–M). Error bars shown are of median with interquartile range. Differences between burn and non-burn were calculated using Mann-Whitney U test with *p<0.05, **p<0.01, ***p<0.001.
Figure 3—figure supplement 1
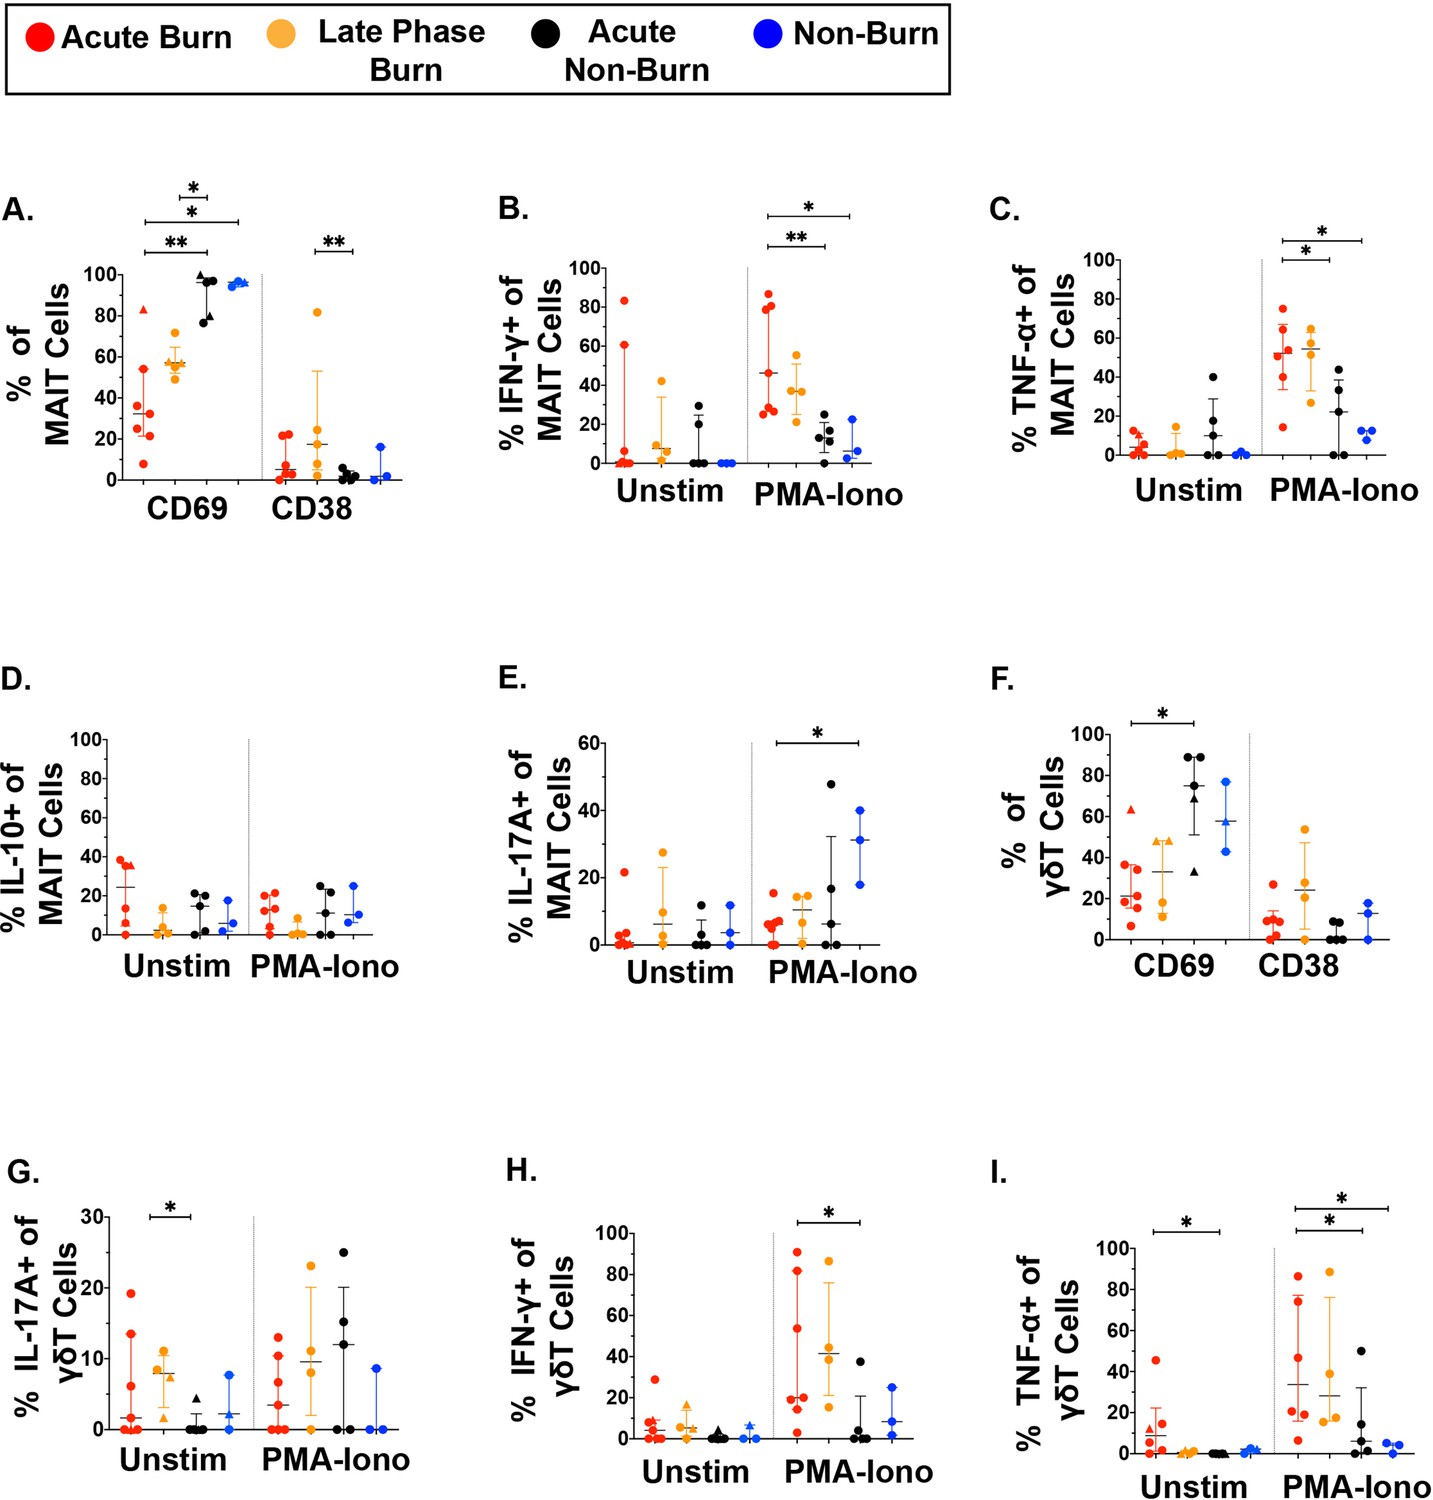
Unconventional T cells in burn acute tissue produce more IFN-γ and TNF-α upon stimulation compared to acute non-burn tissue.
Frequency of CD69+ and CD38+M AIT cells in burn tissue and non-burn tissue (A). Frequency of IFN-γ+, TNF-α+, IL-10+, and IL-17A+ in unstimulated and stimulated MAIT cells after 2 hr PMA-ionomycin in burn tissue and non-burn tissue (B–E). Quantification of frequency of CD69+ and CD38+ γδ T cells in burn tissue and non-burn tissue (F). Frequency of IL-17A+, IFN-γ+, and TNF-α+in unstimulated and stimulated γδ T cells after 2 hr PMA-ionomycin in burn tissue and non-burn tissue (G–I).Error bars shown are of median with interquartile range. Differences between groups were calculated using Mann-Whitney U test with*p<0.05, **p<0.01, ***p<0.001.
Figure 4 with 1 supplement
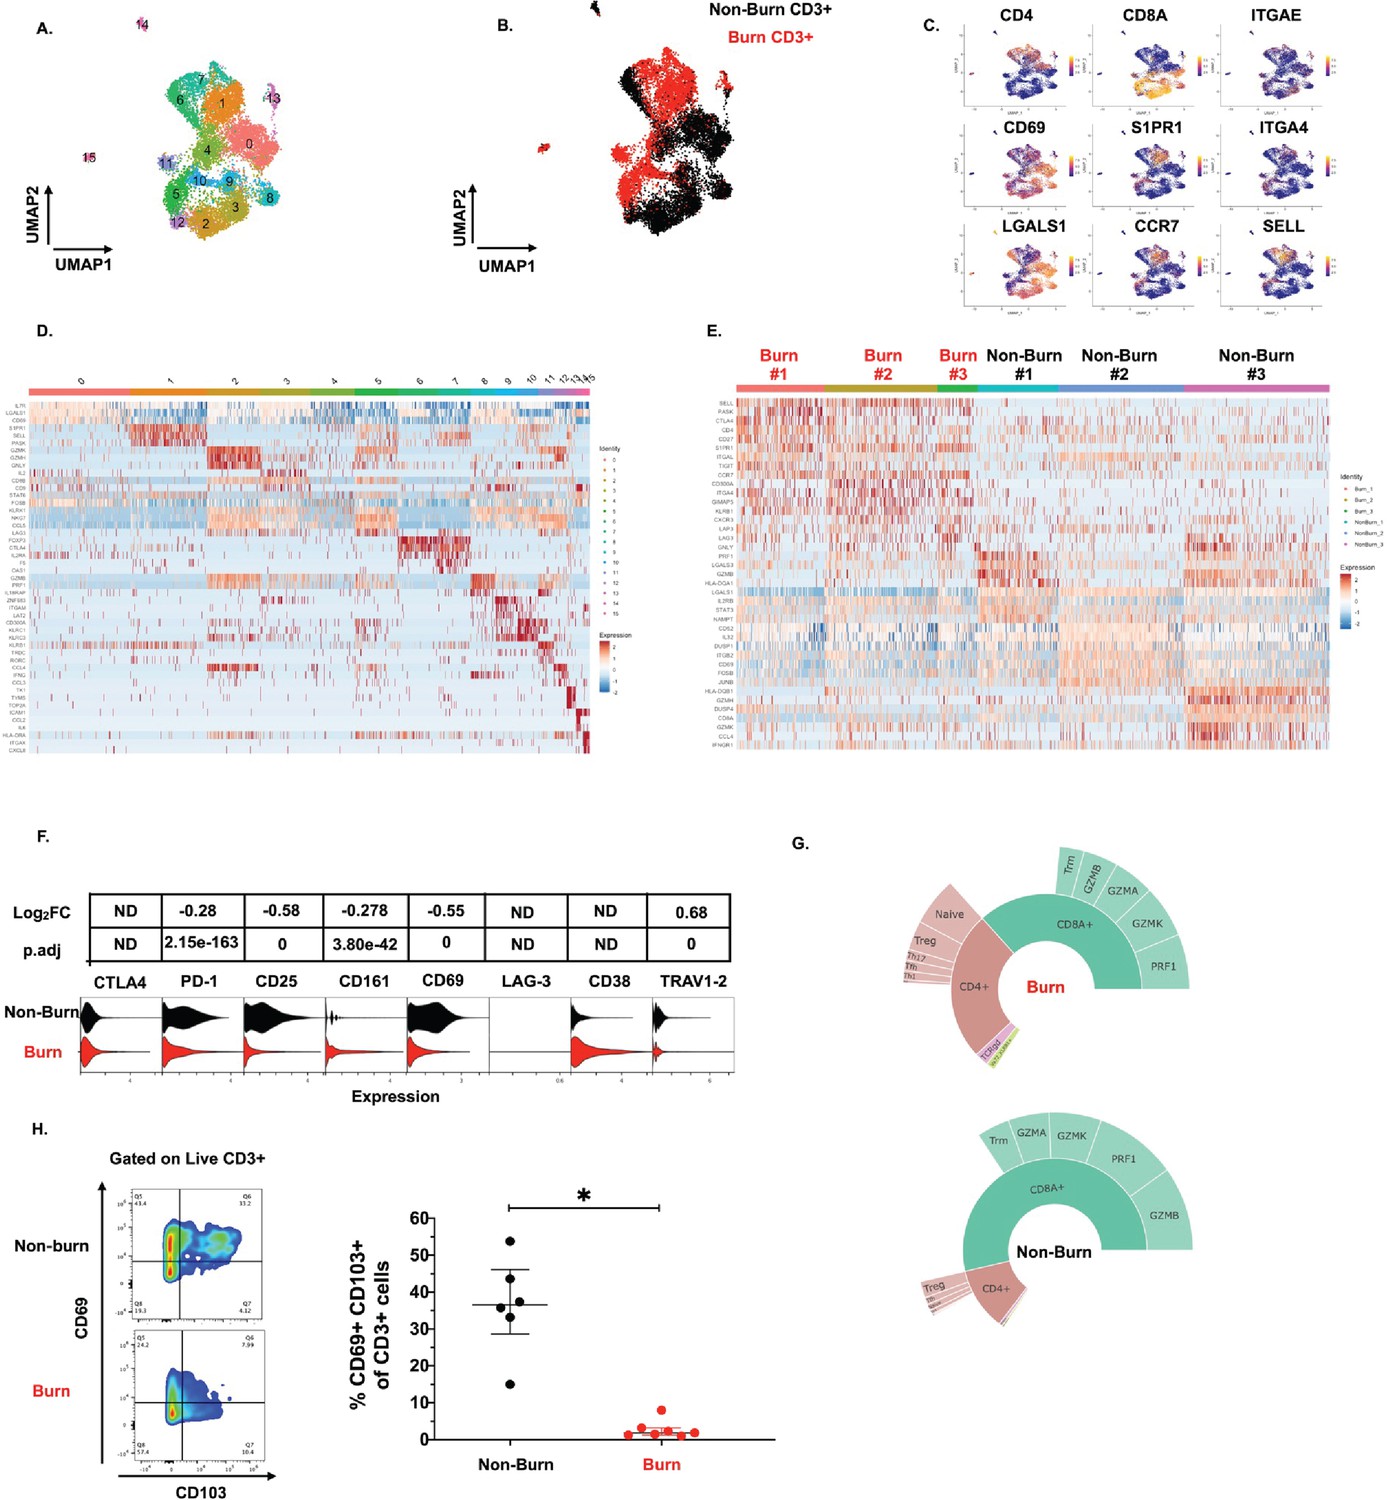
Conventional T cells in burn tissue are transcriptionally distinct from those in non-burn tissue.
UMAP analysis using resolution = 0.8 in Seurat of 15 different clusters of T cells (A). Identification of burn and non-burn tissue T cells using Sample Tag calling from BD Rhapsody workflow (B). The key genes found that discriminate the 15 clusters (C). Heatmap of the top 5 differentially expressed genes using MAST that identify clusters associated with T cells in burn or non-burn tissue (D). Heatmap of the top 8 differentially expressed genes between the three burn and three non-burn samples (E). Violin plot of AbSeq expression of receptors between burn and non-burn CD3+ T cells (F). Sunplot of the proportion of T cell subsets of CD4+, CD8+, MAIT (TRAV1-2+and CD161+), and γδ T cells (TRDC +TRGC+) between burn and non-burn tissues, definitions of CD4+ and CD8+ subsets were taken from Mair et al., 2020 (G). Flow cytometry showing gating strategy and frequency of CD69+CD103+ of CD3+T cells in burn and non-burn tissue (H). Error bars shown are of median with interquartile range. Differences between burn and non-burn were calculated using Mann-Whitney U test with *p<0.05.
Figure 4—figure supplement 1
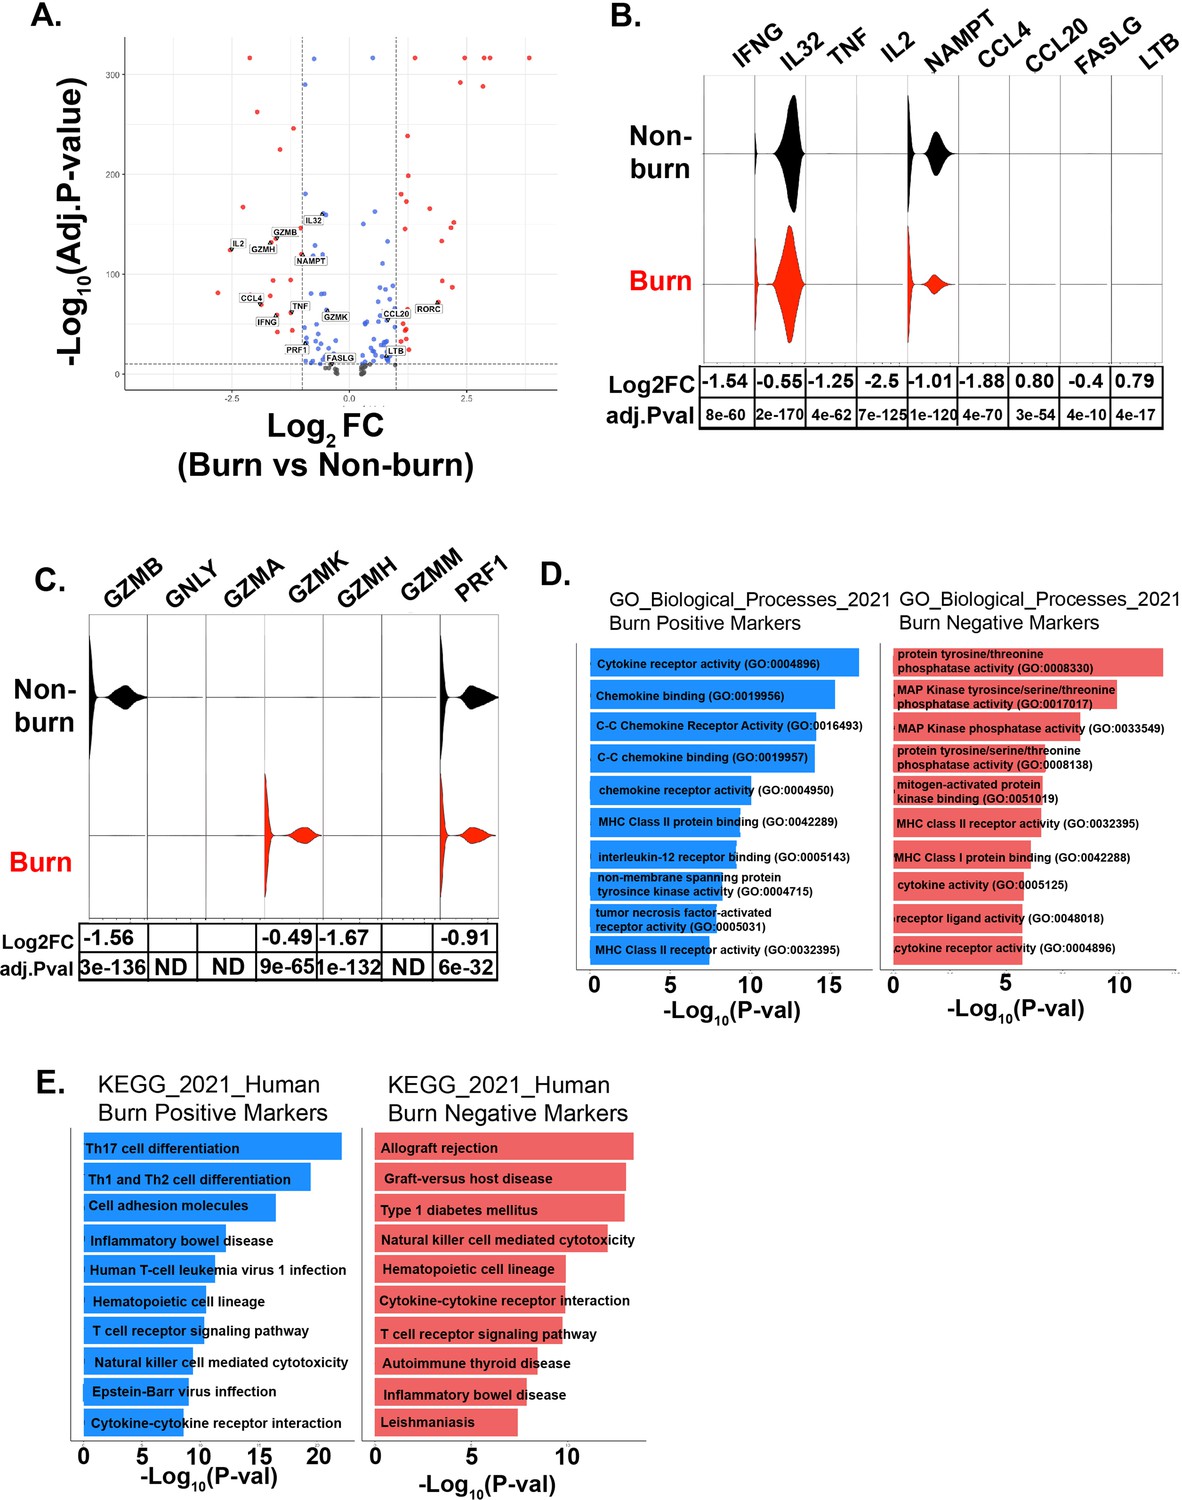
Differential expression of cytokines and effector molecules of conventional CD3 +T cells in burn and non-burn tissues.
Volcano plot of differentially expressed genes between burn and non-burn CD3+ T cells with cytokines and effector molecules labeled (A). Violin plots of selected genes from burn and non-burn CD3+ T cells and significantly differentially expressed genes from volcano plot (B–C). Gene ontology pathway analysis of GO Biological Processes 2021 using R package enrichR showing the positively and negatively enriched pathways associated with burn tissue CD3+ T cells compared to non-burn tissue CD3+ T cells (D). KEGG 2021 Human pathway analysis using R package enrichR showing the positively and negatively enriched pathways associated with burn tissue CD3+ T cells compared to non-burn tissue CD3+ T cells (E).
Figure 5 with 1 supplement
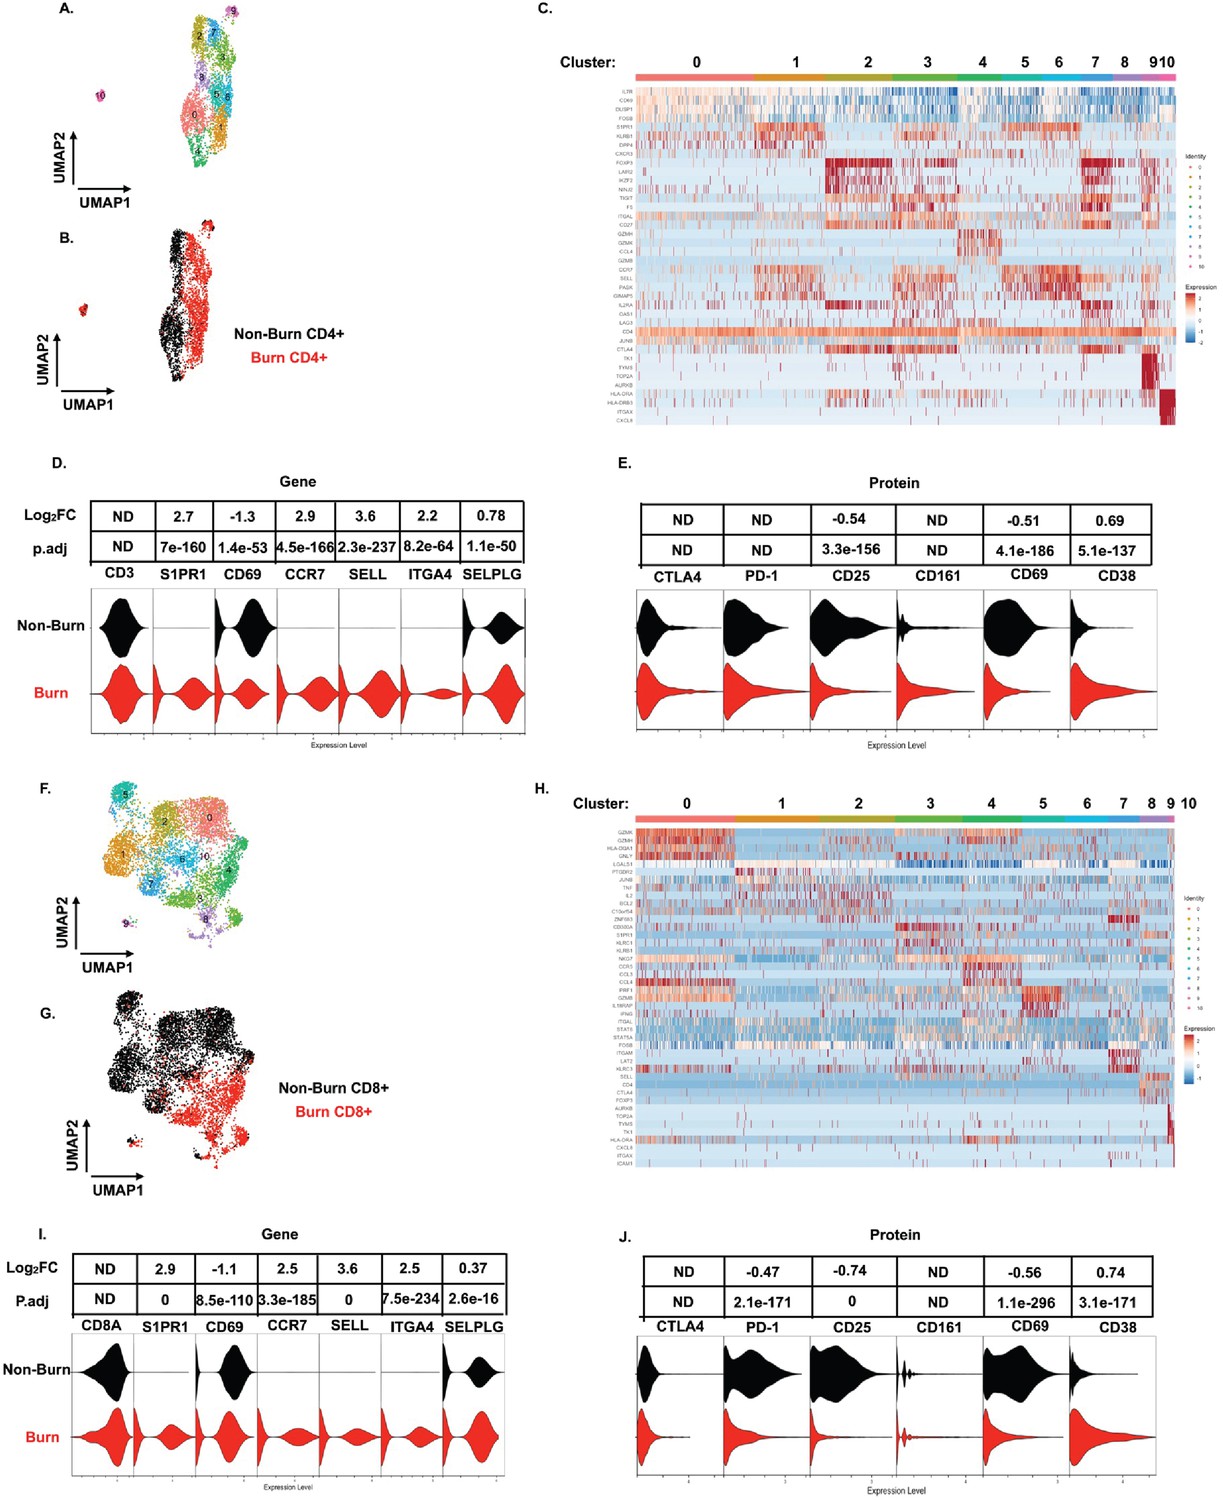
scRNA-seq reveals a conventional CD4+ and CD8+ T cell subset that trafficks to burn tissue.
Differentially expressed genes define the 10 clusters of CD4+ T cells within burn and non-burn tissue and separate based on tissue origin (A,B). Heatmap of the top 8 genes that significantly differentiate CD4+ T cells in burn and non-burn samples (C). Violin plot of highly significantly differentially expressed genes relating to tissue residency and homing between burn and non-burn CD4+ T cells (D). Violin plot of AbSeq protein expression of receptors between burn and non-burn CD4+ T cells (E). UMAP analysis define 10 clusters of CD8+ T cells that clustering separately based on tissue origin (F,G). Heatmap of the top 8 genes that significantly differentiate CD8+ T cells in burn and non-burn samples (H). Violin plot of T cell homing markers and residency markers of CD8+ T cells in burn and non-burn tissue (I). Violinplot of AbSeq protein expression of receptors between CD8+ T cells in burn and non-burn tissue (J).
Figure 5—figure supplement 1
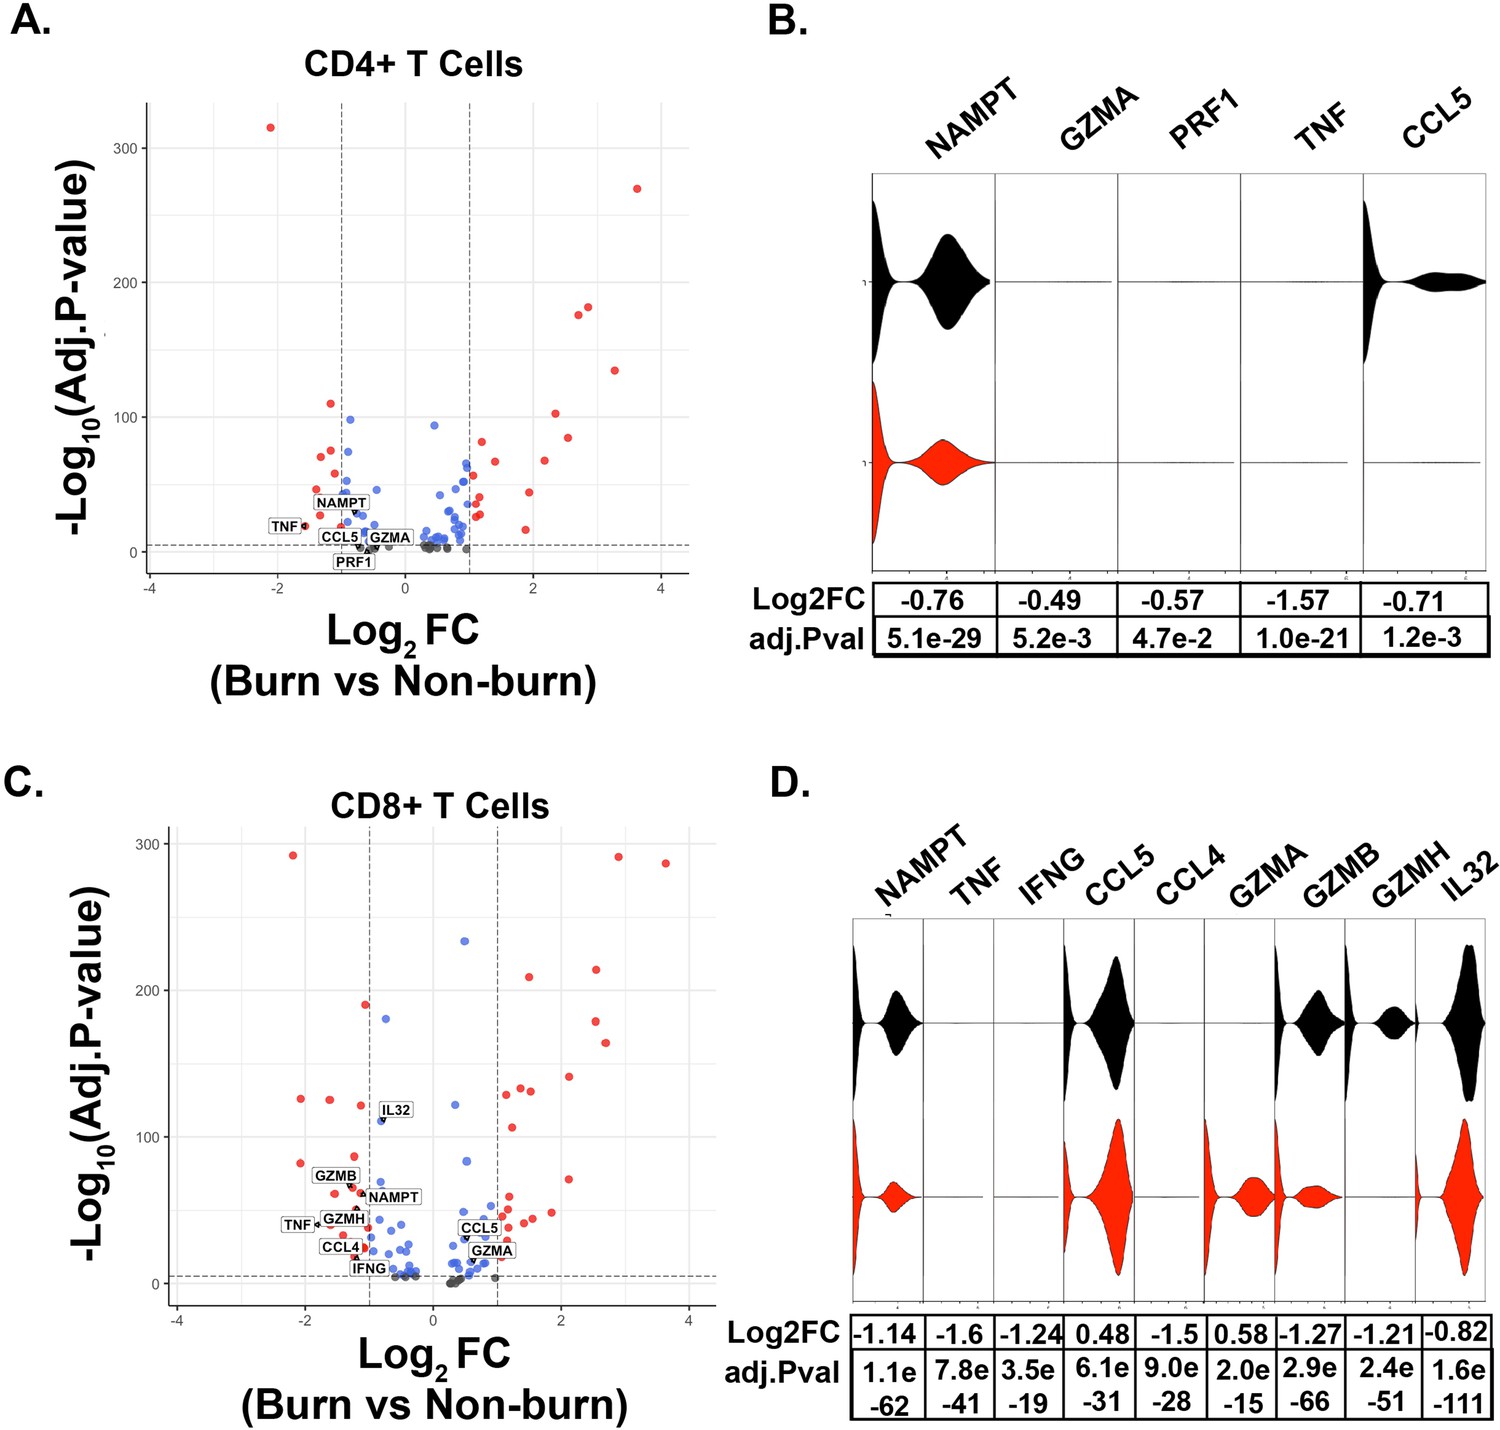
Differential expression of cytokines and effector molecules of conventional CD4+ and CD8+ T cells in burn and non-burn tissues.
Volcano plot of differentially expressed genes between burn and non-burn CD4+ T cells with cytokines and effector molecules highlighted (A). Violin plots of selected genes from burn and non-burn CD4+ T cells and significantly differentially expressed genes from volcano plot (B). Volcano plot of differentially expressed genes between burn and non-burn CD8+ T cells with cytokines and effector molecules highlighted (C). Violin plots of selected genes from burn and non-burn CD8+ T cells and significantly differentially expressed genes from volcano plot (D).
Figure 6
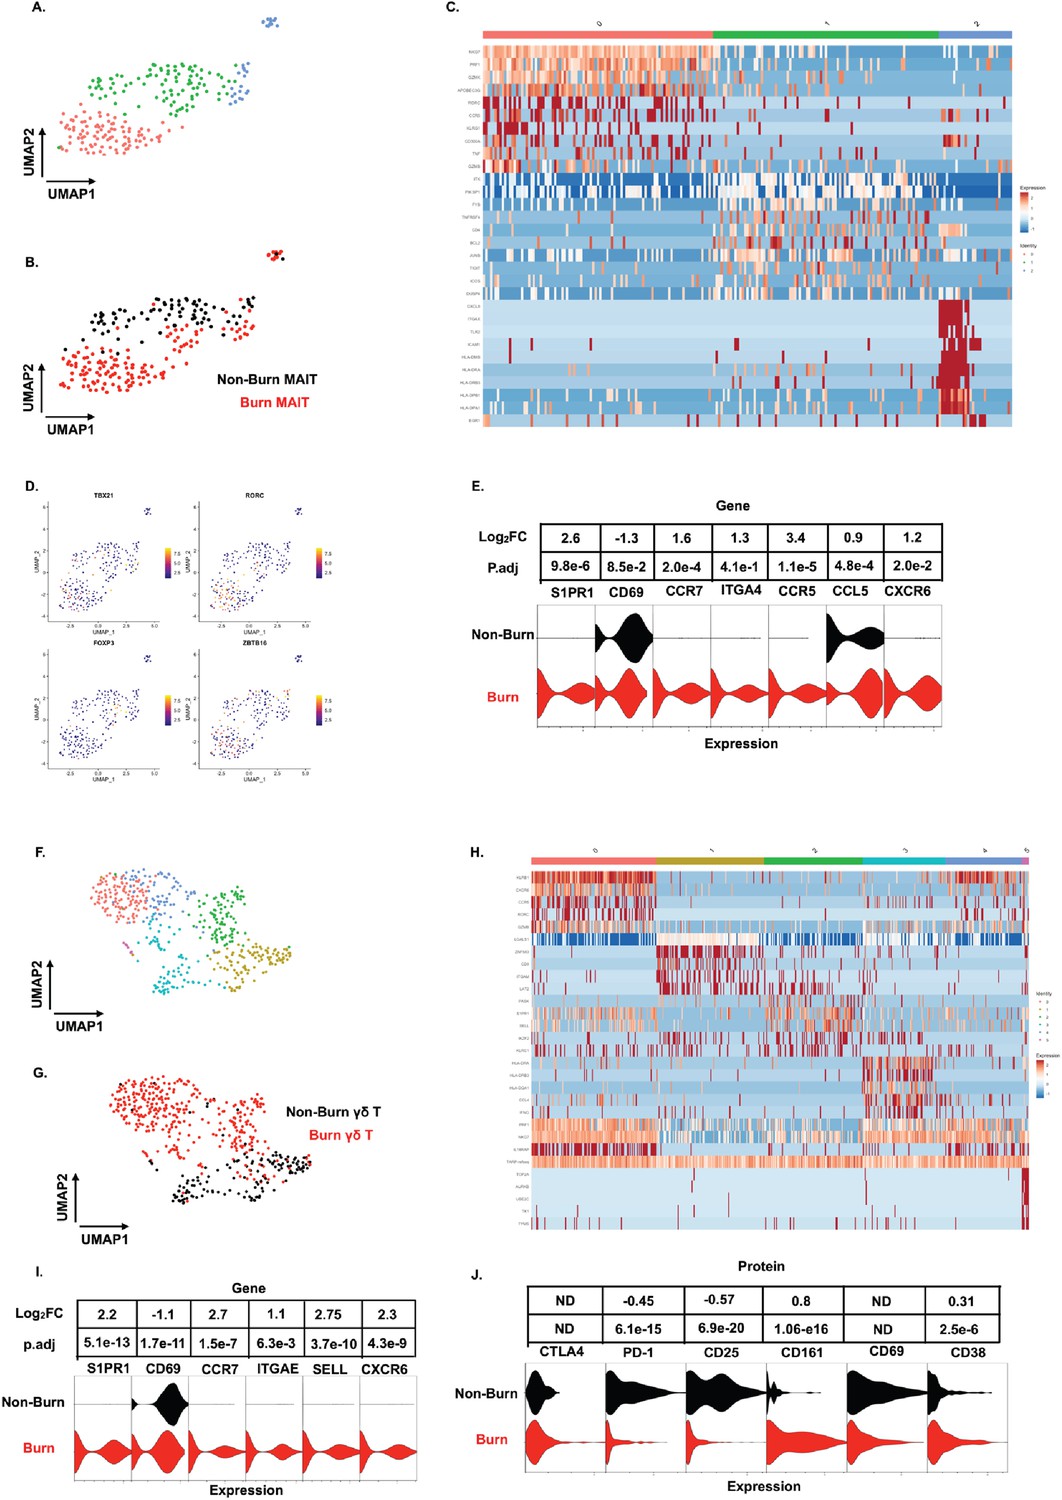
Unconventional T cells in burn tissue comprise a highly cytotoxic population not seen in non-burn tissue.
UMAP analysis of MAIT cells (defined from AbSeq as Vα7.2+CD161+) within burn and non-burn tissue show three clusters of MAIT cells and their tissue origin (A,B). Heatmap of the three clusters of MAIT cells and the top 8 genes that are differentially expressed that define the clusters (C). Feature plot showing some commonly expressed MAIT cell transcription factors based on the UMAP in A. (D). Violin plot showing significantly differentially expressed T cell homing and residency genes between burn and non-burn MAIT cells (E). UMAP analysis of γδ T cells (Defined as TRDC+TRGC+ ) reveals 5 separate clusters within burn and non-burn tissue which are distinct based on tissue origin (F,G). Heatmap showing the top 5 genes identifying each cluster in F (H). Violin plots of significantly differentially expressed T cell homing and residency genes between burn and non-burn γδ T cells (I). Violin plots of AbSeq protein expression between burn and non-burn γδ T cells (J).
Tables
Table 1
Demographics of patients used in this study.
n/a implies the skin sample came from a patient who was not a severe burn patient or several years past initial burn injury.
| Age group | Sex | Type | TBSA | Days sample taken after burn | Type of injury | Category |
|---|---|---|---|---|---|---|
| 70–79 | M | Burn | 16 | 4 | Flame | Acute Burn |
| 30–39 | M | Burn | 9 | 11 | Scald | Late Phase Burn |
| 60–69 | M | Burn | 2 | 4 | Electrical | Acute Burn |
| 20–29 | M | Burn | 10 | 6 | Flame | Acute Burn |
| 40–49 | M | Burn | 13 | 7 | Flash | Acute Burn |
| 10–19 | F | Burn* | 2 | 25 | Flame | Late Phase Burn |
| 50–59 | M | Burn | 14 | 5 | Flame | Acute Burn |
| 5–9 | F | Burn* | 11 | 9 | Scald | Late Phase Burn |
| 40–49 | M | Burn* | 26 | 7 | Scald | Acute Burn |
| 40–49 | M | Burn | 16 | 11 | Flame | Late Phase Burn |
| 30–39 | F | Burn | 1 | 27 | Contact | Late Phase Burn |
| 40–49 | M | Non-Burn | 9 | 9 | Flame | Acute Non-Burn |
| 30–39 | F | Non-Burn† | 10 | n/a | Burn scar | Non-Burn |
| 30–39 | M | Non-Burn | 0 | n/a | Necrotizing fasciitis | Non-Burn |
| 40–49 | F | Non-Burn* | 0 | n/a | Necrotizing fasciitis | Non-Burn |
| 40–49 | M | Non-Burn* | 26 | 14 | Scald | Acute Non-Burn |
| 30–39 | M | Non-Burn* | 13 | 16 | Electrical and flame | Acute Non-Burn |
| 40–39 | F | Non-Burn | 49 | 9 | Flame | Acute Non-Burn |
| 60–69 | M | Non-Burn | 2 | 4 | Electrical | Acute Non-Burn |
-
*
Denotes sample was used for scRNA-seq. Acute non-burn = autograft tissue from acute burn patients.
-
†
Denotes sample was used for data analysis in Figure 1—figure supplements 1 and 2, Figure 2—figure supplement 1 only.
Additional files
Download links
A two-part list of links to download the article, or parts of the article, in various formats.
Downloads (link to download the article as PDF)
Open citations (links to open the citations from this article in various online reference manager services)
Cite this article (links to download the citations from this article in formats compatible with various reference manager tools)
Targeted multi-omic analysis of human skin tissue identifies alterations of conventional and unconventional T cells associated with burn injury
eLife 12:e82626.
https://doi.org/10.7554/eLife.82626


