Rostral and caudal basolateral amygdala engage distinct circuits in the prelimbic and infralimbic prefrontal cortex
- Center for Neural Science, New York University, United States
Figures
Figure 1 with 2 supplements
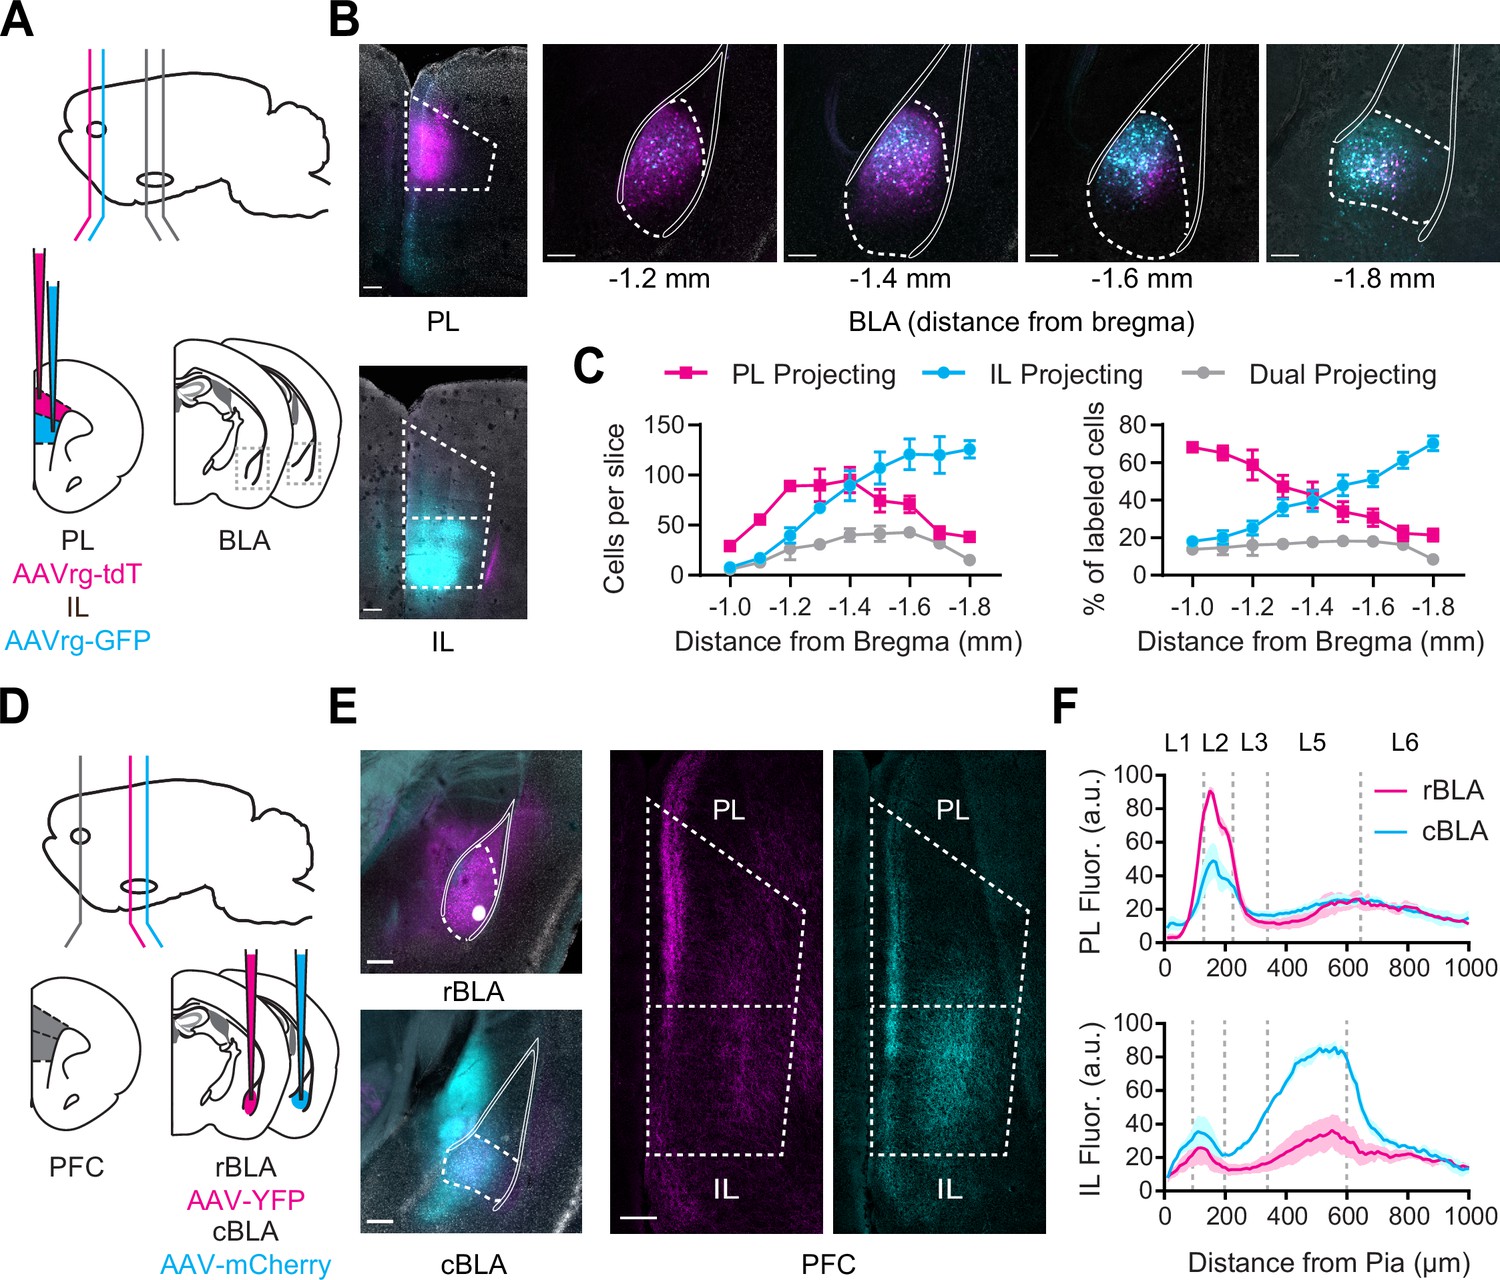
Rostral basolateral amygdala (rBLA) and caudal basolateral amygdala (cBLA) project to different subregions and layers of the prefrontal cortex (PFC).
(A) Schematic for injections of AAVrg-tdTomato into prelimbic (PL) (magenta) and AAVrg-GFP into infralimbic (IL) (cyan). (B) Left, Images of injection sites in PL (+2.4 mm from bregma, magenta) and IL (+2.0 mm from bregma, cyan). Scale bar = 200 µm. Right, Images of retrogradely labeled PL-projecting (magenta) and IL-projecting neurons (cyan) across the AP axis of basolateral amygdala (BLA) (distances relative to bregma). Solid white lines mark white matter boundaries of the BLA. Scale bar = 200 µm. 4′,6-diamidino-2-phenylindole (DAPI) staining in gray. (C) Left, Average number of PL-projecting, IL-projecting, or dual-projecting cells along AP axis of BLA. Right, Percentage of PL-projecting, IL-projecting, and dual-projecting cells in the BLA (n = 3 animals). (D) Schematic for injections of AAV-YFP into rBLA (−1.1 mm from bregma; magenta) and AAV-mCherry into cBLA (−1.7 mm from bregma; cyan). (E) Left, Images of injection sites in rBLA (magenta) and cBLA (cyan). Scale bar = 250 µm. DAPI staining in gray. Right, Images of PL and IL (+2.2 mm from bregma), showing anterogradely labeled rBLA (magenta) and cBLA (cyan) axonal projections. Scale bar = 200 µm. (F) Top, Summary of fluorescence intensity from pia to white matter of rBLA (magenta) and cBLA (cyan) projections to PL, normalized to maximal fluorescence in each slice. Bottom, Similar for rBLA and cBLA projections to IL (n = 3 animals). See also Figure 1—figure supplements 1 and 2.
Figure 1—figure supplement 1
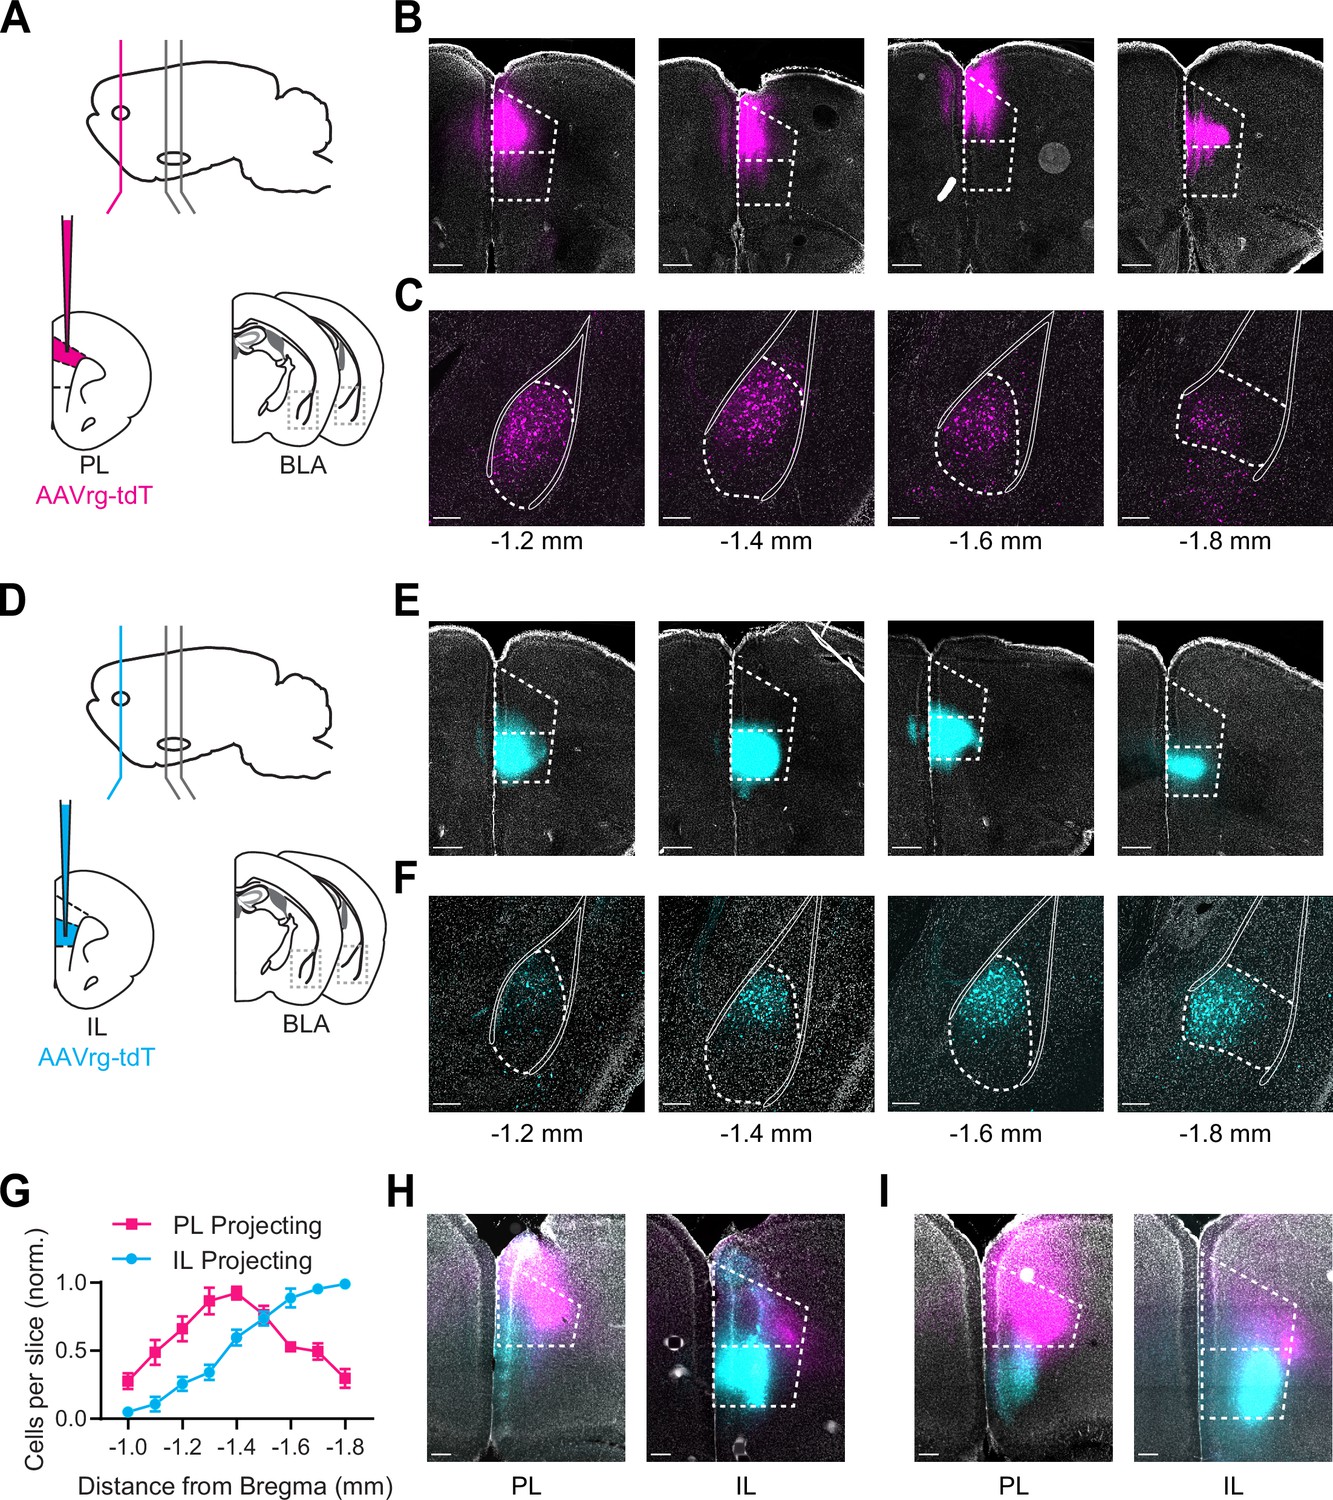
Prelimbic (PL) and infralimbic (IL)-projecting neurons across the basolateral amygdala (BLA).
(A) Schematic for injections of AAVrg-tdTomato into PL (magenta). (B) Injection site image from each animal, showing tdTomato expression (magenta) in PL (+2.2 mm from bregma). DAPI staining is shown in gray. Scale bar = 500 µm (n = 4 animals). (C) Representative images across the anterior–posterior axis of BLA, showing PL-projecting neurons. Distance from bregma is shown under the corresponding image. Solid white lines mark white matter boundaries of the BLA. Scale bar = 200 µm. (D–F) Similar to (A–C) for injections into IL (n = 4 animals). (G) Summary of cell counts for PL-projecting (magenta) and IL-projecting (cyan) BLA neurons across the anterior–posterior axis, normalized for each animal. (H, I) Additional injection site images from different animals for dual AAVrg-XFP experiments (Figure 1A–C), showing AAVrg-TdTomato injected into PL (+2.4 mm from bregma, magenta) and AAVrg-GFP injected into IL (+2.0 mm from bregma, cyan). Scale bar = 200 µm.
Figure 1—figure supplement 2
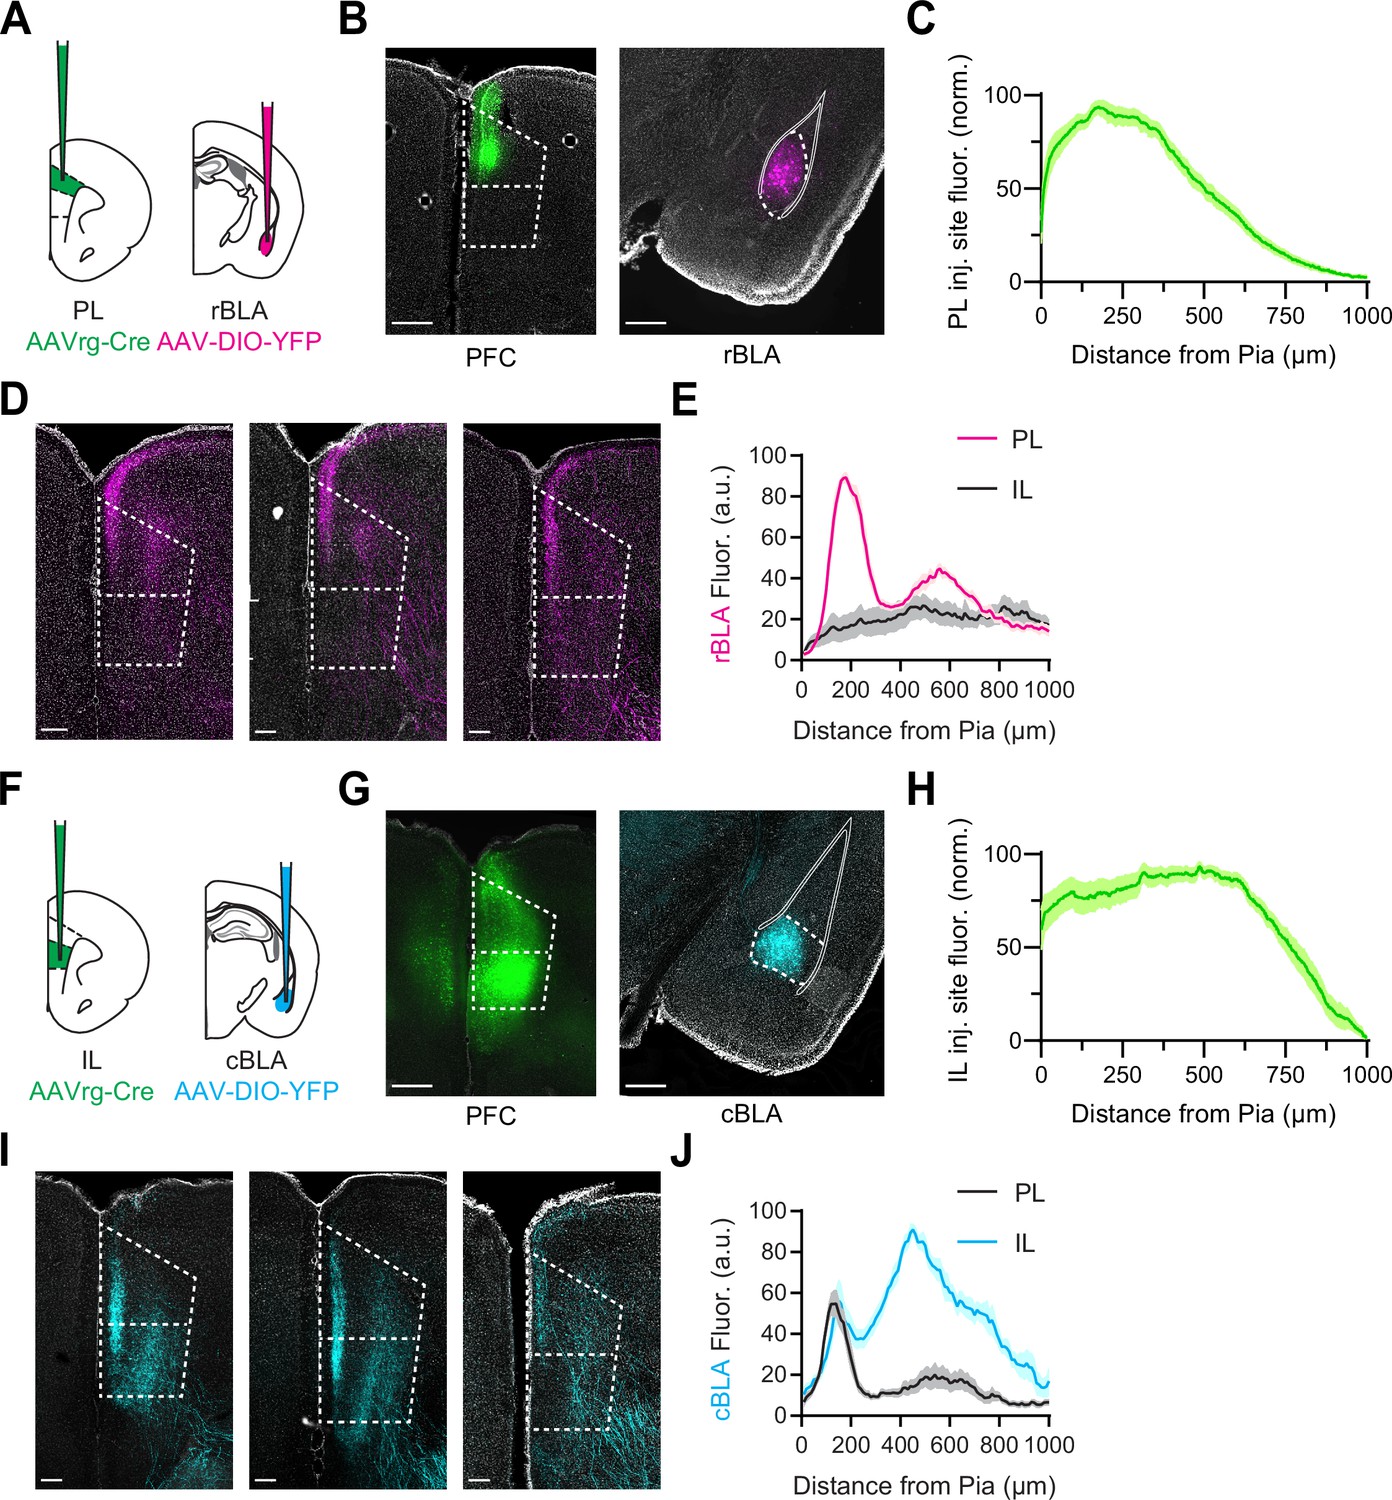
Rostral basolateral amygdala (rBLA) projections to prelimbic (PL) and caudal basolateral amygdala (cBLA) projections to infralimbic (IL).
(A) Schematic for injections of AAVrg-mCherry-IRES-Cre into PL (green) and AAV-DIO-YFP (magenta) into rBLA. (B) Left, Image of injection site for AAVrg-Cre (green) in PL. Scale bar = 500 µm. Right, Image of injection site for AAV-DIO-YFP (magenta) in rBLA. Solid white lines mark white matter boundaries of the basolateral amygdala (BLA). Scale bar = 200 µm. (C) Summary of normalized fluorescence intensity from the pia to white matter of AAVrg-Cre injection sites into PL (n = 3 animals). (D) Series of representative confocal images of prefrontal cortex (PFC) showing axonal fluorescence (magenta) from PL-projecting rBLA neurons and DAPI (gray) signal. Scale bar = 200 µm. (E) Summary of normalized fluorescence intensity from the pia to white matter of rBLA projections to PL (magenta) and IL (black). (F–J) Similar to (A–E) for injections of AAVrg-mCherry-IRES-Cre into IL (green) and AAV-DIO-YFP (cyan) into cBLA (n = 3 animals).
Figure 2 with 1 supplement
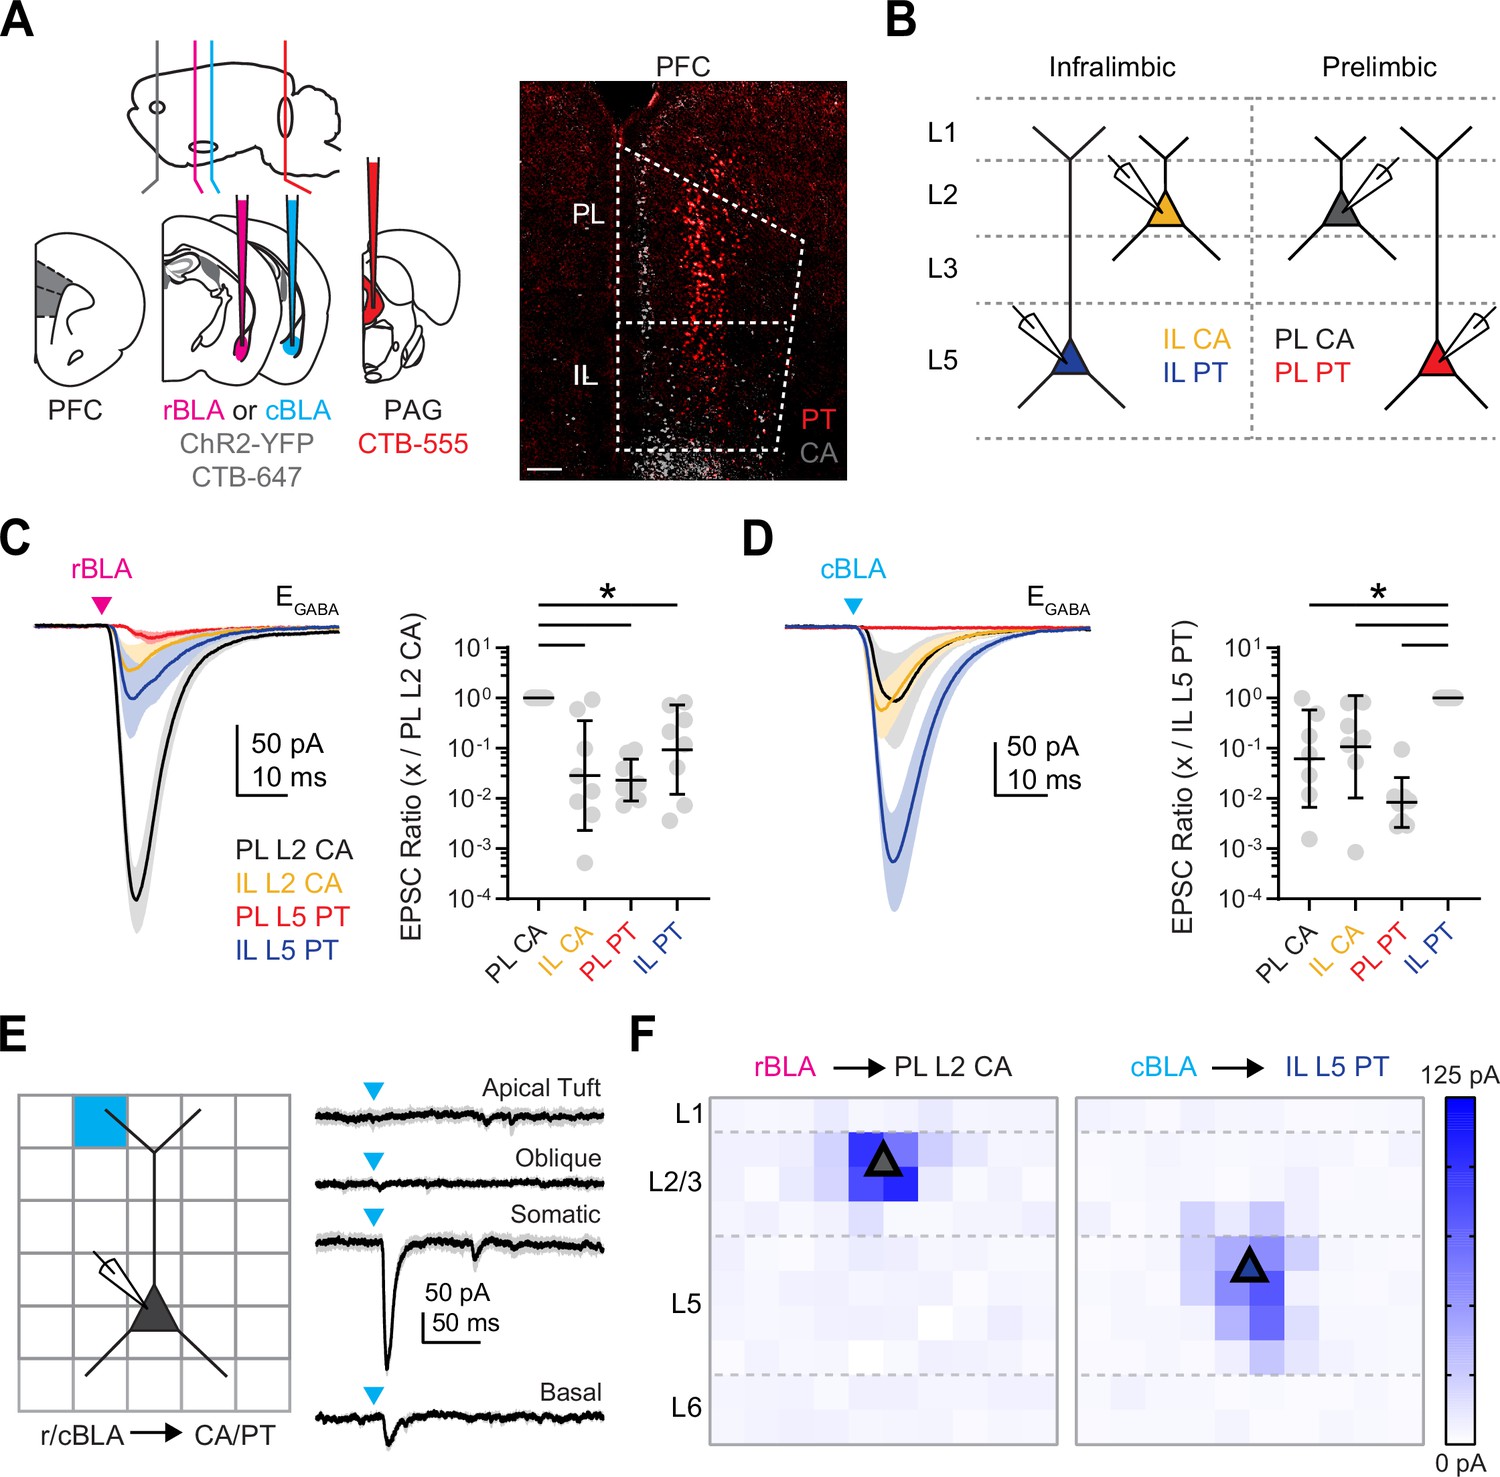
Rostral basolateral amygdala (rBLA) targets prelimbic (PL) L2 cortico-amygdalar (CA) neurons and caudal basolateral amygdala (cBLA) targets infralimbic (IL) L5 pyramidal tract (PT) neurons.
(A) Left, Schematic for injections of AAV-ChR2-eYFP and CTB-647 (gray) into rBLA or cBLA and CTB-555 (red) into periaqueductal gray (PAG). Right, Example image of retrogradely labeled CA neurons (gray) and PT neurons (red) in prefrontal cortex (PFC). Scale bar = 200 µm. (B) Schematic of color-coded PL L2 CA, IL L2 CA, PL L5 PT, and IL L5 PT neurons recorded in the presence of TTX and 4-AP to isolate monosynaptic connections from either rBLA or cBLA. (C) Left, Average rBLA-evoked excitatory postsynaptic currents (EPSCs) recorded at L2 CA and L5 PT neurons in PL and IL. Magenta arrow = light stimulation. Right, Summary of EPSC amplitude ratios, comparing responses at PL L2 CA neurons with paired IL L2 CA (n = 8), IL L5 PT (n = 8), and PL L5 PT (n = 8) neurons (n = 5 animals). (D) Similar to (C) for cBLA-evoked EPSCs, comparing responses at IL L5 PT neurons with paired IL L2 CA (n = 7), PL L2 CA (n = 7), and PL L5 PT (n = 8) neurons (n = 6 animals). (E) Left, Schematic for sCRACM experiments, showing pseudorandom illumination (blue light) of 75 × 75 µm squares across L1 to L6 of PFC, while recording either rBLA-evoked EPSCs at PL L2 CA neurons or cBLA-evoked EPSCs and IL L5 PT neurons in the presence of TTX and 4-AP. Right, Example cBLA-evoked EPSCs recorded at a IL L5 PT neuron, including with stimulation at apical tuft, oblique, somatic, and basal dendrite locations. (F) Left, Average rBLA-evoked EPSC maps for PL L2 CA neurons (n = 4 cells, 2 animals), color coded by amplitude. Right, Average cBLA-evoked EPSC maps for IL L5 PT neurons (n = 6 cells, 4 animals). Triangle denotes typical cell body location. *p < 0.05. See also Figure 2—figure supplement 1.
Figure 2—figure supplement 1
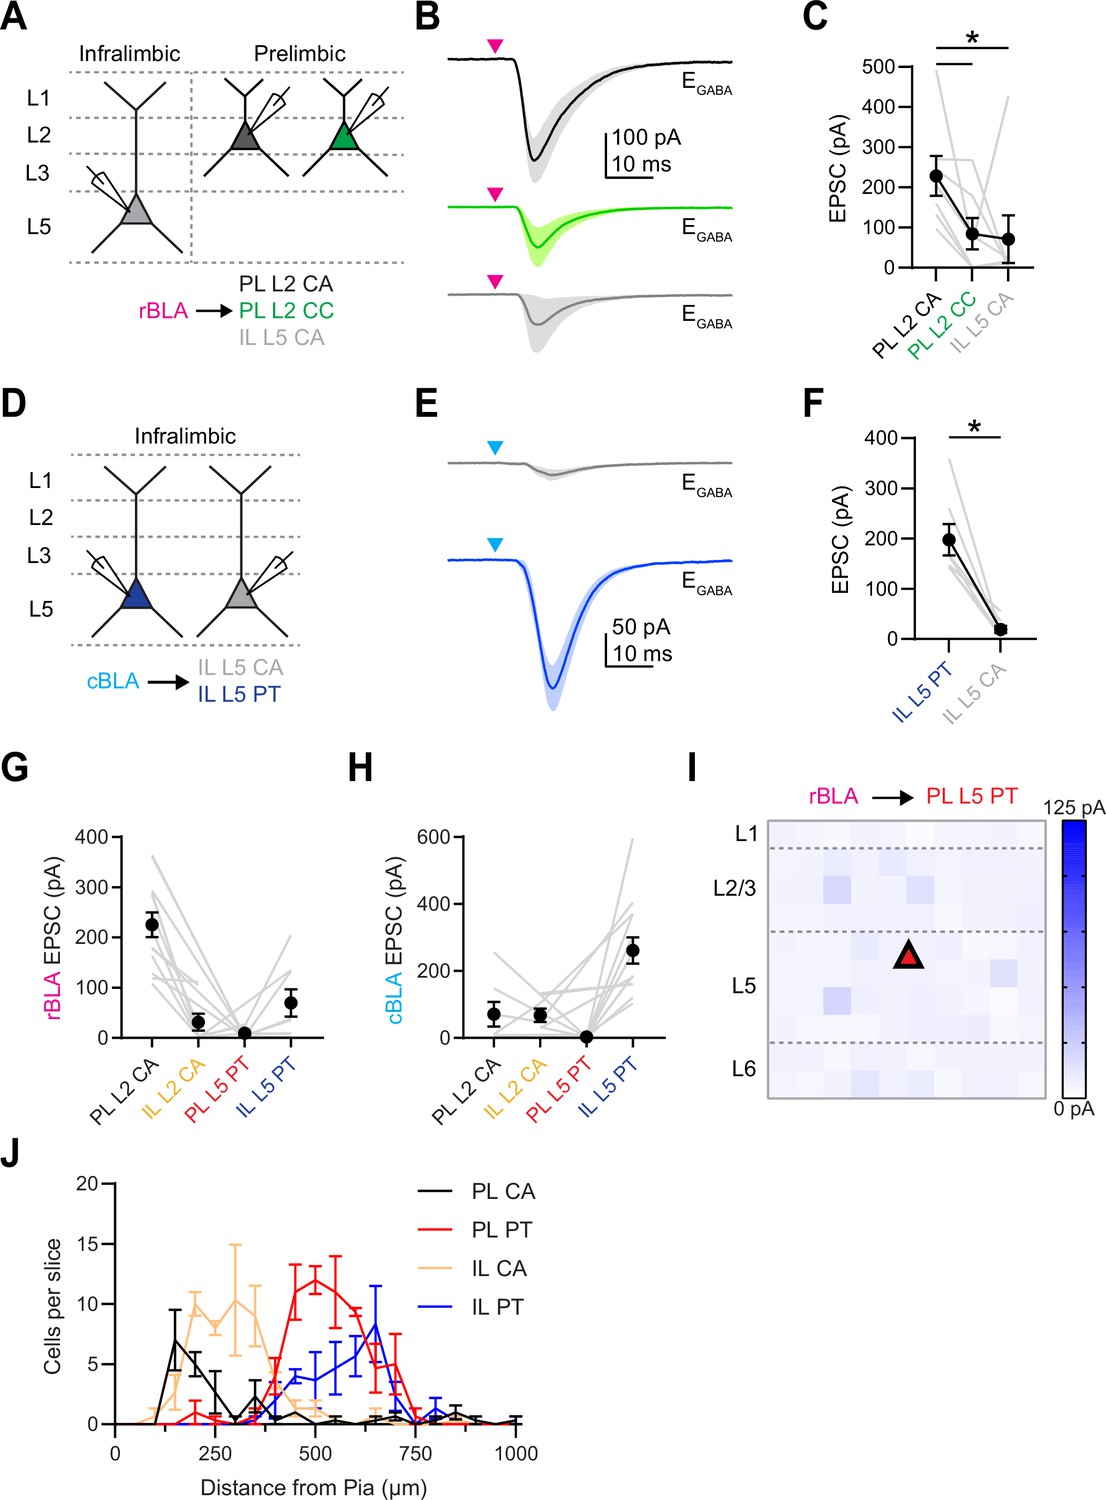
Rostral basolateral amygdala (rBLA) and caudal basolateral amygdala (cBLA) monosynaptic inputs.
(A) Schematic for examining rBLA-evoked cell type-specific connectivity. Triplets of prelimbic (PL) L2 cortico-amygdalar (CA) (black), PL L2 CC (green), and infralimbic (IL) L5 CA (gray) neurons were recorded in voltage clamp at EGABA to measure rBLA-evoked excitatory postsynaptic currents (EPSCs) in the presence of TTX and 4-AP. (B) Average rBLA-evoked EPSCs recorded at EGABA from PL L2 CA (black), PL L2 CC (green), and IL L5 CA (gray) neurons. (C) Summary of rBLA-evoked EPSC amplitudes. Gray lines denote individual triplets (n = 7 triplets, 4 animals). (D) Similar to (A) for examining cBLA-evoked cell type-specific connectivity between IL L5 pyramidal tract (PT) (blue) and IL L5 CA (gray) neurons. (E) Similar to (B) for average recordings of cBLA-evoked EPSCs. (F) Similar to (C) for summary of cBLA-evoked EPSC amplitudes (n = 7 pairs, 3 animals). (G) Graph of rBLA-evoked EPSC amplitudes at PL L2 CA, IL L2 CA, PL L5 PT, and IL L5 PT neurons. Individual gray lines denote cells recorded together. (H) Similar to (G) for cBLA-evoked EPSC amplitudes. (I) Average sCRACM maps for rBLA-evoked EPSCs at PL L5 PT neurons (n = 6 cells, 3 animals). (J) Graph of retrogradely labeled CA and PT neurons in PL and IL and their laminar distributions with 50 µm bin size (n = 3 slices, 1 animal). *p < 0.05.
Figure 3 with 1 supplement
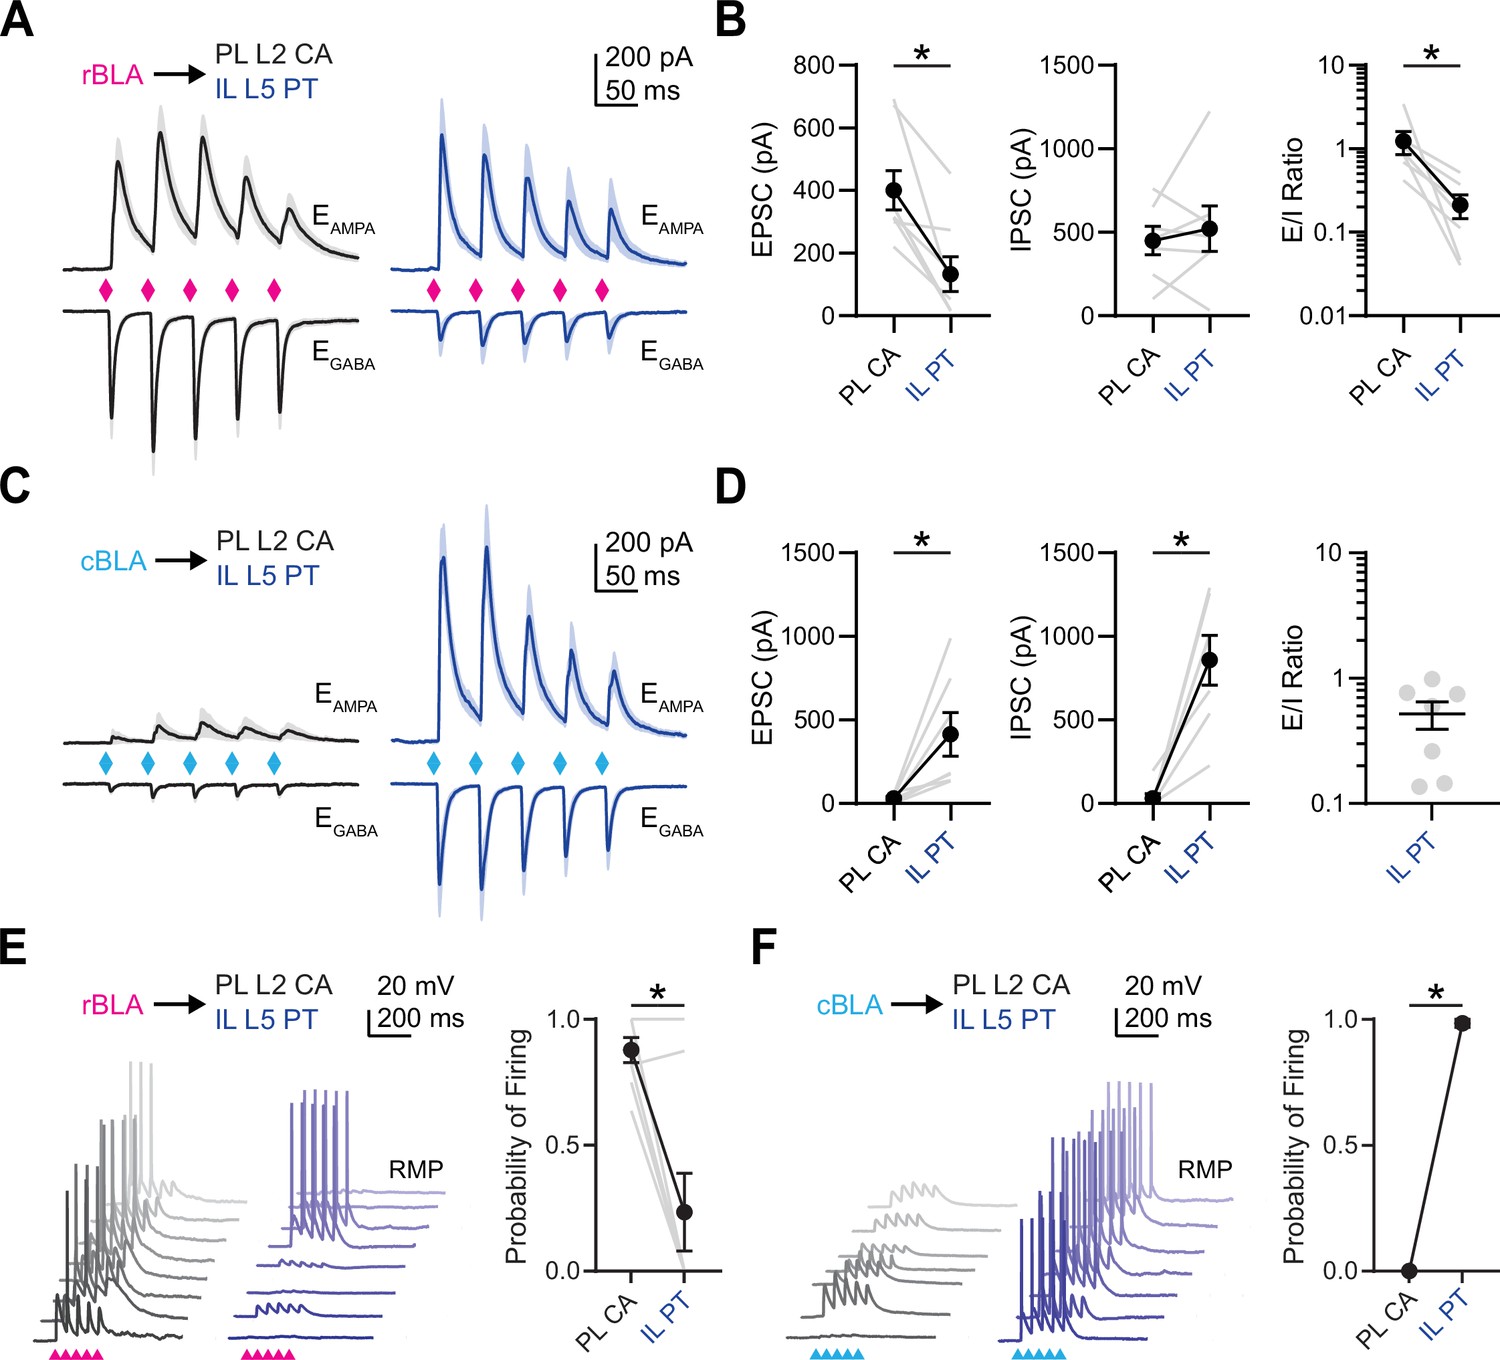
Rostral basolateral amygdala (rBLA) and caudal basolateral amygdala (cBLA) activate distinct projection neurons in prelimbic (PL) and infralimbic (IL).
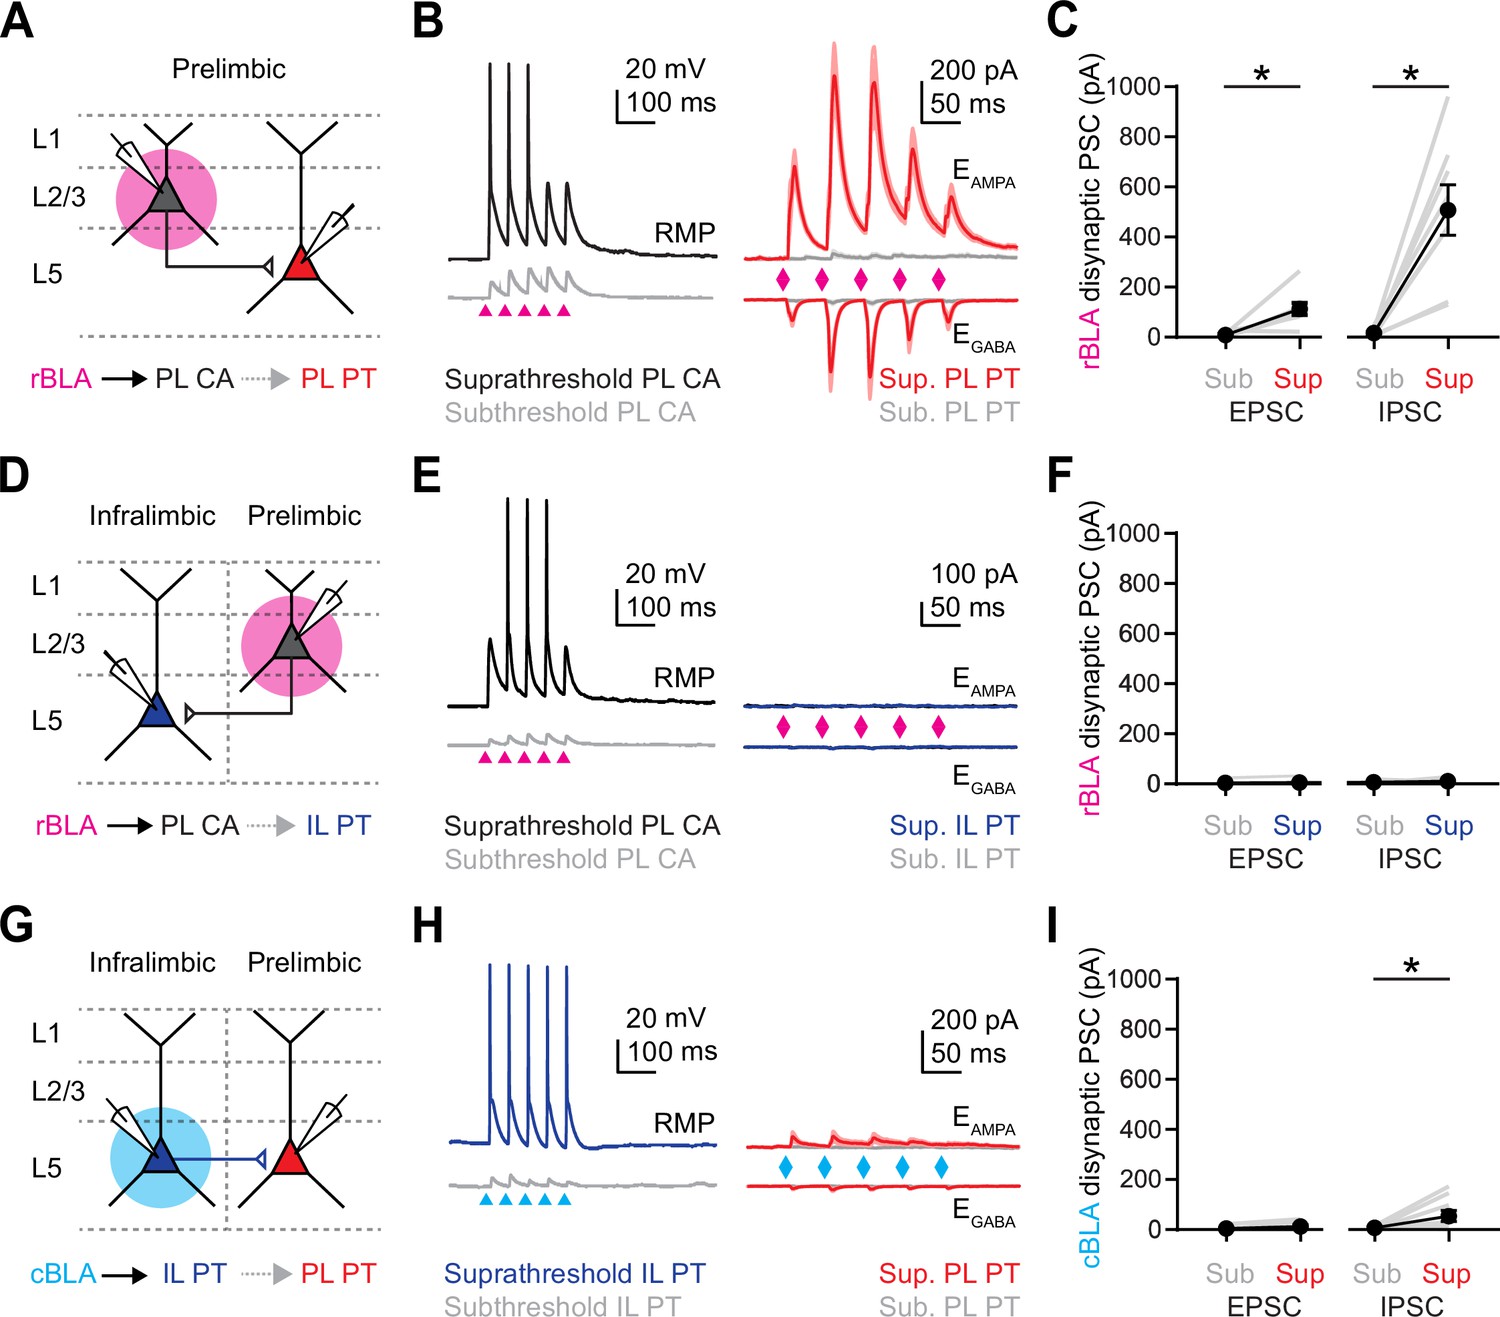
(A) Average rBLA-evoked excitatory postsynaptic currents (EPSCs) (bottom, recorded at EGABA) and IPSCs (top, recorded at EAMPA) at PL L2 cortico-amygdalar (CA) (left, black) and IL L5 pyramidal tract (PT) neurons (right, blue) (n = 8 pairs, 5 animals). Diamonds denote light pulses. (B) Left, Summary of rBLA-evoked EPSC1 amplitudes for PL L2 CA and IL L5 PT neurons. Middle, Similar for IPSC1 amplitudes. Right, Similar for EPSC1/IPSC1 ratios. Gray lines denote individual pairs of neurons. (C, D) Similar to (A, B) for cBLA inputs onto PL L2 CA and IL L5 PT neurons, with E/I ratios only for IL L5 PT due to the lack of inhibition onto PL L2 CA (n = 7 pairs, 4 animals). (E) Left, Example rBLA-evoked EPSPs and APs from pairs of PL L2 CA and IL L5 PT neurons recorded in current-clamp at resting membrane potential (RMP). Right, Summary of rBLA-evoked AP probability for PL L2 CA and IL L5 PT neurons. Gray lines denote individual pairs of neurons (n = 8 pairs, 5 animals). (F) Similar to (E) for cBLA-evoked EPSPs and APs from pairs of PL L2 CA and IL L5 PT neurons (n = 7 pairs, 3 animals). Note that all gray lines overlap with the black line. *p < 0.05. See also Figure 3—figure supplement 1.
Figure 3—figure supplement 1
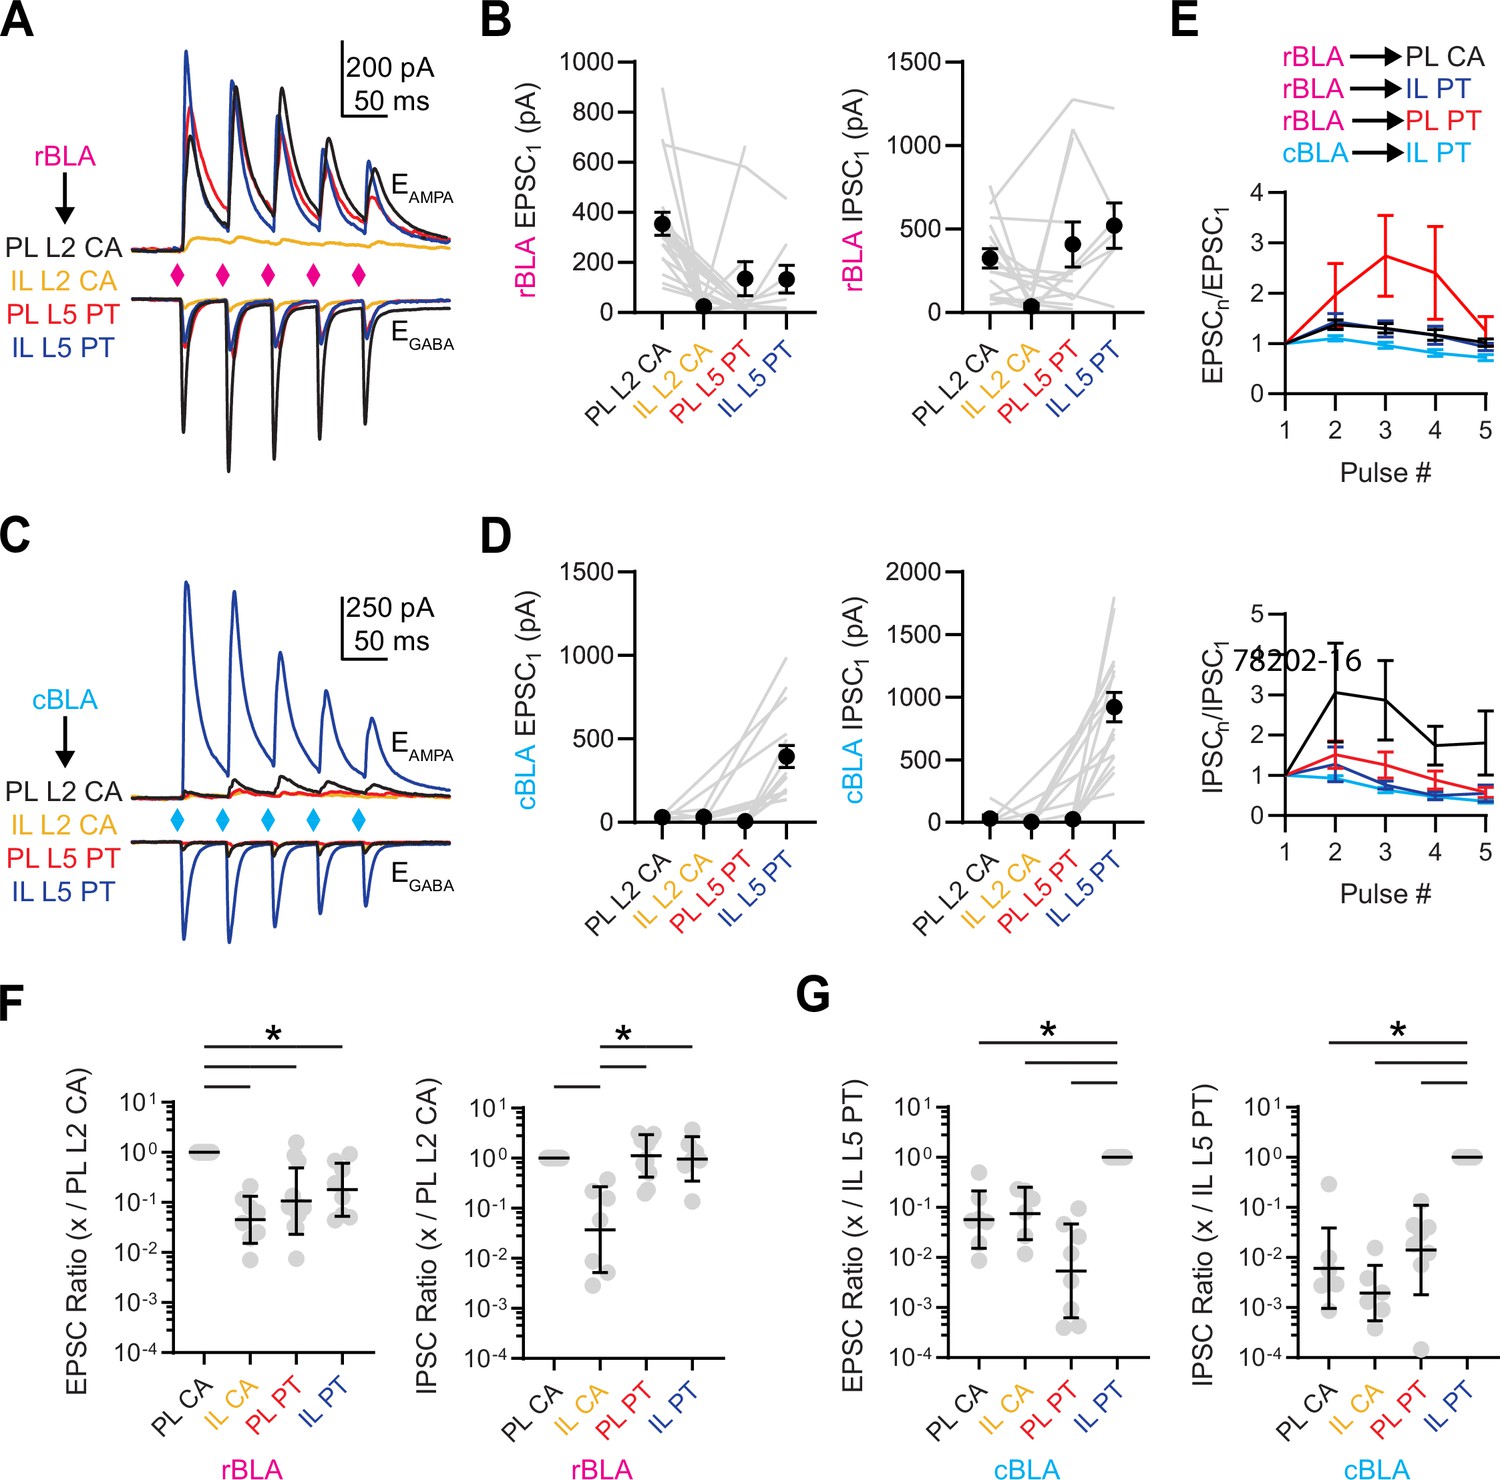
Short-term dynamics of rostral basolateral amygdala (rBLA) and caudal basolateral amygdala (cBLA) inputs.
(A) Average rBLA-evoked excitatory postsynaptic currents (EPSCs) and IPSCs at prelimbic (PL) L2 cortico-amygdalar (CA) (black, n = 19), infralimbic (IL) L2 CA (yellow, n = 8), PL L5 pyramidal tract (PT) (red, n = 12), and IL L5 PT neurons (blue, n = 8). Note that PL L2 CA average traces reflect data from all sets of pairs (n = 10 animals). (B) Left, Summary of rBLA-evoked EPSC1 amplitudes. Gray lines denote cells recorded together. Right, Similar for cBLA-evoked EPSC1 amplitudes. (C, D) Similar to (A, B) for cBLA inputs onto PL L2 CA (n = 7), IL L2 CA (n = 6), PL L5 PT (n = 8), and IL L5 PT (n = 16) neurons (n = 9 animals). (E) Top, Summary of EPSC PPR for rBLA- and cBLA-evoked responses at the different cell types. Bottom, Similar for IPSC PPR. (F) Left, Summary of rBLA-evoked EPSC1 amplitude ratios for PL L2 CA, IL L2 CA, PL L5 PT, and IL L5 PT responses, divided by PL L2 CA responses. Right, Similar for IPSC1 amplitude ratios. Gray points denote individual pairs. (G) Similar to (F) for cBLA-evoked EPSC1 and IPSC1 amplitude ratios, referenced to IL L5 PT neurons. *p < 0.05.
Figure 4 with 2 supplements

Rostral basolateral amygdala (rBLA) and caudal basolateral amygdala (cBLA) stimulation evoke distinct responses in prelimbic (PL) and infralimbic (IL).
(A) Schematic of AAV-ChR2-eYFP injections and fiber optic placement into either rBLA (magenta) or cBLA (cyan), along with Neuropixels (NP) recordings in prefrontal cortex (PFC). (B) Left, Schematic of NP probe insertions into L2 and L5 of IL and PL. Right, Example of NP probe tracts from sequential insertions into L2 and L5 of PFC (red = DiI), along with cBLA axons (cyan = eYFP). DAPI staining is shown in gray. Scale bar = 500 µm. (C) Left, Example of rBLA stimulation and NP recording in L2 of PFC. Graph shows the average change in spiking activity (z-scored) evoked by rBLA stimulation across each channel of the NP probe. Arrows denote timing of light-emitting diode (LED) stimulation. Right, Similar for cBLA stimulation and NP recording in L5 of PFC. (D) Left, Example single unit with significant basolateral amygdala (BLA)-evoked activation, with average response (top) and raster plot of peri-stimulus activity for 40 trials (bottom). Right, Similar for single unit with significant BLA-evoked suppression. (E) Percentage of units responsive to rBLA (left) or cBLA (right) inputs across different layers and subregions of the PFC. (F) Similar to (E) for units activated (left) or suppressed (right) by rBLA inputs. (G) Similar to (E) for units activated (left) or suppressed (right) by cBLA inputs. *p < 0.05. See also Figure 4—figure supplements 1 and 2.
Figure 4—figure supplement 1
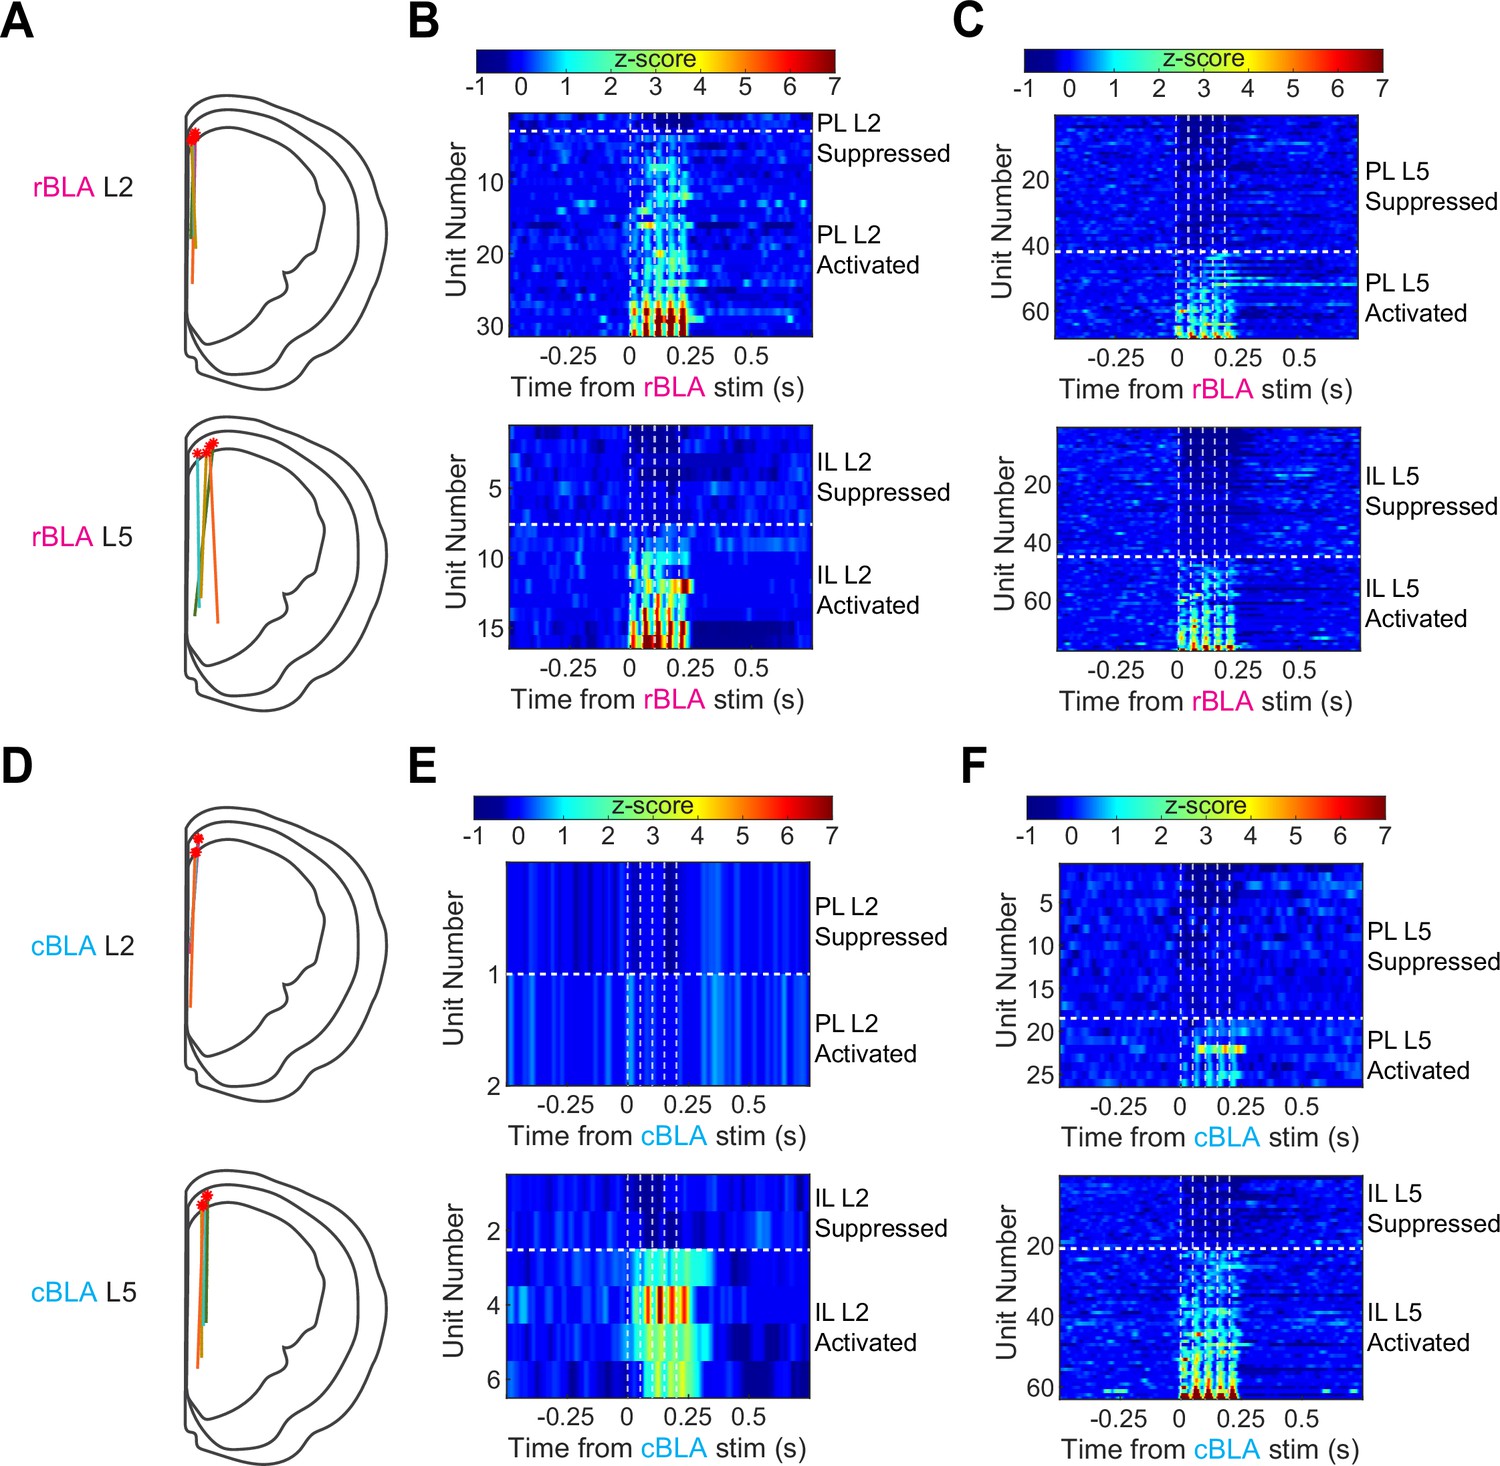
Rostral basolateral amygdala (rBLA) and caudal basolateral amygdala (cBLA) inputs cause distinct patterns of activity across prefrontal cortex (PFC).
(A) Top, Reconstructed probe tracts for all L2 insertions from rBLA stimulation experiments. Bottom, Reconstructed probe tracts for all L5 insertions from rBLA stimulation experiments. (B) Graph of average smoothed, normalized PSTHs from each significantly activated or suppressed unit in prelimbic (PL) L2 (top) and infralimbic (IL) L2 (bottom) in response to rBLA stimulation. Units are sorted by z-score value from lowest to highest within the stimulus window. Dotted lines denote stimulation timing. (C) Similar to (B) showing PL L5 and IL L5 responses to rBLA stimulation. (D–F) Similar to (A–C) for cBLA stimulation experiments.
Figure 4—figure supplement 2
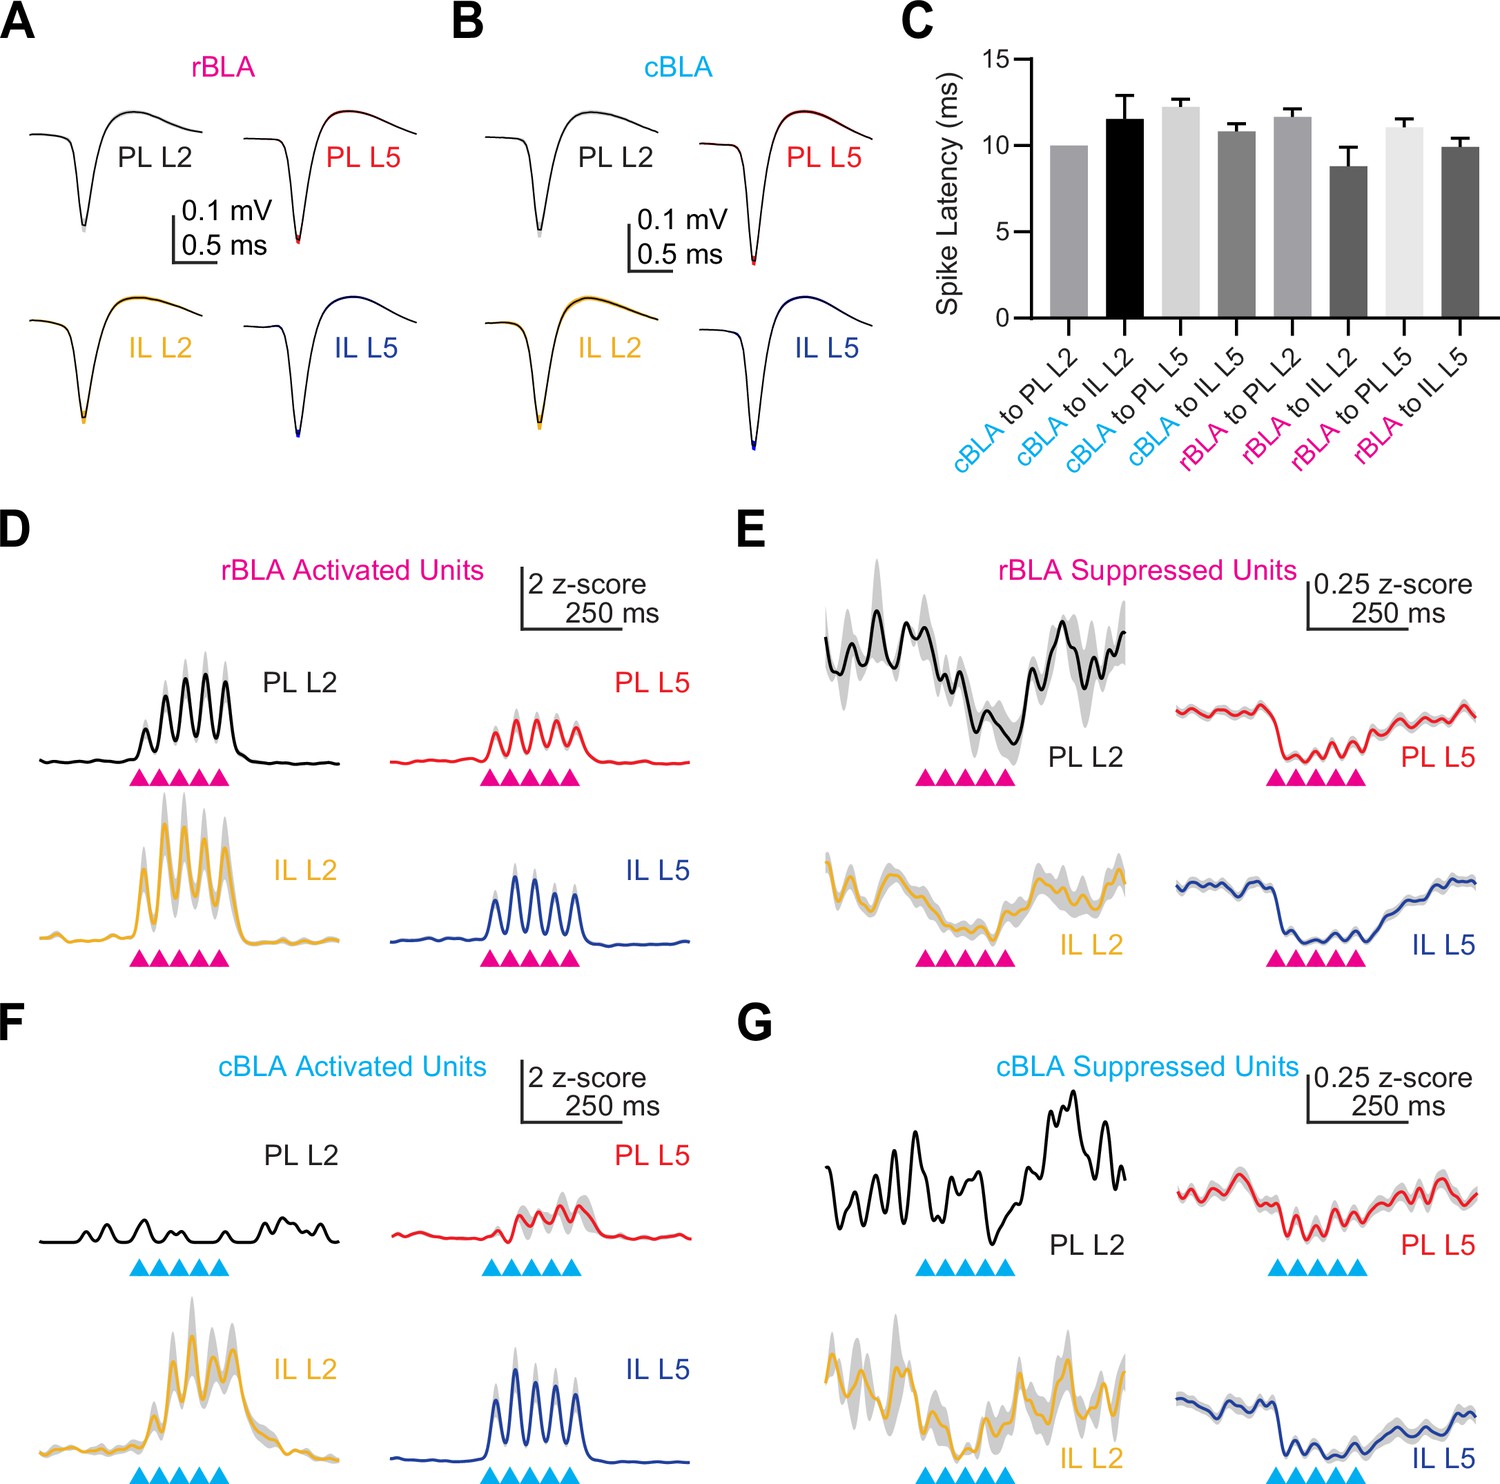
Rostral basolateral amygdala (rBLA) and caudal basolateral amygdala (cBLA) excited and inhibited units.
(A) Average waveform of all single units recorded in prelimbic (PL) L2, infralimbic (IL) L2, PL L5, and IL L5 from animals with rBLA stimulation. (B) Similar to (A) for single units recorded from animals with cBLA stimulation. Summary of spike latency for significantly activated single units after rBLA or cBLA stimulation within a 5- to 25-ms window after every pulse. (D) Average smoothed, z-scored response from rBLA-activated units in PL L2 (black), IL L2 (yellow), PL L5 (red), and IL L5 (blue). (E) Similar to (D) for rBLA-suppressed units. (F) Similar to (D) for cBLA-activated units. (G) Similar to (D) for cBLA-suppressed units.
Figure 5 with 1 supplement
Rostral basolateral amygdala (rBLA) but not caudal basolateral amygdala (cBLA) engages prelimbic (PL) L5 pyramidal tract (PT) neurons via local networks.
(A) Schematic for recording rBLA-evoked responses at PL L2 cortico-amygdalar (CA) neurons (black) and polysynaptic responses at PL L5 PT neurons (red). (B) Left, Example rBLA-evoked EPSPs and APs from PL L2 CA neurons recorded in current-clamp at resting membrane potential (RMP) with subthreshold (bottom, gray) and suprathreshold (top, black) stimulation. Right, Average rBLA-evoked excitatory postsynaptic currents (EPSCs) (bottom, at EGABA) and IPSCs (top, at EAMPA) recorded at PL L5 PT neurons at the same subthreshold (gray) and suprathreshold (red) stimulation. (C) Summary of rBLA-evoked EPSC1 and IPSC1 amplitudes at PL L5 PT neurons. Gray lines show subthreshold and suprathreshold responses in the same neuron (n = 8 cells, 4 animals). (D–F) Similar to (A–C) for rBLA-evoked EPSPs and APs at PL L2 CA neurons (gray and black) and lack of polysynaptic responses at infralimbic (IL) L5 PT neurons (right, blue) (n = 8 cells, 3 animals). (G–I) Similar to (A–C) for cBLA-evoked EPSPs and APs at IL L5 PT neurons (gray and blue) and lack of polysynaptic responses at PL L5 PT neurons (red) (n = 9 cells, 3 animals). *p < 0.05. See also Figure 5—figure supplement 1.
Figure 5—figure supplement 1
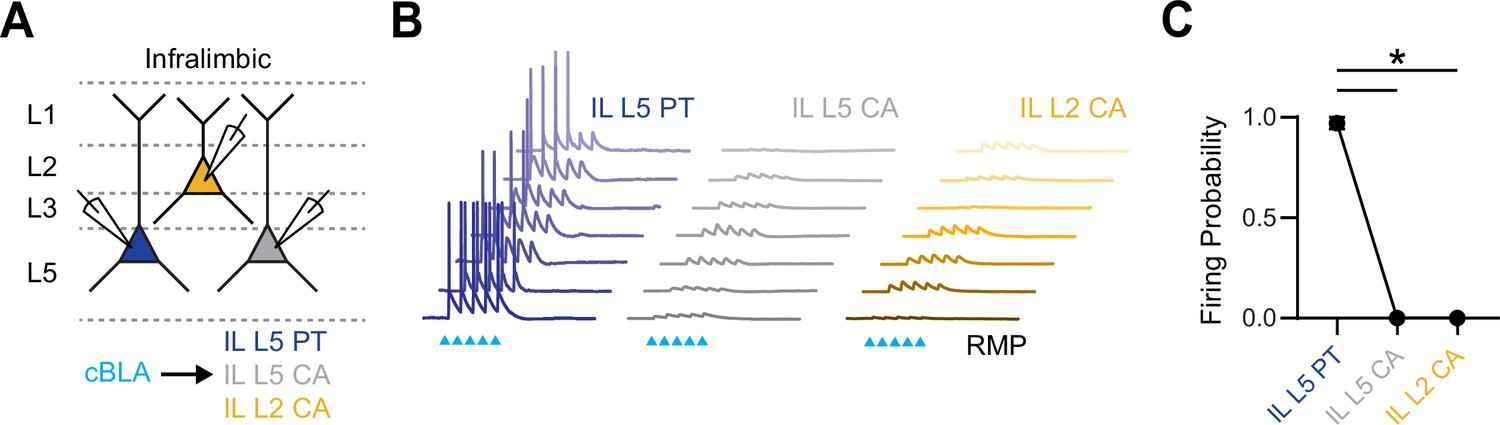
Caudal basolateral amygdala (cBLA) does not appreciably engage the mPFC local circuit.
(A) Schematic for examining cBLA-evoked activation of triplets of infralimbic (IL) L5 pyramidal tract (PT) (blue), IL L5 cortico-amygdalar (CA) (gray), and IL L2 CA (yellow) neurons. Individual neurons were recorded in current-clamp at resting membrane potential (RMP) while stimulating cBLA axons at 20 Hz at suprathreshold intensities. (B) Summary of cBLA-evoked APs and EPSPs at IL L5 PT, IL L5 CA, and IL L2 CA neurons. Each line shows a different triplet, with an example sweep from IL L5 PT neuron and average EPSPs from IL L5 CA and IL L2 CA neurons (n = 7 triplets, 4 animals). (C) Summary of cBLA-evoked AP probability for IL L5 PT, IL L5 CA, and IL L2 CA neurons. *p < 0.05.
Figure 6 with 1 supplement
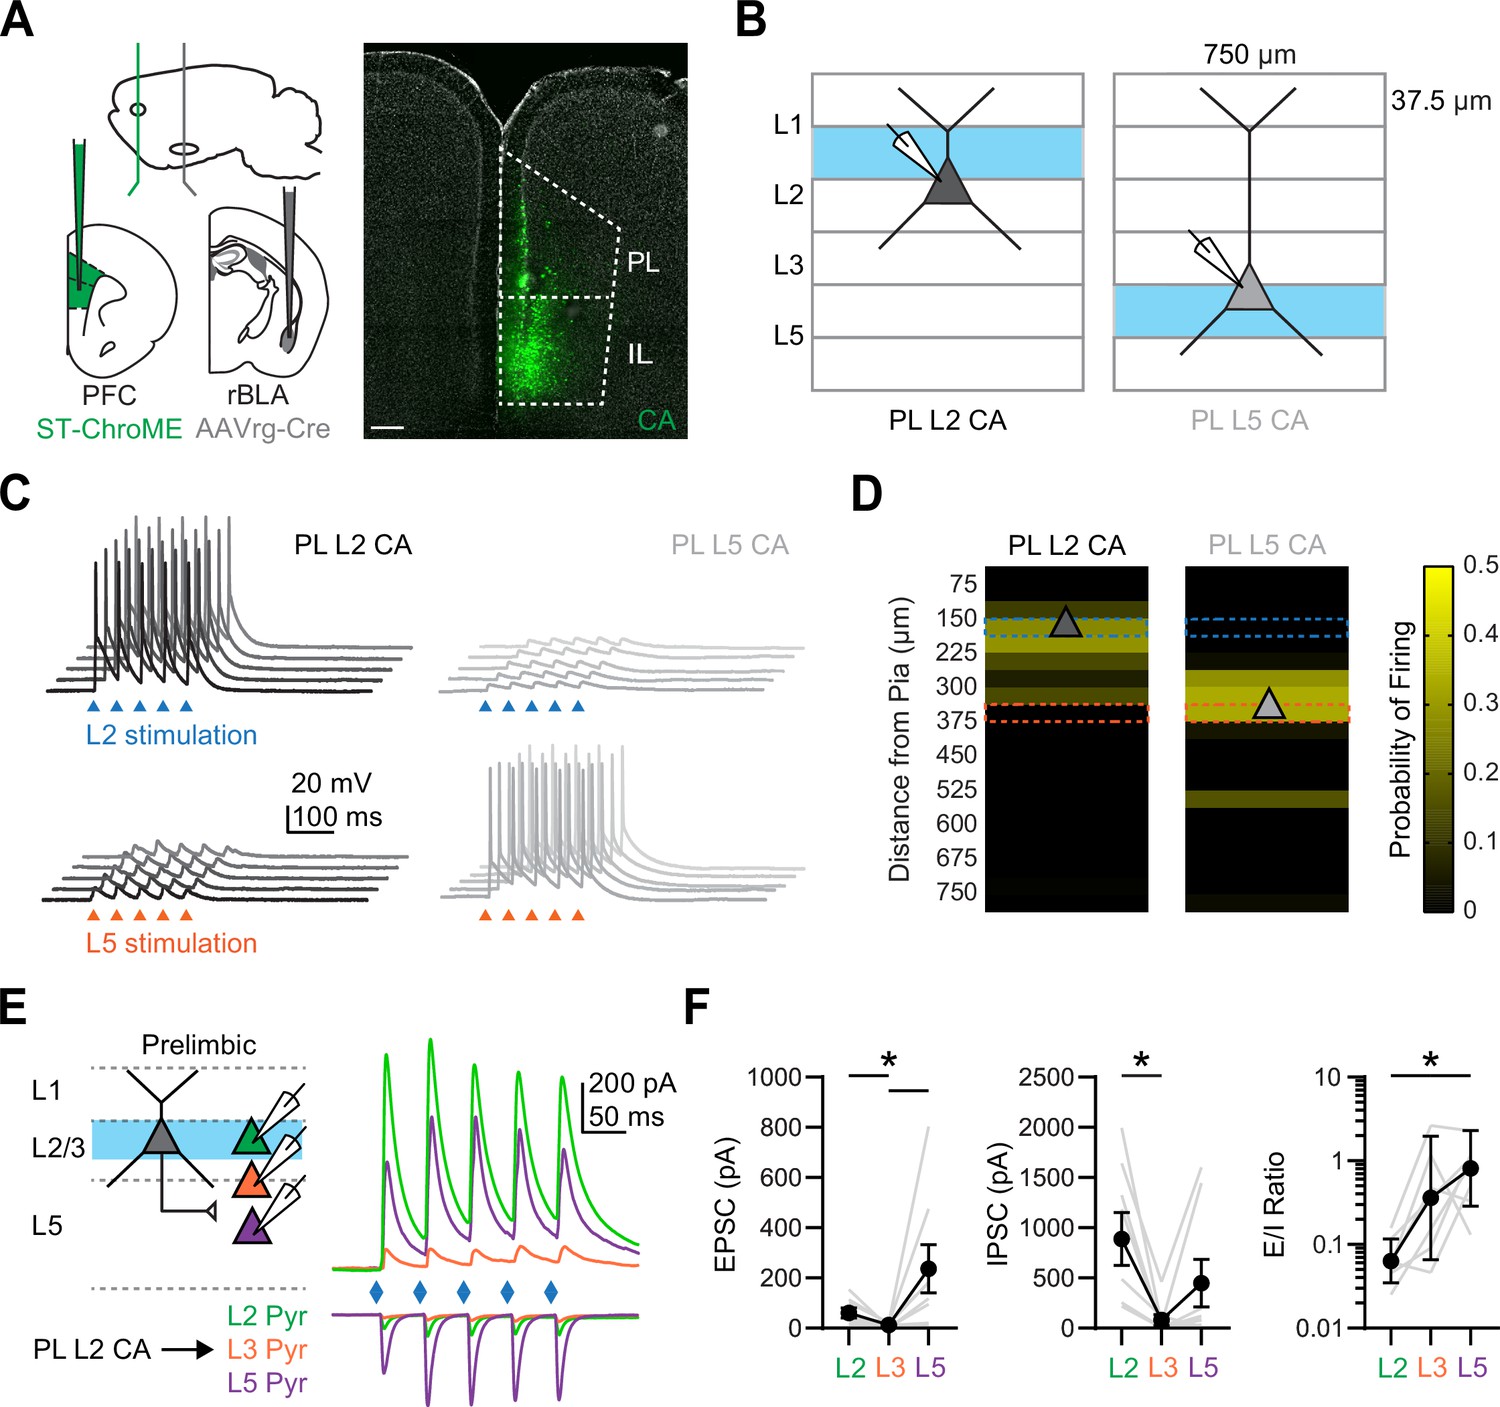
Prelimbic (PL) L2 cortico-amygdalar (CA) neurons evoke prominent responses in PL L5 pyramidal neurons.
(A) Left, Schematic for injections of AAVrg-Cre into rostral basolateral amygdala (rBLA) and AAV-DIO-St-ChroME into prefrontal cortex (PFC). Right, Example image of CA neurons retrogradely labeled by AAVrg-Cre and expressing DIO-ChR2-eYFP (green) in the PFC. DAPI staining is shown in gray. Scale bar = 200 µm. (B) Schematic for laminar stimulation experiments, where st-ChroME + CA neurons in L2 and L5 of PL were recorded in current-clamp at resting membrane potential (RMP) and stimulated with 37.5 × 750 µm bars of light at 0.2 Hz. (C) Example traces from stimulation of L2 (top, blue) or L5 (bottom, orange) and evoked responses at PL L2 CA neurons (left, black) and PL L5 CA neurons (right, gray). Triangles denote light pulses. (D) Summary graphs of laminar stimulation control experiments at for PL L2 CA neurons (left) and PL L5 CA neurons (right) (n = 10 PL L2 CA neurons and 7 PL L5 CA neurons, 3 animals). Light-evoked firing is plotted as a function of the distance from the pia for a given laminar location. Triangle denotes average cell body location. (E) Left, Schematic for recording PL L2 CA-evoked responses at triplets of unlabeled L2 (green), L3 (orange), and L5 (purple) pyramidal neurons in PL. Right, Average PL L2 CA-evoked excitatory postsynaptic currents (EPSCs) (bottom, at EGABA) and IPSCs (top, at EAMPA) at the three pyramidal cell types. (F) Left, Summary of PL L2 CA-evoked EPSC1 amplitudes for L2, L3, and L5 pyramidal neurons in PL, where gray lines denote individual triplets. Middle, Similar for IPSC1 amplitudes. Right, Similar for EPSC1/IPSC1 ratio (n = 8 triplets, 4 animals). *p < 0.05. See also Figure 6—figure supplement 1.
Figure 6—figure supplement 1
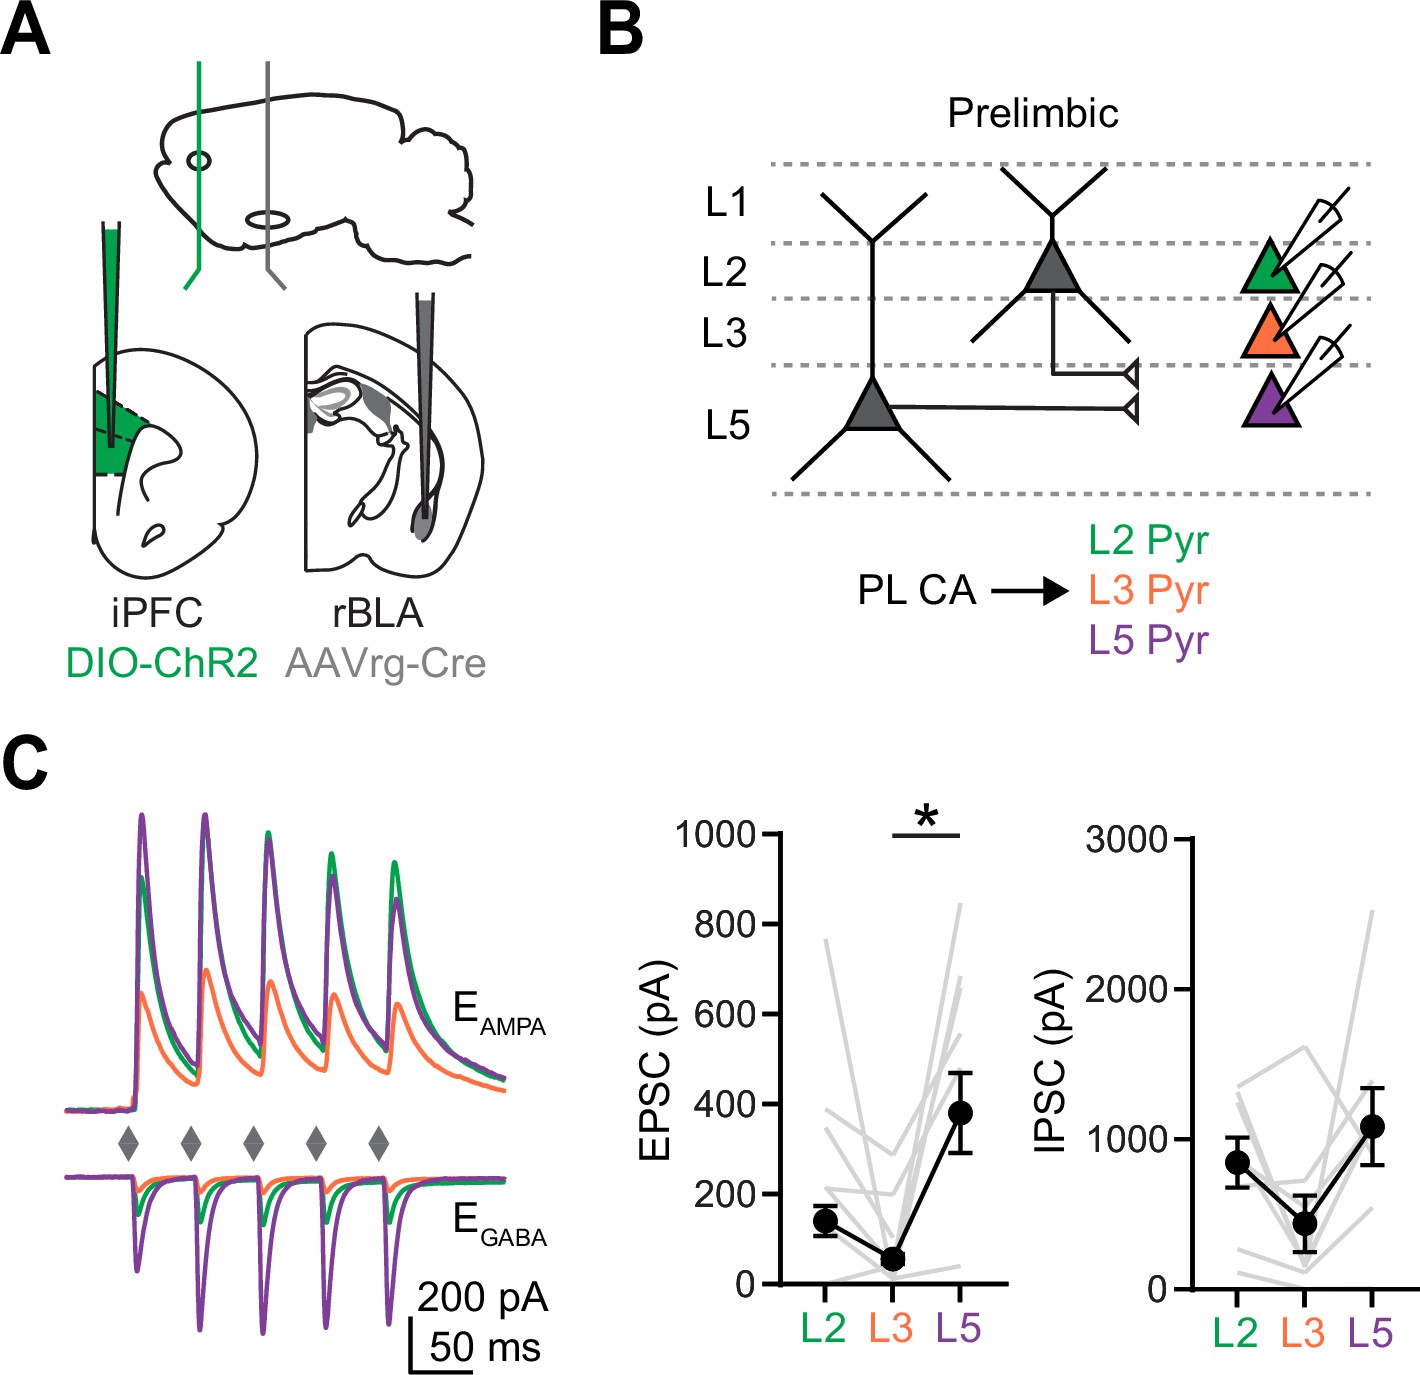
Prelimbic (PL) cortico-amygdalar (CA) neurons project within the local network to L5.
(A) Schematic for injections of AAVrg-Cre into rostral basolateral amygdala (rBLA) and AAV-DIO-ChR2 into prefrontal cortex (PFC). (B) Schematic for examining local CA connectivity. Triplets of L2 (green), L3 (orange), and L5 (purple) pyramidal neurons were recorded in voltage clamp while stimulating CA neurons at 20 Hz. (C) Left, Average CA-evoked excitatory postsynaptic currents (EPSCs) and IPSCs at PL L2 (green), L3 (orange), and L5 (purple) pyramidal neurons. Middle, Summary of PL CA-evoked EPSC1 amplitudes for PL L2, L3, and L5 pyramidal neurons, where gray lines denote individual triplets. Right, Similar for IPSC1 amplitudes (n = 8 triplets, 4 animals). *p < 0.05.
Figure 7 with 1 supplement

Prelimbic (PL) L2 cortico-amygdalar (CA) neurons specifically target PL L5 pyramidal tract (PT) over PL L5 IT neurons.
(A) Left, Schematic for recording PL L2 CA-evoked responses at pairs of PL L5 IT and PL L5 PT neurons. Right, Average PL L2 CA-evoked excitatory postsynaptic currents (EPSCs) and IPSCs recorded at PL L5 IT (gray) and PL L5 PT (red) neurons. (B) Left, Summary of PL L2 CA-evoked EPSC1 amplitudes at PL L5 IT and PL L5 PT neurons, where gray lines denote individual pairs. Right, Similar for IPSC1 amplitudes (n = 12 pairs for EPSCs and 10 pairs for IPSCs, 7 animals). (C) Example traces from dynamic-clamp recordings, where excitatory (E) or mixed excitatory and inhibitory (E + I) conductances derived from (A) were scaled and injected into respective PL L5 PT (red) or PL L5 IT (gray) neurons. Lighter shades represent higher scale factors. (D) Left, Summary average spiking elicited from injecting E or E + I conductances into respective cell types at maximum scaled conductance values. Gray lines denote spiking from individual neurons. Right, Summary of spiking evoked at all scale factors (n = 7 for each cell type, 4 animals). (E) Revised models of synaptic connectivity for caudal basolateral amygdala (cBLA) to infralimbic (IL) (left) and rostral basolateral amygdala (rBLA) to PL (right). *p < 0.05. See also Figure 7—figure supplement 1.
Figure 7—figure supplement 1
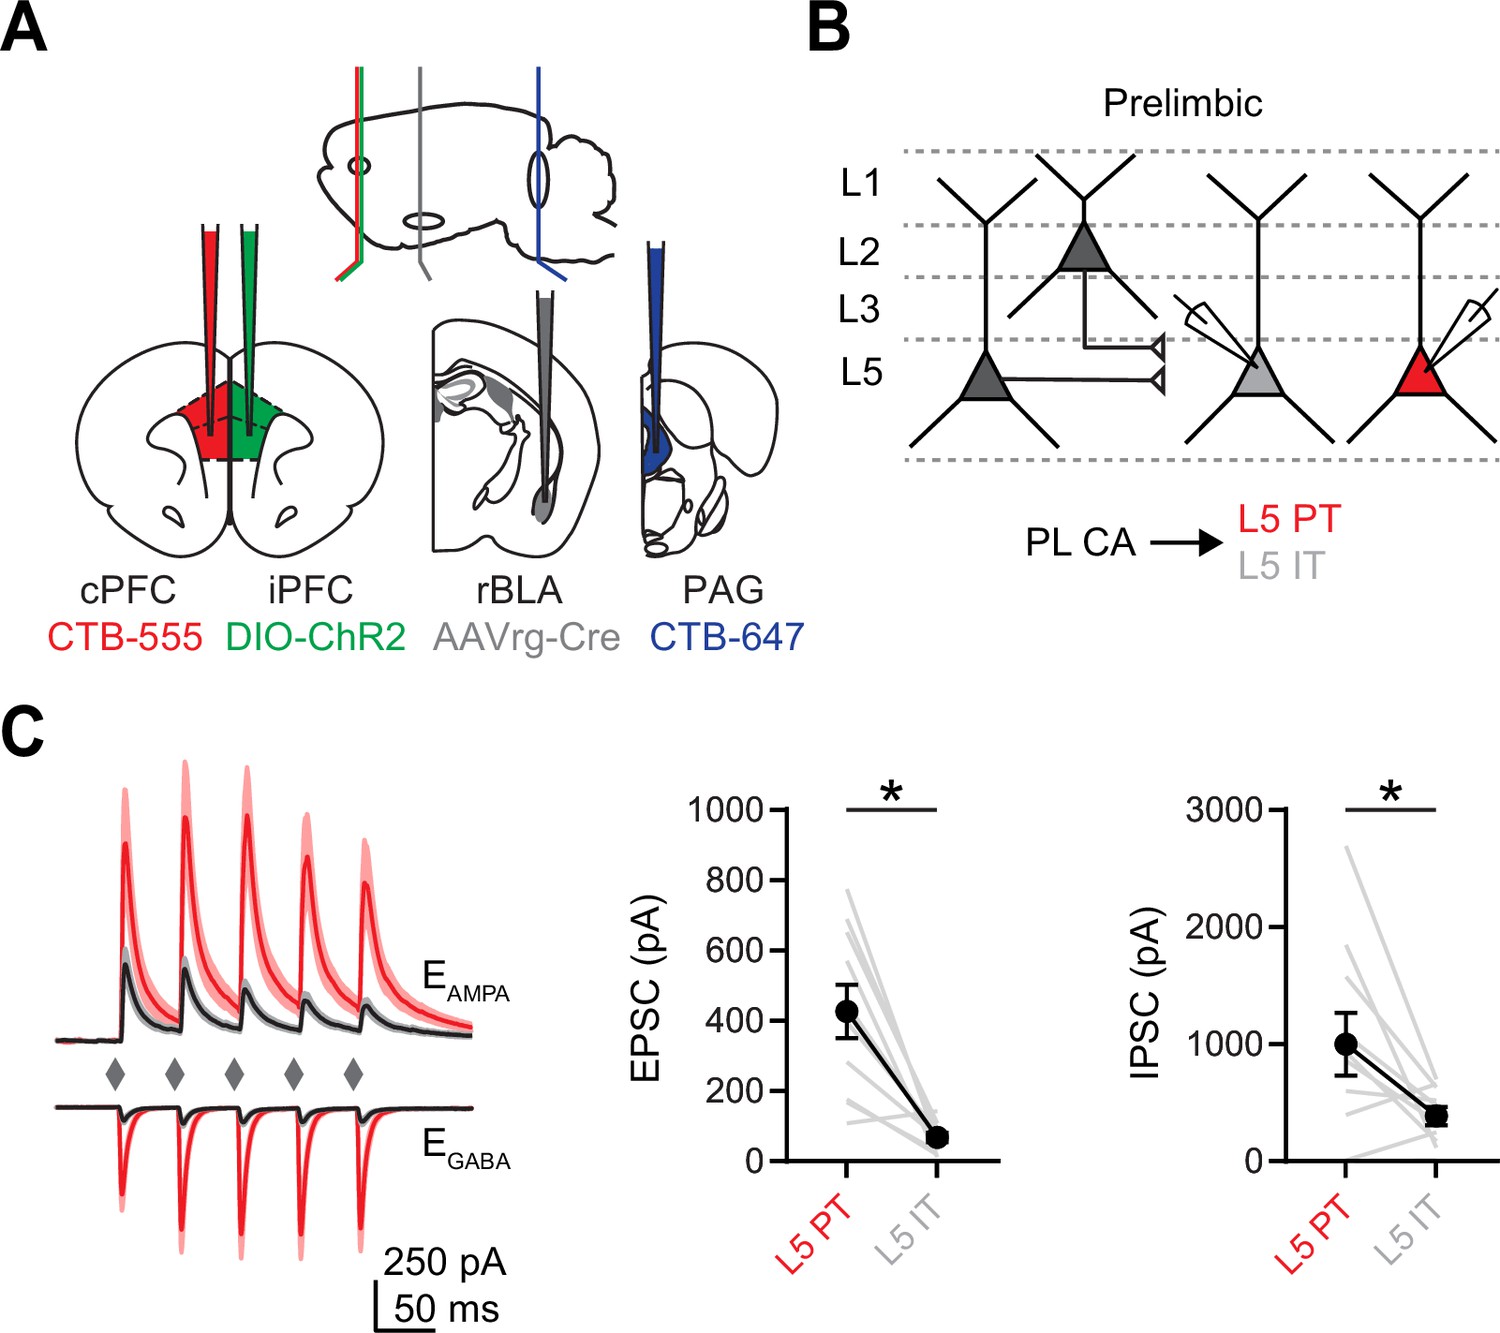
Prelimbic (PL) cortico-amygdalar (CA) neurons project preferentially to L5 pyramidal tract (PT) neurons.
(A) Schematic for injections of AAVrg-Cre into rostral basolateral amygdala (rBLA), AAV-DIO-ChR2 into prefrontal cortex (PFC), CTB-647 into periaqueductal gray (PAG), and CTB-555 into the contralateral PFC. (B) Schematic for examining local CA connections onto specific L5 subtypes. Pairs of PL L5 IT and PL L5 PT neurons were recorded while stimulating CA neurons at 20 Hz. (C) Left, Average CA-evoked excitatory postsynaptic currents (EPSCs) and IPSCs at PL L5 IT (black) and PL L5 PT (red) neurons. Middle, Summary of PL CA-evoked EPSC1 amplitudes at PL L5 IT and PL L5 PT neurons, where gray lines denote individual pairs. Right, Similar for IPSC1 amplitudes (n = 10 pairs, 4 animals). *p < 0.05.
Additional files
-
Transparent reporting form
- https://cdn.elifesciences.org/articles/82688/elife-82688-transrepform1-v2.pdf
-
Source data 1
Statistical tests for all figures.
- https://cdn.elifesciences.org/articles/82688/elife-82688-data1-v2.xlsx
-
Source data 2
Graph data for all figures.
- https://cdn.elifesciences.org/articles/82688/elife-82688-data2-v2.xlsx
Download links
A two-part list of links to download the article, or parts of the article, in various formats.
Downloads (link to download the article as PDF)
Open citations (links to open the citations from this article in various online reference manager services)
Cite this article (links to download the citations from this article in formats compatible with various reference manager tools)
Rostral and caudal basolateral amygdala engage distinct circuits in the prelimbic and infralimbic prefrontal cortex
eLife 11:e82688.
https://doi.org/10.7554/eLife.82688


