Nuclear m6A reader YTHDC1 promotes muscle stem cell activation/proliferation by regulating mRNA splicing and nuclear export
- Department of Chemical Pathology, Li Ka Shing Institute of Health Sciences, The Chinese University of Hong Kong, China
- Center for Neuromusculoskeletal Restorative Medicine (CNRM), CUHK InnoHK Centres, The Chinese University of Hong Kong, China
- Department of Orthopaedics and Traumatology, Li Ka Shing Institute of Health Sciences, The Chinese University of Hong Kong, China
- Key Laboratory of RNA Biology, Institute of Biophysics, Chinese Academy of Sciences, China
Figures
Figure 1
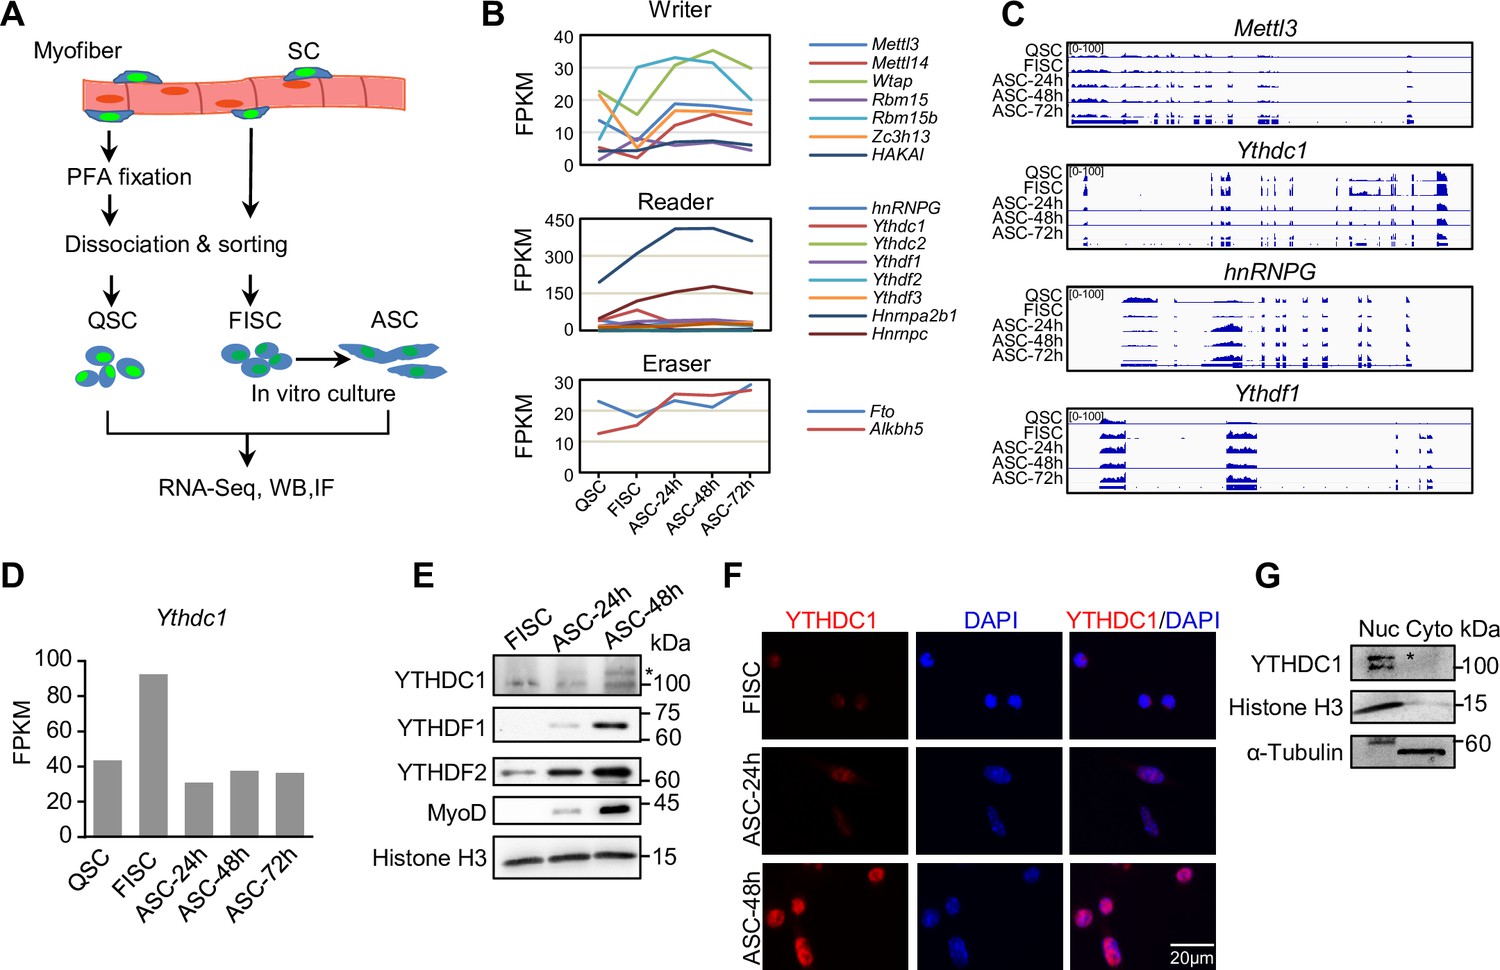
m6A regulators are dynamically expressed during satellite cell (SC) lineage progression and YTHDC1 is induced upon SC activation/proliferation.
(A) Schematic illustration of SC collection from Pax7-nGFP mice. Fixed quiescent SCs (QSC), freshly isolated SCs (FISC), and cultured SCs (ASC) were subject to RNA-seq, western blotting (WB), and Immunofluorescence (IF) analyses. (B) The expression dynamics of m6A writer, reader, and eraser proteins in the above cells from analyzing the RNA-seq data. (C) Representative RNA-seq tracks showing the expression dynamics of the selected m6A regulators. (D) The expression dynamic of Ythdc1 mRNA (FPKM) from RNA-seq. (E) WB showing the induction of YTHDC1, YTHDF1, and YTHDF2 proteins upon SC activation and proliferation. * denotes the correct position of YTHDC1. Histone H3 was used as a loading control. (F) IF staining showing the induction of YTHDC1 protein upon SC activation and proliferation. Scale bar = 20 μm. (G) WB showing the predominant location of YTHDC1 in nuclear portion of C2C12 myoblasts.
-
Figure 1—source data 1
RNA-seq measured expression.
(FPKM) of m6A regulators during satellite cell (SC) lineage progression.
- https://cdn.elifesciences.org/articles/82703/elife-82703-fig1-data1-v2.xlsx
-
Figure 1—source data 2
Uncropped blot images of Figure 1E and G.
- https://cdn.elifesciences.org/articles/82703/elife-82703-fig1-data2-v2.zip
Figure 2 with 1 supplement
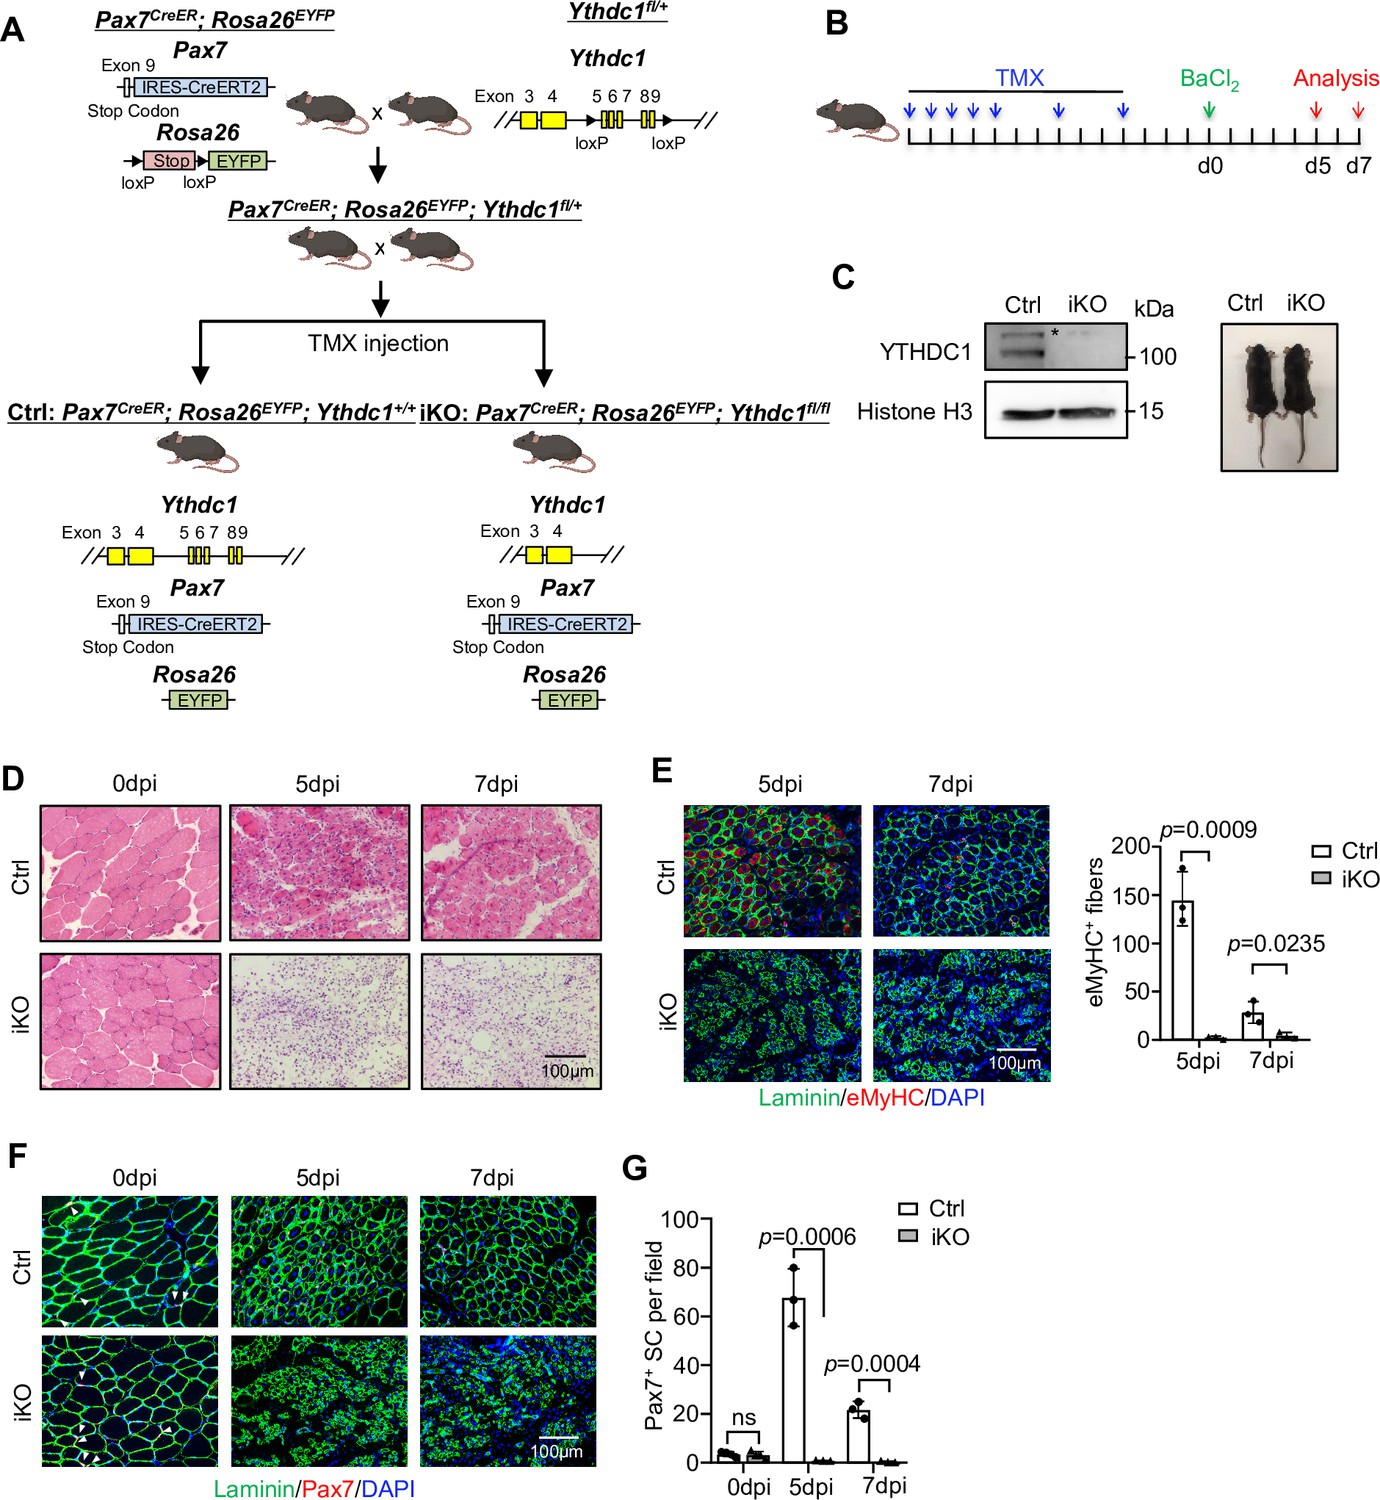
Inducible YTHDC1 deletion in satellite cells (SCs) abolishes acute injury-induced muscle regeneration.
(A) Breeding scheme for generating YTHDC1-inducible knockout (iKO) and control (Ctrl) mice. (B) Schematic outline of the tamoxifen (TMX) administration used in the study and experimental design for testing the effect of YTHDC1 deletion on barium chloride (BaCl2)-induced muscle regeneration process. (C) Left: western blotting (WB) showing the deletion of YTHDC1 in ASC-48 hr from iKO but not Ctrl mice. Right: no obvious morphological difference was detected in iKO vs. Ctrl mice. (D) H&E staining of the above injured muscles at 0, 5, and 7 days post injury (dpi). Scale bar = 100 μm. (E) Left: immunostaining of eMyHC (red) and laminin (green) of the above injured tibialis anterior (TA) muscles at 5 and 7 dpi. Scale bar = 100 μm. Right: quantification of eMyHC-positive fibers per field. n = 3 mice per group. (F) Immunostaining of Pax7 (red) and laminin (green) on TA muscle sections at 0, 5, and 7 dpi. Scale bar = 100 μm. (G) Quantification of Pax7-positive SCs per field at 0, 5, and 7 dpi. n = 4 mice per group for 0 dpi, n = 3 mice per group for 5 and 7 dpi. Bars represent mean ± SD for all graphs. Statistical significance was determined using a two-tailed Student’s t-test.
-
Figure 2—source data 1
Uncropped blot images of Figure 2C.
- https://cdn.elifesciences.org/articles/82703/elife-82703-fig2-data1-v2.zip
Figure 2—figure supplement 1
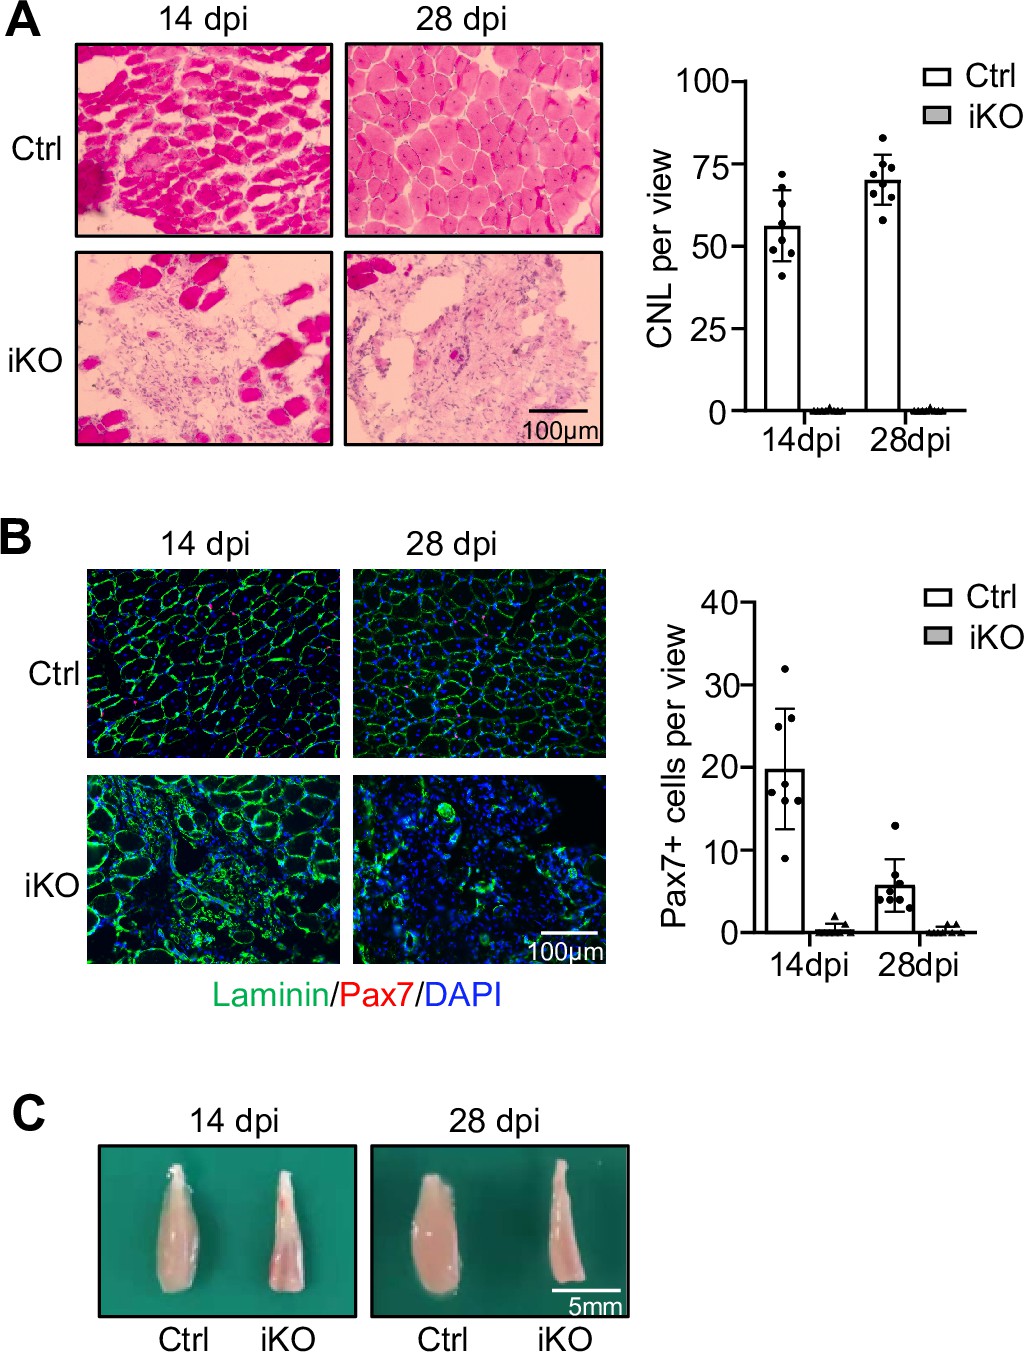
Analyses of regeneration at 14 and 28 days post injury.
(A) Left: H&E staining of tibialis anterior (TA) muscles from Ctrl and YTHDC1-iKO at 14 or 28 day post injection (dpi). Scale bar = 100 μm. Right: quantification of centrally localized nuclei per view. Bars represent mean ± SD of data from eight views. (B) Left: immunofluorescence (IF) staining of Pax7 (red) and laminin (green) of the above muscles. Scale bar = 100 μm. Right: quantification of Pax7+ SCs per view. Bars represent mean ± SD of data from eight views. (C) Images of the above TA muscles.
Figure 3 with 1 supplement
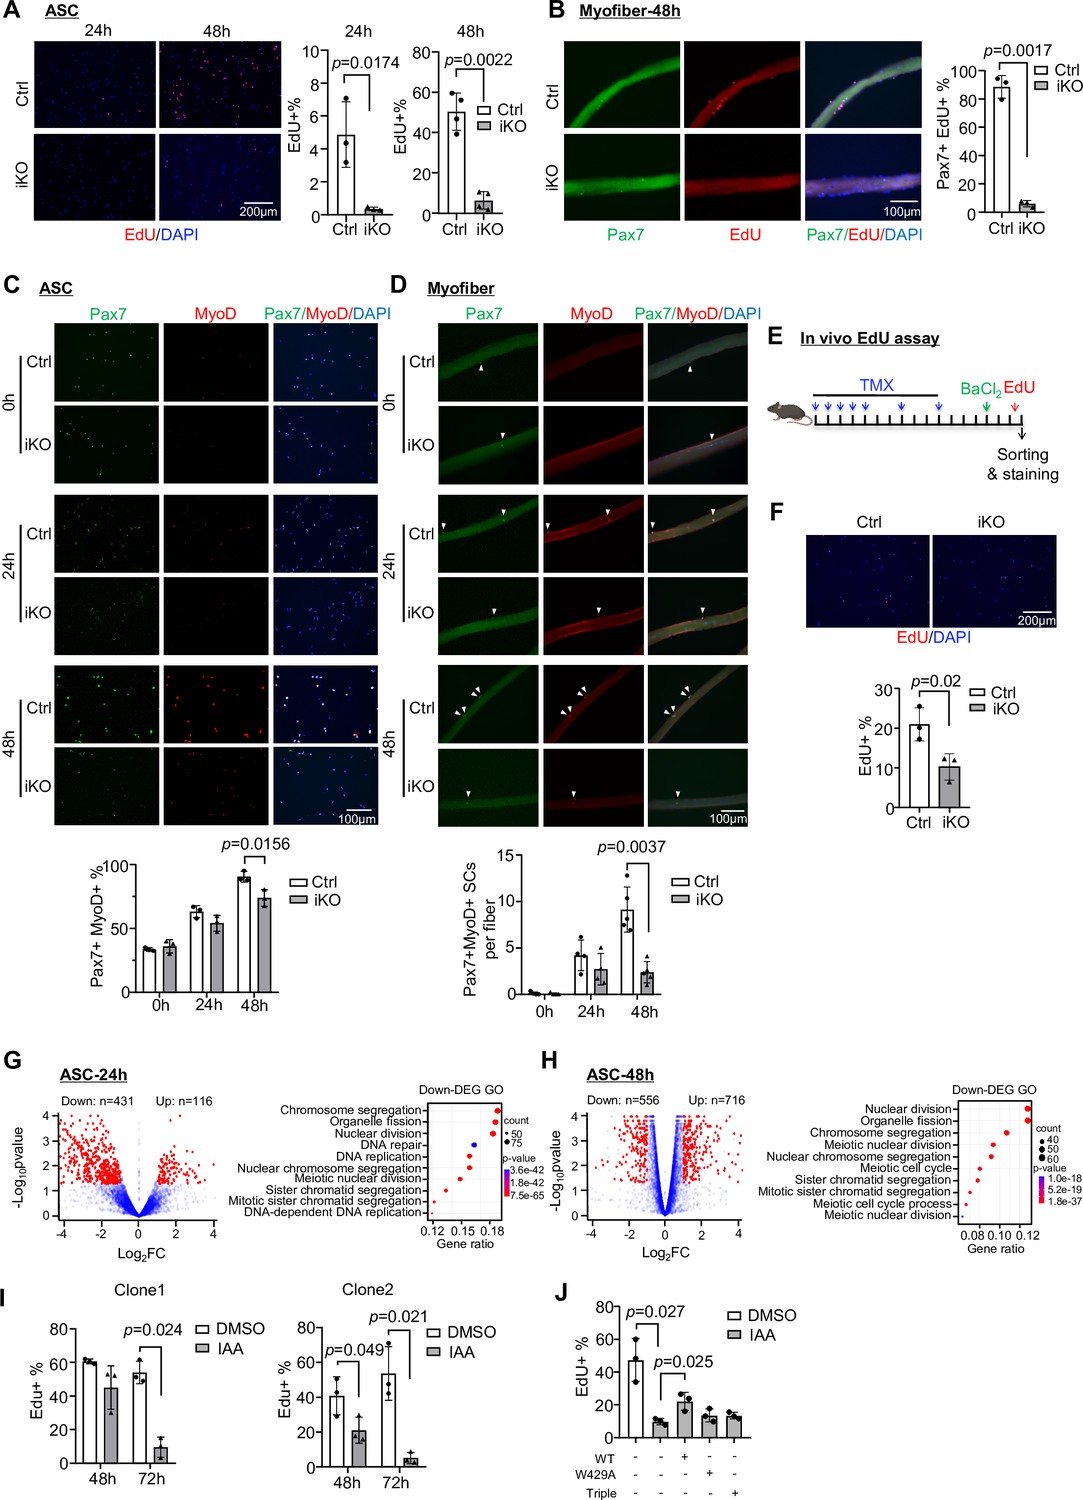
Inducible YTHDC1 knockout impairs satellite cell (SC) activation/proliferation.
(A) Left: EdU (red) staining of ASC-24 hr and ASC-48 hr from inducible knock out (iKO) and Ctrl mice. Scale bar = 200 μm. Right: quantification of the percentage of EdU+ cells. n = 3 mice per group for ASC-24 hr, n = 4 mice per group for ASC-48 hr. (B) Left: EdU (red) staining of EDL myofibers isolated from Ctrl or iKO mice and cultured for 48 hr. Scale bar = 100 μm. Right: quantification of the percentage of Pax7+ EdU+ SCs. n = 3 mice per group. (C) Top: immunofluorescence (IF) staining of Pax7 (green) and MyoD (red) of freshly isolated SCs (FISC) (0 hr), ASC-24 hr and ASC-48 hr from Ctrl and iKO mice. Scale bar = 100 μm. Bottom: quantification of the percentage of Pax7+ MyoD+ cells. n = 3 mice per group. (D) Top: IF staining of Pax7 (green) and MyoD (red) on EDL myofibers at 0 hr (freshly isolated), 24 hr, and 48 hr. Scale bar = 100 μm. Bottom: quantification of the number of Pax7+ MyoD+ cells per fiber (n = 4 mice per group for 0 and 24 hr, n = 5 mice per group for 48 hr). (E) Schematic illustration of in vivo EdU assay in Ctrl and iKO mice. (F) Top: EdU staining of the above freshly isolated and fixed SCs at 3 dpi. Scale bar = 200 μm. Bottom: quantification of the percentage of EdU+ cells in iKO vs. Ctrl. n = 3 mice per group. (G, H) Left: RNA-seq was performed in ASC-24 hr or -48 hr from iKO and Ctrl mice. Volcano plot showing the down- and upregulated genes in iKO vs. Ctrl. Right: GO analysis for the downregulated genes. (I) Two independent mAID-YTHDC1 cell lines were treated with DMSO or 5-Ph-IAA (IAA) for the indicated time. EdU assay was performed and the percentage of EdU+ cells was quantified at the designated time points. n = 3 replicates. (J) WT-YTHDC1, or a single (W429A), or a triple (K362A, S363A, and N364A) mutant of YTHDC1 lacking m6A binding ability was transfected with the mAID-YTHDC1 cells then treated with IAA. mAID-YTHDC1 cells treated with DMSO or IAA were used as control. EdU assay was then performed and the percentage of EdU+ cells was quantified. n = 3 replicates. Bars represent mean ± SD for all graphs. Statistical significance was determined using a two-tailed Student’s t-test.
Figure 3—figure supplement 1
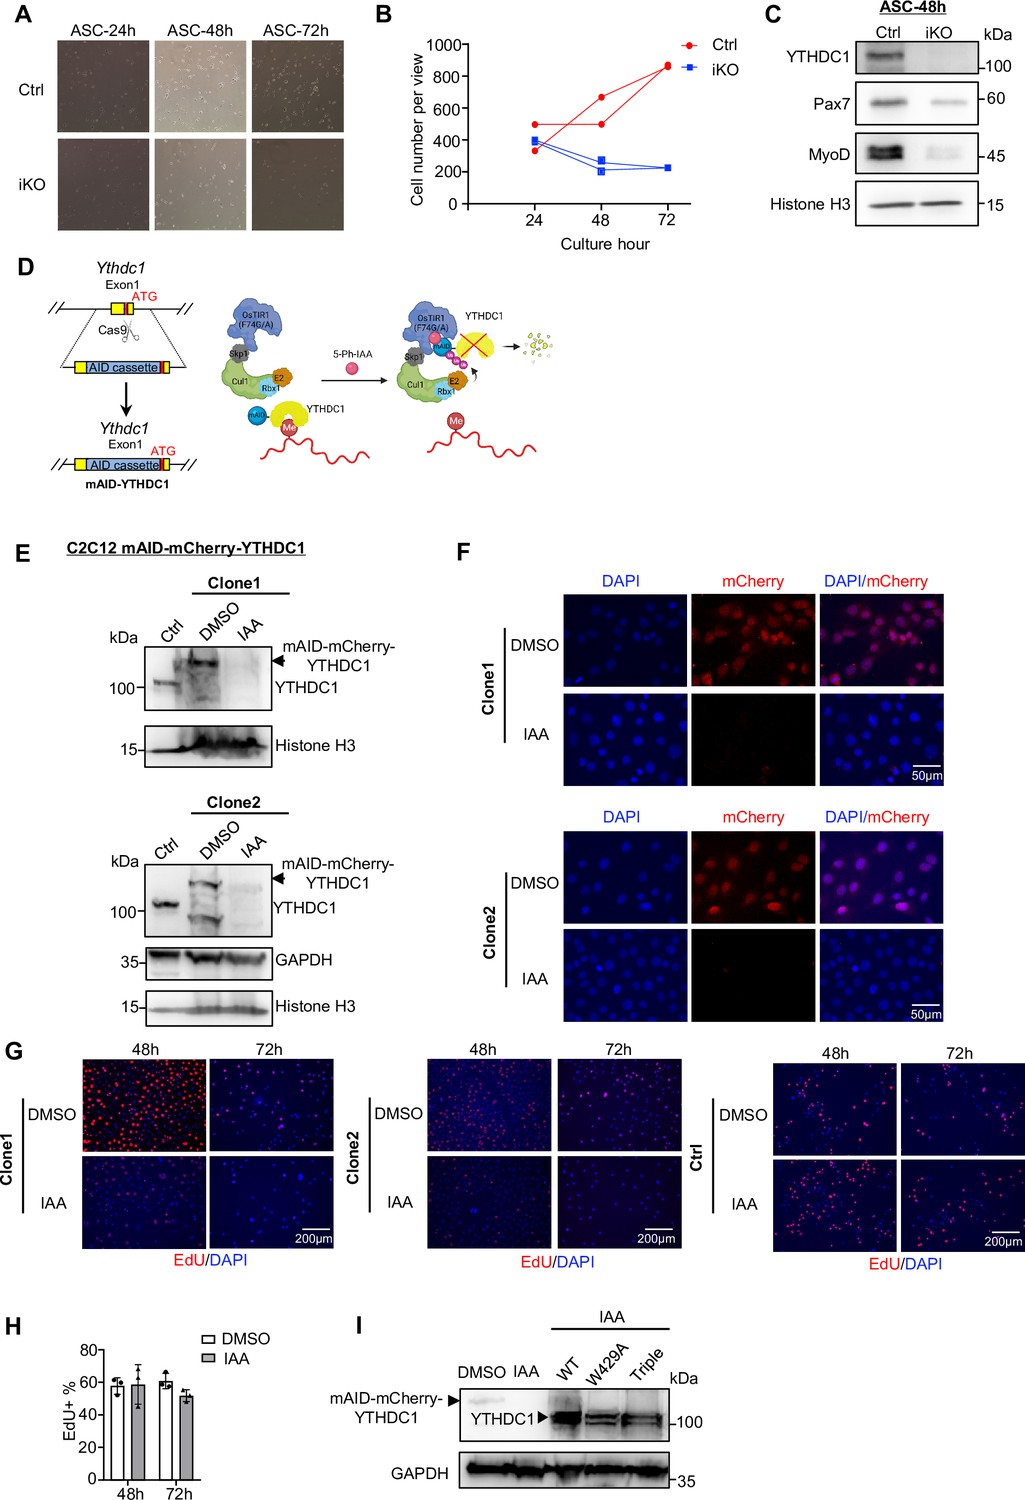
Analyses of activation/proliferation defect of satellite cells (SCs) and C2C12 myoblasts upon YTHDC1 loss.
(A) ASCs from Ctrl or inducible knock out (iKO) were cultured for 24, 48, and 72 hr and light microscopy images are shown. (B) Quantification of cells per view at the above time points. n = 2 mice per group. (C) Western blotting showing the expression of YTHDC1, Pax7, and MyoD in ASC-48 hr from Ctrl and iKO. Histone H3 was used as a loading control. (D) Schematic illustration of generating a C2C12 cell line with inducible YTHDC1 degradation using the auxin-inducible degron (AID2) system. (E) Western blotting showing the degradation of YTHDC1 after treating mAID-YTHDC1 clone 1 or 2 with 1 μM 5-Ph-IAA (IAA) for 8 hr. DMSO treatment was used as a control. (F) The above YTHDC1 degradation was confirmed by examining the mCherry signal after treating the cell with 1 μM IAA or DMSO for 24 hr. (G) EdU staining of clone1, clone2, and control cells treated with DMSO or IAA for the designated time points to show the reduced cell proliferation upon YTHDC1 degradation. (H) C2C12 expressing Ostir1 (no AID knock-in) was used as control (Ctrl) to show that IAA small molecule does not affect cell proliferation. Quantification of Edu +percentage of C2C12 (without AID knock-in) treated with DMSO or IAA for the designated time. Bars represent mean ± SD for three views. (I) Western blots showing the degradation of endogenous AID-YTHDC1 and overexpression of WT-YTHDC1, m6A binding mutants of YTHDC1 (W429A, triple mutant). GAPDH was used as the loading control.
-
Figure 3—figure supplement 1—source data 1
Uncropped blot images of Figure 3—figure supplement 1C,E, and I.
- https://cdn.elifesciences.org/articles/82703/elife-82703-fig3-figsupp1-data1-v2.zip
Figure 4 with 1 supplement
LACE-seq defines transcriptome-wide YTHDC1 binding profiles in myoblasts.
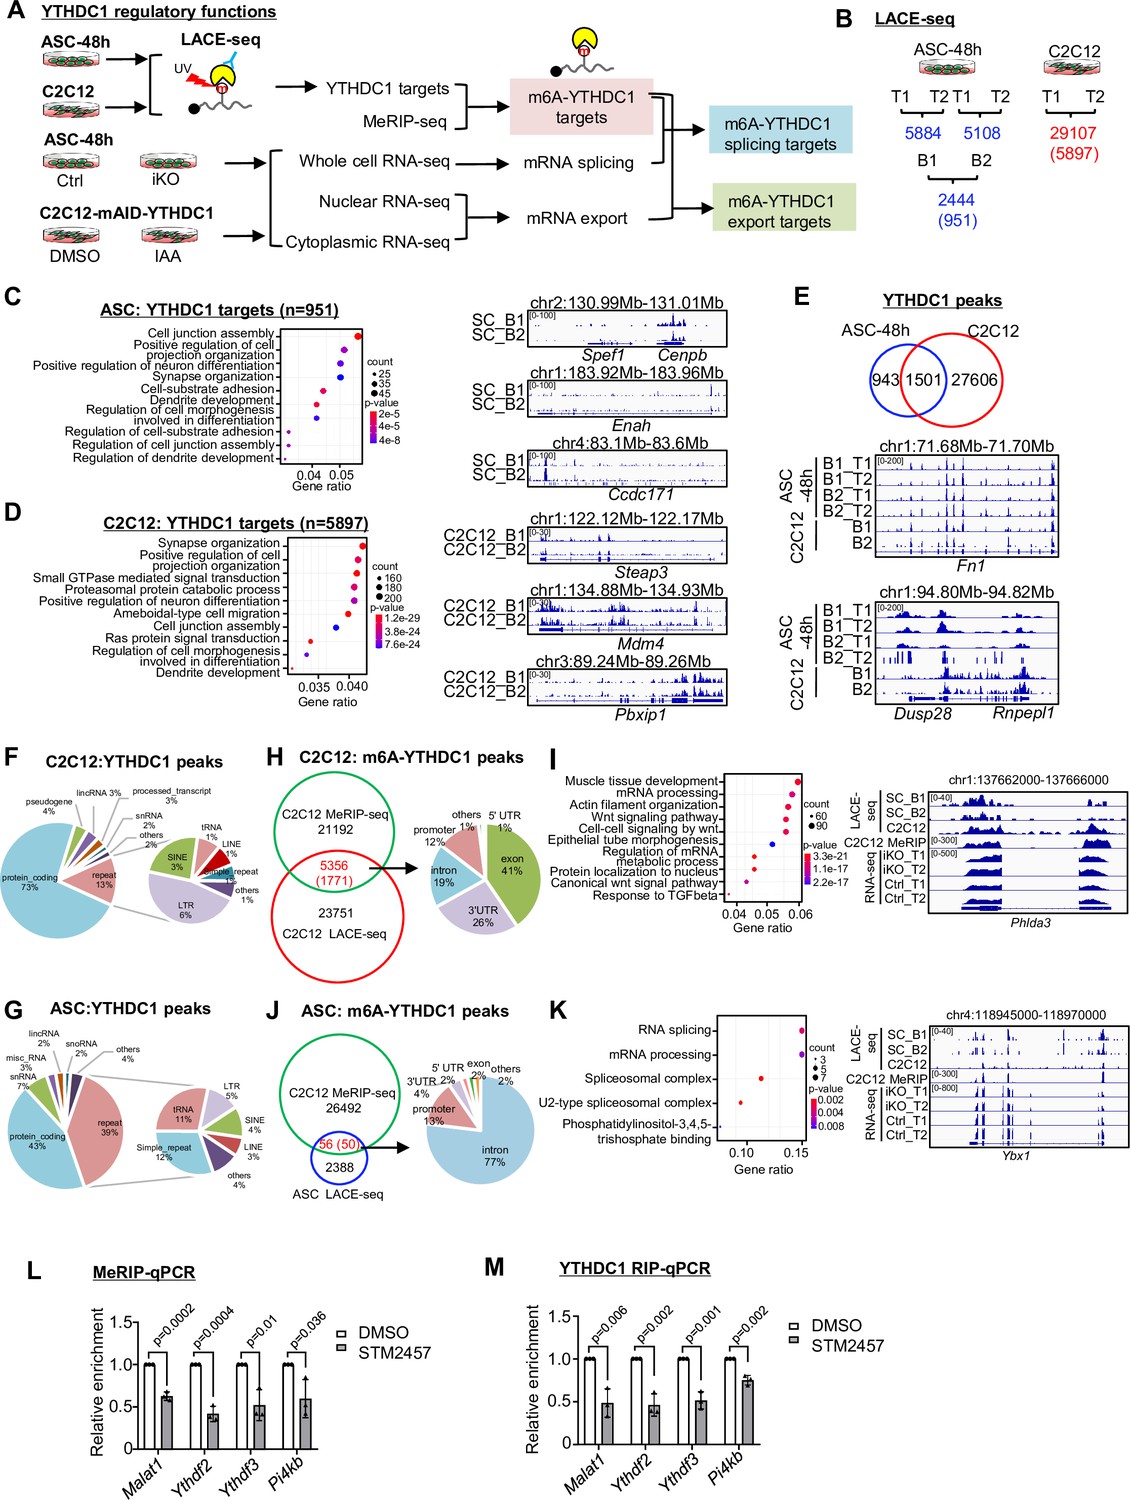
(A) Schematic illustration of the experimental design for performing LACE-seq and subsequent combination with MeRIP-seq, bulk RNA-seq, subcellular RNA-seq for defining and elucidating YTHDC1 splicing/export targets and post-transcriptional regulation. (B) LACE-seq was performed in both ASC-48 hr and C2C12 myoblasts and the number of identified peaks in each technical (T) or biological replicate (B) and the shared number of peaks (genes) between the replicates are shown. (C) Left: Go analysis for the identified YTHDC1 targets in ASCs. Right: genome tracks for three selected genes. (D) Left: Go analysis for the identified YTHDC1 targets in C2C12. Right: genome tracks for three selected genes. (E) Top: overlapping between the above-identified C2C12 and ASC peaks. Bottom: genome tracks for two selected genes. (F, G) Left: the genome distribution of YTHDC1 binding peaks in C2C12 or ASC. Right: detailed distribution of the YTHDC1 binding peaks on repeat regions. (H) Left: integrating C2C12 MeRIP-seq data with the C2C12 LACE-seq identified 5356 regions (1771 mRNAs, as m6A-YTHDC1 targets). Right: distribution of YTHDC1 binding on the above targets. (I) Left: GO analysis of the above 1771 targets. Right: genomic tracks of a selected target, Phlda3. (J) Left: integrating the C2C12 MeRIP-seq data with the ASC LACE-seq identified 56 regions (50 mRNAs, as m6A-YTHDC1 targets). Right: distribution of YTHDC1 binding on the above-identified target mRNAs. (K) Left: GO analysis of the above 50 targets. Right: genomic tracks of a selected target, Ybx1. (L) C2C12 cells were treated with DMSO or STM2457. m6A modification levels on m6A-YTHDC1 targets were examined by MeRIP-qPCR. Relative enrichment was calculated by comparing the MeRIP/input ratio of DMSO and STM2457. n = 3 biological replicates. (M) C2C12 cells were transfected with pRK5-flag-YTHDC1 and then treated with DMSO or STM2457. YTHDC1 binding to m6A-YTHDC1 targets was examined by RIP-qPCR. Relative enrichment was calculated by comparing the RIP/input ratio of DMSO and STM2457. n = 3 biological replicates. Bars represent mean ± SD for all graphs. Statistical significance was determined using a two-tailed Student’s t-test.
Figure 4—figure supplement 1
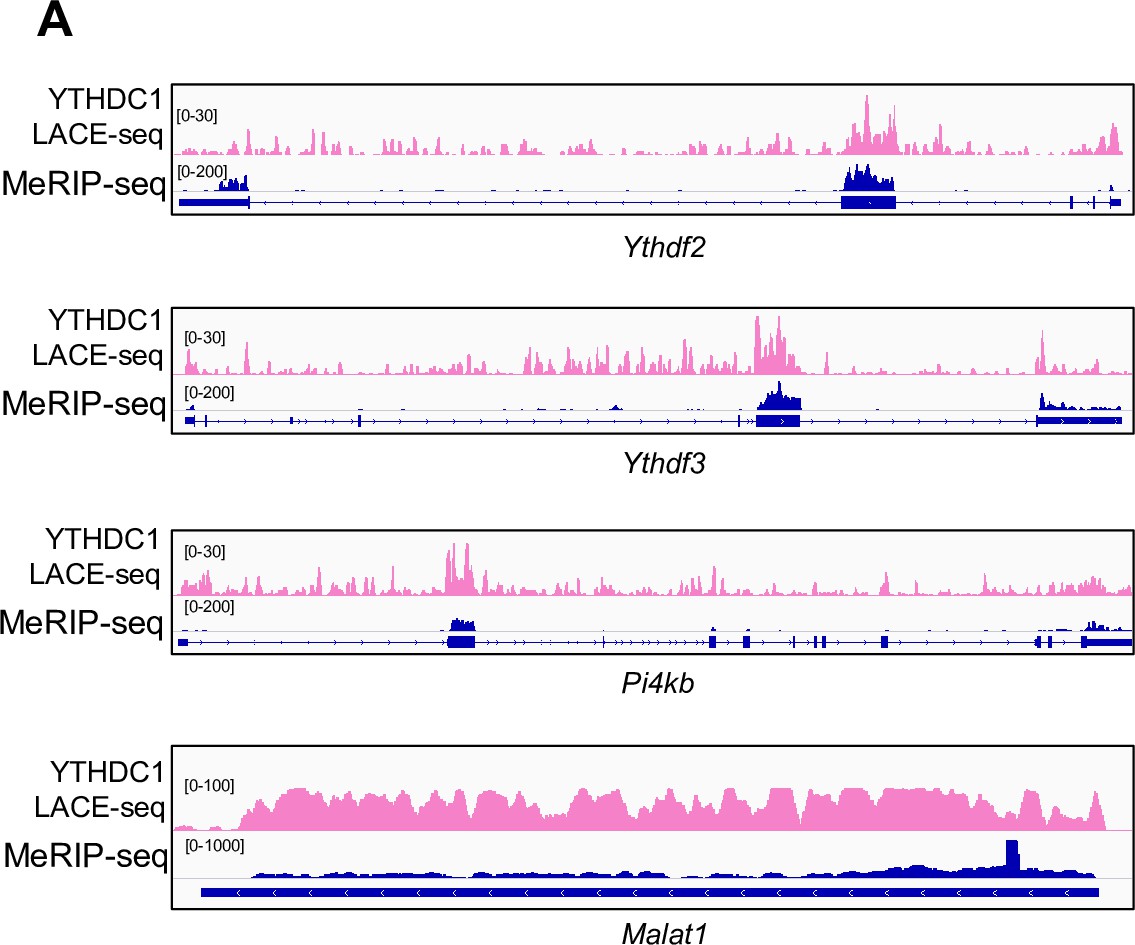
Genome tracks of selected m6A-YTHDC1 targets.
Figure 5 with 1 supplement
YTHDC1 depletion in ASCs leads to altered splicing events.
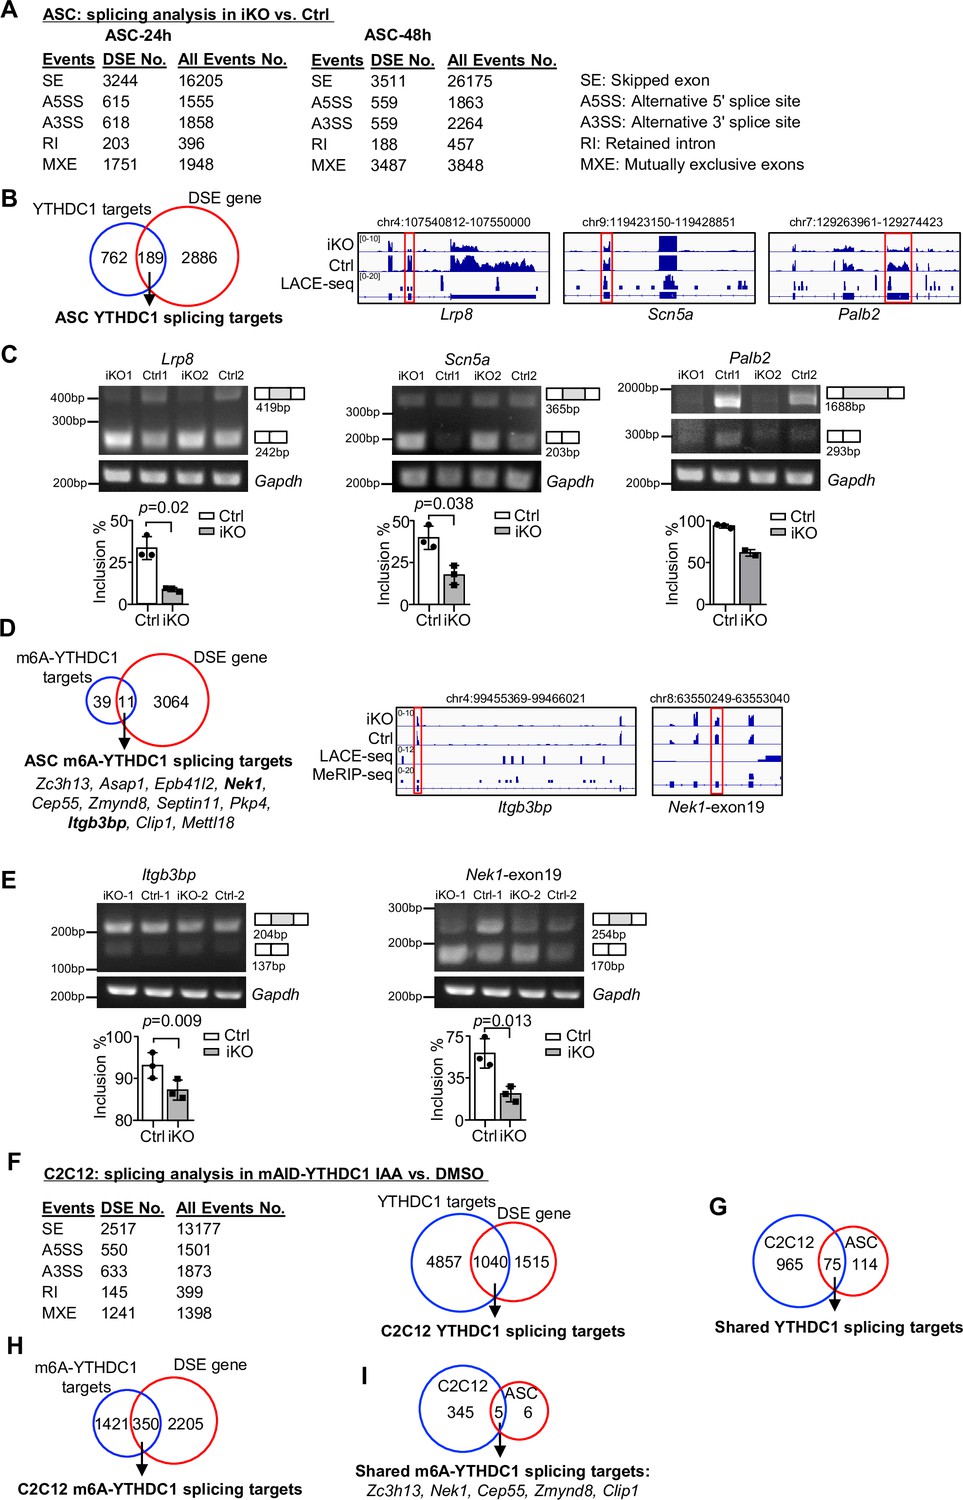
(A) Splicing analysis based on bulk RNA-seq data from ASC-24 hr or -48 hr defined five types of splicing events. The total number of each event in Ctrl, and the differential spliced events (DSE) in inducible knock out (iKO) vs. Ctrl are shown. (B) Left: combining the above ASC-48 hr DSEs with the ASC LACE-seq targets identified a total of 189 YTHDC1 splicing target mRNAs. Right: genome tracks of three selected targets. (C) Top: RT-PCR assay was performed in ASC-48 hr from YTHDC1-iKO and Ctrl to verify altered splicing of the three selected target mRNAs, Palb2, Lrp8, and Scn5a. Gapdh was used as a control. Bottom: quantification of exon inclusion level. Exon inclusion level was defined as the percentage of transcripts that includes the specific exon. Included/(included + skipped). n = 3 mice per group for Lrp8 and Scn5a. (D) Left: combining the above ASC-48 hr DSE with m6A-YTHDC1 targets uncovered 11 m6A-YTHDC1 splicing targets. Right: genome tracks of two selected targets. (E) Top: RT-PCR assay was performed in ASC-48 from YTHDC1-iKO and Ctrl to verify altered splicing of the two selected target mRNA, Itgb3bp, and Nek1. Gapdh was used as a control. Bottom: quantification of exon inclusion level. n = 3 mice per group. (F) Left: splicing analysis based on bulk RNA-seq data from C2C12-mAID-YTHDC1 cells with or without YTHDC1 degradation. Right: combining the above C2C12 DSEs with the C2C12 LACE-seq targets identified a total of 1040 YTHDC1 splicing target mRNAs. (G) Overlapping between the above-identified YTHDC1 splicing targets in ASC-48 hr and C2C12. (H) Combining the above C2C12 DSEs with m6A-YTHDC1 targets uncovered 350 m6A-YTHDC1 splicing targets. (I) Overlapping of m6A-YTHDC1 splicing targets in C2C12 and ASC-48 hr. Bars represent mean ± SD for all graphs. Statistical significance was determined using a two-tailed Student’s t-test.
-
Figure 5—source data 1
Uncropped gel images of Figure 5C.
- https://cdn.elifesciences.org/articles/82703/elife-82703-fig5-data1-v2.zip
-
Figure 5—source data 2
Uncropped gel images of Figure 5E.
- https://cdn.elifesciences.org/articles/82703/elife-82703-fig5-data2-v2.zip
Figure 5—figure supplement 1
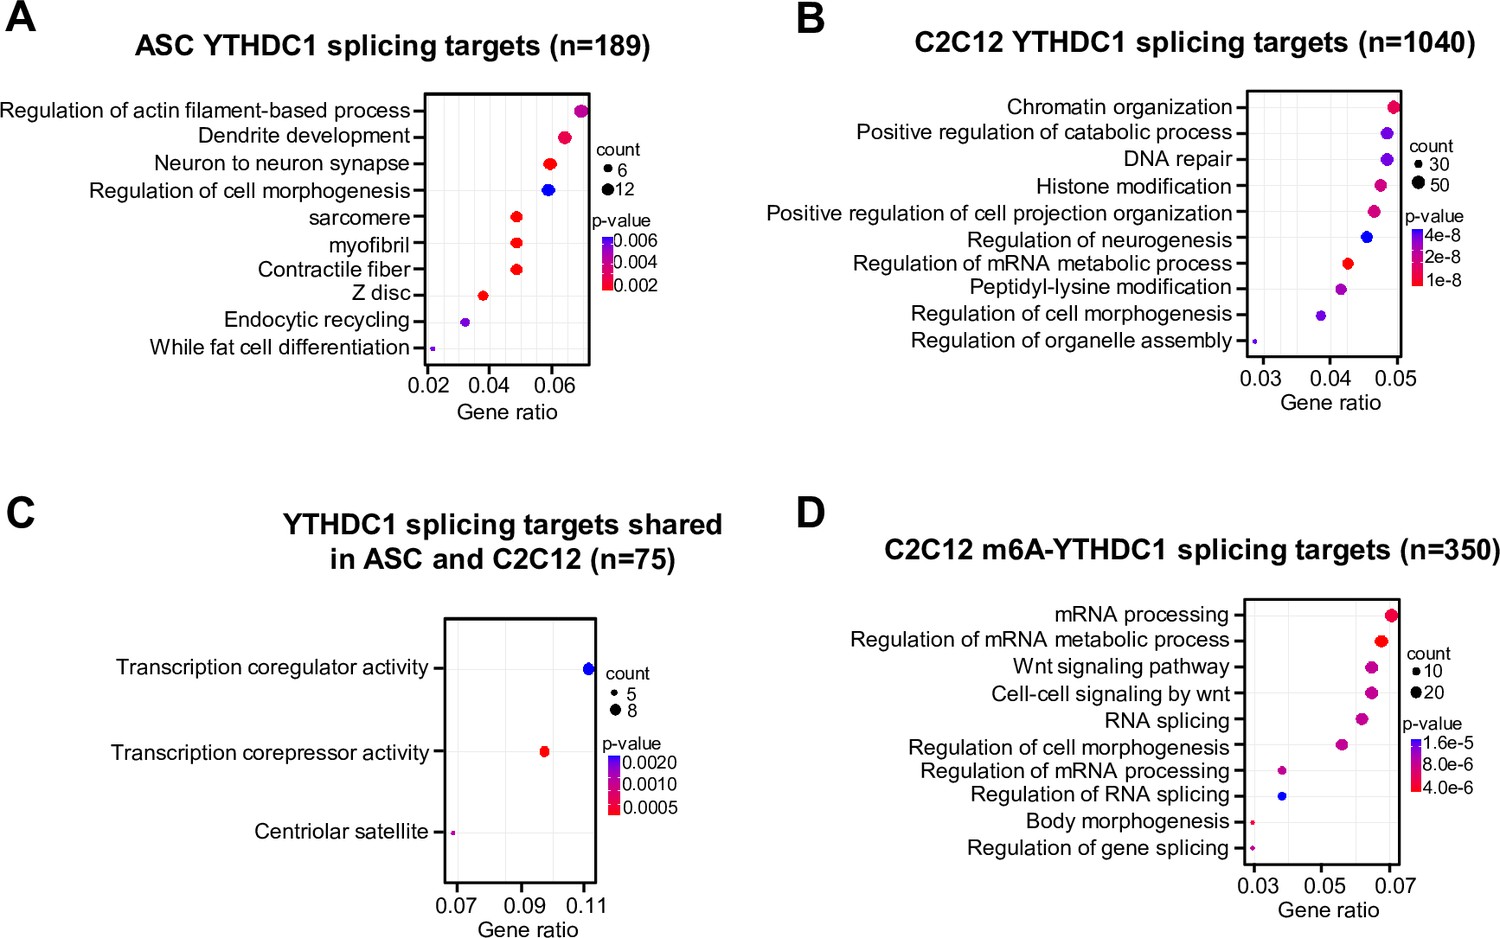
GO analysis of YTHDC1 splicing targets in ASCs and C2C12.
(A) GO analysis of YTHDC1 splicing targets in ASC. (B) GO analysis of YTHDC1 splicing targets in C2C12 myoblasts. (C) GO analysis of shared YTHDC1 splicing targets in ASC and C2C12. (D) GO analysis of m6a-YTHDC1 splicing targets in C2C12.
Figure 6 with 1 supplement
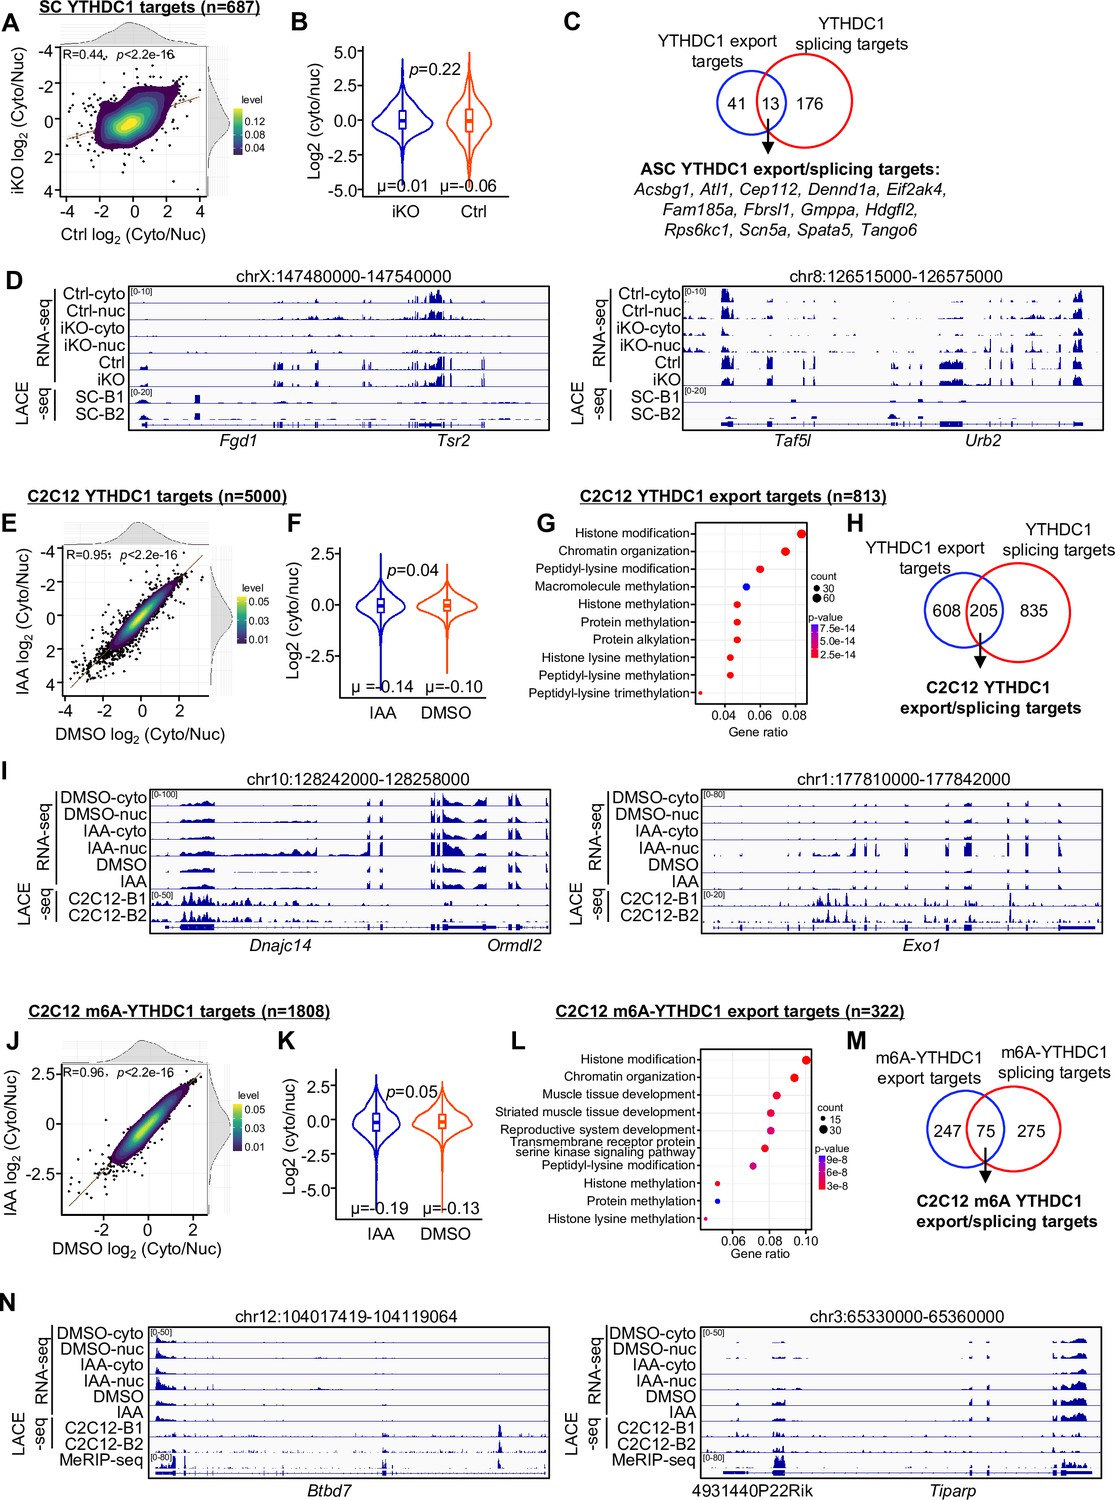
YTHDC1 loss inhibits mRNA nuclear export.
(A) Subcellular RNA-seq was performed using cytoplasmic and nuclear fractions isolated from ASC-48 hr of Ctrl and YTHDC1 inducible knock out (iKO) mice. The log2(cyto/nuc) expression change was calculated for YTHDC1 targets. On the top and right, the density plot of log2(cyto/nuc) expression changes is depicted. (B) Quantification of log2(cyto/nuc) expression changes in iKO vs. Ctrl. (C) Overlapping between YTHDC1 mRNA export targets and splicing targets in ASCs. (D) Genome tracks of two selected export targets. (E–I) The above assay/analysis was performed in DMSO or IAA-treated mAID-YTHDC1 C2C12 myoblasts to identify YTHDC1 regulated export targets in C2C12. (J–N) The above analyses were conducted using m6A-YTHDC1 targets to identify m6A-YTHDC1 mRNA export targets in C2C12.
Figure 6—figure supplement 1
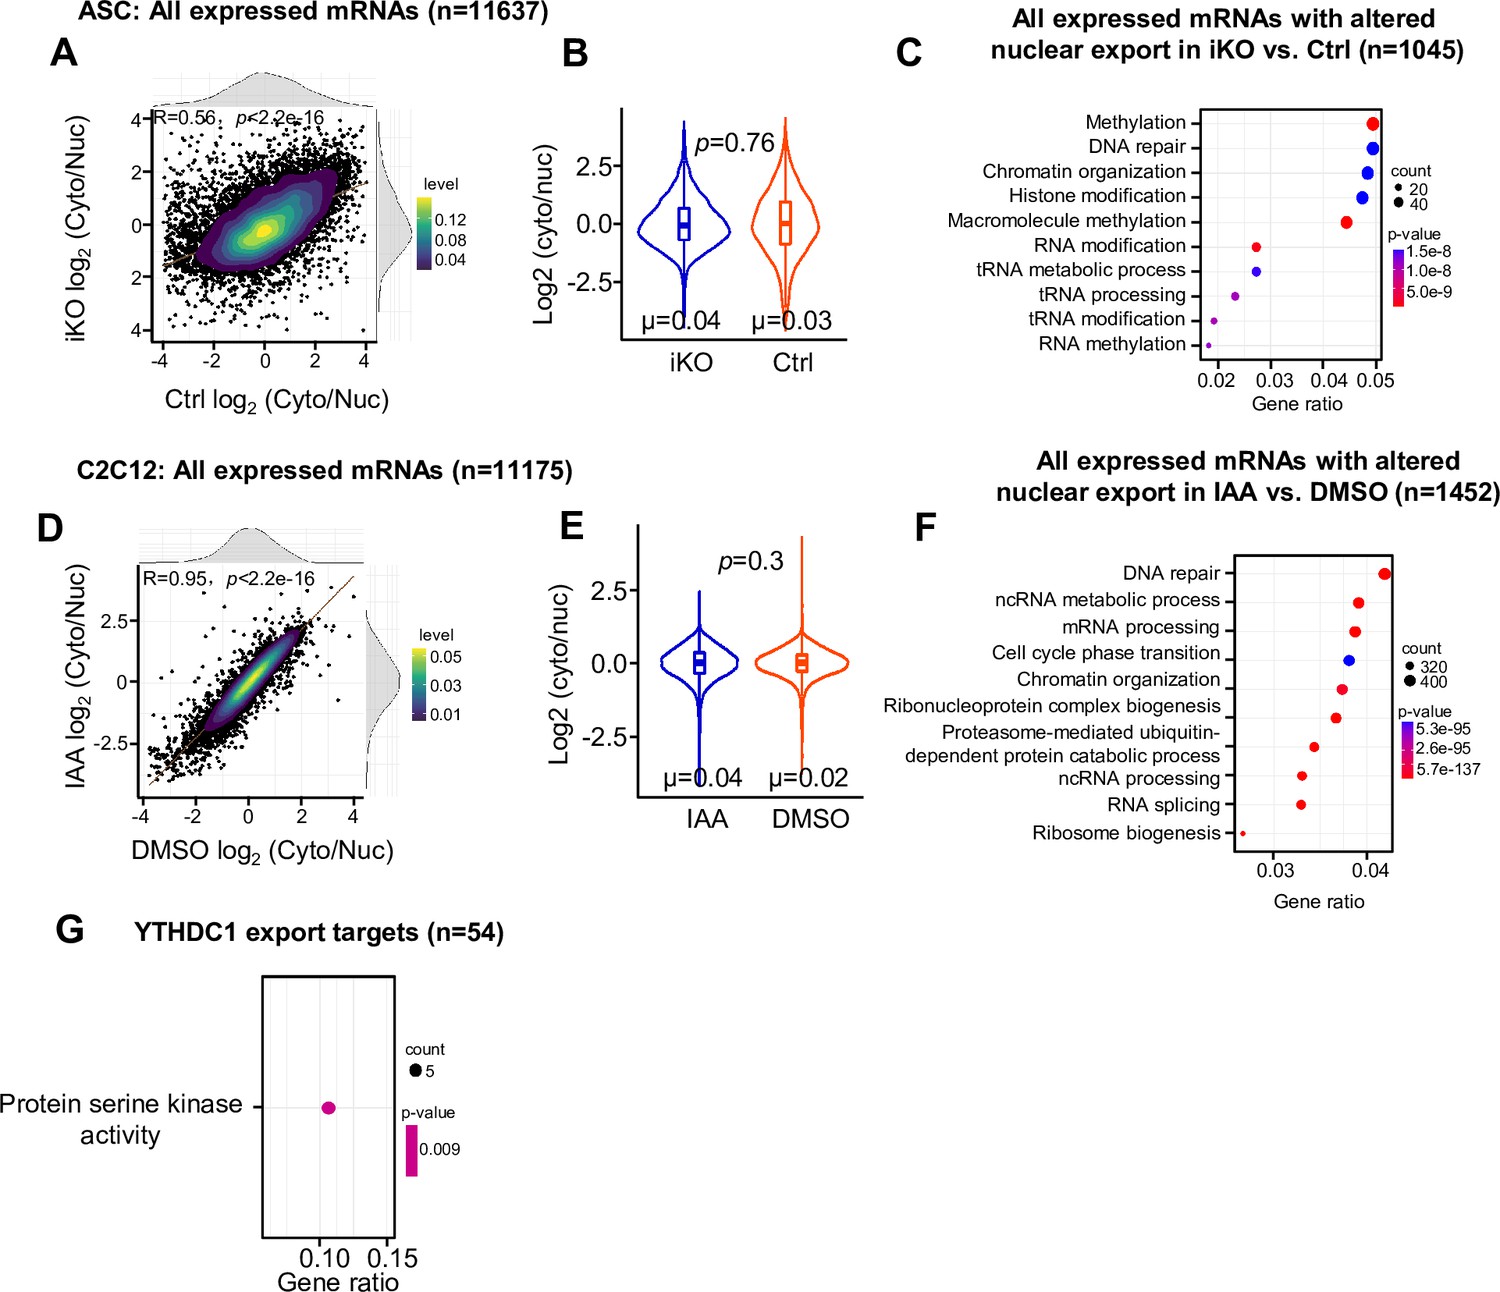
Analyses of nuclear export of all mRNAs and GO enrichment of mRNAs with decreased export.
(A) Subcellular RNA-seq was performed using cytosolic and nuclear fractions isolated from ASC-48 hr of Ctrl and YTHDC1 inducible knock out (iKO). The log2(cyto/nuc) expression change was calculated for all expressed mRNAs. On the top and right, the density plot of log2(cyto/nuc) expression changes is depicted. (B) Quantification of log2(cyto/nuc) changes for the above mRNAs in iKO vs. Ctrl. in iKO vs. Ctrl. (C) GO analysis for the above mRNAs. (D) The above assay/analysis was performed in DMSO or IAA-treated mAID-YTHDC1 C2C12 myoblasts. The log2(cyto/nuc) expression change was calculated for all expressed mRNAs. On the top and right, the density plot of log2(cyto/nuc) expression changes is depicted. (E) Quantification of log2(cyto/nuc) change of the above mRNAs upon YTHDC1 degradation. (F) GO analysis for the above mRNAs. (G) GO analysis of YTHDC1 export targets in ASC.
Figure 7
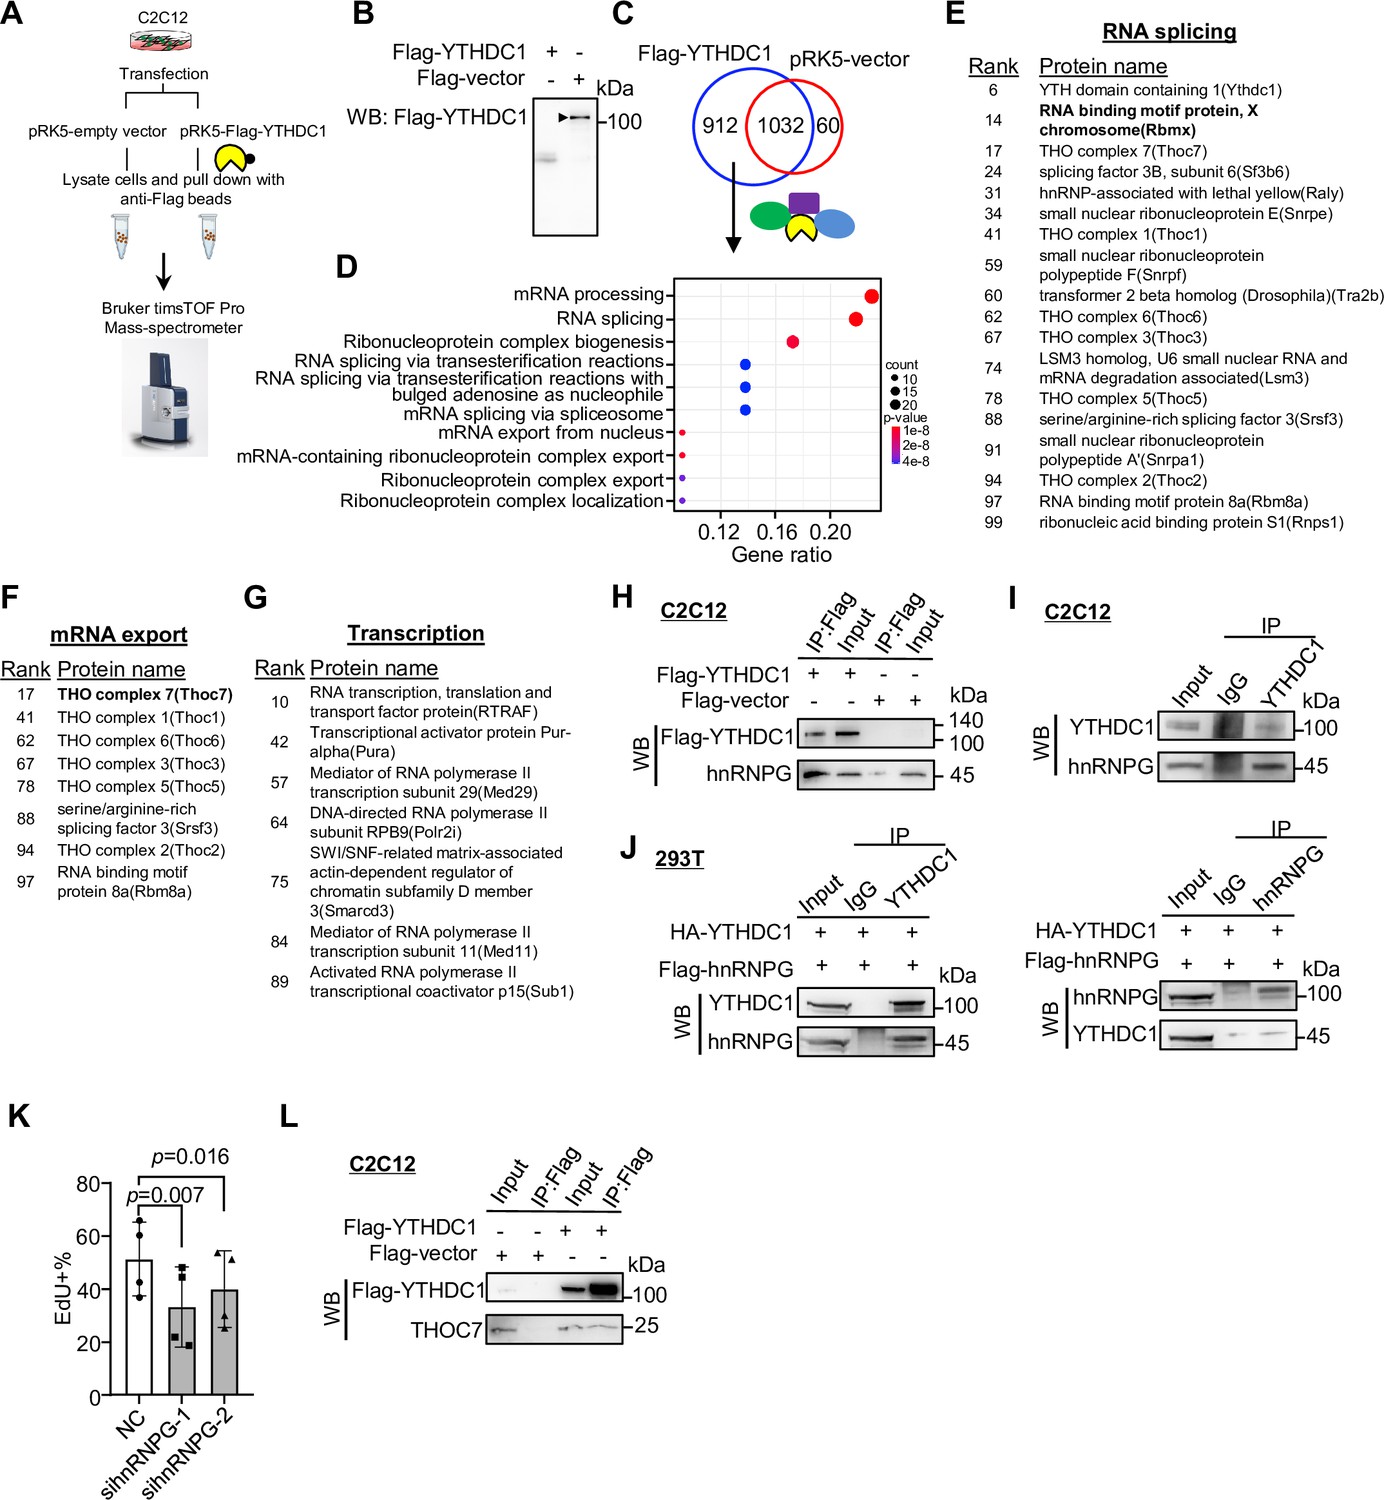
Co-immunoprecipitation/mass spectrometry (co-IP/MS) leads to the identification of YTHDC1 interacting partners.
(A, B) Schematic illustration of the co-IP/MS procedure. An empty vector or Flag-tagged YTHDC1 plasmid was expressed in C2C12 myoblasts followed by pull-down with Flag beads; the retrieved proteins were subject to MS with Bruker timsTOF Pro. (B) Overexpression of the Flag-tagged YTHDC1 was confirmed by western blotting (WB) using anti-Flag antibody. (C) 912 proteins were uniquely retrieved in YTHDC1 but not Vector-expressing cells. (D) GO functions of the above proteins are shown. (E–G) The above-identified interacting proteins with RNA splicing, mRNA export, or potential transcriptional regulatory functions are shown in the lists. (H) Flag-tagged YTHDC1 was overexpressed in C2C12 and Flag-beads-based IP was performed followed by WB to verify the retrieved hnRNPG protein. (I) IP of endogenous YTHDC1 protein in C2C12 myoblasts followed by WB to examine retrieved hnRNPG protein. (J) Flag-hnRNPG and HA-YTHDC were overexpressed in 293T cells; IP with YTHDC1 or hnRNPG protein flowed by WB to confirm the interaction between the two proteins. (K) Freshly isolated satellite cells (FISCs) were transfected with scramble or hnRNPG siRNA-1 or -2, and EdU assays were performed in ASC-48 hr. EdU+ cells were quantified. n = 4 replicates. Bars represent mean ± SD for all graphs. Statistical significance was determined using a two-tailed paired Student’s t-test. (L) Flag-tagged YTHDC1 was overexpressed in C2C12 and Flag beads-based IP was performed followed by WB to verify the interaction between YTHDC1 and THOC7.
-
Figure 7—source data 1
Uncropped blot images of Figure 7B and H.
- https://cdn.elifesciences.org/articles/82703/elife-82703-fig7-data1-v2.zip
-
Figure 7—source data 2
Uncropped blot images of Figure 7I and J.
- https://cdn.elifesciences.org/articles/82703/elife-82703-fig7-data2-v2.zip
-
Figure 7—source data 3
Uncropped blot images of Figure 7L.
- https://cdn.elifesciences.org/articles/82703/elife-82703-fig7-data3-v2.zip
Figure 8
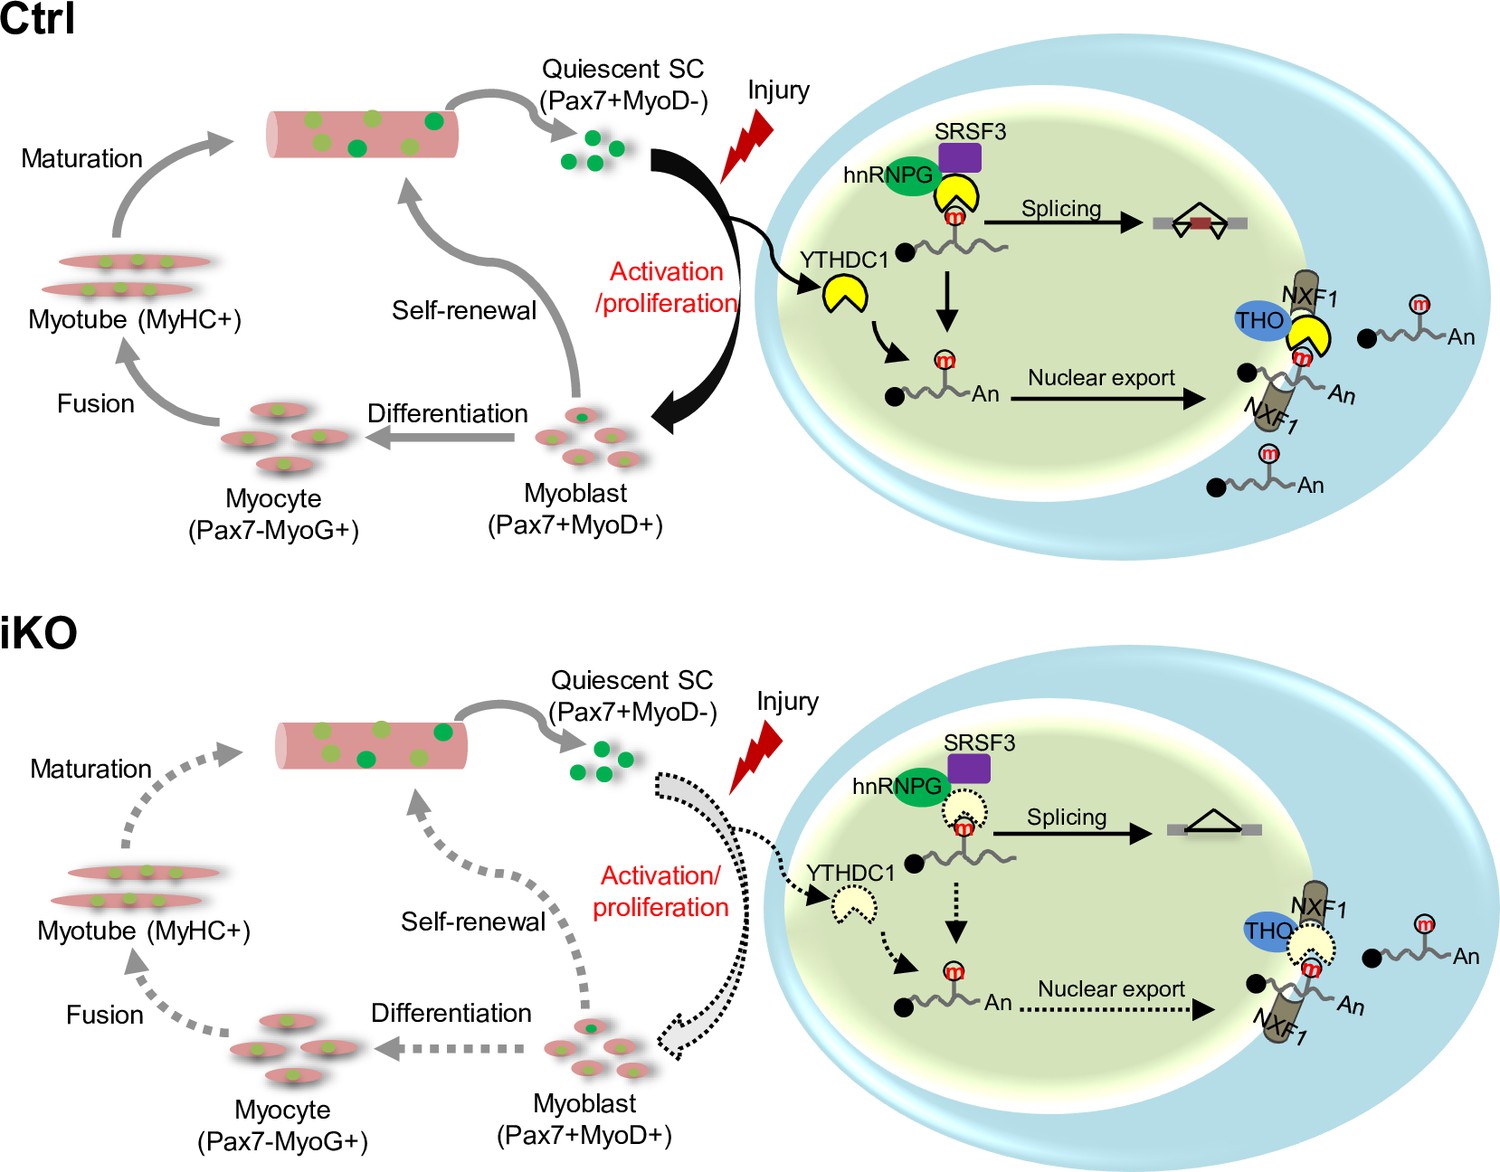
A working model of YTHDC1 function in satellite cells (SCs).
YTHDC1 is induced upon SC activation and proliferation to promote SC activation and proliferation upon acute injury-induced muscle regeneration. Mechanistically, it functions through both facilitating mRNA splicing synergistically with hnRNPG and promoting mRNA export possibly by binding with the THO nuclear export complex.
Additional files
-
Supplementary file 1
Transcriptomic changes upon YTHDC1 inducible knock out (iKO) in ASC.
- https://cdn.elifesciences.org/articles/82703/elife-82703-supp1-v2.xlsx
-
Supplementary file 2
LACE-seq profiling of YTHDC1 binding in ASC and C2C12 myoblasts.
- https://cdn.elifesciences.org/articles/82703/elife-82703-supp2-v2.xlsx
-
Supplementary file 3
Analysis of YTHDC1 splicing regulation in ASC and C2C12.
- https://cdn.elifesciences.org/articles/82703/elife-82703-supp3-v2.xlsx
-
Supplementary file 4
Analysis of YTHDC1 mRNA nuclear export in ASC and C2C12 myoblasts.
- https://cdn.elifesciences.org/articles/82703/elife-82703-supp4-v2.xlsx
-
Supplementary file 5
Co-immunoprecipitation/mass spectrometry (co-IP/MS) identifies YTHDC1 interacting proteins in C2C12 myoblasts.
- https://cdn.elifesciences.org/articles/82703/elife-82703-supp5-v2.xlsx
-
Supplementary file 6
Sequences of oligos used in the study.
- https://cdn.elifesciences.org/articles/82703/elife-82703-supp6-v2.xlsx
-
MDAR checklist
- https://cdn.elifesciences.org/articles/82703/elife-82703-mdarchecklist1-v2.docx
Download links
A two-part list of links to download the article, or parts of the article, in various formats.
Downloads (link to download the article as PDF)
Open citations (links to open the citations from this article in various online reference manager services)
Cite this article (links to download the citations from this article in formats compatible with various reference manager tools)
Nuclear m6A reader YTHDC1 promotes muscle stem cell activation/proliferation by regulating mRNA splicing and nuclear export
eLife 12:e82703.
https://doi.org/10.7554/eLife.82703


