Nucleus accumbens dopamine tracks aversive stimulus duration and prediction but not value or prediction error
- Netherlands Institute for Neuroscience, Royal Netherlands Academy of Arts and Sciences, Netherlands
- Department of Psychiatry, Amsterdam UMC, University of Amsterdam, Netherlands
Figures
Figure 1
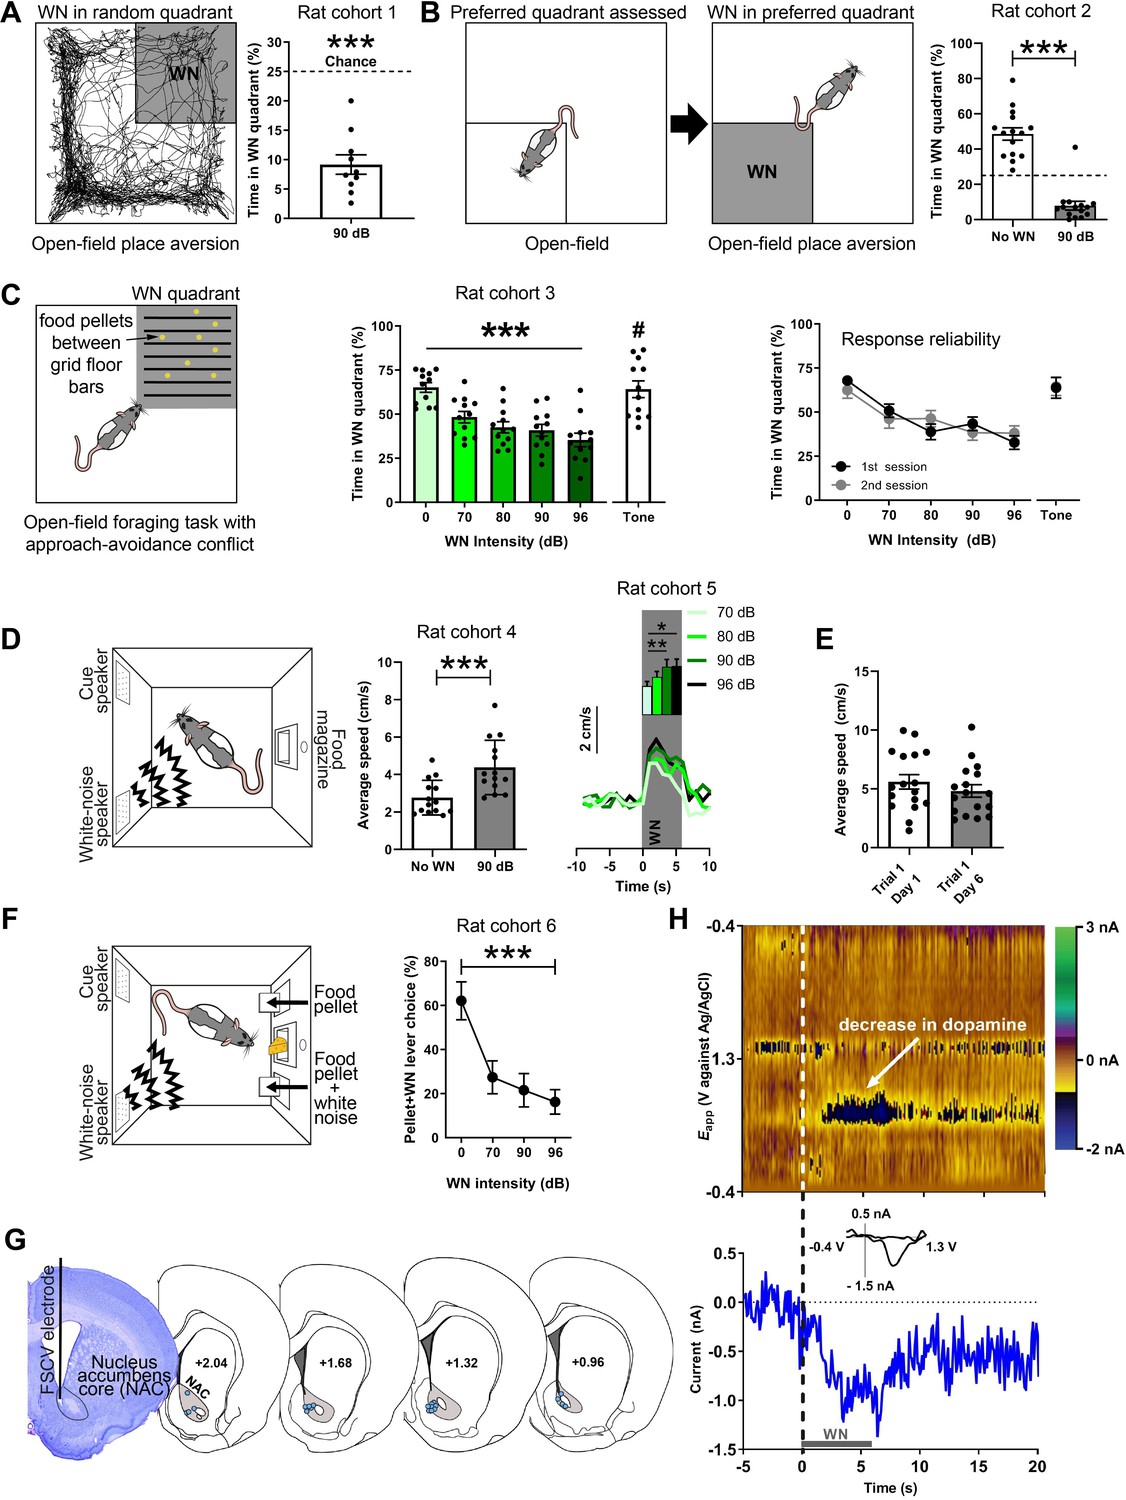
White noise (WN) is an aversive stimulus that lowers dopamine concentration in the nucleus accumbens core (NAC).
(A) Left: example trajectory of a rat in the real-time place aversion test (30 min), in which entry into one quadrant (shaded), which was randomly determined prior to the session, led to 90 dB WN exposure. Right: aversiveness of WN in the place aversion test quantified as significantly decreased time spent in the WN quadrant (n = 10, 9.71 ± 1.65, t(9) = 9.585, p<0.0001). (B) Left: a second cohort of rats was placed in the open field to assess their preferred quadrant in a first session. In a second session, the entry into the preferred quadrant led to 90 dB WN exposure. Right: when WN was administered in this quadrant, rats spent significantly less time in it (n = 15, No WN: 48.5 ± 0.2474, 90 dB: 7.983 ± 0.3875, t(14) = 13.43, p<0.0001). (C) Left: a third cohort of rats (n = 12) was exposed to an open-field foraging task in which food pellets were placed between grid-floor bars in one of the quadrants. Entry into the grid-floor quadrant (shaded) led to exposure of 0, 70, 80, 90, or 96 dB of WN, or a 3 kHz tone in separate sessions. Middle: increasing WN intensity dose-dependently decreased the amount of time rats spent foraging for food pellets in the grid-floor quadrant (χ2(5) = 27.6, p<0.0001), whereas the tone did not reduce foraging (70 dB WN vs. 70 dB tone (#); t(10) = 2.389, p=0.0381). Right: the rats’ response to the different WN intensities and the tone was reliable across first and second sessions of exposure, where rats underwent exposure to all WN intensities and the tone in a first session, before exposure to each in a second session. (D) Left: all other experiments took place in operant boxes equipped with a food magazine, a multiple-tone generator (cue speaker), and a WN generator (WN speaker). Middle: semi-random presentations of 6 s WN bouts increased the locomotion speed of rats (cohort 4; n = 14) in an operant box during the WN epoch compared to pre-WN baseline (post-hoc Dunn’s test, t(13) = 7.059, p<0.0001). Right: in another cohort of rats (cohort 5; n = 13), we tested different WN intensities and found a main effect of intensity on locomotion speed (χ2(3) = 13.80, p=0.0032) and significant differences between 70 and 90 dB (p=0.005) and 70 and 96 dB (p=0.0143) (n=13). (E) Rats (n = 17) responded reliably with increased locomotion speed to WN across days. (F) Rats (cohort 6; n = 9) discern between different WN magnitudes in an operant choice task, where they had to choose between pressing a lever that resulted in a food-pellet delivery and a lever that resulted in a food-pellet delivery plus simultaneous 5 s of 0, 70, 90, or 96 dB of WN (pellet + WN; Friedman test, χ2(3) = 11.57, p=0.0003). (G) Left: example cresyl violet-stained brain slice depicting an electrolytic lesion in the NAC (outlined) at the tip of the fast-scan cyclic voltammetry (FSCV) electrode (vertical black line). Right: schematic overview of FSCV recording locations (blue dots) in the NAC (gray) of all animals. (H) Single-trial pseudocolor plot (top panel), dopamine trace (bottom panel), and cyclic voltammograms (inset in bottom panel) for representative, dopamine-specific current fluctuations recorded in NAC, 5 s before WN (dashed line), during 6 s of WN (gray bar), and 14 s after WN. Except for panel (H), data are mean ± SEM. *p<0.05, **p<0.01, ***p<0.001.
Figure 2
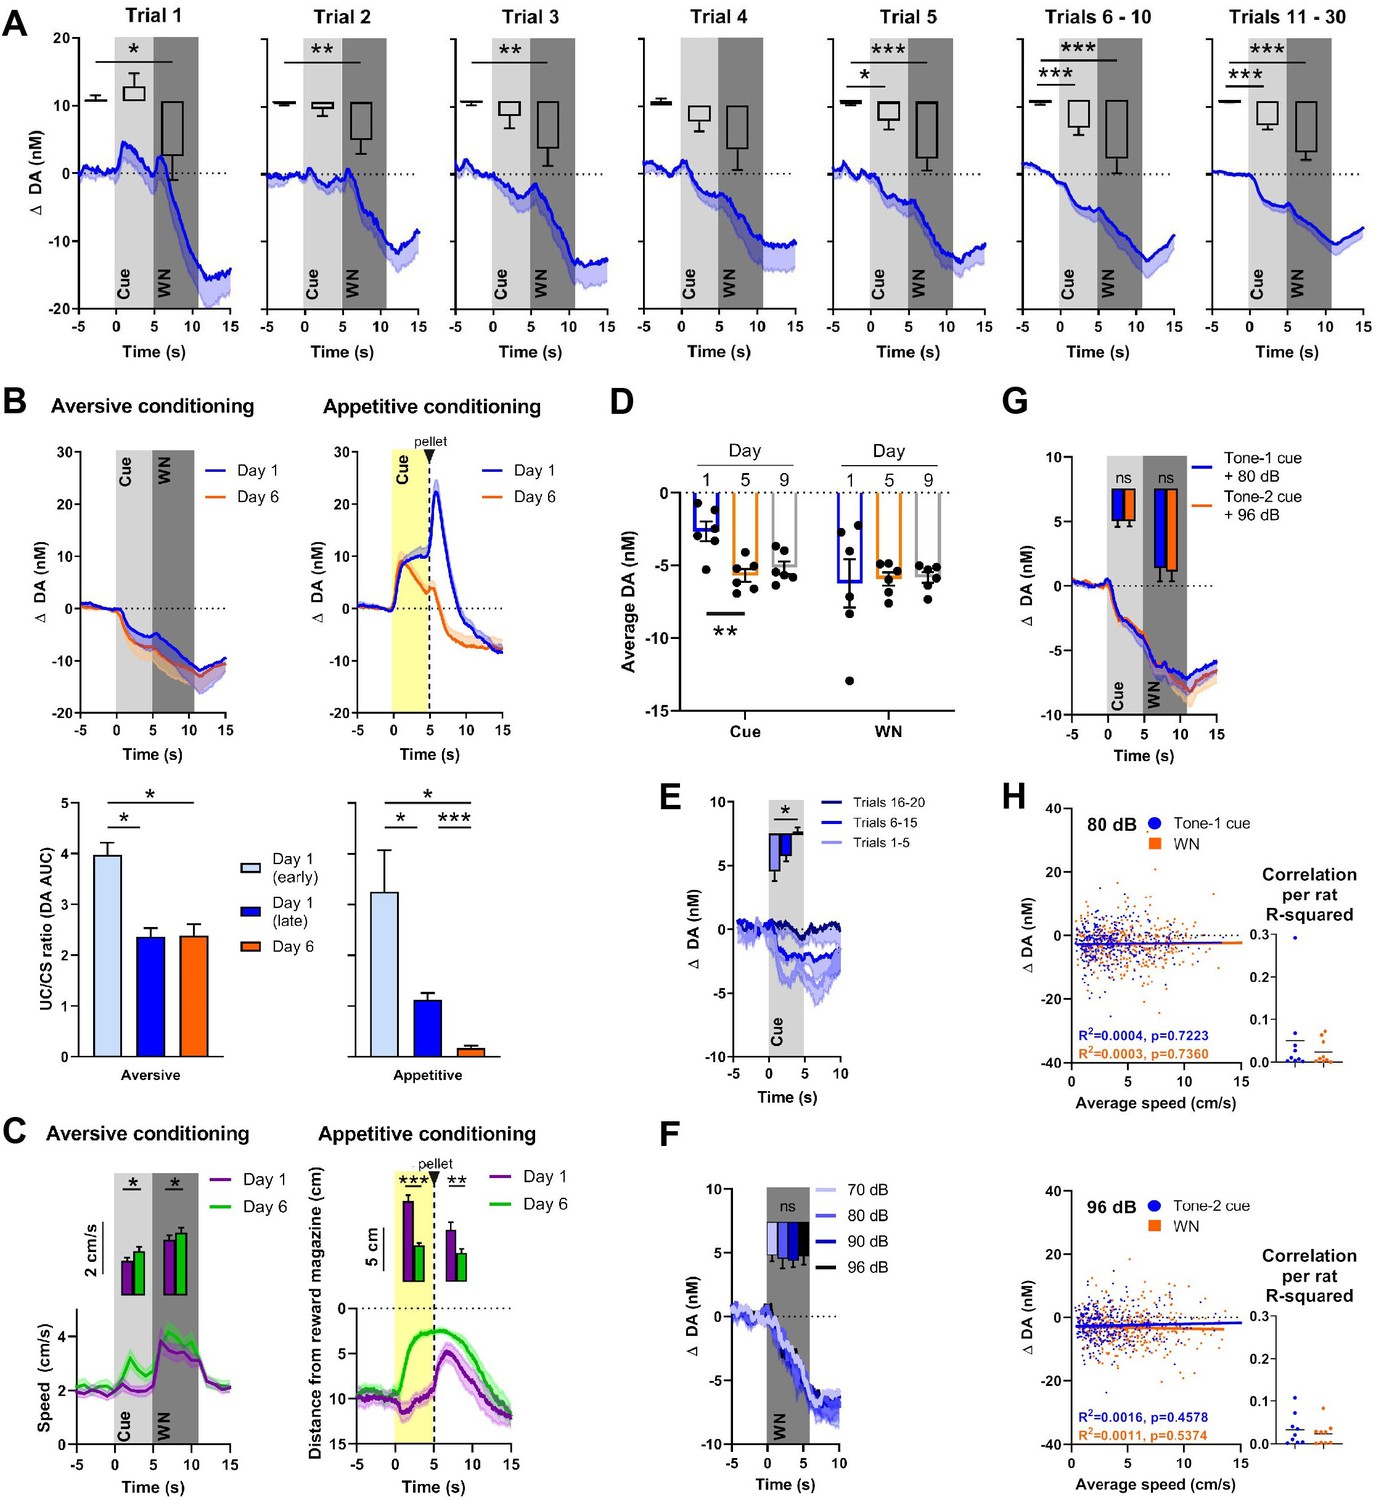
Nucleus accumbens core (NAC) dopamine signaling and rat behavior during Pavlovian white noise (WN)-cue conditioning and varying WN intensities.
(A) Average extracellular concentrations of dopamine (DA; in nM) in the NAC (dark-blue line; SEM is shaded light blue) during the first 30 pairings of cue (5 s tone) and WN (6 s, 90 dB) (16 rats). To illustrate the immediate, unconditioned effects of WN, the first five trials are displayed individually. The bar graph insets depict dopamine release averaged for baseline, cue, and WN epochs. WN decreased dopamine significantly in all trials, except trial 4. The WN-paired cue began to decrease dopamine significantly starting at trial 5. (B) Comparison of dopamine release during aversive (left, n = 4) and appetitive (right, n = 10) Pavlovian conditioning. Top: subsecond changes in dopamine concentration (nM) on day 1 (blue) and day 6 (orange). Bottom: ratio of areas under the curve (AUC) between the CS and US (US/CS) on day 1 (early and late trials) and day 6 during aversive (left) and appetitive (right) conditioning. For aversive conditioning, dopamine differed between day 1 (early) and day 1 (late) (p=0.0138), and between day 1 (early) and day 6 (p=0.0318). For appetitive conditioning, a significant difference was found between early and late conditioning on day 1 (p=0.0441) and dopamine differed between day 1 (early) (p=0.0102) and day 1 (late) (p<0.0001) compared to day 6. (C) Conditioned behavioral response corresponding to (B). Left: during aversive conditioning, locomotion speed during cue presentation increased from day 1 to day 6 (Z = – 2.485, p=0.013), and also during WN (Z = –2.343, p=0.019) (n = 17). Right: during appetitive conditioning, time spent in proximity of the reward magazine increased between days 1 and 6 both during cue presentation (t(9) = 6.962, p<0.0001) and after pellet delivery (t(9) = 2.572, p=0.0301), (n = 10). (D) WN and its paired cue decreased dopamine concentration reliably across days. Cue-induced decrease was stable between days 5 and 9, and WN-induced decrease was stable between days 1, 5, and 9. (E) In an extinction session, for 20 consecutive trials, WN was withheld after cue presentation (n = 6), and dopamine differed significantly between trials 1–5 and 16–20 (p=0.0133). (F) In contrast, we detected no differences in dopamine release between exposure to varying WN intensities (70, 80, 90, or 96 dB; F(2.380, 11.90) = 0.1655, p=0.8813, n = 6). (G) We observed no significant differences in dopamine during cue (Z = –0.059, p=0.953) or WN (Z = –0.178, p=0.859) when two separate tones were used as predictors for 80 dB (blue) or 96 dB (orange) WN (n = 9). (H) Trial-by-trial correlation between locomotion speed and dopamine concentration during cue (blue) and WN (orange) for either 80 dB (top) or 96 dB WN (bottom) were not significant. Each dot represents one trial. Trials from all animals (n = 9) were pooled. Top left: no correlation during 80 dB WN (R2 = 0.0016, p=0.457) or its cue (R2 = 0.0004, p=0.7223). Bottom left: no correlation during 96 dB WN (R2 = 0.0011, p=5374) or its cue (R2 = 0.0003, p=0.7360). Right: R2 values calculated separately for each individual rat confirm that there is no significant correlation between locomotion speed and dopamine. Data are mean ± SEM, + SEM, or - SEM. *p<0.05, **p<0.01, ***p<0.001.
Figure 3
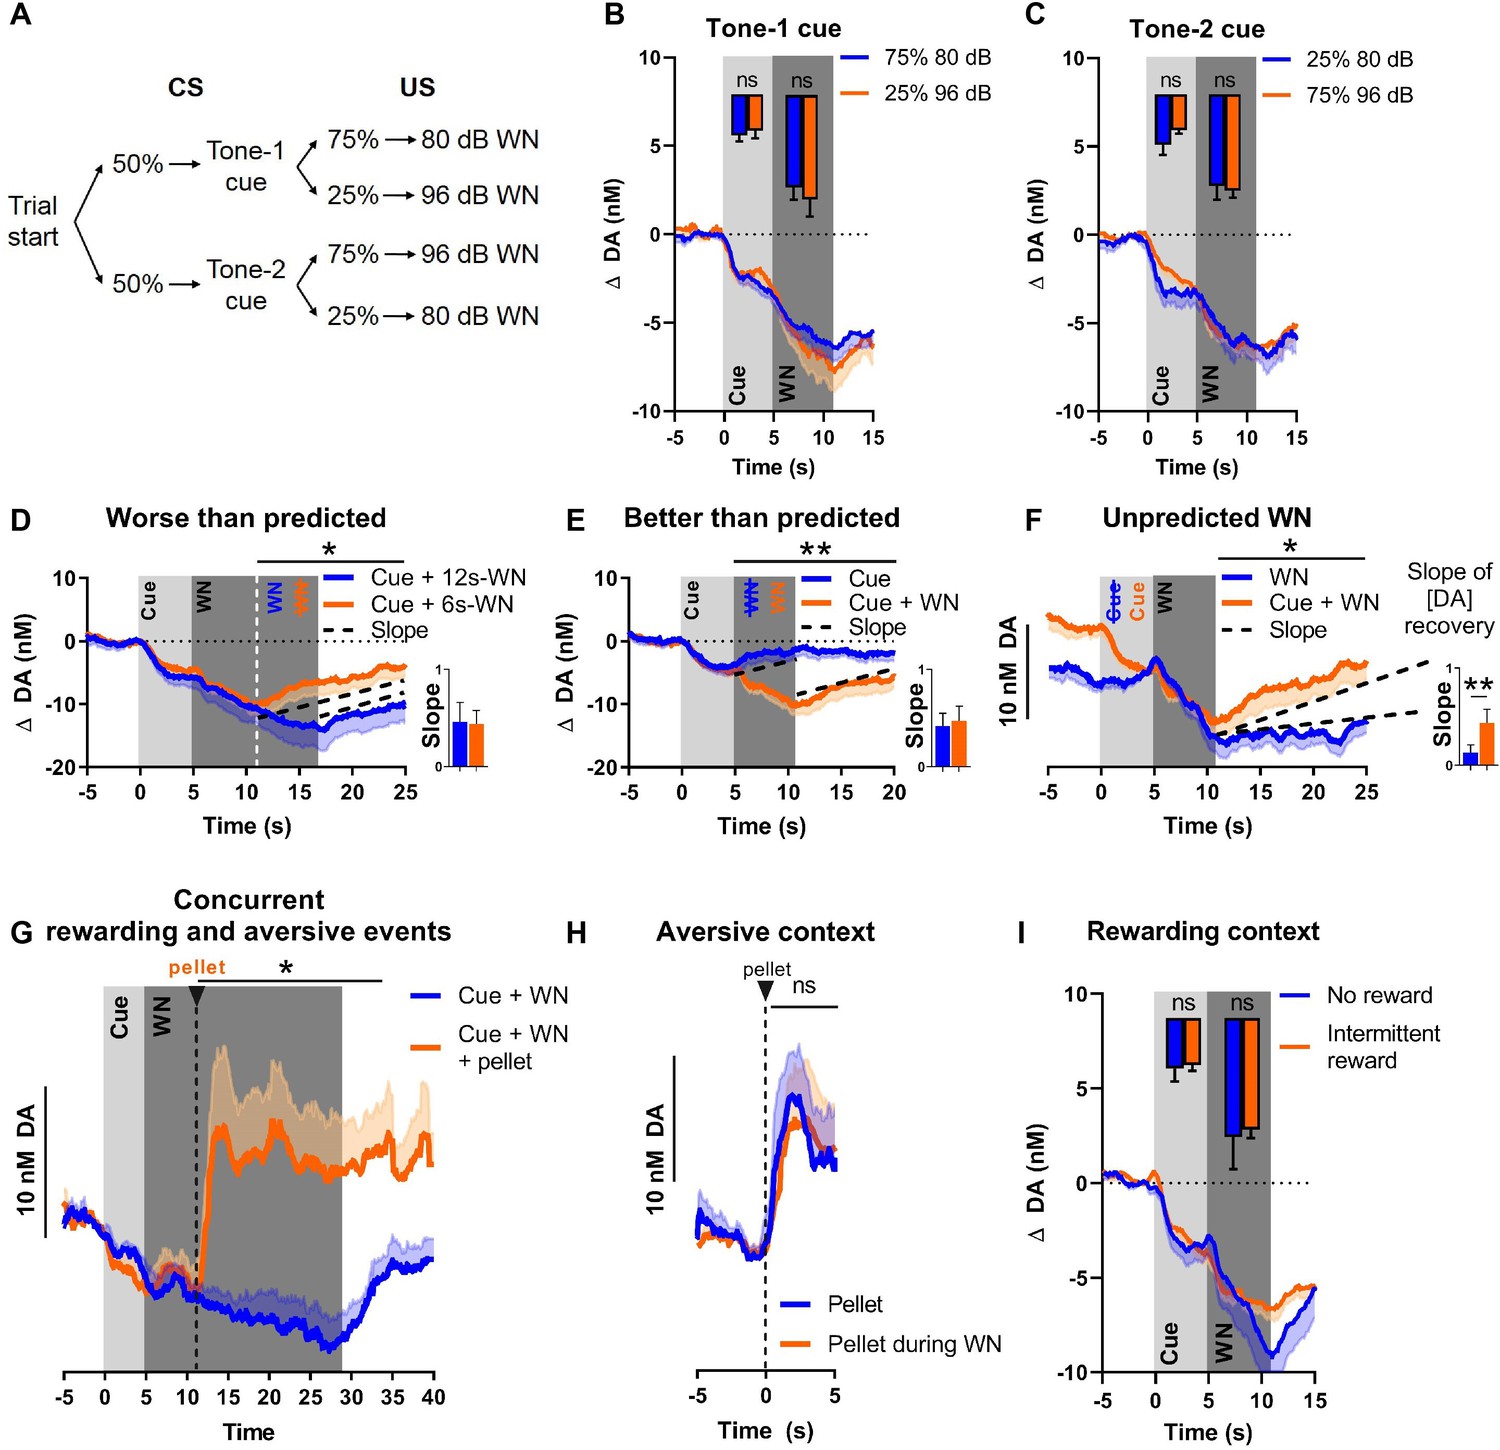
Nucleus accumbens core (NAC) dopamine consistently tracks prediction and duration of white noise (WN) with little aversive prediction error function.
(A) Trial structure of the probabilistic Pavlovian WN task. (B) Dopamine concentration in the probabilistic task during the presentation of tone-1 cue, which was followed by 80 dB WN (blue) in 75% of trials and by 96 dB WN (orange) in the remaining 25% of trials. Bar graph inset: no significant differences in average dopamine concentration (n = 9) during cue (t(8) = 0.5983, p=0.5662) and WN (t(8) = 0.6698, p=0.5218). (C) Dopamine concentration in the probabilistic task during the presentation of tone-2 cue, which was followed by 80 dB WN (blue) in 25% of trials and by 96 dB WN (orange) in the remaining 75% of trials. Bar graph inset: no significant differences in average dopamine concentration (n = 9) during cue (t(8) = 1.432, p=0.1901) and WN (t(8) = 0.4452, p=0.6680). (D) Comparison of dopamine between predicted 6 s WN (orange) and worse-than-predicted 12 s WN (blue) (n = 11) demonstrates significantly lower average dopamine in the epoch between 11 and 25 s during worse-than-predicted 12 s WN (t(10) = 1.863, p=0.046). Bar graph (right): slopes of dopamine concentration trajectories (black dotted lines) show no significant difference between worse-than-predicted and predicted WN (Z = –1.432, p=0.0775). (E) Comparison of dopamine between predicted 6 s WN (orange) and better-than-predicted, omitted WN (blue) (n = 11) demonstrates significantly higher average dopamine in the epoch between 5 and 20 s during better-than-predicted, omitted WN (t(10) = 3.751, p=0.0019). Bar graph (right): slopes of dopamine concentration trajectories (black dotted lines) show no significant difference between better-than-predicted and predicted WN (Z = 1.334, p=0.091). (F) Comparison of dopamine between predicted 6 s WN (orange) and unpredicted 6 s WN (blue) (n = 11) demonstrates significantly lower average dopamine in the epoch between 11 and 25 s during unpredicted WN (t(10) = 2.453, p=0.0170). Bar graph (right): slopes of dopamine concentration trajectories (black dotted lines) show a significantly flatter slope during unpredicted WN compared to predicted WN (Z = –2.490, p=0.0065). (G) Dopamine release during prolonged 24 s WN exposure (blue) continues to incrementally decrease over time. Unexpected reward delivery (n = 6) during such 24 s WN (orange) induces an increase in dopamine in the epoch between 11 and 35 s (t(5) = 3.108, p=0.0266). (H) Comparison of dopamine after unexpected pellet delivery (blue) and after unexpected pellet delivery during WN exposure (orange) (n = 6) shows no significant difference in average dopamine in the epoch between 0 and 5 s (t(5) = 0.08753, p=0.9336). (I) Comparison of dopamine during WN exposure in a testing context without rewards (blue) and a testing context with intermittent rewards (orange) (n = 6) shows no significant difference in average dopamine during the cue (t(5) = 0.2841, p=0.7877) and WN (t(5) = 0.3151, p=0.7654). Data are mean + SEM or - SEM. *p<0.05, **p<0.01.
Author response image 1
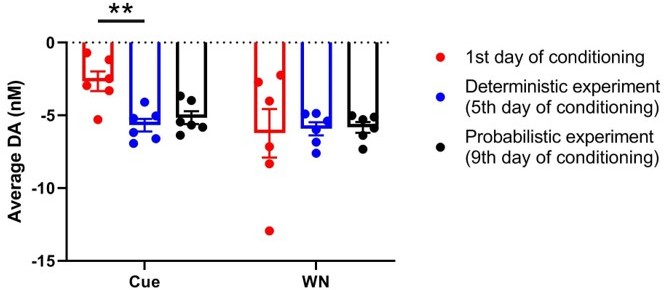
Cue and WN induce dopamine decrease across repeated experiments in the same animals.
Average dopamine concentration during cue and WN epochs in the animals depicted in Figures2A (first 30 trials on day 1 of conditioning), 2G (deterministic experiment), and 3B and C (probabilistic experiment). There is a significant main effect (F(1.428, 7.141) = 9.402, p = 0.0133) of recording session during the cue epoch, and post-hoc testing determined there is a significant difference between day 1 of conditioning and the deterministic experiment (p = 0.0035; Tukey’s multiple comparisons test). However, we found no effect of recording session on dopamine concentration during the WN epoch (F(1.236, 6.178) = 0.03898, p = 0.8936) indicating that the neurochemical response to WN remains stable across days.
Author response image 2
Author response image 3
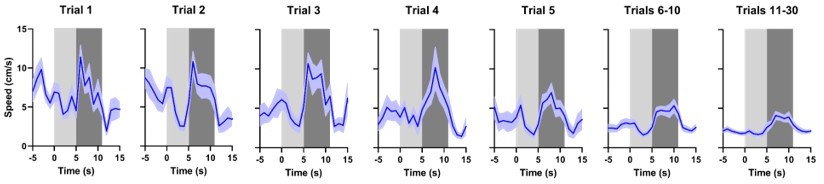
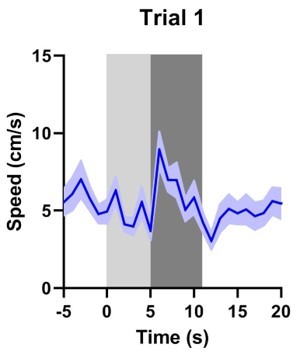
Locomotion speed across the first 30 trials on day 1 of conditioning of the rats (n=16) for which we show the dopamine traces in the NAC in Figure 2A.
Author response image 4

Comparing locomotion speed during the first trials of days 1 and 6 of aversive conditioning (total n = 17).
No significant difference was found between average locomotion speed during the WN epoch in trials 1 between days 1 and 6 (t(16)=0.9111, p=0.3757), thus, no long-term habituation of the behavioral response occurred..
Author response image 5

Statistical effects are not distorted by 10-point median filter.
Tables
Author response table 1
| Experiment | N | FSCV readout | Behavioral readout |
|---|---|---|---|
| Real time place aversion of randomly assigned quadrant (Figure 1A) | 10 | X | |
| Real time place aversion of preferred quadrant (Figure 1B) | 15 | X | |
| Approach-avoidance foraging task (Figure 1C) | 12 | X | |
| Operant box WN exposures (Figure 1D) | 14 | X | |
| WN and reward choice task (Figure 1F) | 6 | X | |
Aversive Pavlovian conditioning day 1
| 16 11 | X X | X |
| Appetitive Pavlovian conditioning (Figure 2B and C) | 10 | X | X |
| Aversive Pavlovian conditioning days 2–6 (Figures 1E and 2B and C) | 4 13 | X | X X |
| Dose response (Figures 1D and 2F) | 6 13 | X | X X |
| Deterministic experiment (Figure 2E and G) | 9 | X | |
| Probabilistic experiment (Figures 2E, 3A and B and C) | 9 | X | |
| Concurrent reward & WN and extinction (Figures 2E and 3G and H) | 6 | X |
Additional files
-
Transparent reporting form
- https://cdn.elifesciences.org/articles/82711/elife-82711-transrepform1-v1.docx
-
MDAR checklist
- https://cdn.elifesciences.org/articles/82711/elife-82711-mdarchecklist1-v1.docx
-
Source data 1
Experiment overview.
- https://cdn.elifesciences.org/articles/82711/elife-82711-data1-v1.xlsx
Download links
A two-part list of links to download the article, or parts of the article, in various formats.
Downloads (link to download the article as PDF)
Open citations (links to open the citations from this article in various online reference manager services)
Cite this article (links to download the citations from this article in formats compatible with various reference manager tools)
Nucleus accumbens dopamine tracks aversive stimulus duration and prediction but not value or prediction error
eLife 11:e82711.
https://doi.org/10.7554/eLife.82711


