Theoretical analysis reveals a role for RAF conformational autoinhibition in paradoxical activation
- Integrative Biology Laboratory, Salk Institute for Biological Studies, United States
- Department of Laboratory Medicine, Yale University, United States
- Yale Cancer Center, Yale School of Medicine, United States
Figures
Figure 1
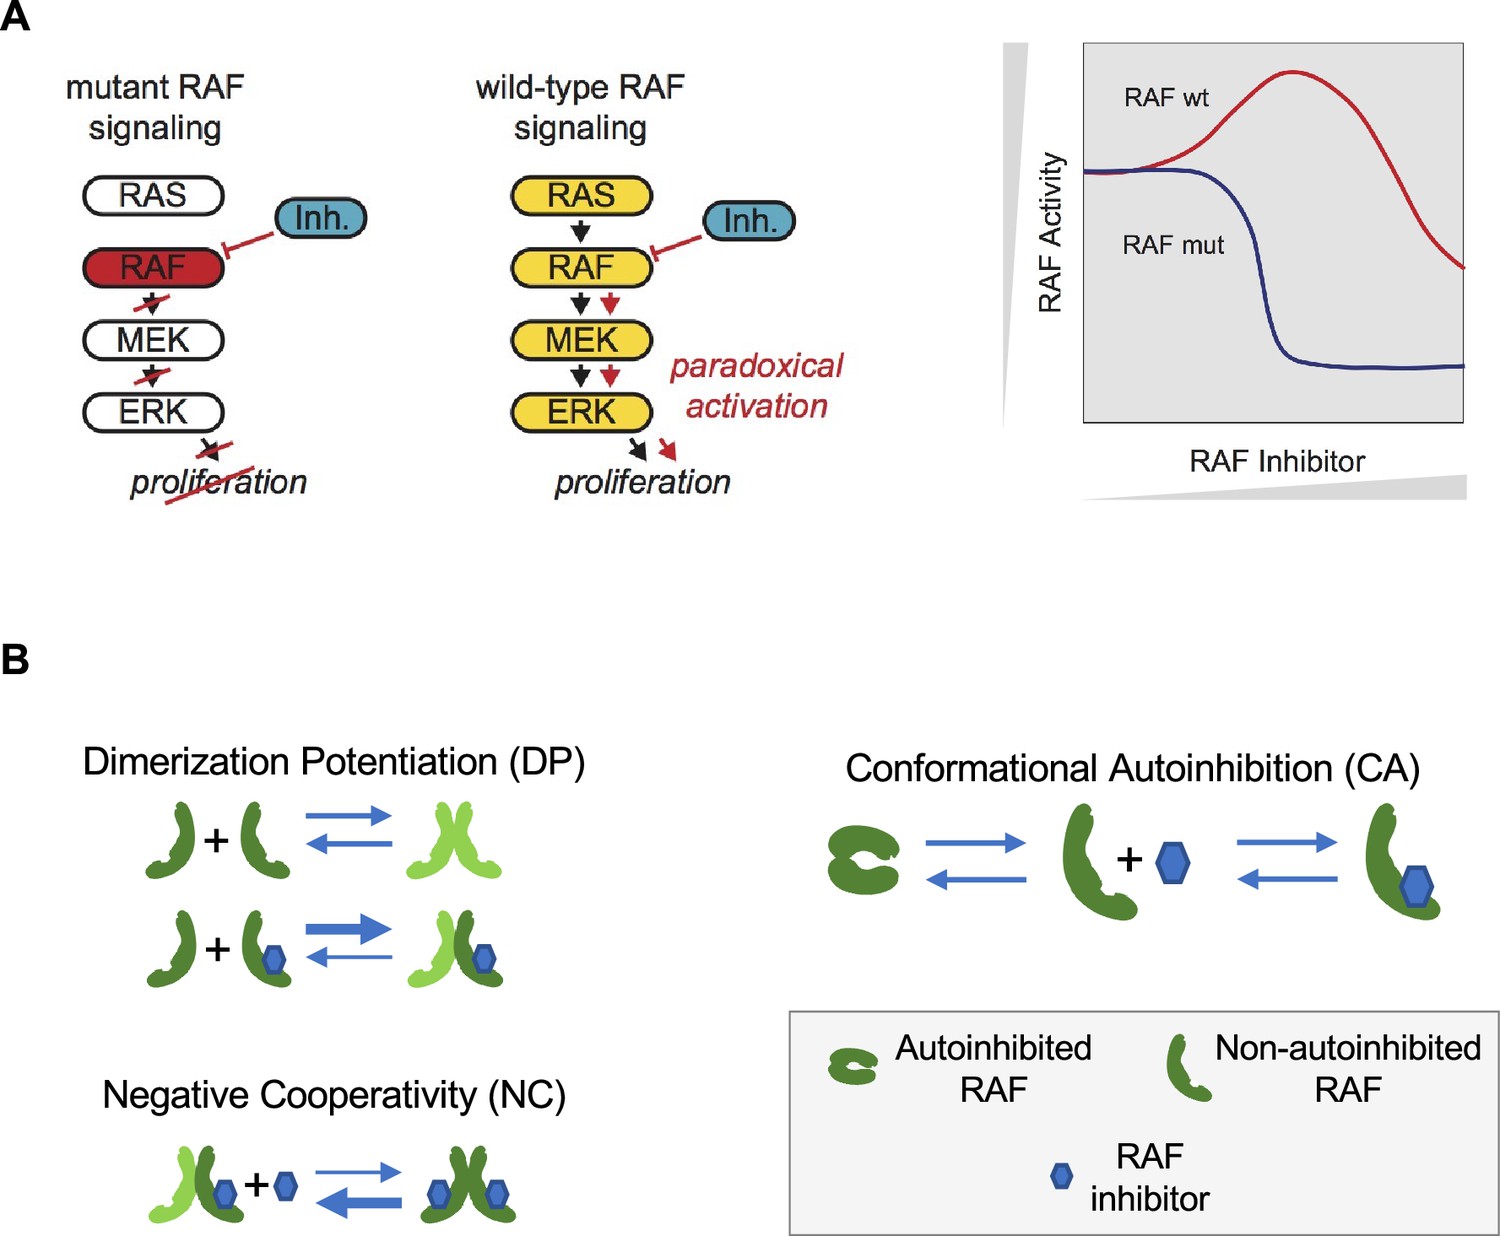
Paradoxical activation (PA) of the RAS pathway and its potential mechanisms.
(A) Schematic of the RAS/RAF/MEK/ERK signaling pathway and schematic of the PA concept. Whereas a RAF inhibitor can effectively inhibit RAF signaling to MEK in RAF mutant cancers, a RAF inhibitor can increase RAF signaling to MEK in cells without a RAF mutation (RAF wt). Gray triangles indicate directions of increasing RAF inhibitor (x-axis) and increasing RAF activity (y-axis) in the schematic. (B) Mechanisms that have been proposed to contribute to PA include RAF inhibitor-driven RAF dimer potentiation (DP), negative cooperativity (NC) for drug binding in trans within a RAF dimer once one protomer has bound drug, and the regulation of RAF kinase activity through conformational autoinhibition (CA).
Figure 2 with 2 supplements
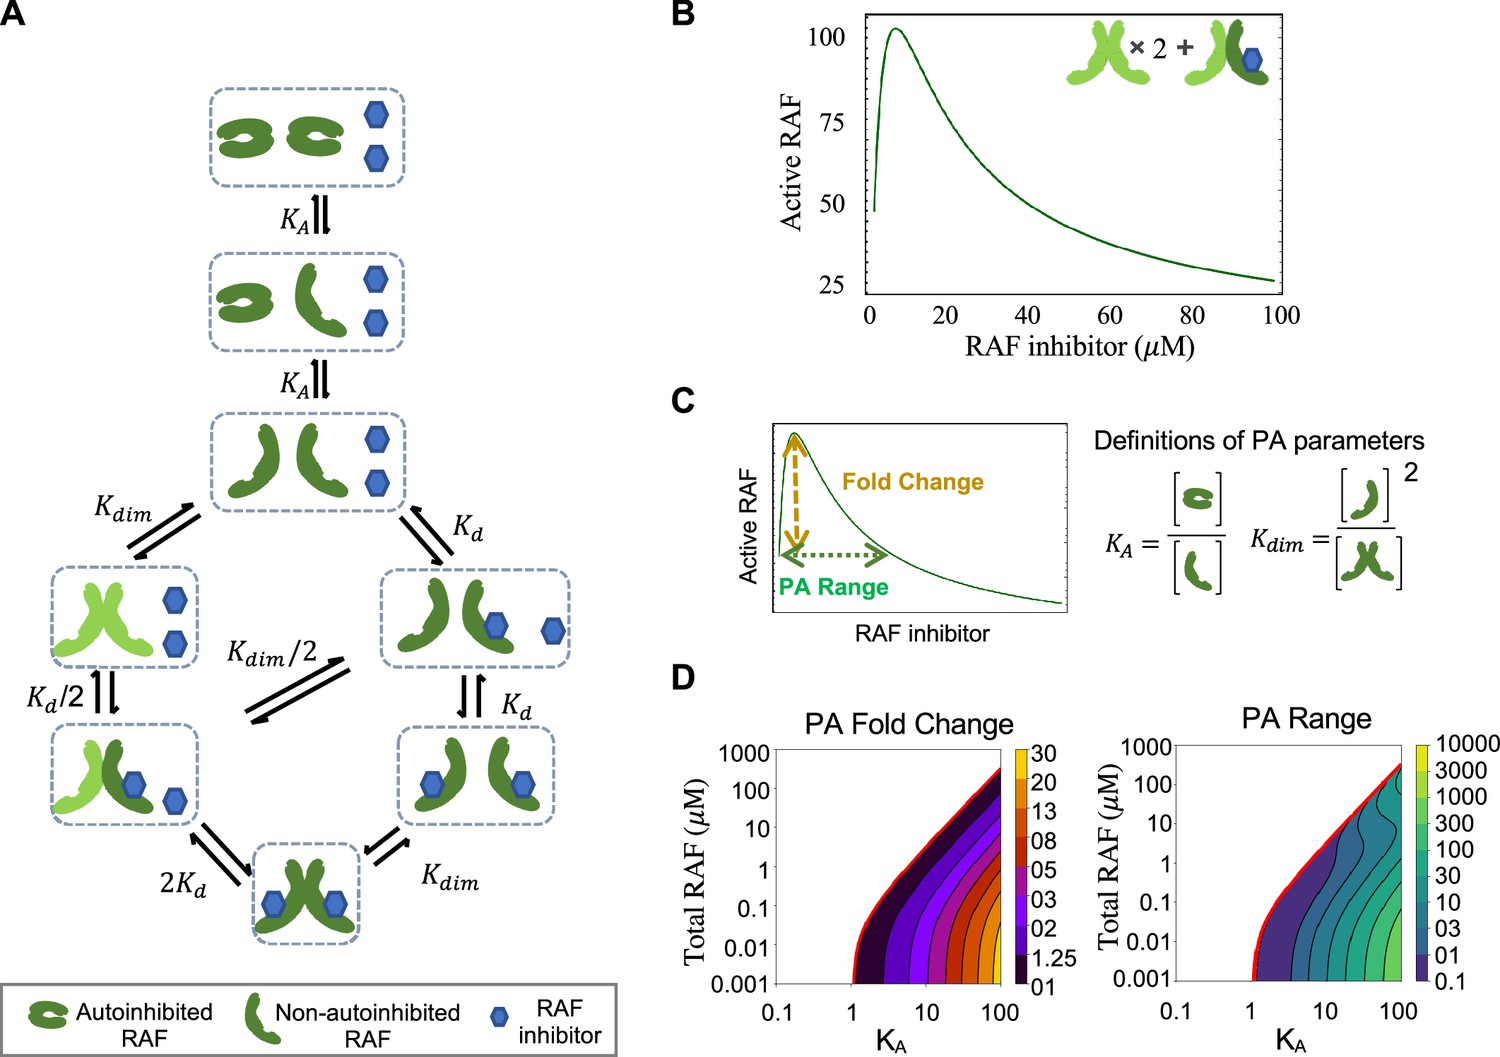
RAF autoinhibition is a mechanism that can produce paradoxical activation (PA).
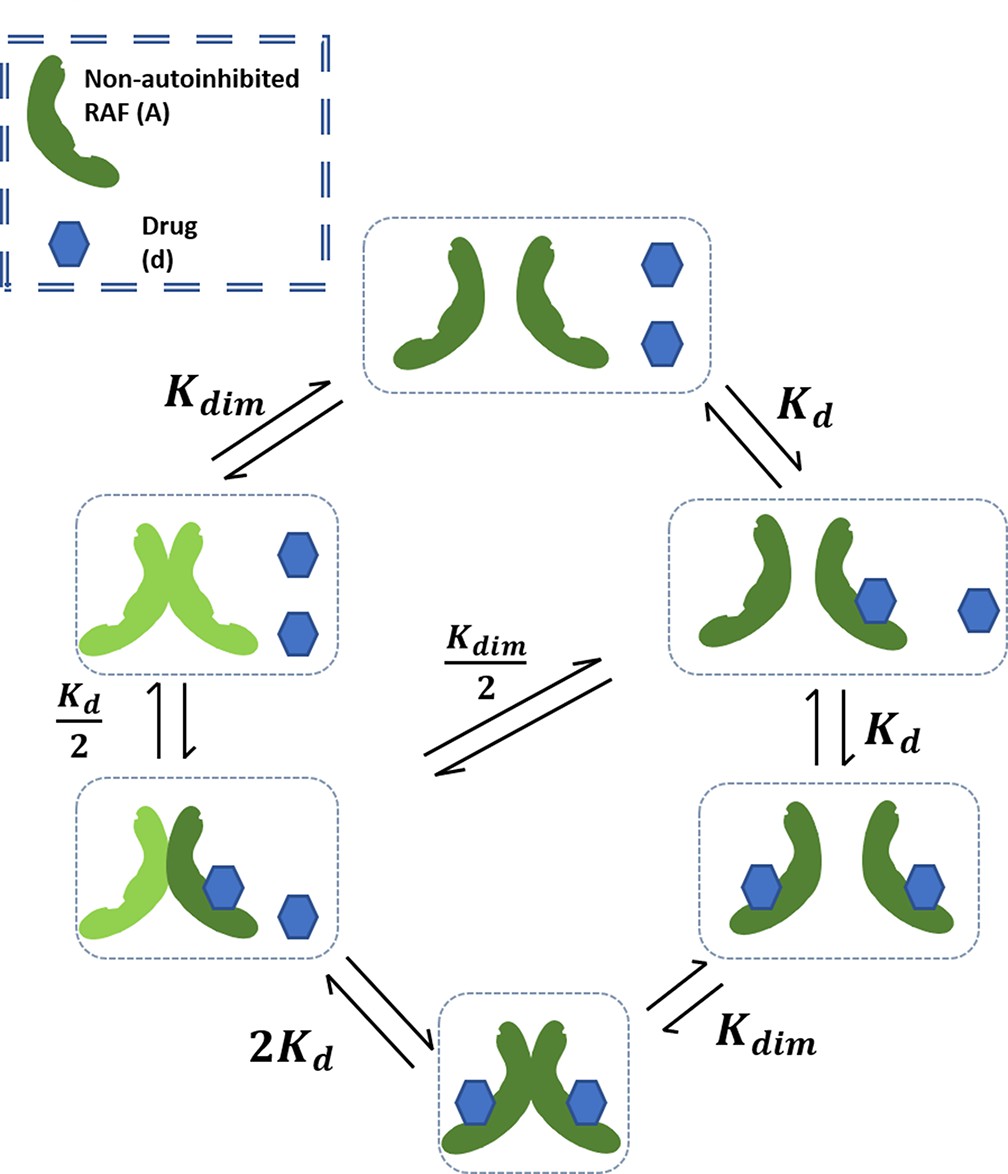
(A) Schematic of the RAF autoinhibition and dimerization model. RAF autoinhibition and the stabilization of the non-autoinhibited, dimerization, and signaling competent form of RAF by inhibitor is our first focus as a mechanism that may create PA. (B) Representative plot demonstrating that this model is sufficient to generate PA. Plotted quantity is the number of active RAF protomers (within a dimer, not bound to drug) normalized to the maximum as a function of RAF inhibitor abundance. (C) Schematic definitions of PA fold change, PA range, KA, and Kdim. (D) Predicted PA fold change and range presented as a function of two key parameters of the autoinhibition model (KA and [RAF]). Panels (B) and (D) are numerical examples with specific parameter values of otherwise global, analytic results of the conformational autoinhibition (CA) model that are shown in Table 1.
Figure 2—figure supplement 1
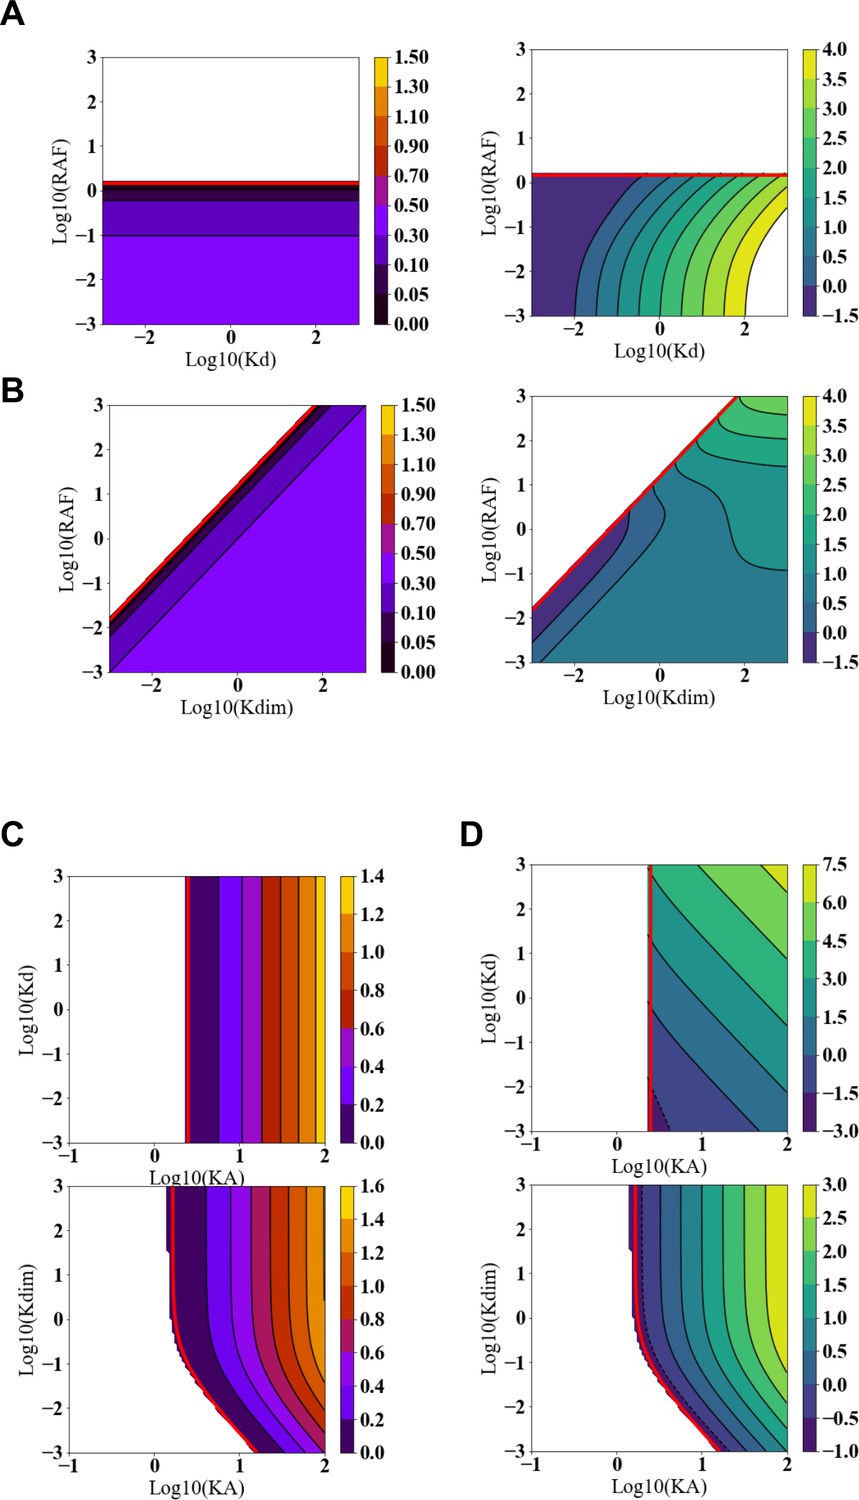
Predicted paradoxical activation (PA) fold change and PA range as functions of the RAF inhibitor and RAF dimerization dissociation constants.
(A) Predicted PA fold change (left) and PA range (right) presented as a function of two key parameters of the autoinhibition model: the dissociation constant for RAF inhibitor binding with a RAF monomer (Kd) and cellular abundance of RAF ([RAF]). (B) Predicted PA fold change (left) and PA range (right) presented as a function of two key parameters of the autoinhibition model: the dissociation constant for RAF dimerization (Kdim) and cellular abundance of RAF ([RAF]). All panels are numerical examples with specific parameter values of otherwise global, analytic results of the conformational autoinhibition (CA) model that are shown in Table 1. (C) Predicted PA fold change presented as a function of the CA equilibrium constant (KA) and also Kd (above) or Kdim (below). (D) Predicted PA range presented as a function of the CA equilibrium constant (KA) and also Kd (above) or Kdim (below).
Figure 2—figure supplement 2
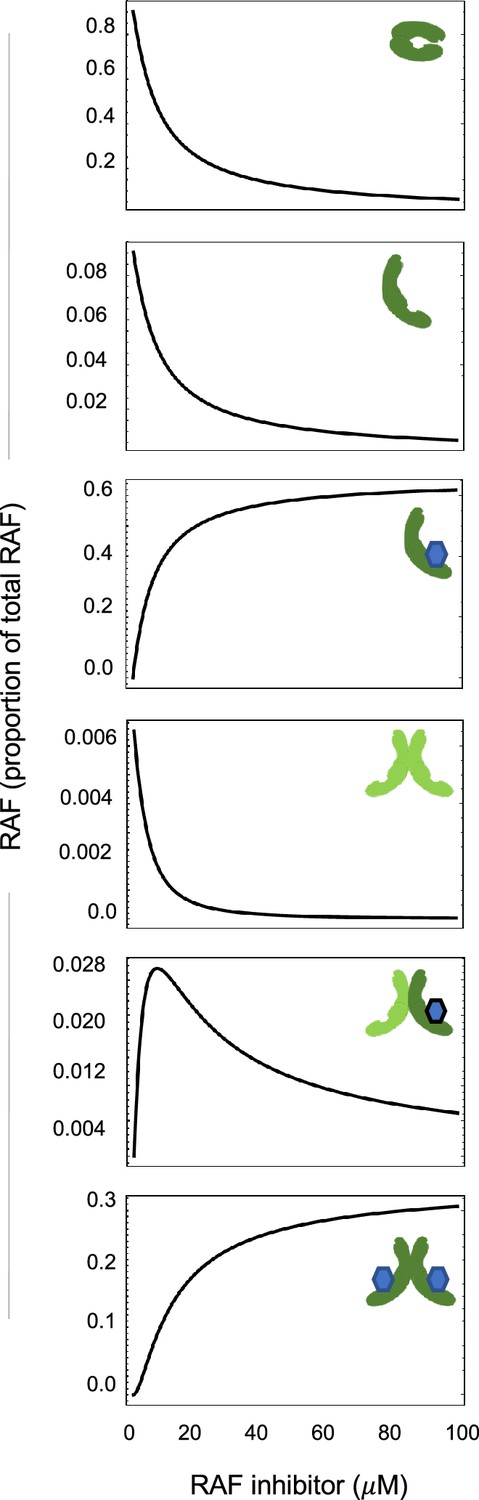
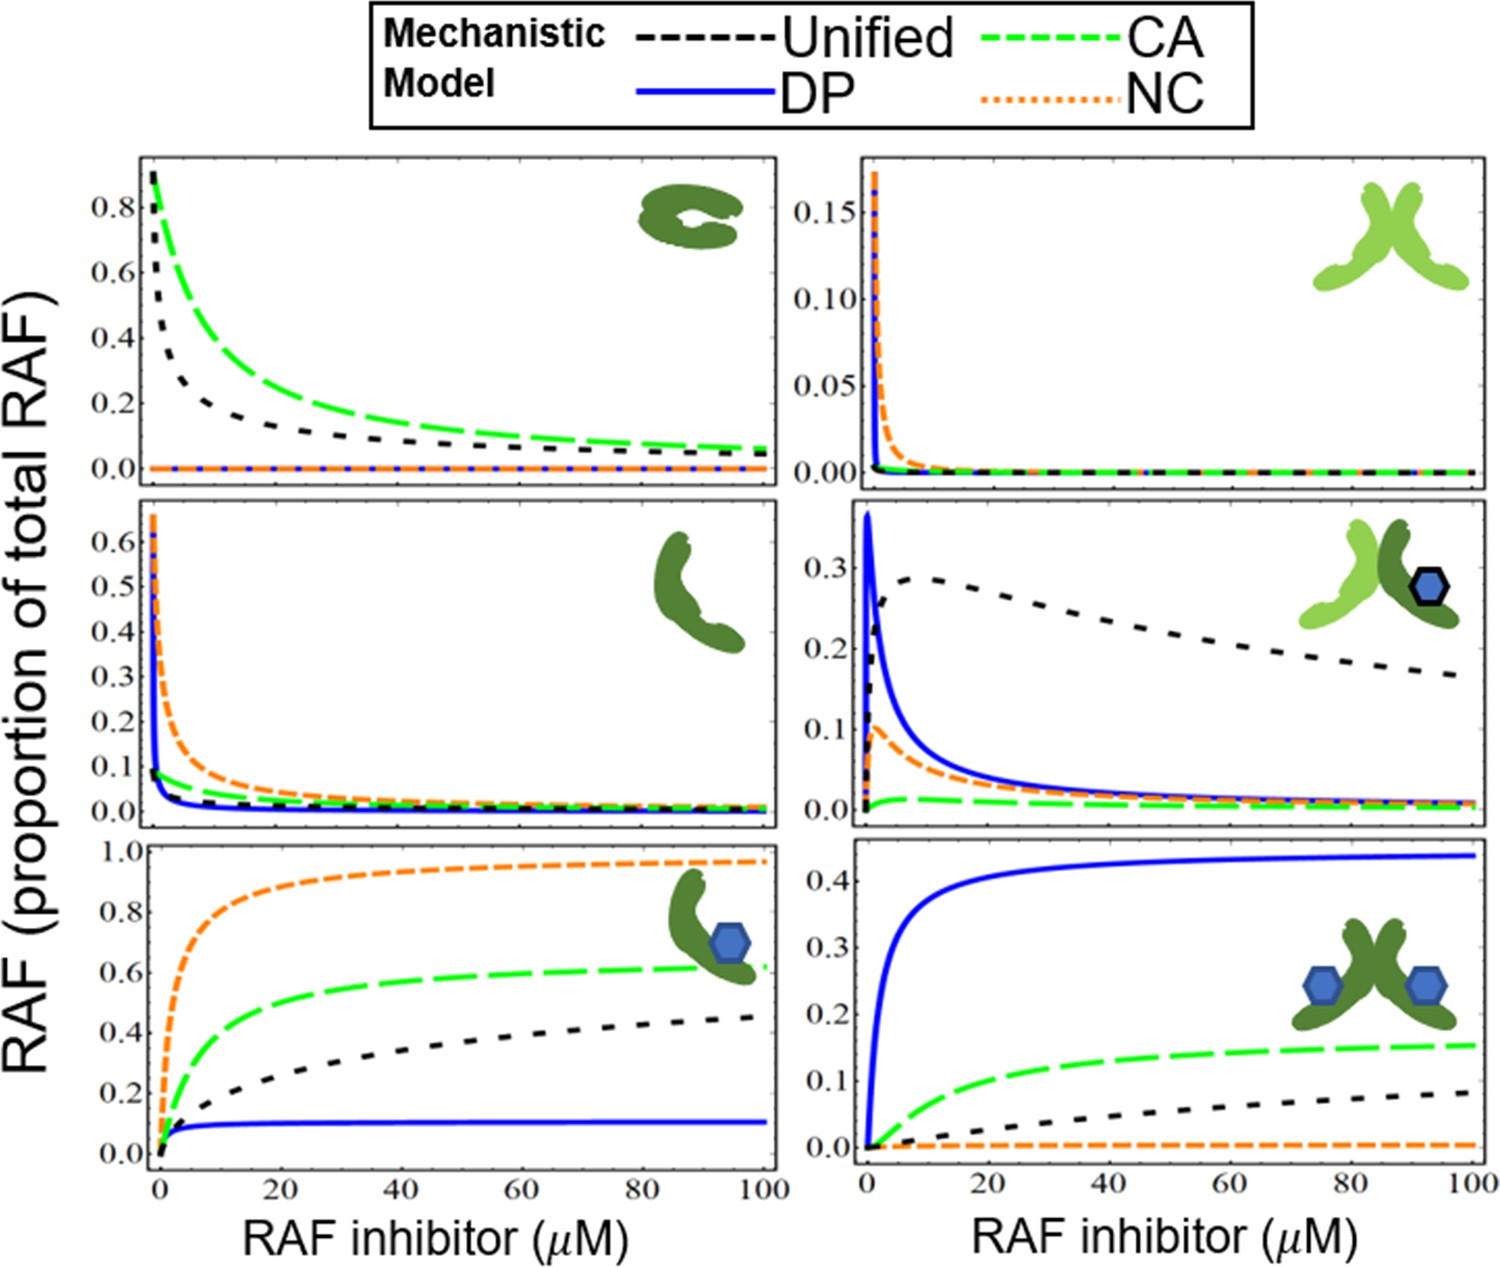
Visualization of how paradoxical activation (PA) arises from conformational autoinhibition with inhibitor stabilization of the open from.
Representative plots portraying the proportion of total RAF in its different states to illuminate the signaling state changes underlying PA in this mechanism. Only a RAF protomer that is within a dimer and that is also not bound inhibitor is considered active.
Figure 3 with 3 supplements
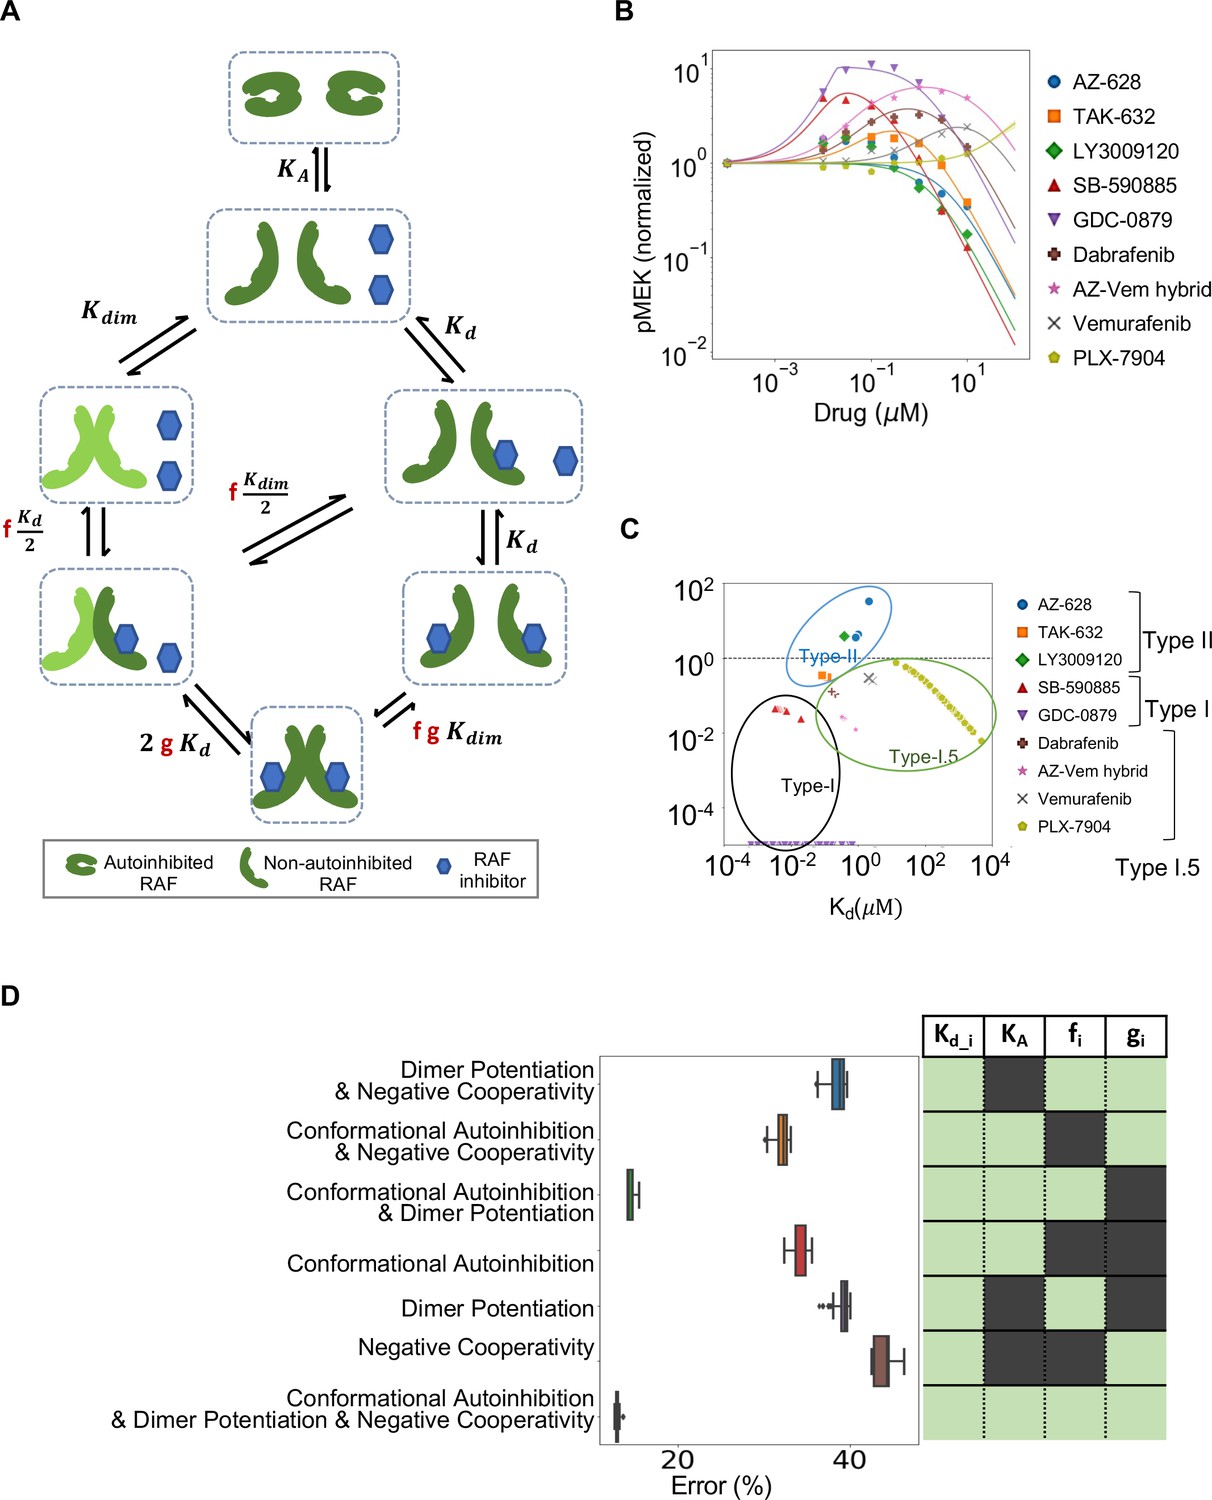
Estimated contribution of the three major mechanisms for promoting paradoxical activation (PA).
(A) Schematic of the modeled mechanism of conformational autoinhibition extended to include dimer potentiation (characterized by parameter ‘f’) and negative cooperativity (characterized by parameter ‘g’). (B) Plot of normalized dose–response curves for nine RAF inhibitors based on model fits to the available data (Karoulia et al., 2016). The solid lines represent mean values over N = 259 best fits for each of the 28 parameters varied. The standard deviation is highlighted in corresponding colored highlight. (C) The parameter ‘f’ and drug dissociation constant Kd values from best-fit parameter sets of the unified model (N = 259) fit to nine RAF inhibitors are shown (best-fit KA = 2.914 ± 0.009). The outcomes of best fits for type I, II, and I.5 inhibitors are marked in black, blue, and green, ovals respectively. Dashed line at f = 1 marks the absence of dimer potentiation mechanism. For each drug, we show all obtained best-fit parameter sets that were within 10% of best-fit metric. (D) Mean percentage error per input data for best-fit parameter sets in the unified model compared to models with one mechanism excluded and two mechanisms excluded. The panel on the right presents the parameters included in the corresponding model in light green (and those that are not in dark green). Subscript ‘i’ represents each of the nine drugs.
Figure 3—figure supplement 1
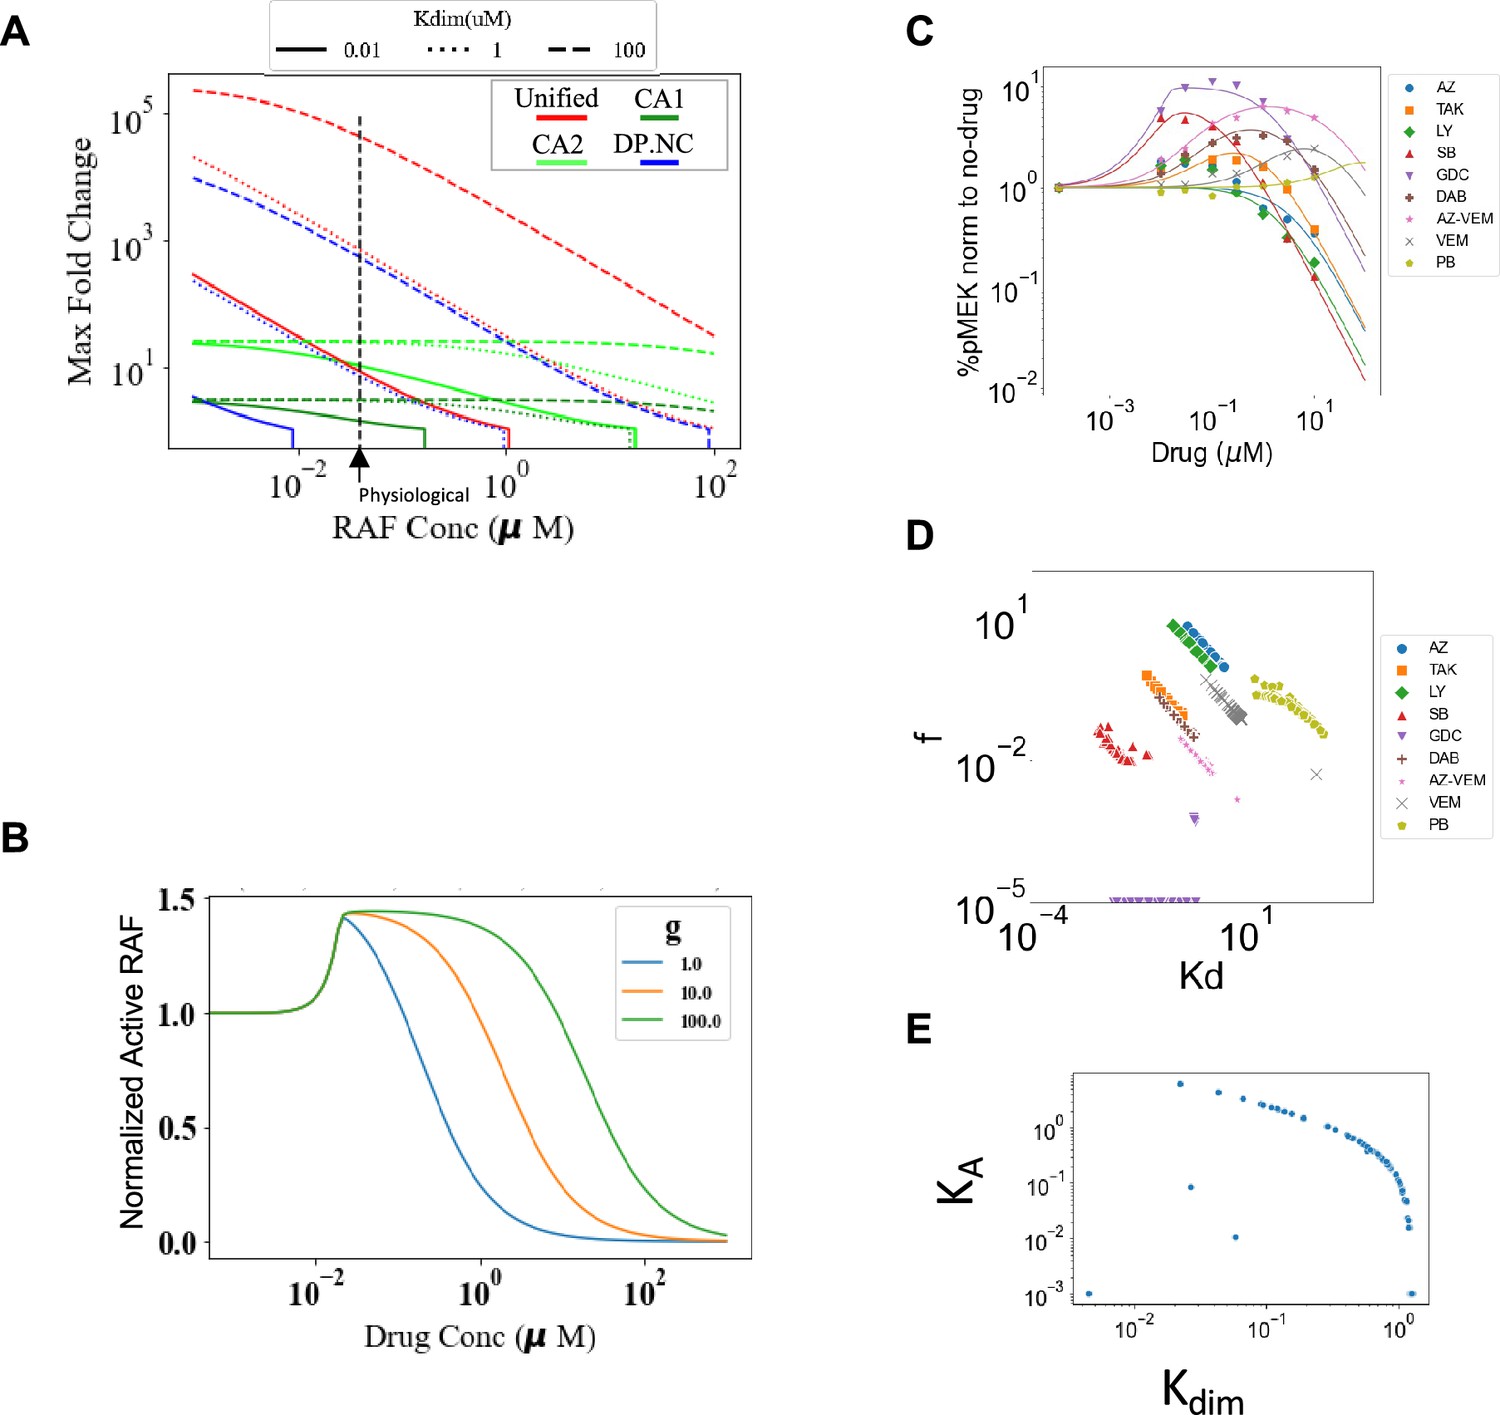
Characterizing dimer potentiation (DP), negative cooperativity (NC), and conformational autoinhibition mechanisms of paradoxical activation (PA).
(A) Maximum fold change allowed in the different mechanisms is shown with varying RAF concentrations ([RAF]) and dimerization dissociation rate constant (Kdim). CA1 represents CA mechanism with KA = 10 (10% of RAF is active at baseline and equilibrium) and CA2 represents CA mechanism with KA = 100 (1% of RAF is active at baseline and equilibrium). Extremal values of parameters for DP and NC mechanisms are used to derive maximal respective PA in DP, NC, and unified models (f = 10–5, g = 100). Dashed vertical line shows a physiological estimate of RAF concentration (0.04 μM). The parameters f and g are set to 1 where the respective mechanism of DP, NC is not present. (B) NC mechanism is shown within DP + NC sub-model. NC tweaks PA by extending the PA range of drug concentrations but has no impact on maximum fold change. (C) Plot of normalized dose–response curves for nine RAF inhibitors based on the unified model with all 30 parameters varied fit to the available data (Karoulia et al., 2016). The solid lines represent mean values and highlights represent the standard deviations. (D) Parameter regions predicted when all 30 parameters of the unified model are varied, cover the same regions as in Figure 3C, and distribute the different types of drugs in a similar fashion. However, the best-fit range of parameter values are much wider (on a log-10 scale) than in Figure 3. For each drug, we show all obtained best-fit parameter sets that were within 10% of best-fit metric. (E) With all parameters of the unified model varied, the best-fit correlations between KA values and the RAF dimerization dissociation constant (Kdim) are shown. Direct, monotonic correlation implies choosing Kdim also specifies best-fit KA.
Figure 3—figure supplement 2
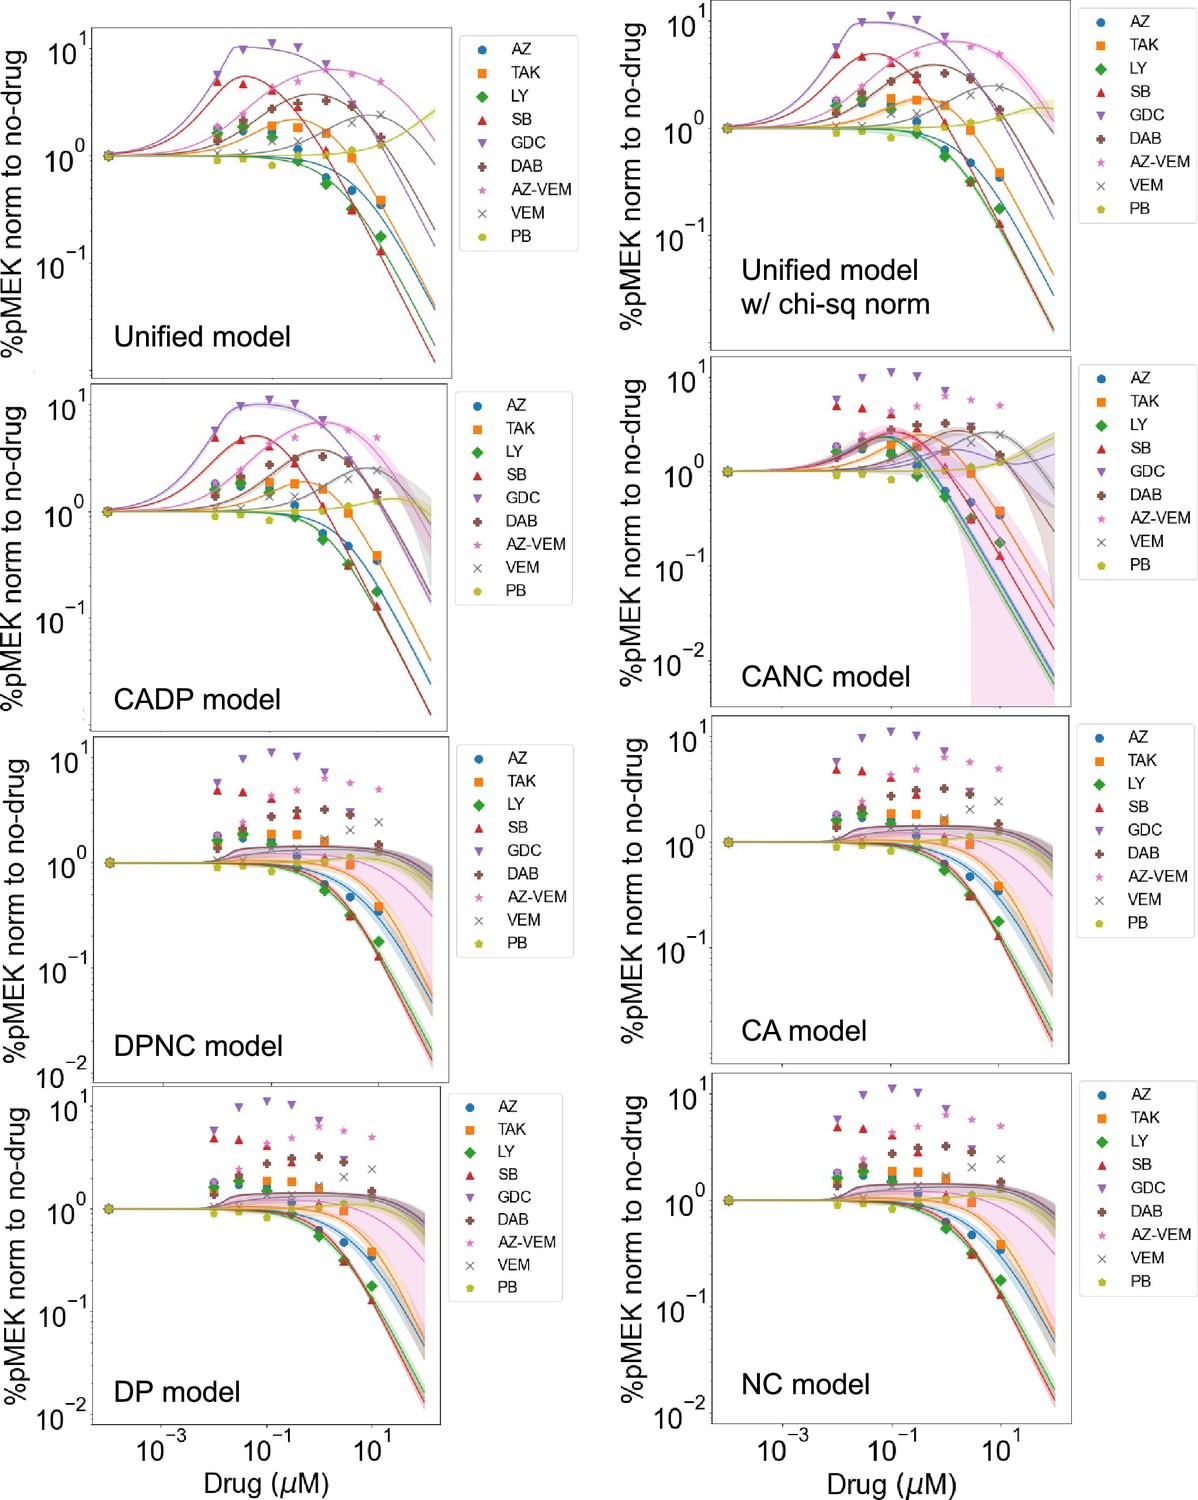
Best-fit dose–response curves for all models for each drug.
Normalized dose–response curves for nine RAF inhibitors based on fitting the unified model and all sub-models to the available data (Karoulia et al., 2016). The solid lines represent mean values over best fits for each of the parameters varied. The standard deviation is highlighted in corresponding colored highlight. Unified model is shown when fit with absolute error fitting metric used to compare across different models and with the chi-square-like metric that was used to identify best-fit parameter values.
Figure 3—figure supplement 3
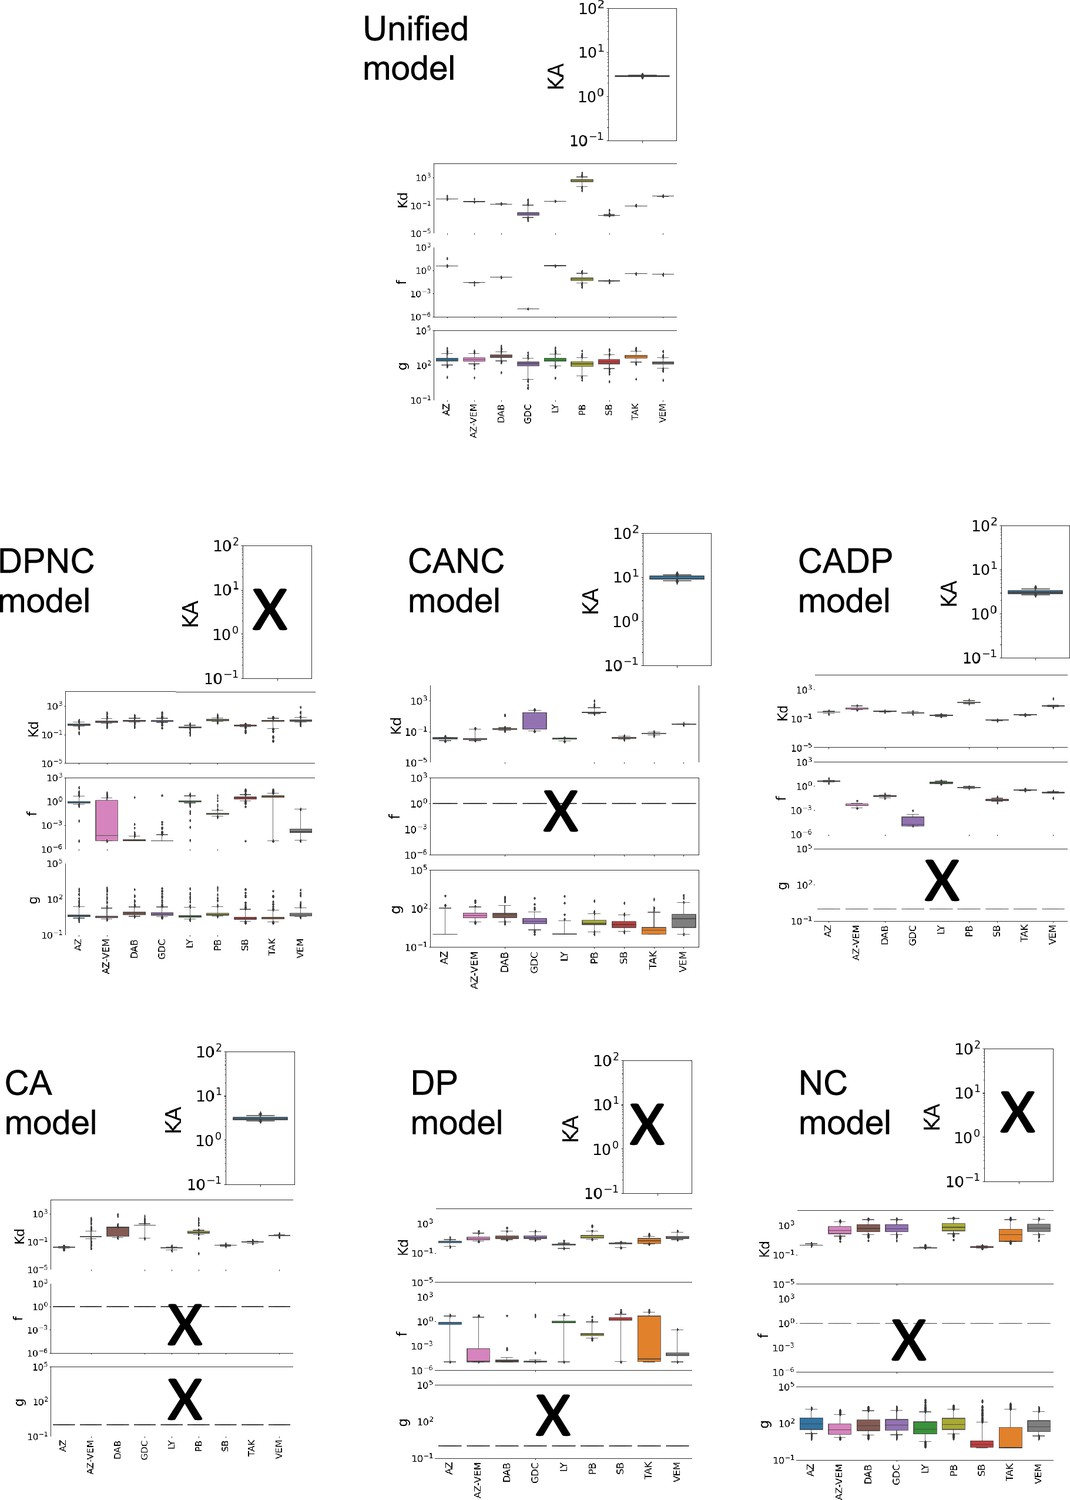
Best-fit parameter values compared across different drugs.
Box and whisker plots showing the range of parameter values from our best-fit sets (i.e., parameter sets with an error no more than 10% higher than the parameter set with the least error). Best-fit parameter values for the unified model (28 parameters varied) and all sub-models are shown. Unified model bar charts are copied on each page for reference. The ‘x’ marks represent parameters that were not varied. The axes ranges represent boundaries of the parameter fits. Within the box plots, the boxes indicate quartiles, and the whiskers specify the 95% confidence interval.
Appendix 1—figure 1
Schematic of base RAF dimerization and drug binding model that does not include conformational autoinhibition, negative cooperativity, or drug-induced dimerization.
Appendix 1—figure 2

Schematic of conformational autoinhibition and inhibitor binding, where inhibitor can only bind the non-autoinhibited form of the target protein.
Appendix 1—figure 3

Schematic of the base model extended to include conformational autoinhibition.
Appendix 1—figure 4

Plot of the relationship between unbound drug and total drug.
Appendix 1—figure 5
Visualization of how paradoxical activation (PA) arises when conformational autoinhibition with inhibitor stabilization, dimer potentiation, and/or negative cooperativity are present.
Tables
Table 1
Analytic conclusions in equation form for the different DP, NC, CA, and unified mechanisms models described in our work.
Predicted expressions for active RAF at baseline (no drug), active RAF, total RAF dimers, and analytic conditions for PA to occur are shown in the rows for each of the mechanism associated models. The columns show models corresponding to the PA mechanisms of drug-modulated conformational autoinhibition (CA model), drug-induced dimerization potentiation mechanism (DP model), negative cooperativity toward second drug binding (NC model), and a model that combines all these mechanisms (unified model). The lower part of the table is a key that presents the abbreviated expressions, which allow presentation into similar functional forms for corresponding model results.
| Model type | Conformational autoinhibition (CA) | Dimer potentiation (DP) | Negative cooperativity (NC) | Unified model |
|---|---|---|---|---|
| Core model assumptions |
|
|
|
|
| Baseline active RAF (relative to total) | ||||
| Active RAF (relative to total) | ||||
| Total RAF dimers (relative to active RAF) | ||||
| RAF PA conditions | (** necessary and sufficient) | (* sufficient) | No PA possible | (*sufficient) |
| Key | ||||
| *Sufficient: conditions that allow PA | **Necessary and sufficient: The only conditions that allow PA. | |||
Additional files
-
MDAR checklist
- https://cdn.elifesciences.org/articles/82739/elife-82739-mdarchecklist1-v2.docx
-
Source code 1
Zipped folder containing supplementary code that enables all results to be reproduced.
Contents include a folder that includes Mathematica notebooks that derive the analytic results. Contents also include a folder that includes Python notebooks that reproduce all of the numerical results.
- https://cdn.elifesciences.org/articles/82739/elife-82739-code1-v2.zip
-
Supplementary file 1
Table of best-fit estimates for mechanistic parameters within the unified mechanisms model and all sub-models.
From top to bottom: best-fit parameters are shown for the DP + NC (blue), CA + NC (orange), CA + DP (green), CA (red), DP (violet), NC (brown), CA + NC + DP unified mechanisms model when 28 (black) or all 30 (gray) parameters are varied. Each of the models are fit to 63 input data points obtained from Figure 4E of Ciardiello and Tortora, 2008. Input pMEK data was normalized to total MEK and then for each of the nine drugs normalized to the respective drug-free (DMSO) condition to enable comparison with model predictions. Six parameters (f, g, Kd, KA, Kdim, [RAF]) identify dose–response curve generated by each drug. Of these, three parameters (f, g, Kd) are specific to each drug, totaling to 27 parameters for the nine drugs measured. Three parameters are cell-context specific (KA, Kdim, [RAF]). For all parameter sets other than unified model 30 parameters varied, [RAF] was set to 0.04 μM and Kdim was set to 0.1 μM. All numbers shown as mean ± SD. Numerical simulations of the unified model are shown in Figure 3—figure supplement 1.
- https://cdn.elifesciences.org/articles/82739/elife-82739-supp1-v2.xlsx
Download links
A two-part list of links to download the article, or parts of the article, in various formats.
Downloads (link to download the article as PDF)
Open citations (links to open the citations from this article in various online reference manager services)
Cite this article (links to download the citations from this article in formats compatible with various reference manager tools)
Theoretical analysis reveals a role for RAF conformational autoinhibition in paradoxical activation
eLife 12:e82739.
https://doi.org/10.7554/eLife.82739


