Structure-based prediction of T cell receptor:peptide-MHC interactions
- Herbold Computational Biology Program, Division of Public Health Sciences. Fred Hutchinson Cancer Center, United States
- Institute for Protein Design. University of Washington, United States
Figures
Figure 1 with 1 supplement
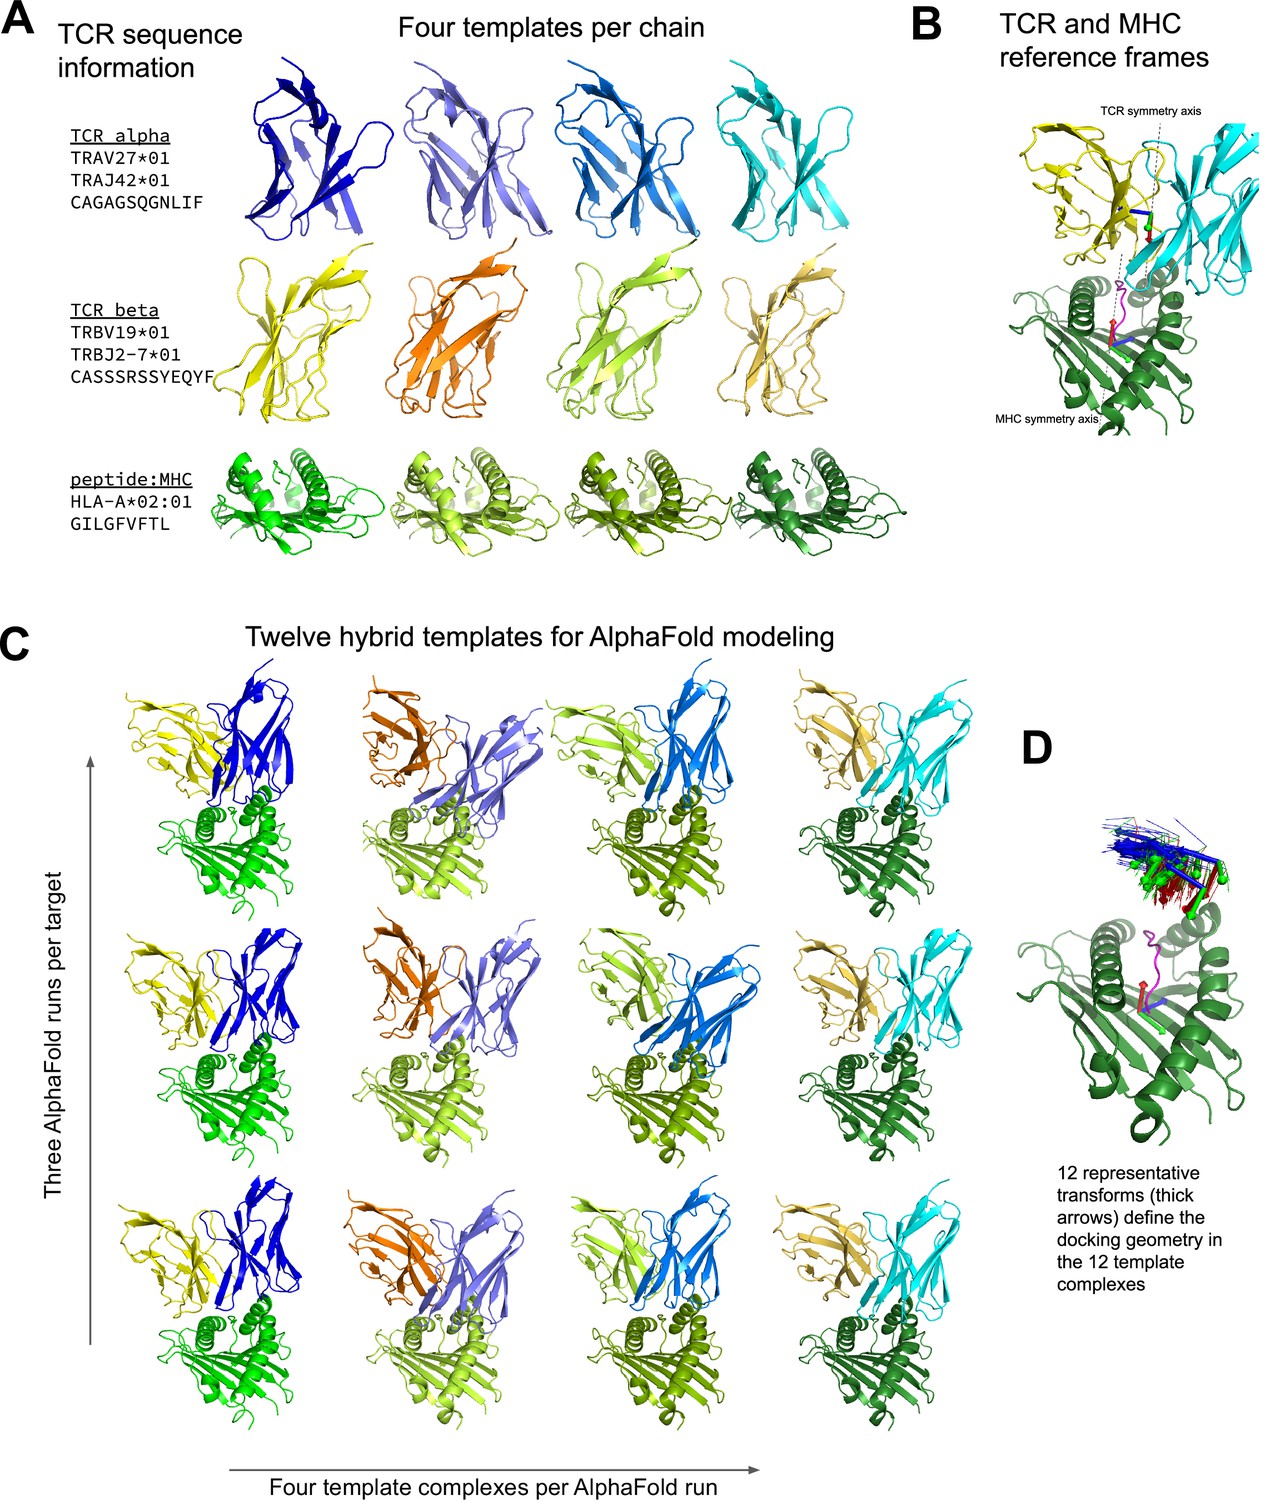
Constructing diverse hybrid templates for AlphaFold modeling.
(A) Four structural templates for each TCR chain and for the peptide:MHC are identified in the Protein Databank (Berman et al., 2000) by sequence similarity search. (B) TCR:pMHC docking geometry is defined by computing the rigid-body transformation between TCR and pMHC coordinate frames. Coordinate frames are oriented based on internal pseudo symmetry as described in the Methods. (C) Three independent AlphaFold simulations are performed, each with four hybrid templates built from the four sets of single-chain templates oriented relative to one another using one of twelve representative docking geometries chosen to cover a wide range of experimentally determined ternary complexes. (D) TCR coordinate frames from class I pMHC ternary structures and the 12 representative transforms (thicker arrows) are shown in a common coordinate system defined by their corresponding pMHC coordinate frames.
Figure 1—figure supplement 1
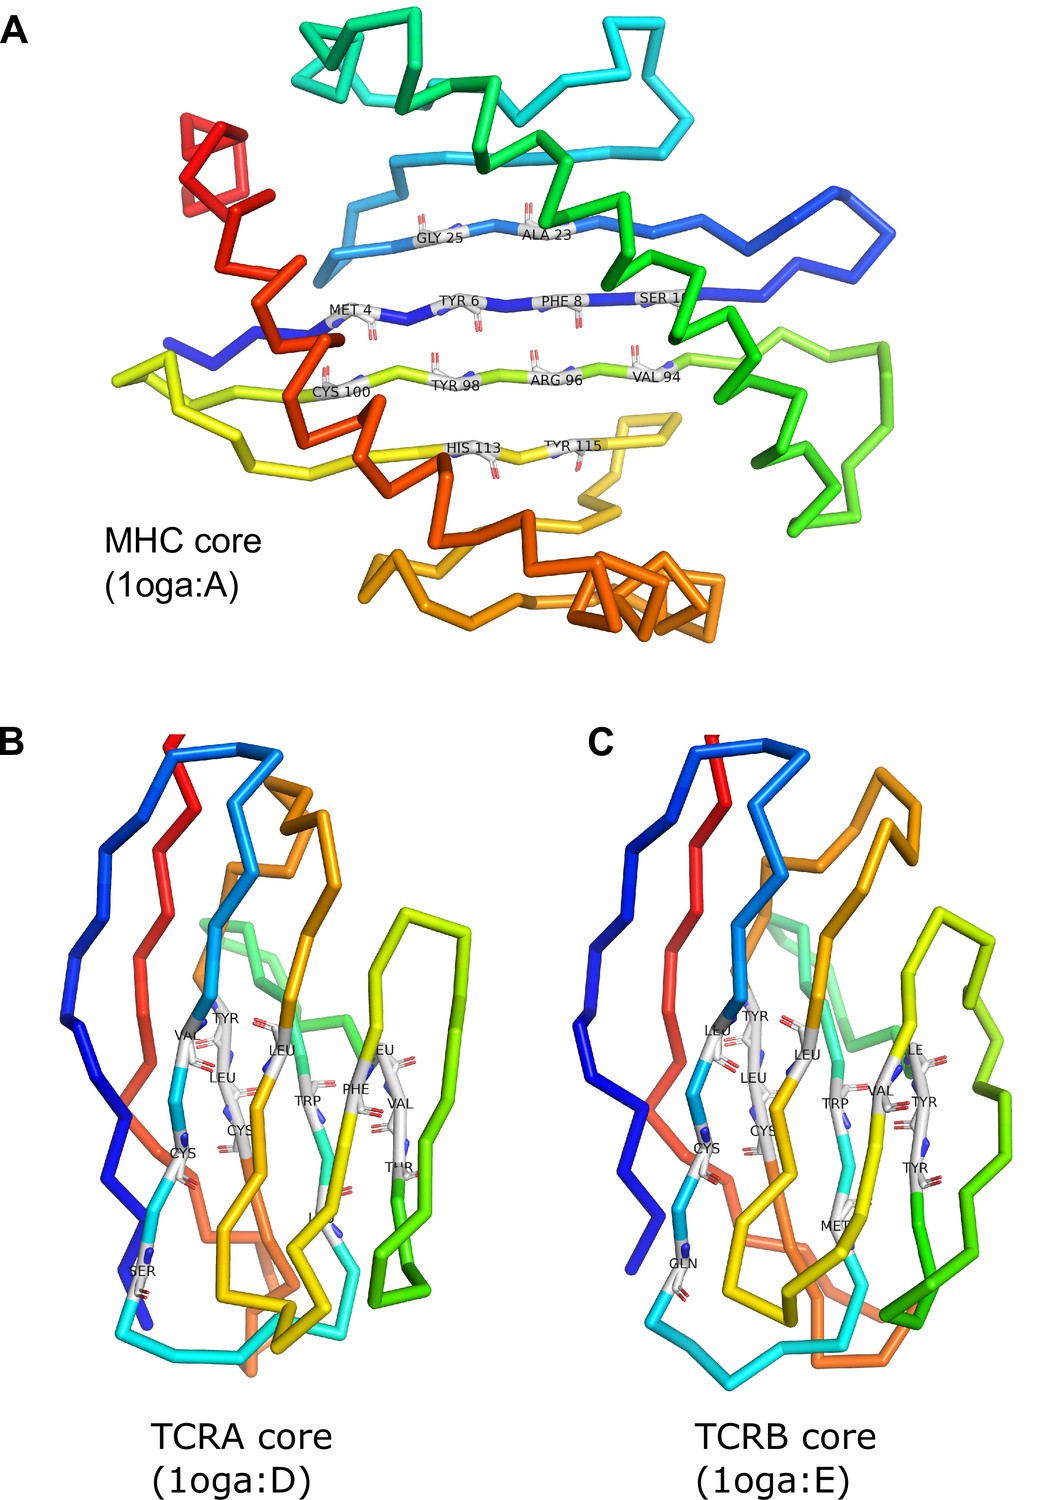
MHC and TCR core residue definitions.
The MHC symmetry axis is the rotation axis of the transformation that superimposes the 12 core residues onto themselves, interchanging the N- and C-terminal half-cores. The TCR symmetry axis is the rotation axis of the superposition transform that interchanges the TCRA and TCRB cores.
Figure 2 with 6 supplements
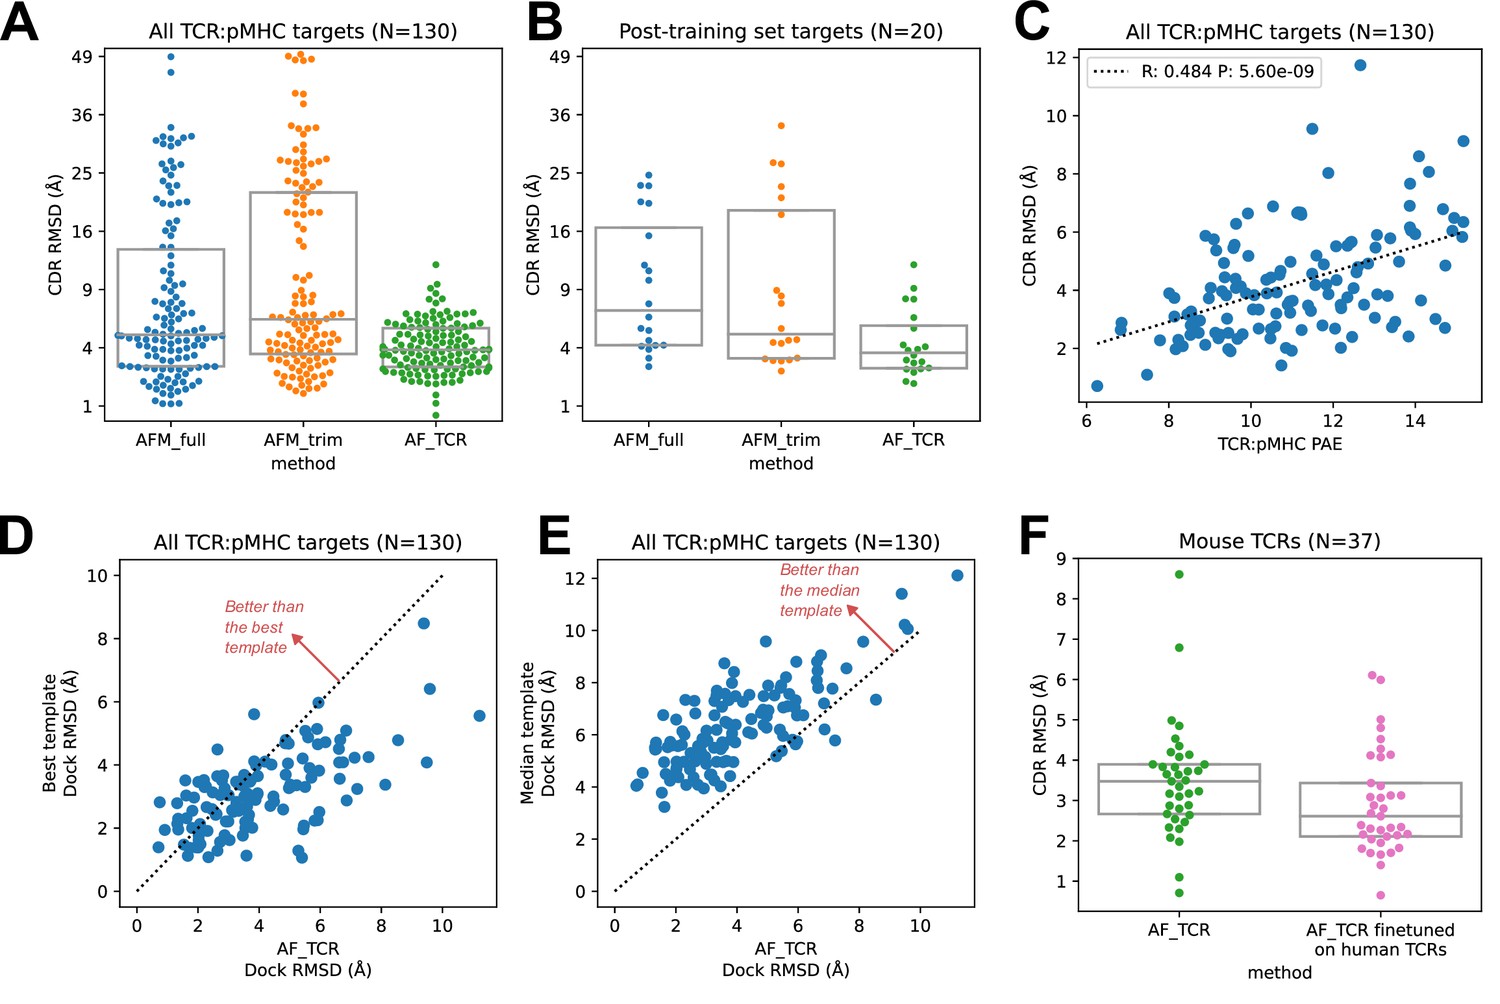
TCR modeling accuracy.
(A) Comparison between Alphafold-Multimer with full ('AFM_full') or trimmed ('AFM_trim') input sequences and the hybrid-templates TCR pipeline ('AF_TCR'). CDR RMSD values (y-axis) are computed by superimposing the native and modeled MHC coordinates and comparing the placement of the TCR CDR loops (see Methods). (B) Same as in (A) but for the 20 benchmark targets unrelated to any TCR:pMHC structure deposited before May 2018, the cutoff date for the AlphaFold-Multimer training set. (C) AlphaFold’s predicted aligned error (PAE) measure, evaluated between TCR and pMHC, correlates with CDR RMSD between model and native structure. (D) The docking geometry of the final AlphaFold model improves over the best of the 12 templates in 30% of cases (points above the line y=x). (E) The docking geometry of the final AlphaFold model improves over the median of the 12 templates in 94% of cases (points above the line y=x). (F) Fine-tuning AlphaFold’s parameters on human TCR:pMHC complexes improves prediction of mouse TCR:pMHC complexes. Boxes in A, B, and F show the quartiles of the plotted distributions.
-
Figure 2—source data 1
Structure prediction benchmark.
CSV file containing information on the ternary complexes in the structure prediction benchmark.
- https://cdn.elifesciences.org/articles/82813/elife-82813-fig2-data1-v1.csv
Figure 2—figure supplement 1
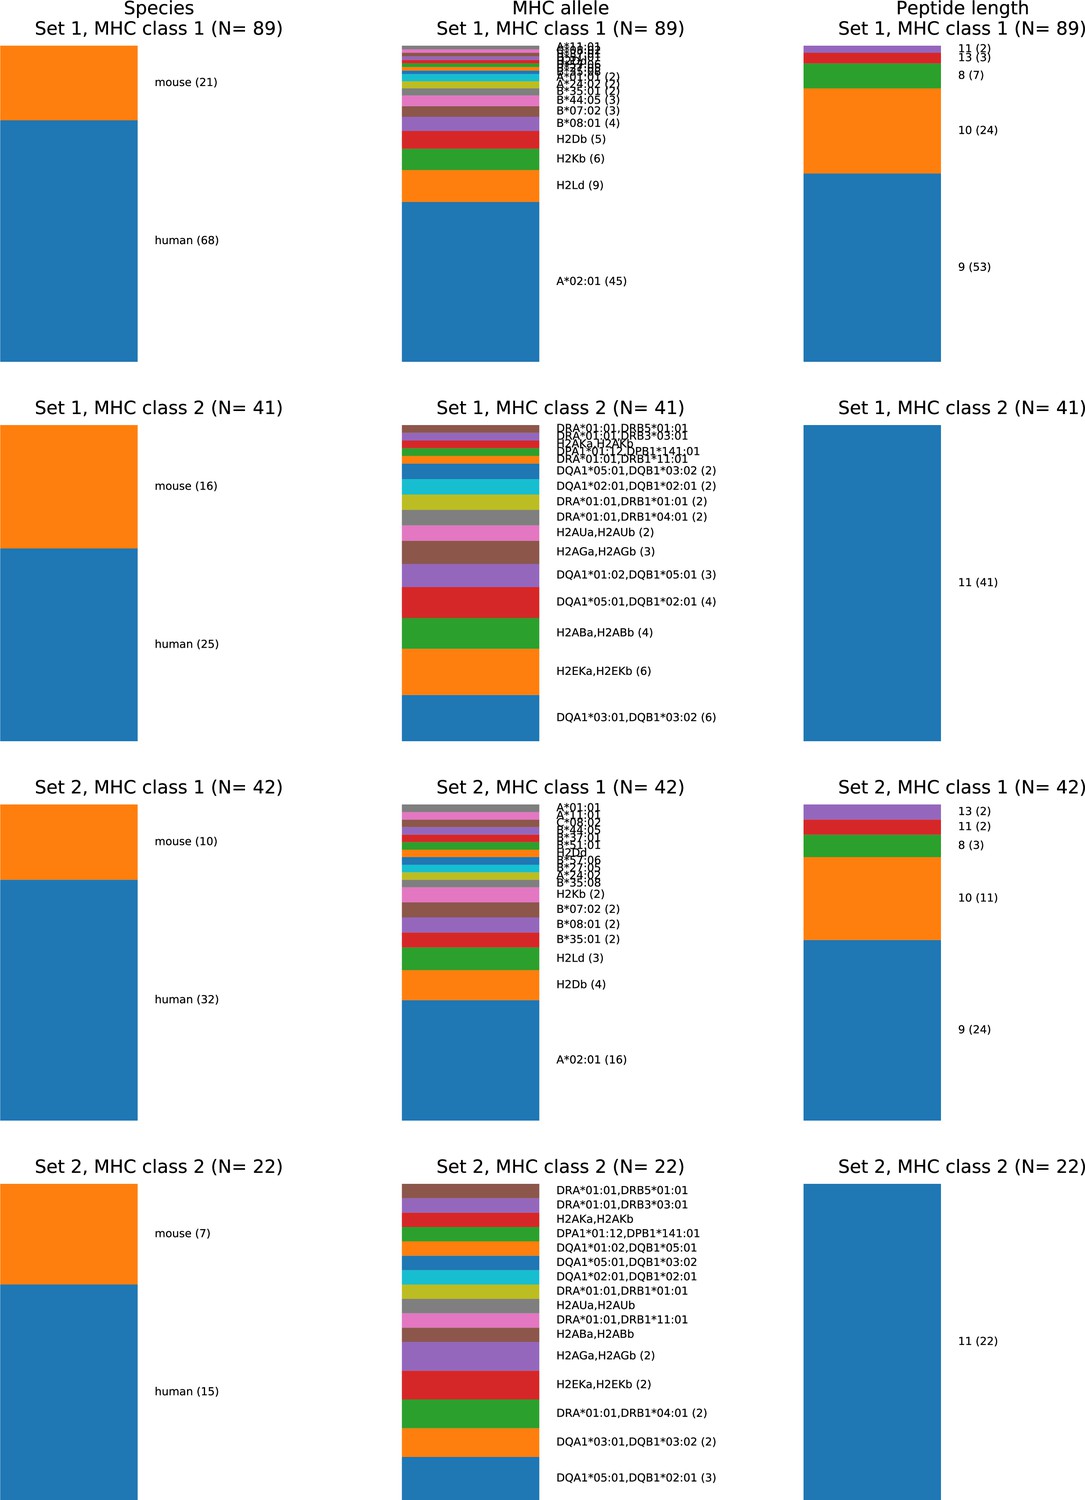
Composition of the TCR:pMHC ternary structure database.
Source organism (left column), MHC allele (middle column), and peptide length (right column) composition of two different nonredundant versions of the ternary database. In the first ('Set 1'), no two structures have both fewer than three peptide mismatches and a paired chain TCRdist distance less than 120. In the second ('Set 2'), no two structures have either fewer than three peptide mismatches or a paired chain TCRdist less than 120. Set 1 corresponds to the 130-member benchmark set used for method comparisons. MHC Class II peptides are trimmed to the common 9-residue core plus two residues on either side, making them length 11 by construction, consistent with the lack of insertions/deletions in the middle of the peptide. TCRs with distances less than 120 tend to share one or both V gene identities and similar CDR3 lengths and sequences, and are often found to bind the same epitope in TCR clustering studies (Dash et al., 2017; Minervina et al., 2022).
Figure 2—figure supplement 2
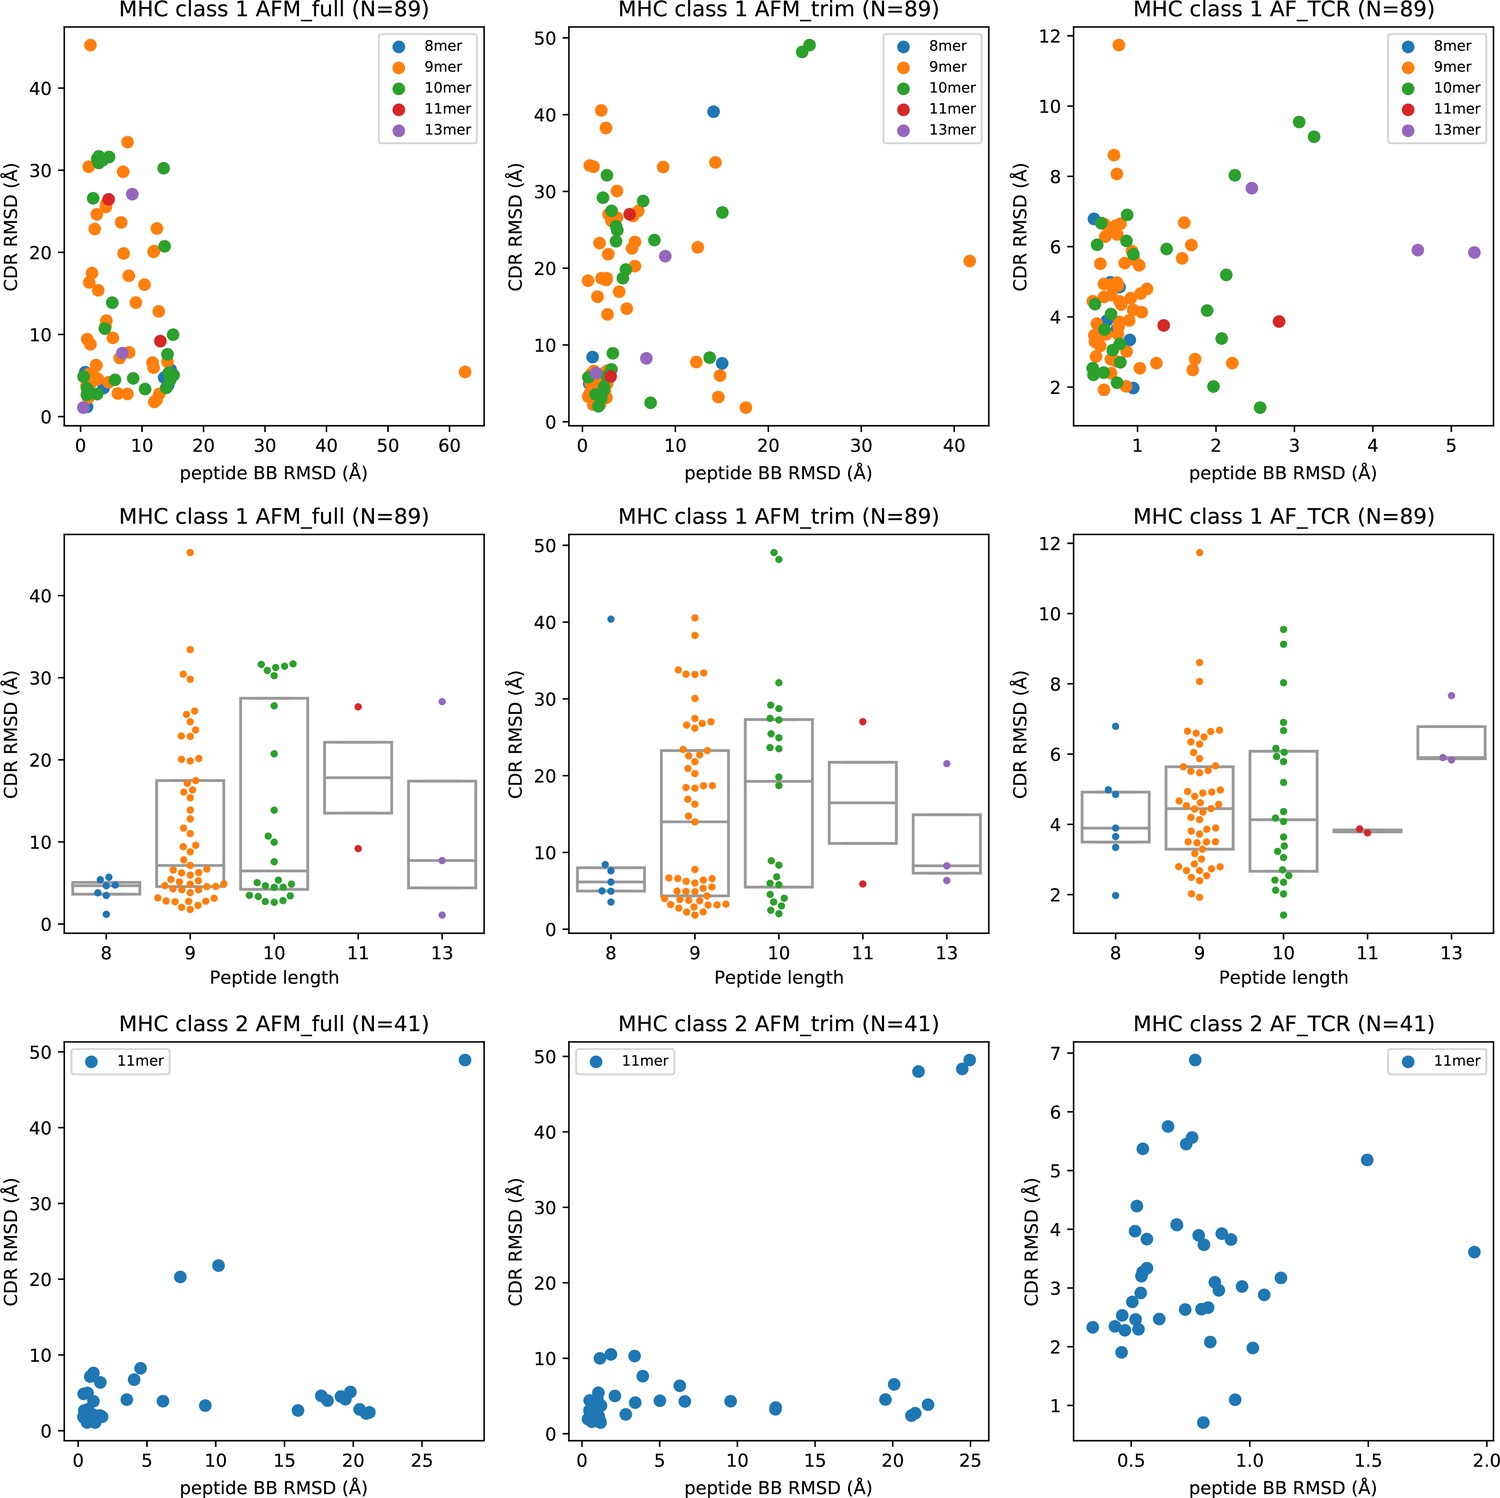
Peptide structural modeling accuracy.
Peptide backbone RMSD (rows 1 and 3) and peptide length (row 2) versus CDR RMSD for MHC class I (rows 1–2) and MHC class II (row 3). CDR RMSD is calculated by first superimposing the model and the native structure using the MHC coordinates, and then computing the RMSD over the CDR loop residues without further superposition. In the RMSD calculation, a weight of three is applied to the CDR3 coordinates to reflect their greater role in peptide specificity. Peptide backbone (BB) RMSD is computed over the N, CA, C, and O atoms after superimposing the modeled and native MHC coordinates.
Figure 2—figure supplement 3

TCR:pMHC modeling performance.
(A–B) Comparison between the AlphaFold-TCR pipeline and the TCRpMHCmodels software on MHC class I targets. The TCRpMHCmodels calculation was run locally, and nearby templates were excluded using the '--blacklist' command line option (applying the same exclusion criteria used in the AF_TCR calculations). (C) Comparison between the AlphaFold-TCR pipeline and a simple protocol that borrows the docking geometry from the most sequence-similar ternary structure template. Sequence similarity is calculated over the concatenated MHC, peptide, and TCR chains with a uniform residue weight ('SeqID(unwtd)') or upweighting residues inversely proportional to chain length, to equalize contributions from the peptide, MHC, TCRalpha, and TCRbeta chains. P values correspond to the larger of the Wilcoxon and paired t test 2-sided P values comparing the indicated RMSD distributions.
Figure 2—figure supplement 4
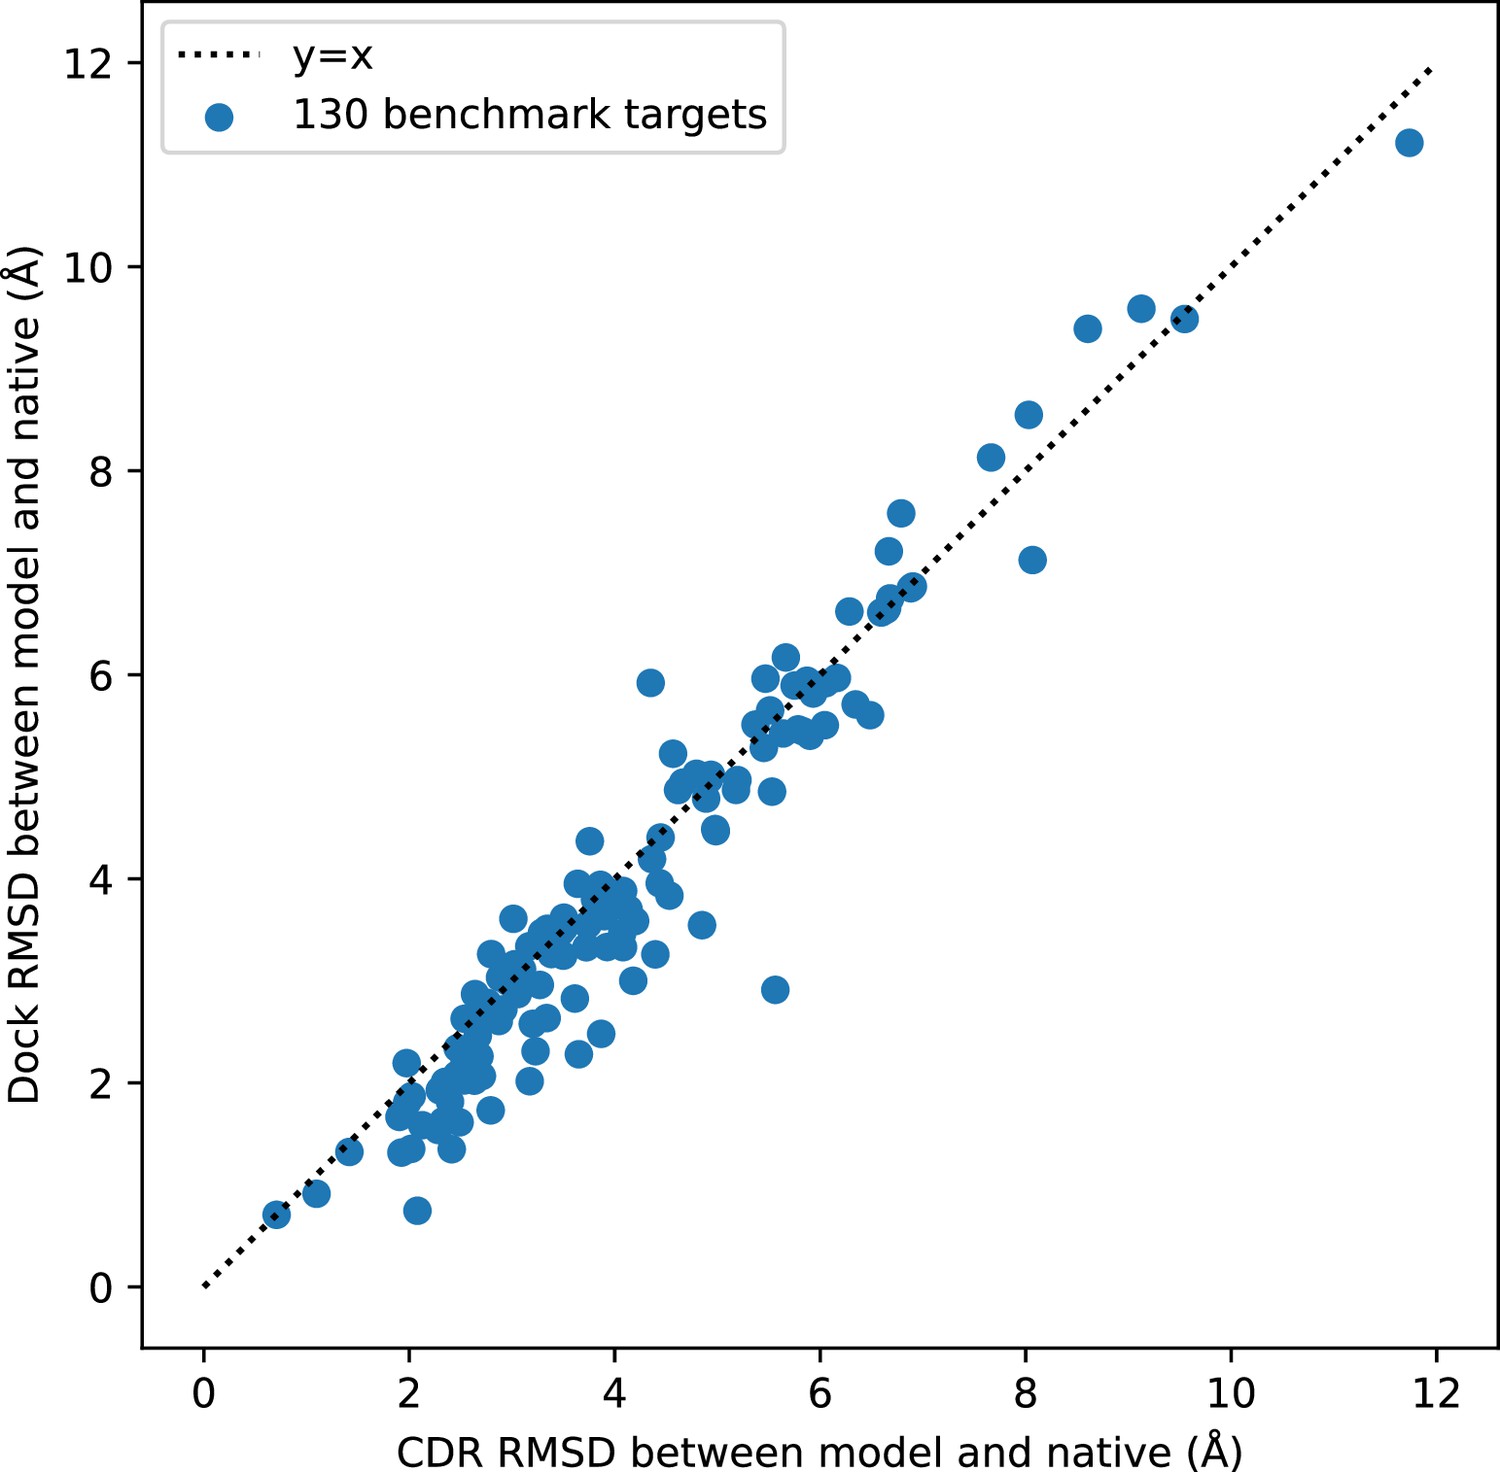
Comparison of docking RMSD to CDR RMSD.
Docking RMSD and CDR RMSD are well correlated. CDR RMSD tends to be larger than docking RMSD because it also includes deviation in the internal structures of the CDR loops.
Figure 2—figure supplement 5
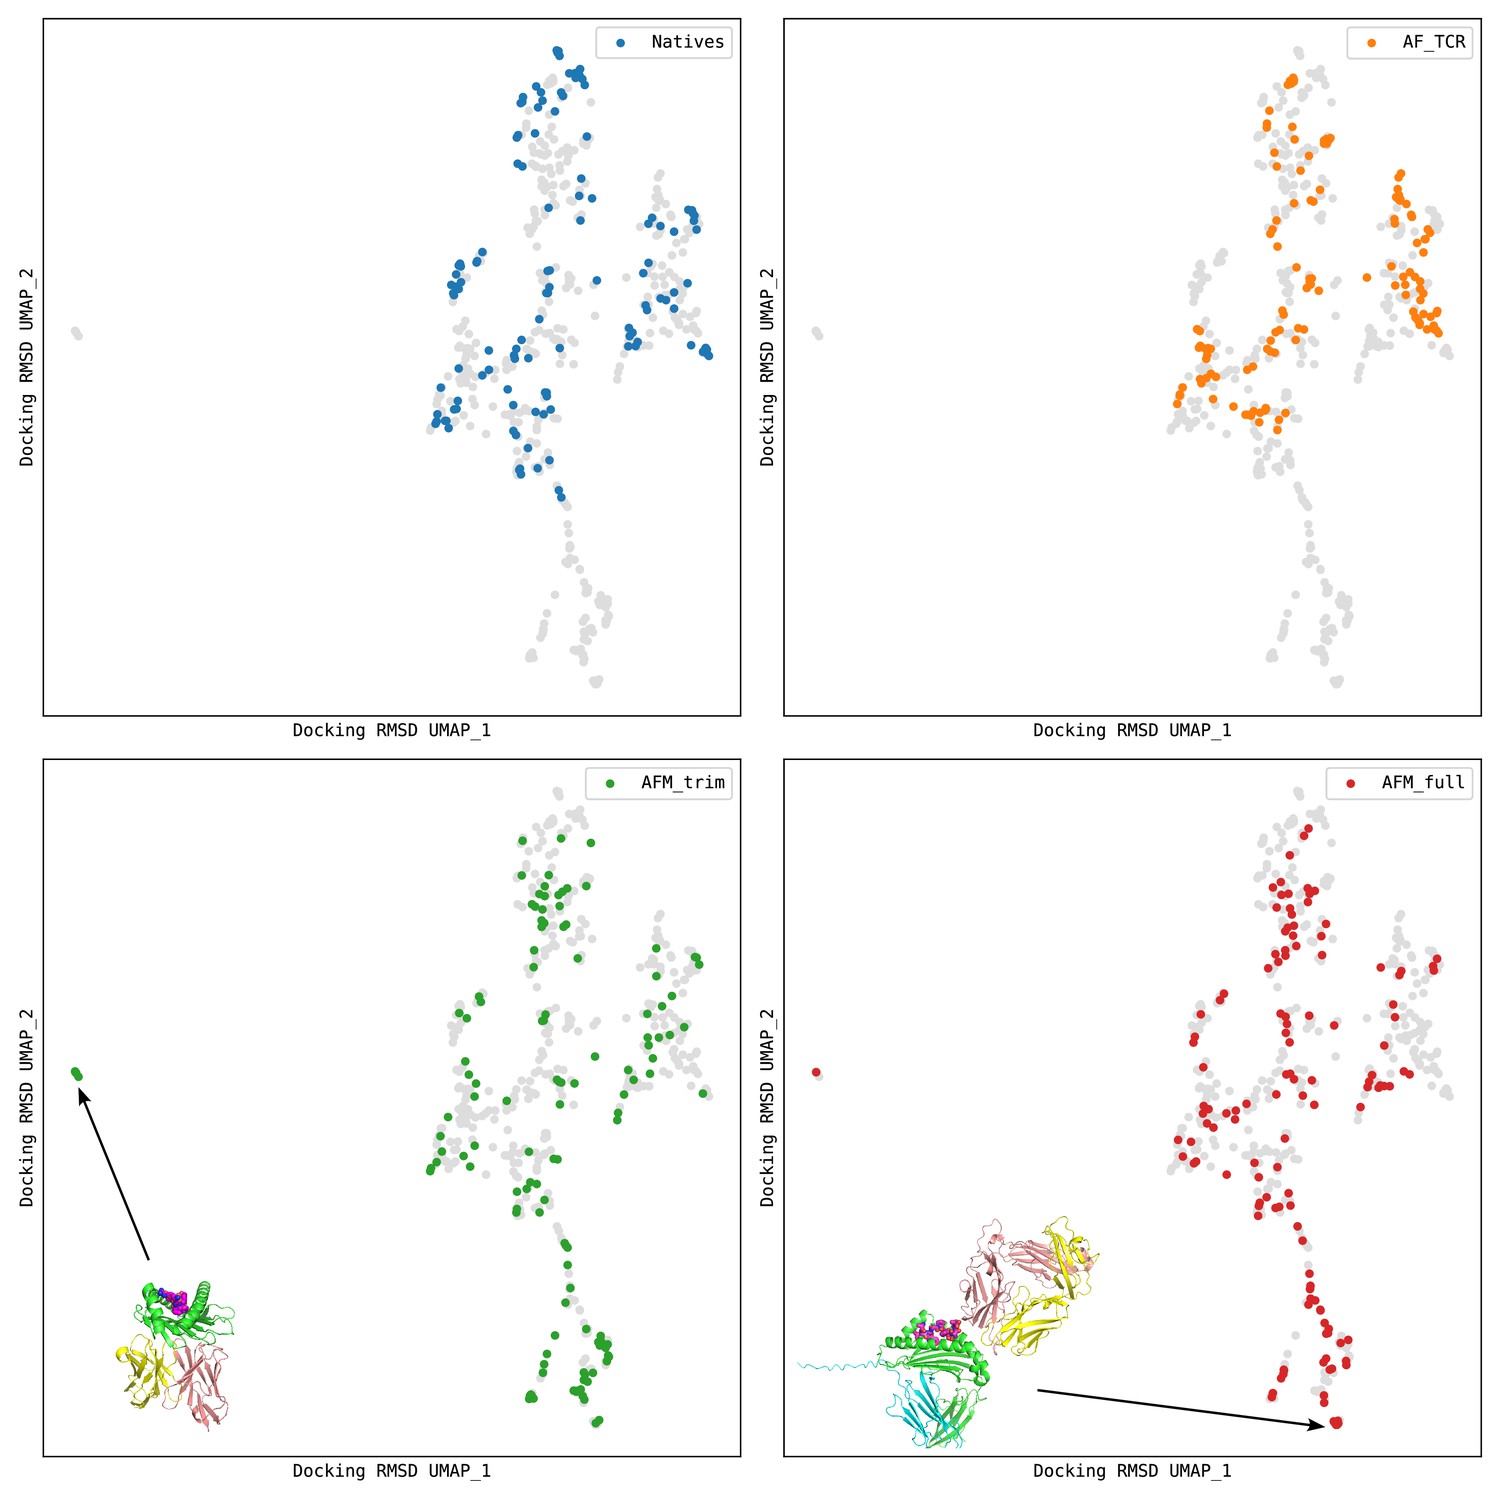
Docking geometry landscapes for the structure prediction benchmark.
The UMAP (McInnes et al., 2018) algorithm was used to transform a matrix of docking RMSD distances into a 2D landscape projection of the 130 native structures and the models from the AlphaFold TCR pipeline ('AF_TCR') and from two variants of the AlphaFold-Multimer model ('AFM_trim' and 'AFM_full'). Regions of docking space not sampled by the natives can be seen at the far left and bottom of the landscapes. Representative AlphaFold-Multimer models are shown: in the bottom left panel, a TCR docked to the underside of the MHC; in the bottom right panel, a TCR docked to the side of the MHC and not making contacts with the peptide. In each panel, structures from one source are colored as indicated in the legend, and the remaining points are gray.
Figure 2—figure supplement 6
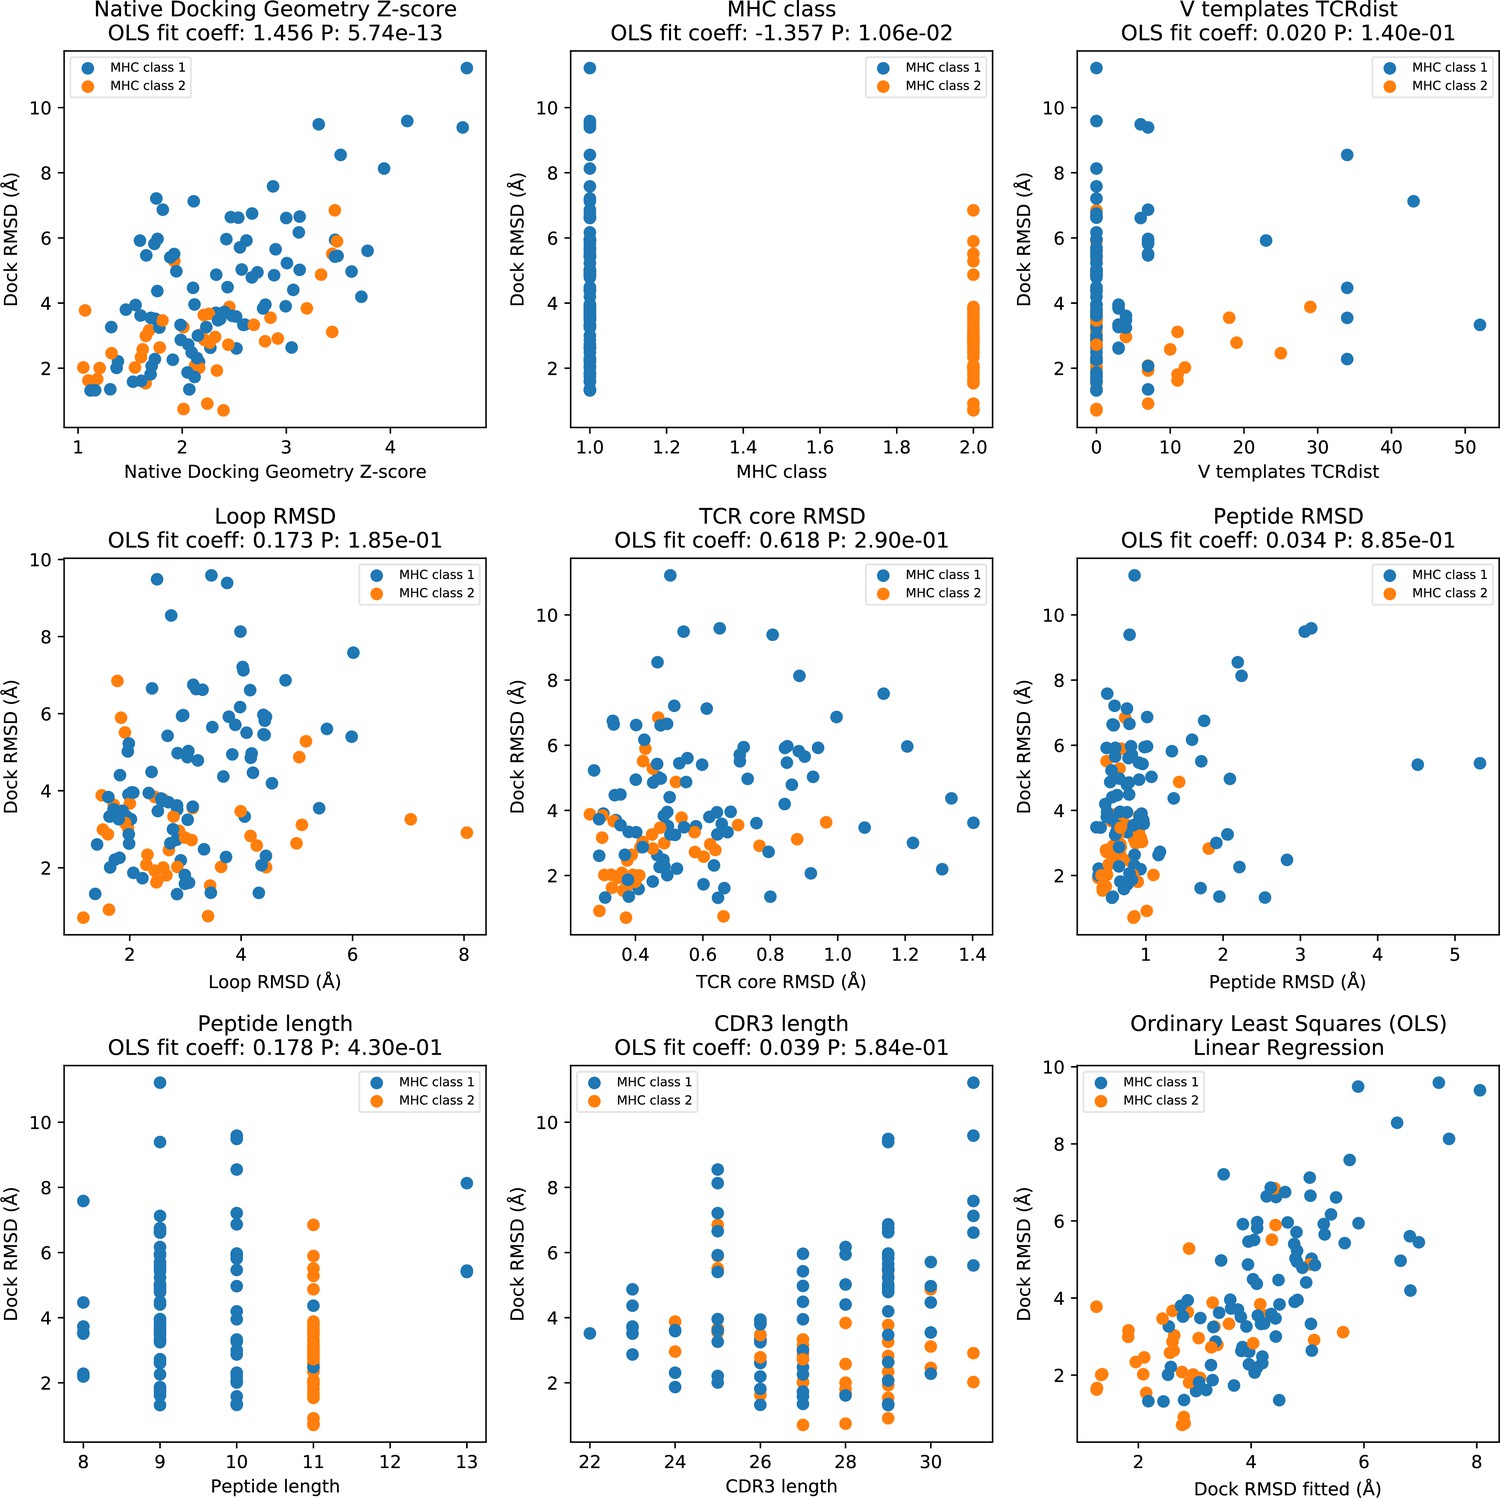
Factors influencing AF_TCR docking accuracy.
Ordinary least squares (OLS) linear regression was used to identify factors influencing the docking accuracy of AF_TCR models. In all panels, the y-axis corresponds to the Dock RMSD of the final AF_TCR model. In panels 1–8 (top left to bottom middle), a single feature (named in the panel title) is plotted on the x-axis. The panel title indicates the coefficient assigned to each feature in the fitted linear regression model as well as the p value assigned to the feature (which reflects the strength of its influence on docking RMSD). 'Native docking geometry Z-score' is a measure of the distance between the docking geometry in the native structure and the mean docking geometry of all ternary structures in the same MHC class (defined using the Mahalobis distance to account for correlations between the six parameters defining docking geometry); outlier docking geometries will have larger values. This is by far the largest contributor to the accuracy of the AF_TCR model. 'V templates TCRdist' is the sum of the V gene TCRdist for the closest TCR alpha and beta templates; values of 0 mean that both the V genes in the target TCR are found in an unrelated template structure and hence available for modeling. 'Loop RMSD' measures the accuracy of the CDR loop structure in the TCRalpha and TCRbeta CDR loops, ignoring alpha/beta pairing geometry and docking geometry. It is calculated for each chain separately by superimposing on the single-chain TCR core residues (Figure 1—figure supplement 1) and upweighting the CDR3 by a factor of 3; the final value is the sum of the alpha and beta chain RMSDS. 'TCR core RMSD' is calculated by superimposing the 26 TCR core residues (13 from each chain) of the model onto the native structure; it mainly reflects the accuracy of the alpha/beta pairing geometry, since the core residue positions are well conserved within each TCR chain structure. 'Peptide RMSD' records the backbone atom (N, CA, C, O) RMSD between modeled and native peptides after superimposing on the MHC coordinates. The bottom right panel shows the OLS fitted RMSD (x-axis) versus the actual Dock RMSD (y-axis).
Figure 3
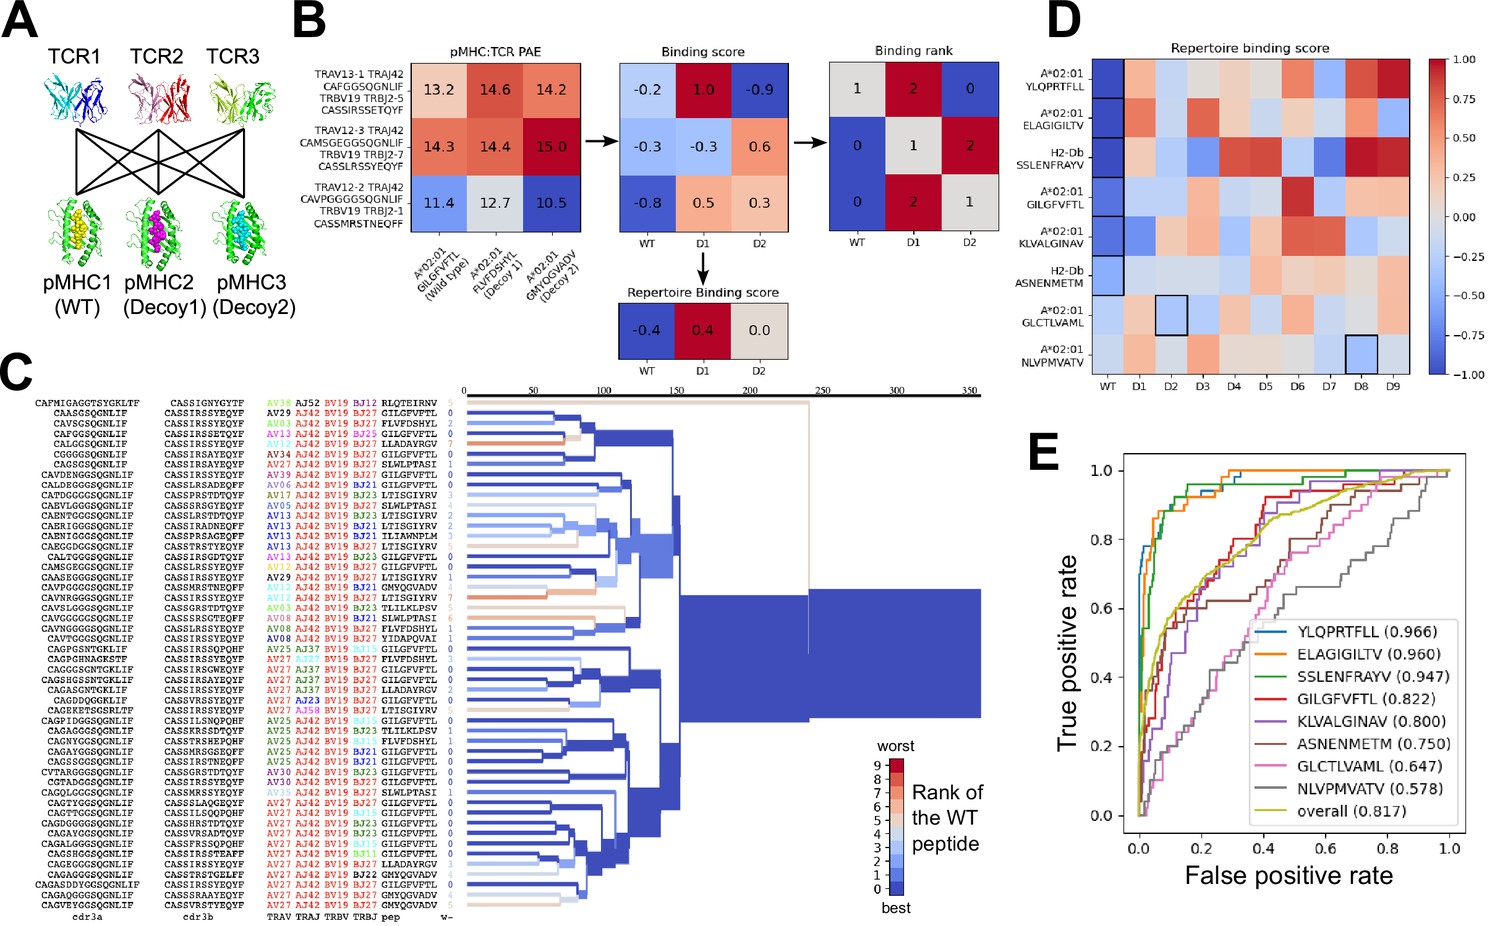
Structural modeling can sometimes discriminate correct from incorrect TCR:pMHC pairings.
(A) For each of the eight peptide:MHC epitopes, we docked multiple cognate TCRs against multiple decoy peptides and the wild type epitope. Here three TCRs and three pMHCs are shown; 9 decoys and up to 50 TCRs were actually modeled. (B) For each candidate TCR:pMHC pairing, the mean AlphaFold predicted aligned error (PAE) for the TCR:pMHC interface was calculated (left) and transformed into a binding score by subtracting out TCR-intrinsic and pMHC-intrinsic factors (middle). These binding scores were averaged to define a repertoire-level binding score for the WT epitope and each of the decoys (bottom). Also calculated was the rank of the WT binding score within the list of all the binding scores for each TCR (right). (C) TCRdist hierarchical clustering tree of the 50 modeled TCRs for the A*02:01 GIL9 epitope, labeled with the TCR sequence information, top-ranked peptide, and rank of the WT peptide, and colored by the rank of the WT peptide. Internal edges, which correspond to multiple ‘leaf’ TCRs, are colored by the rank of the WT peptide after averaging the binding scores over the leaf TCRs. (D) Repertoire binding scores for each of the eight target epitopes and the 9 decoy peptides, with the lowest (most favorable) binding score in each row boxed. (E) Receiver operating characteristic (ROC) curves for discrimination of WT from decoy peptides by binding score. Area under the ROC curve (AUROC) values are given in the legend along with the sequence of the WT peptide.
-
Figure 3—source data 1
Epitope specificity benchmark TCRs.
CSV file containing information on the TCR sequences in the epitope decoy discrimination benchmark.
- https://cdn.elifesciences.org/articles/82813/elife-82813-fig3-data1-v1.csv
-
Figure 3—source data 2
Epitope specificity benchmark peptides.
CSV file containing information on the peptides in the epitope decoy discrimination benchmark.
- https://cdn.elifesciences.org/articles/82813/elife-82813-fig3-data2-v1.csv
Figure 4 with 1 supplement
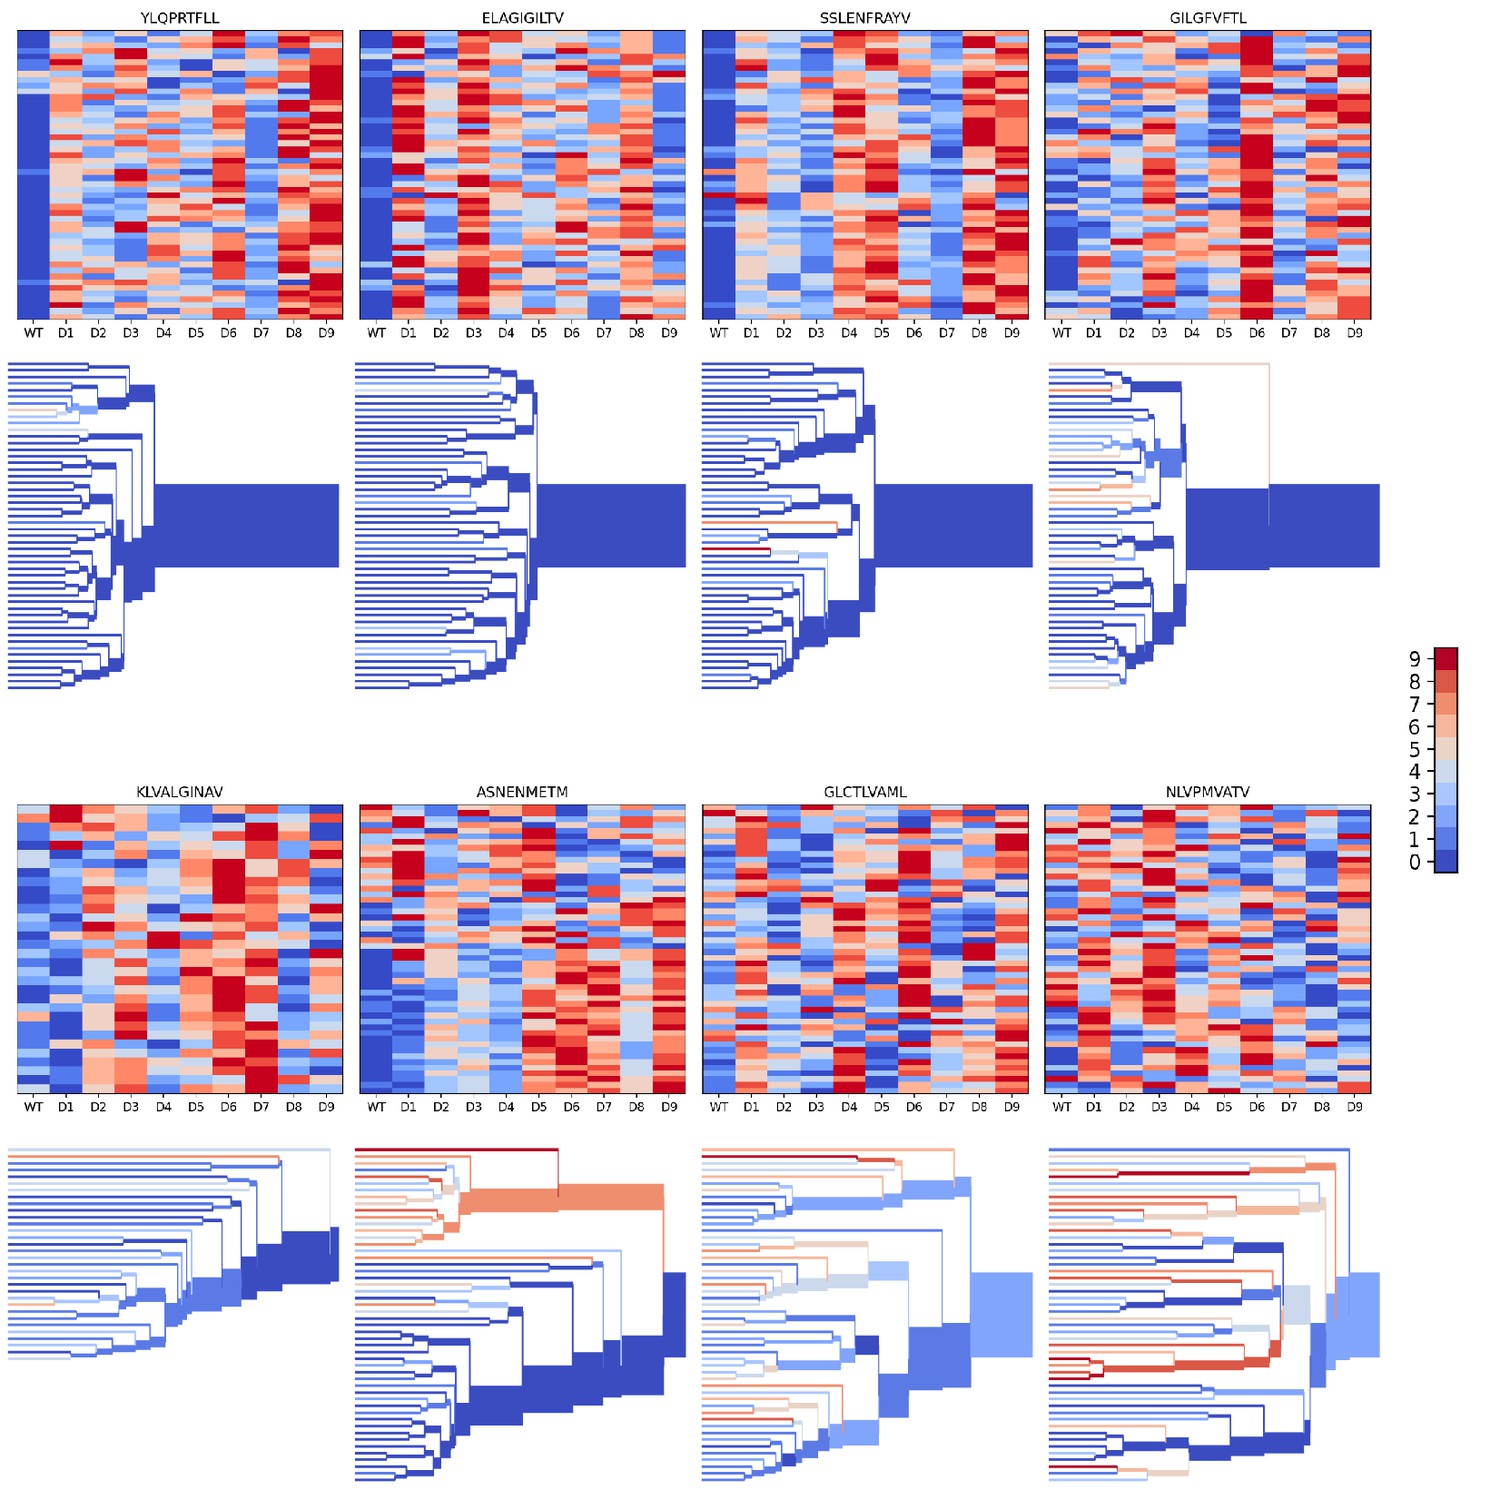
Peptide decoy discrimination results for the eight benchmark epitopes.
The rank of the wild type peptide relative to the 9 decoys (0=best, 9=worst) is shown in a heatmap and a TCRdist hierarchical clustering tree of the epitope-specific TCRs. Each row of the heatmap corresponds to a single TCR; each column corresponds to one of the 10 modeled peptides, with the wild type peptide on the left. The vertical ordering of the TCRs in the heatmaps and trees is the same. Internal edges of the trees, which correspond to multiple ‘leaf’ TCRs, are colored by the rank of the wild type peptide after averaging the binding scores over the leaf TCRs.
Figure 4—figure supplement 1
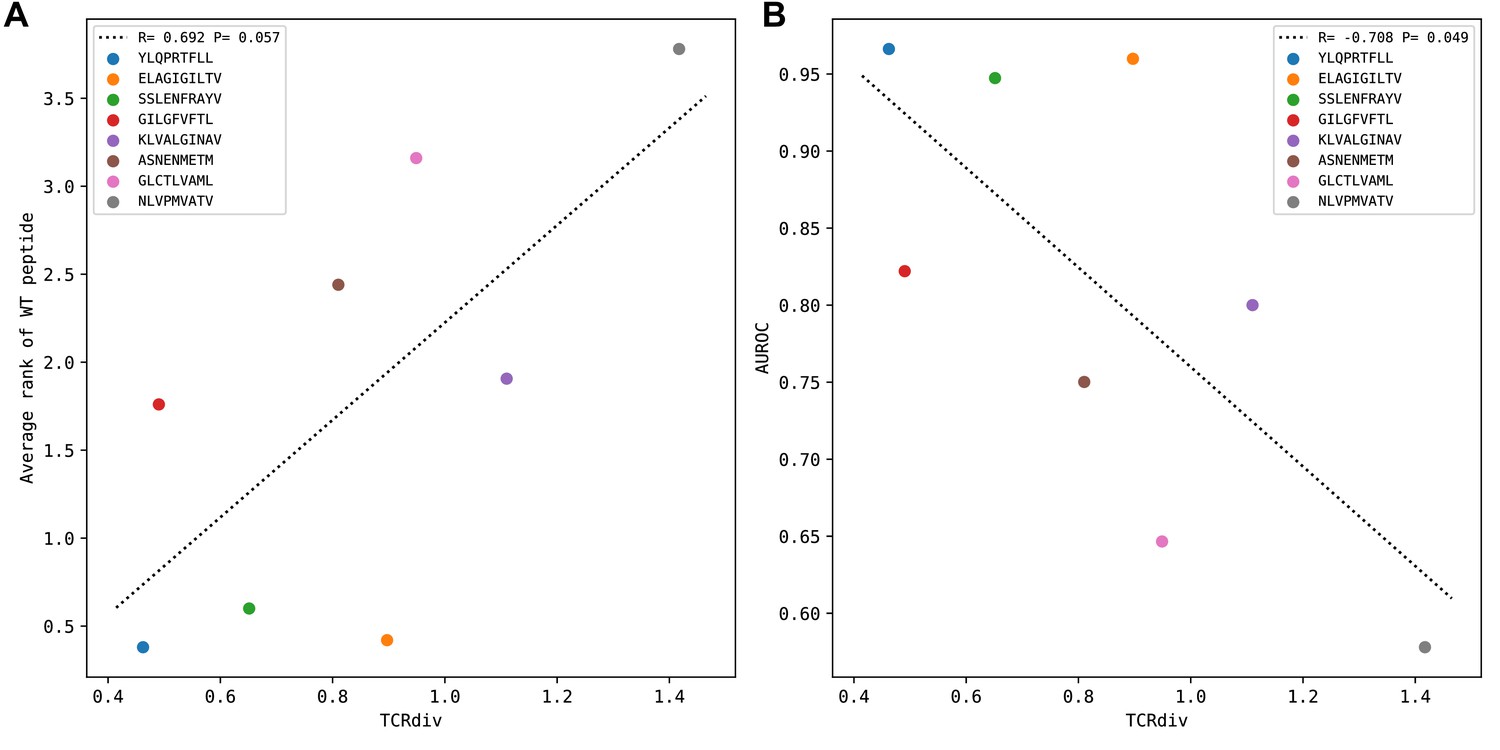
Peptide specificity prediction accuracy is inversely correlated with repertoire sequence diversity.
TCR repertoire sequence diversity is measured with the TCRdiv measure (Dash et al., 2017) with a sigma value of 120. Each colored marker corresponds to one of the eight benchmark epitopes as indicated in the legend. (A) For each epitope, the average rank of the wild type peptide relative to the nine decoys (0=best binding score; 9=worst binding score) is calculated over all the epitope-specific TCRs and plotted against the TCRdiv score for the corresponding TCR repertoire. (B) TCRdiv scores are plotted against the area under the receiver operating characteristic curve (AUROC) values for discriminating the wild type from decoy peptides by binding score.
Figure 5 with 2 supplements
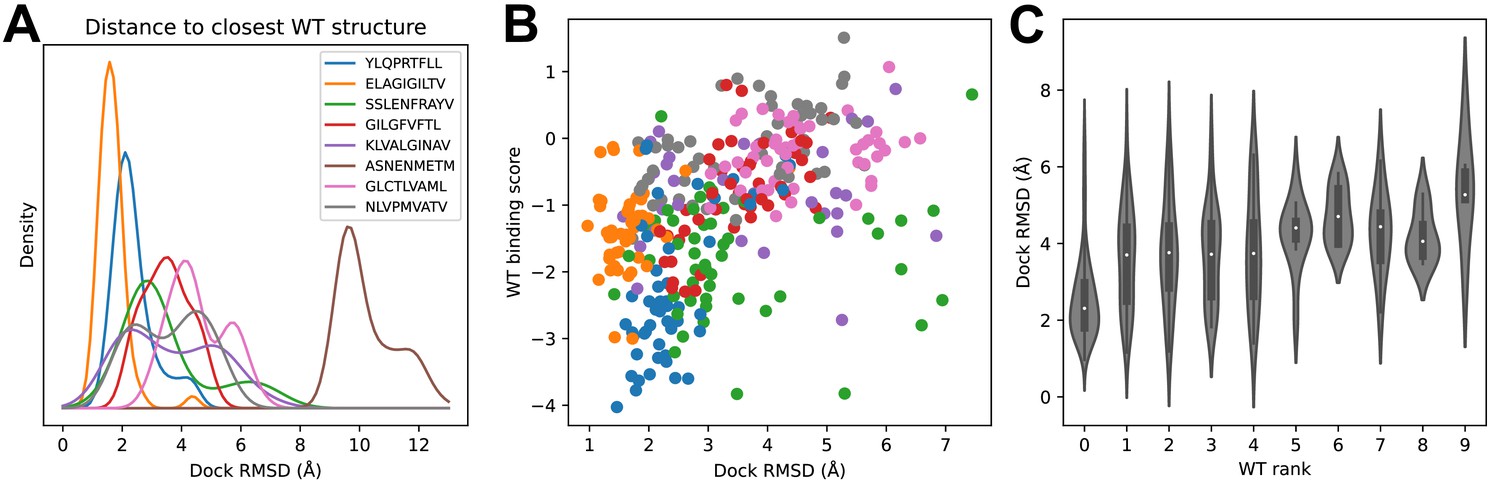
Success in decoy discrimination correlates with structural modeling accuracy.
(A) For each TCR, the structural model in complex with the wild type epitope was compared to all experimentally determined ternary structures for that epitope and the smallest docking RMSD was recorded. The resulting RMSD distributions were smoothed using kernel density estimation and plotted. (B) Scatter plot of docking RMSD to the nearest wild type structure versus the binding score for the wild type peptide. Favorable wild type binding scores correlate with lower RMSD values. (C) Distributions of docking RMSD to the nearest wild type structure (y-axis) as a function of the rank of the wild type peptide (x-axis). When the wild type peptide is ranked first (left violin), the corresponding docking geometries are more similar to those of ternary complexes for that epitope, suggesting higher accuracy.
Figure 5—figure supplement 1
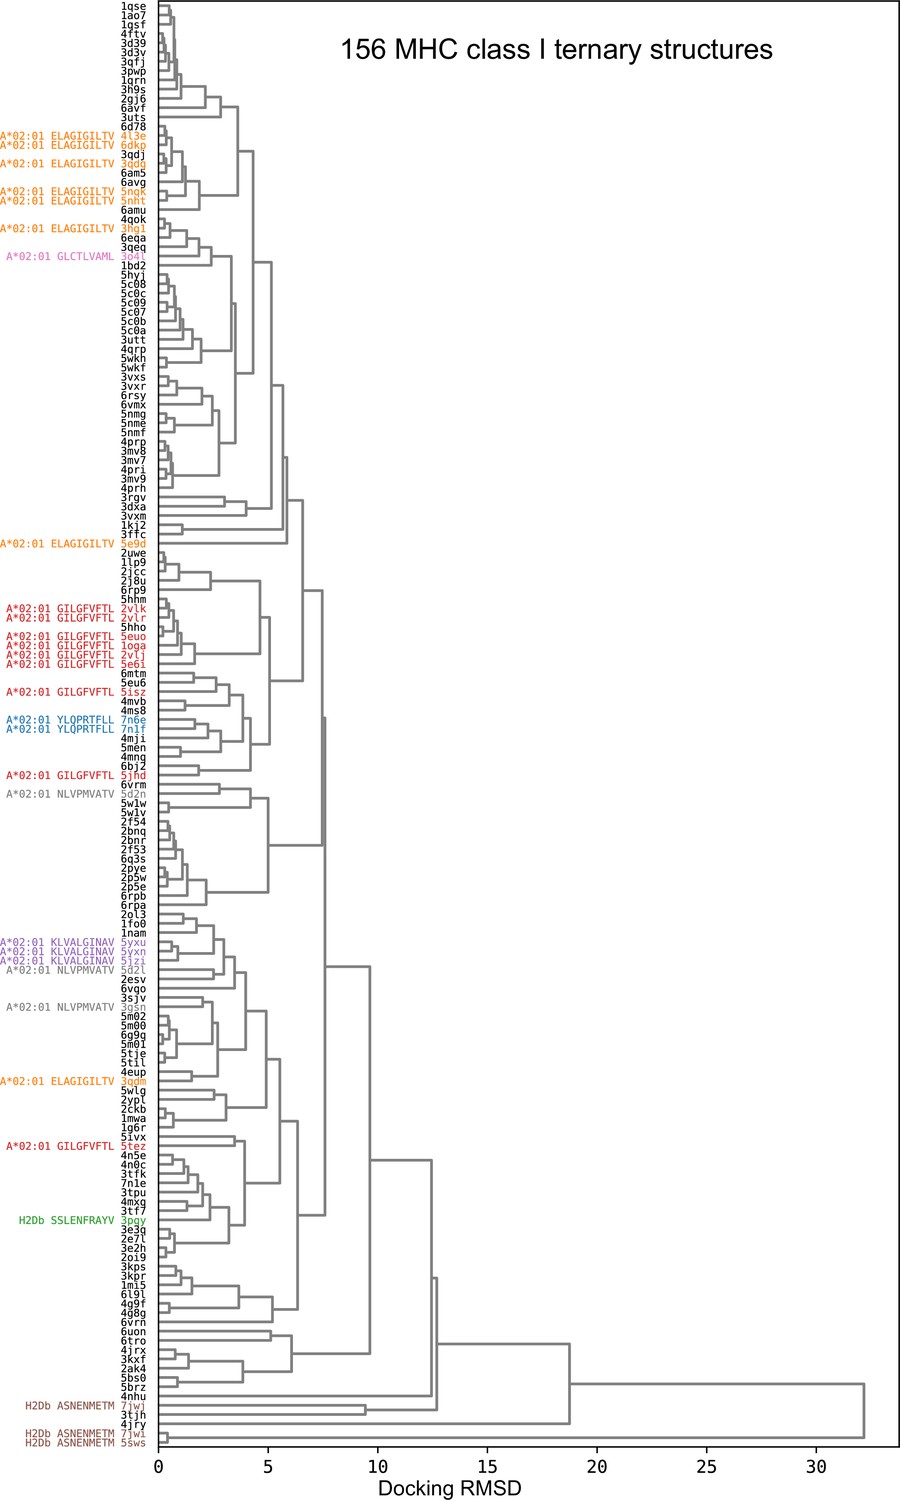
Hierarchical clustering tree of TCR:pMHC class I docking geometries.
Figure 5—figure supplement 2

Peptide backbone accuracy in the specificity benchmark.
(A) For each TCR, the structural model in complex with the wild type epitope was compared to all experimentally determined ternary structures for that epitope and the median peptide backbone RMSD was recorded. The resulting RMSD distributions were smoothed using kernel density estimation and plotted. (B) Scatter plot of peptide backbone RMSD versus the binding score for the wild type peptide. The correlation between more favorable (lower) wild type binding scores and lower RMSD values is much weaker than that seen for docking RMSDs in Figure 5B. (C) Distributions of peptide backbone RMSD (y-axis) as a function of the rank of the wild type peptide (x-axis). When the wild type peptide is ranked first (left violin), the corresponding peptide backbone RMSDs are slightly lower, although the trend is again weaker than that seen for docking RMSDs in Figure 5C.
Figure 6 with 1 supplement
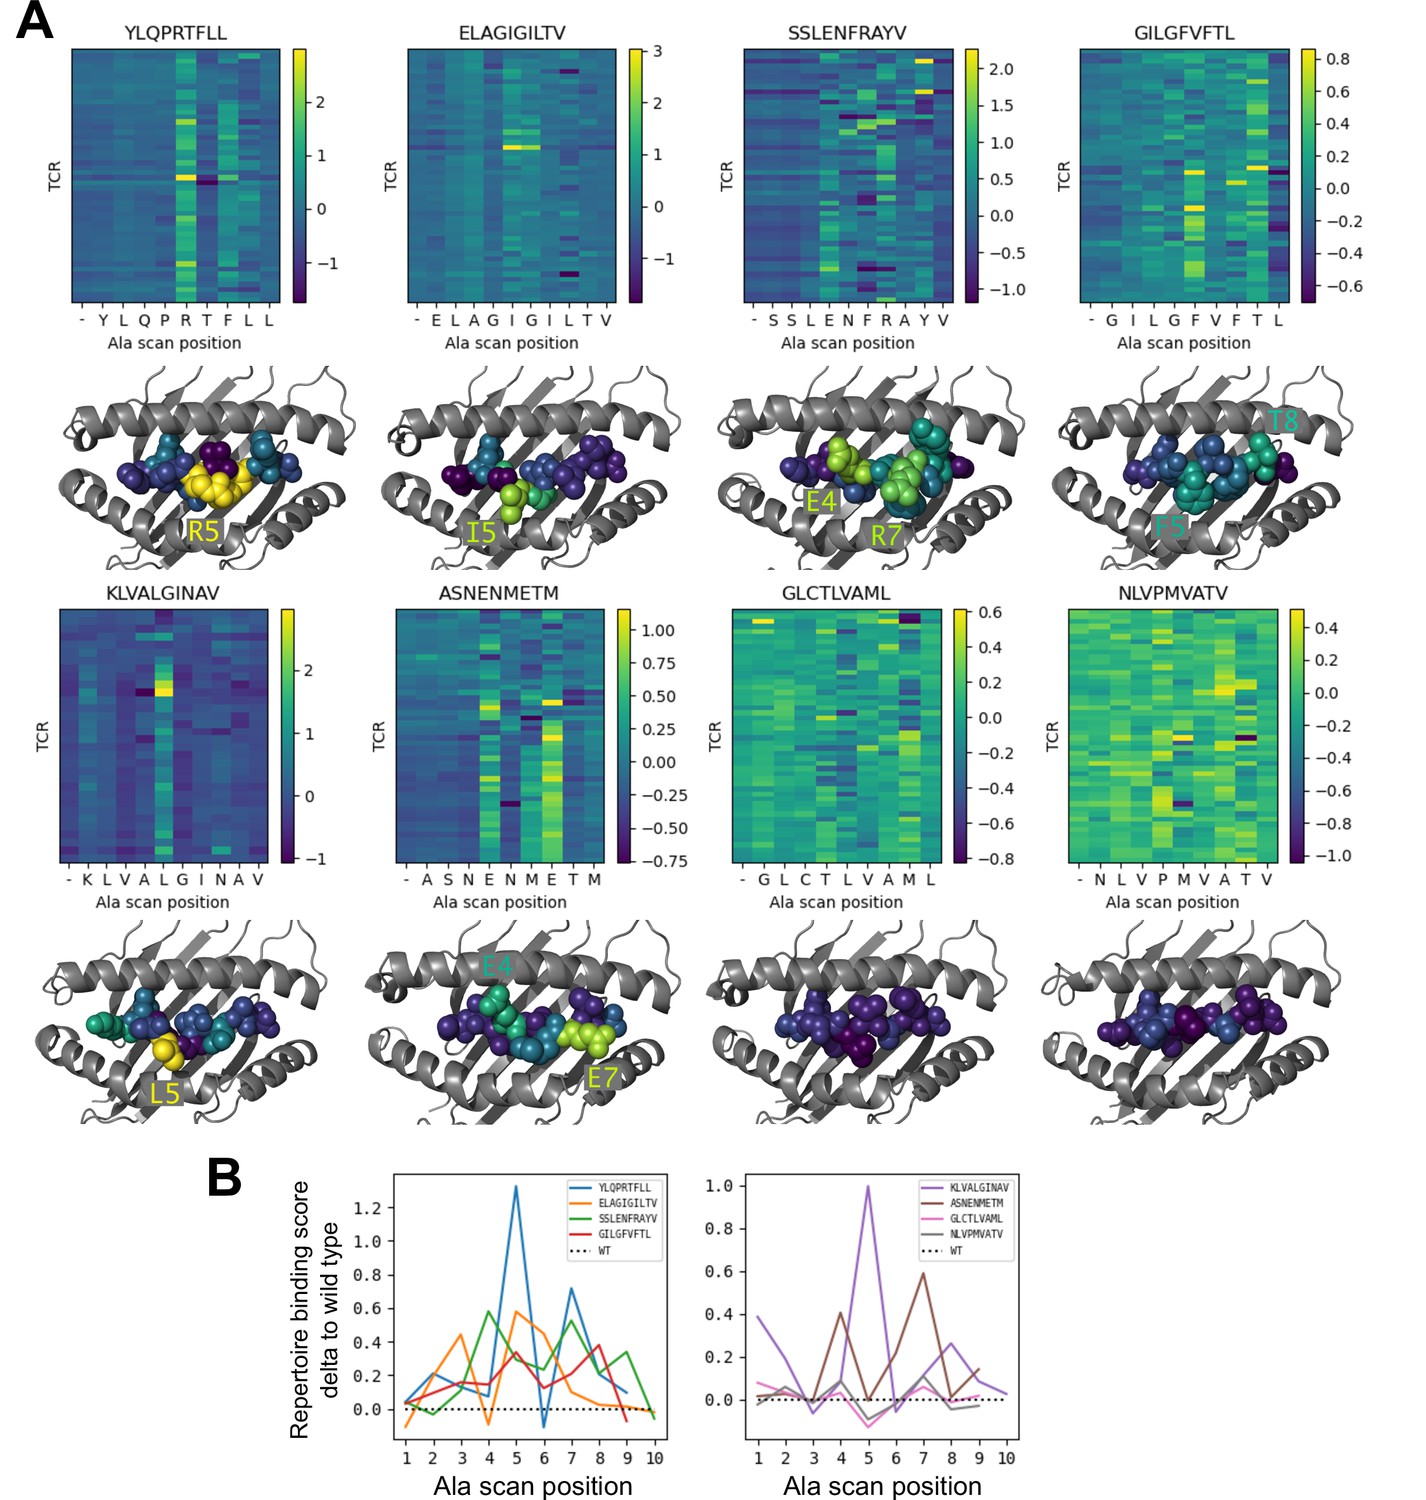
Alanine scanning results for the eight benchmark epitopes.
(A) Heatmaps showing the binding scores for the wild type peptide (left column) and all single-alanine mutants (columns labeled with the wild type sequence) in complex with each TCR (rows). Below each heatmap, the wild type pMHC crystal structure is shown with the peptide colored by the delta between mutant and wild-type repertoire-averaged binding scores. (B) Line plots of the delta between the mutant and wild-type repertoire-averaged binding scores reflect the predicted repertoire-level sensitivity to epitope mutations.
Figure 6—figure supplement 1
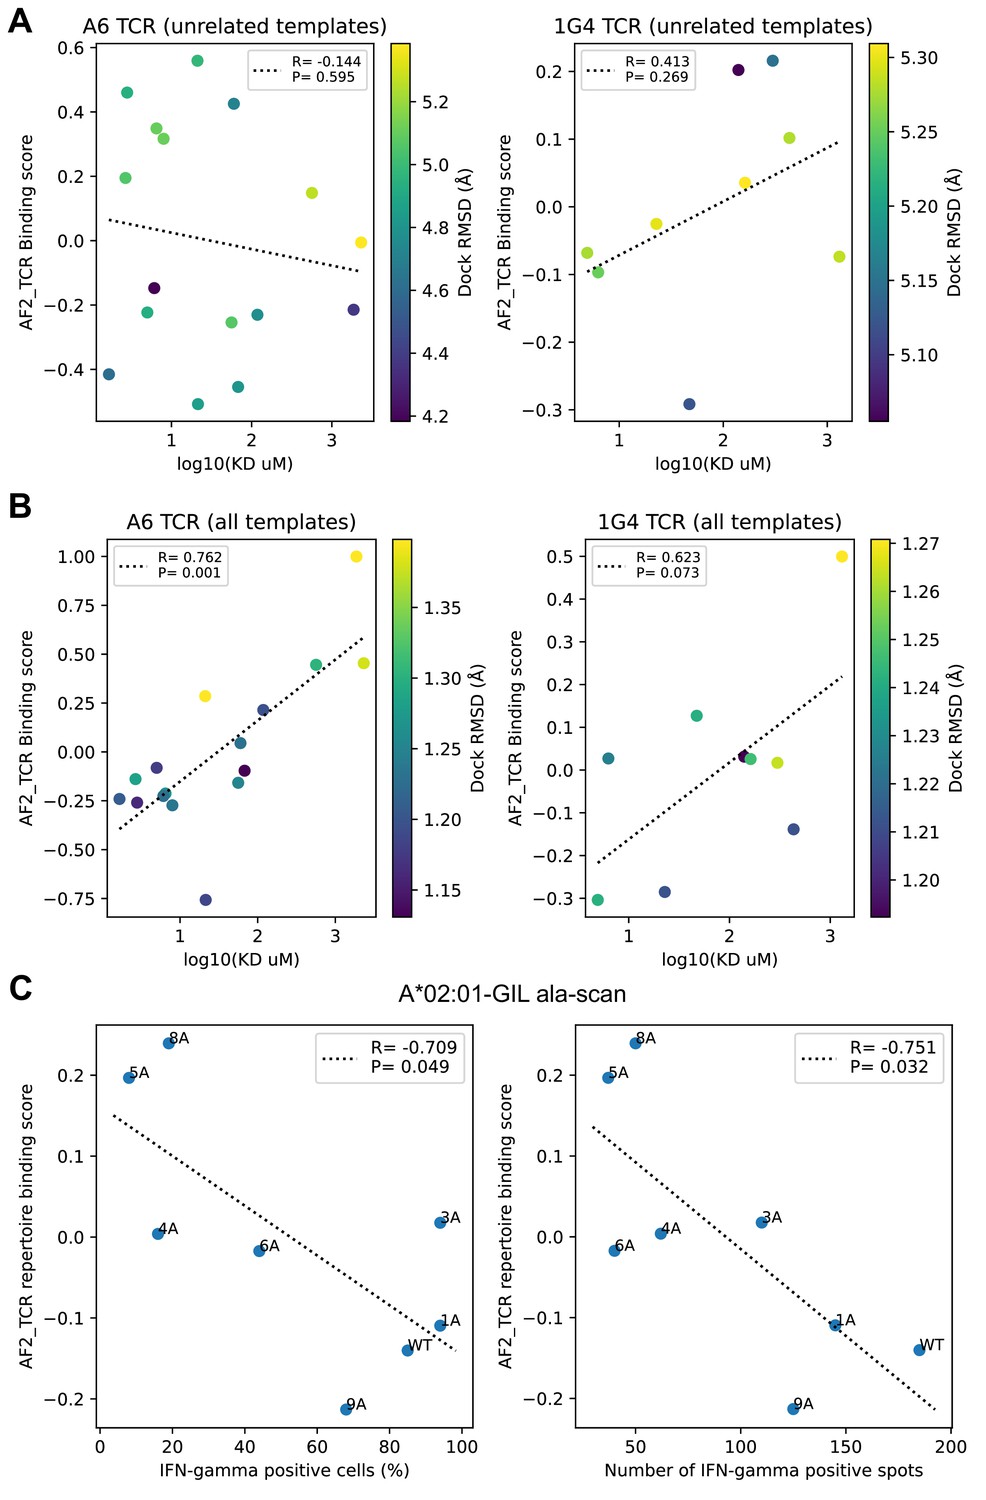
Comparison to experimental data on single TCRs binding altered peptide ligands.
(A–B) Experimental binding affinities for the A6 and 1G4 TCRs were taken from Pettmann et al., 2021 Figure 1 source data, 'Bmax constrained' KD values. (A) Binding predictions generated without related templates show poor correlation with experiment (lower binding scores and lower KD values correspond to tighter binding, so we would expect to see a positive correlation). (B) Inclusion of related templates in the modeling pipeline leads to improved binding predictions. (C) Activation data for single-alanine mutants of the A*02:01 restricted M158 epitope were taken from Figure 4 (Berkhoff et al., 2005) and plotted against the repertoire-level binding score for the M158 epitope (GILGFVFTL) from our alanine scanning simulations (Figure 6). Here, we see the expected association between lower binding scores (i.e. stronger predicted binding) and higher levels of activation, though the correlation is relatively weak.
Tables
Table 1
Binding specificity benchmark.
| Organism | MHC | Peptide length | Peptide sequence | Antigen |
|---|---|---|---|---|
| human | HLA-A*02:01 | 9 | GILGFVFTL | Flu M1 |
| human | HLA-A*02:01 | 9 | GLCTLVAML | EBV BMLF1 |
| human | HLA-A*02:01 | 9 | NLVPMVATV | CMV pp65 |
| human | HLA-A*02:01 | 9 | YLQPRTFLL | SARS-CoV-2 Spike |
| human | HLA-A*02:01 | 10 | ELAGIGILTV | human MART-1 |
| human | HLA-A*02:01 | 10 | KLVALGINAV | HCV POLG |
| mouse | H2-Db | 9 | ASNENMETM | Flu NP |
| mouse | H2-Db | 10 | SSLENFRAYV | Flu PA |
Additional files
Download links
A two-part list of links to download the article, or parts of the article, in various formats.
Downloads (link to download the article as PDF)
Open citations (links to open the citations from this article in various online reference manager services)
Cite this article (links to download the citations from this article in formats compatible with various reference manager tools)
Structure-based prediction of T cell receptor:peptide-MHC interactions
eLife 12:e82813.
https://doi.org/10.7554/eLife.82813


