STAT3 promotes RNA polymerase III-directed transcription by controlling the miR-106a-5p/TP73 axis
- School of Life Science and Health, Wuhan University of Science and Technology, China
- School of Materials and Metallurgy, Wuhan University of Science and Technology, China
Figures
Figure 1 with 1 supplement
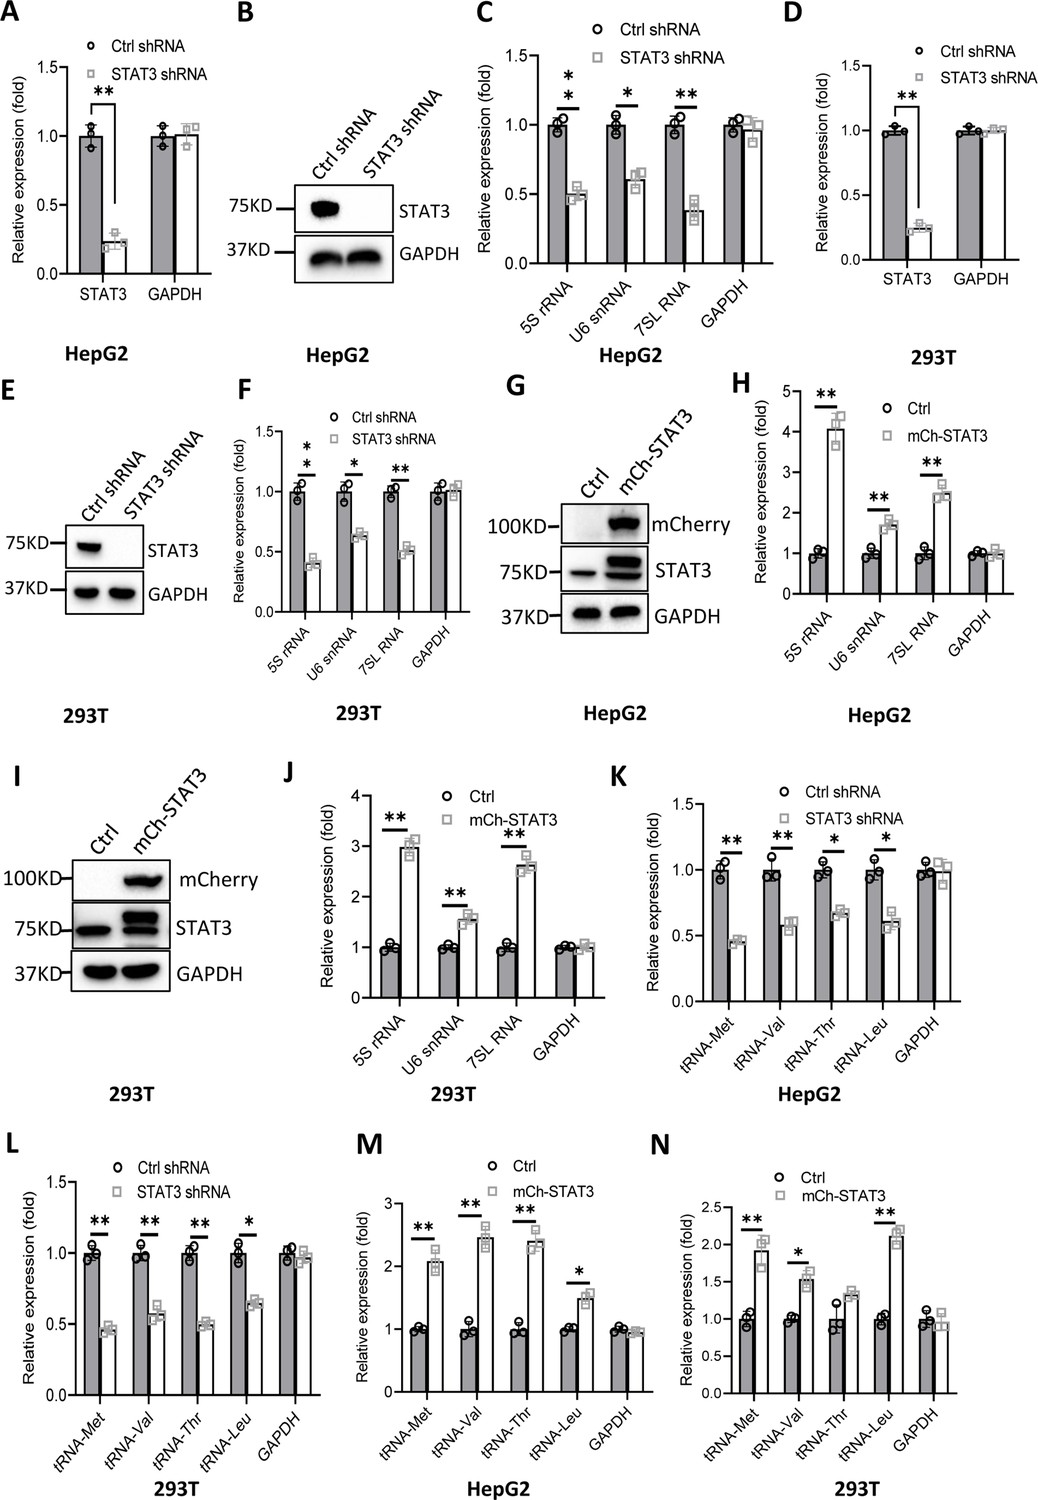
Effect of STAT3 expression alteration on the synthesis of Pol III products.
(A–C) STAT3 knockdown reduced the synthesis of Pol III products in HepG2 cells. HepG2 cell lines stably expressing STAT3 shRNA or control shRNA were generated by a lentiviral transduction system. STAT3 expression was analyzed by RT-quantitative PCR (qPCR) (A) and western blot (B). Pol III products were monitored by RT-qPCR (C). (D–F) STAT3 knockdown decreased the synthesis of Pol III products in 293T cells. 293T cell lines stably expressing STAT3 shRNA or control shRNA were generated as described in A and B. STAT3 expression (D and E) and Pol III products (F) were detected as described in A–C. (G and H) STAT3 overexpression activated the expression of Pol III products in HepG2 cells. A HepG2 cell line stably expressing mCherry-STAT3 shRNA and its control cell line was generated by a lentiviral transduction system. STAT3 protein and Pol III products were analyzed by western blot (G) and RT-qPCR (H), respectively. (I and J) STAT3 overexpression enhanced the expression of Pol III products in 293 cells. A 293T cell line stably expressing mCherry-STAT3 shRNA and its control cell line were generated using a lentiviral transduction system. STAT3 protein and Pol III products were detected by western blot (I) and RT-qPCR (J), respectively. (K and L) STAT3 silencing inhibited the expression of tRNA genes. The expression of tRNA genes randomly selected was monitored by RT-qPCR using HepG2 (K) and 293T (L) cell lines with STAT3 depletion. (M and N) STAT3 overexpression activated the expression of tRNA genes. HepG2 (M) and 293T (N) cell lines with STAT3 overexpression were used to analyze the expression of tRNA genes by RT-qPCR. Each column in A, C, D, F, H, and J–N represents the mean ± SD of three biological replicates (n=3). *, p<0.05; **, p<0.01. p Values were obtained by Student’s t test performed with data for the control and treated samples. Mean, SD and p values were calculated using GraphPad Prism 8 software.
-
Figure 1—source data 1
Raw images for Western blot data in Figure 1B, E, G and I.
- https://cdn.elifesciences.org/articles/82826/elife-82826-fig1-data1-v2.zip
-
Figure 1—source data 2
Original digital data in Figure 1.
- https://cdn.elifesciences.org/articles/82826/elife-82826-fig1-data2-v2.xlsx
Figure 1—figure supplement 1
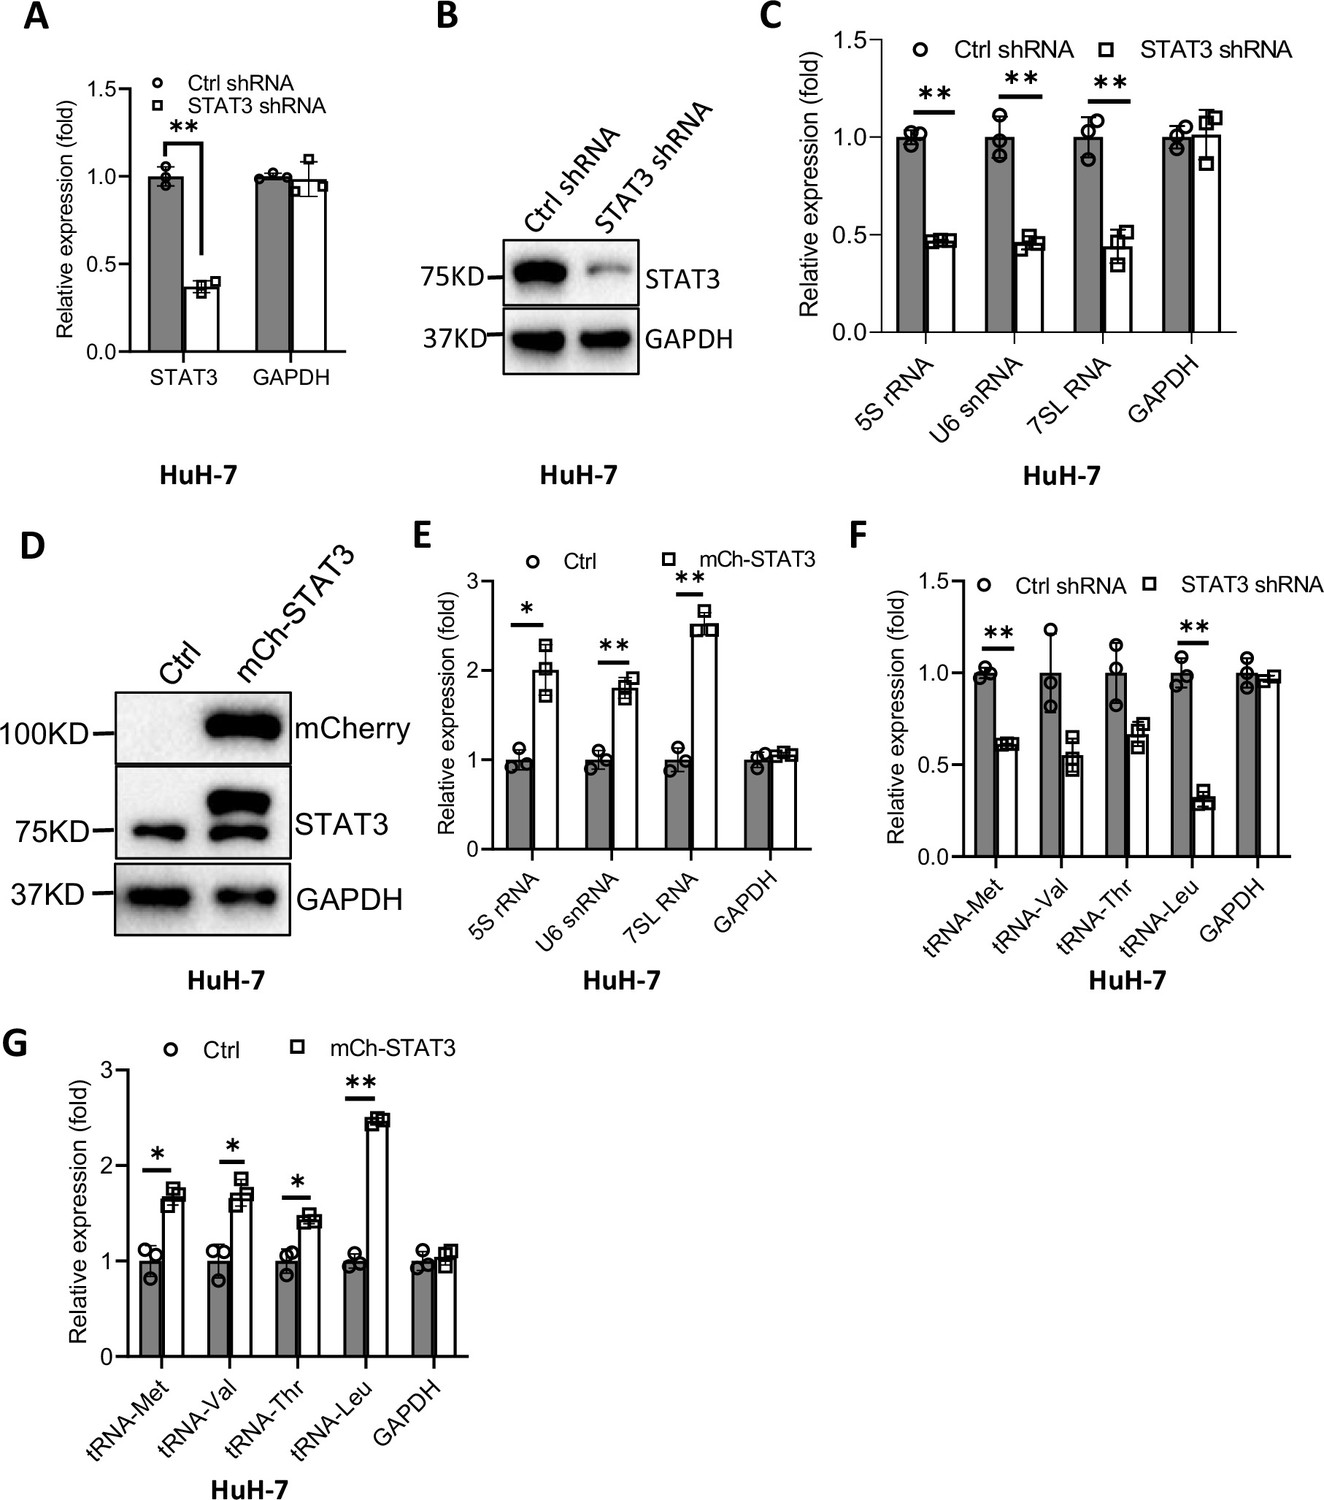
Effect of STAT3 expression alteration on Pol III-dependent transcription in HuH-7 cells.
-
Figure 1—figure supplement 1—source data 1
Raw images for Western blot data in Figure 1—figure supplement 1.
- https://cdn.elifesciences.org/articles/82826/elife-82826-fig1-figsupp1-data1-v2.zip
-
Figure 1—figure supplement 1—source data 2
Original digital data for Figure 1—figure supplement 1.
- https://cdn.elifesciences.org/articles/82826/elife-82826-fig1-figsupp1-data2-v2.xlsx
Figure 2 with 3 supplements

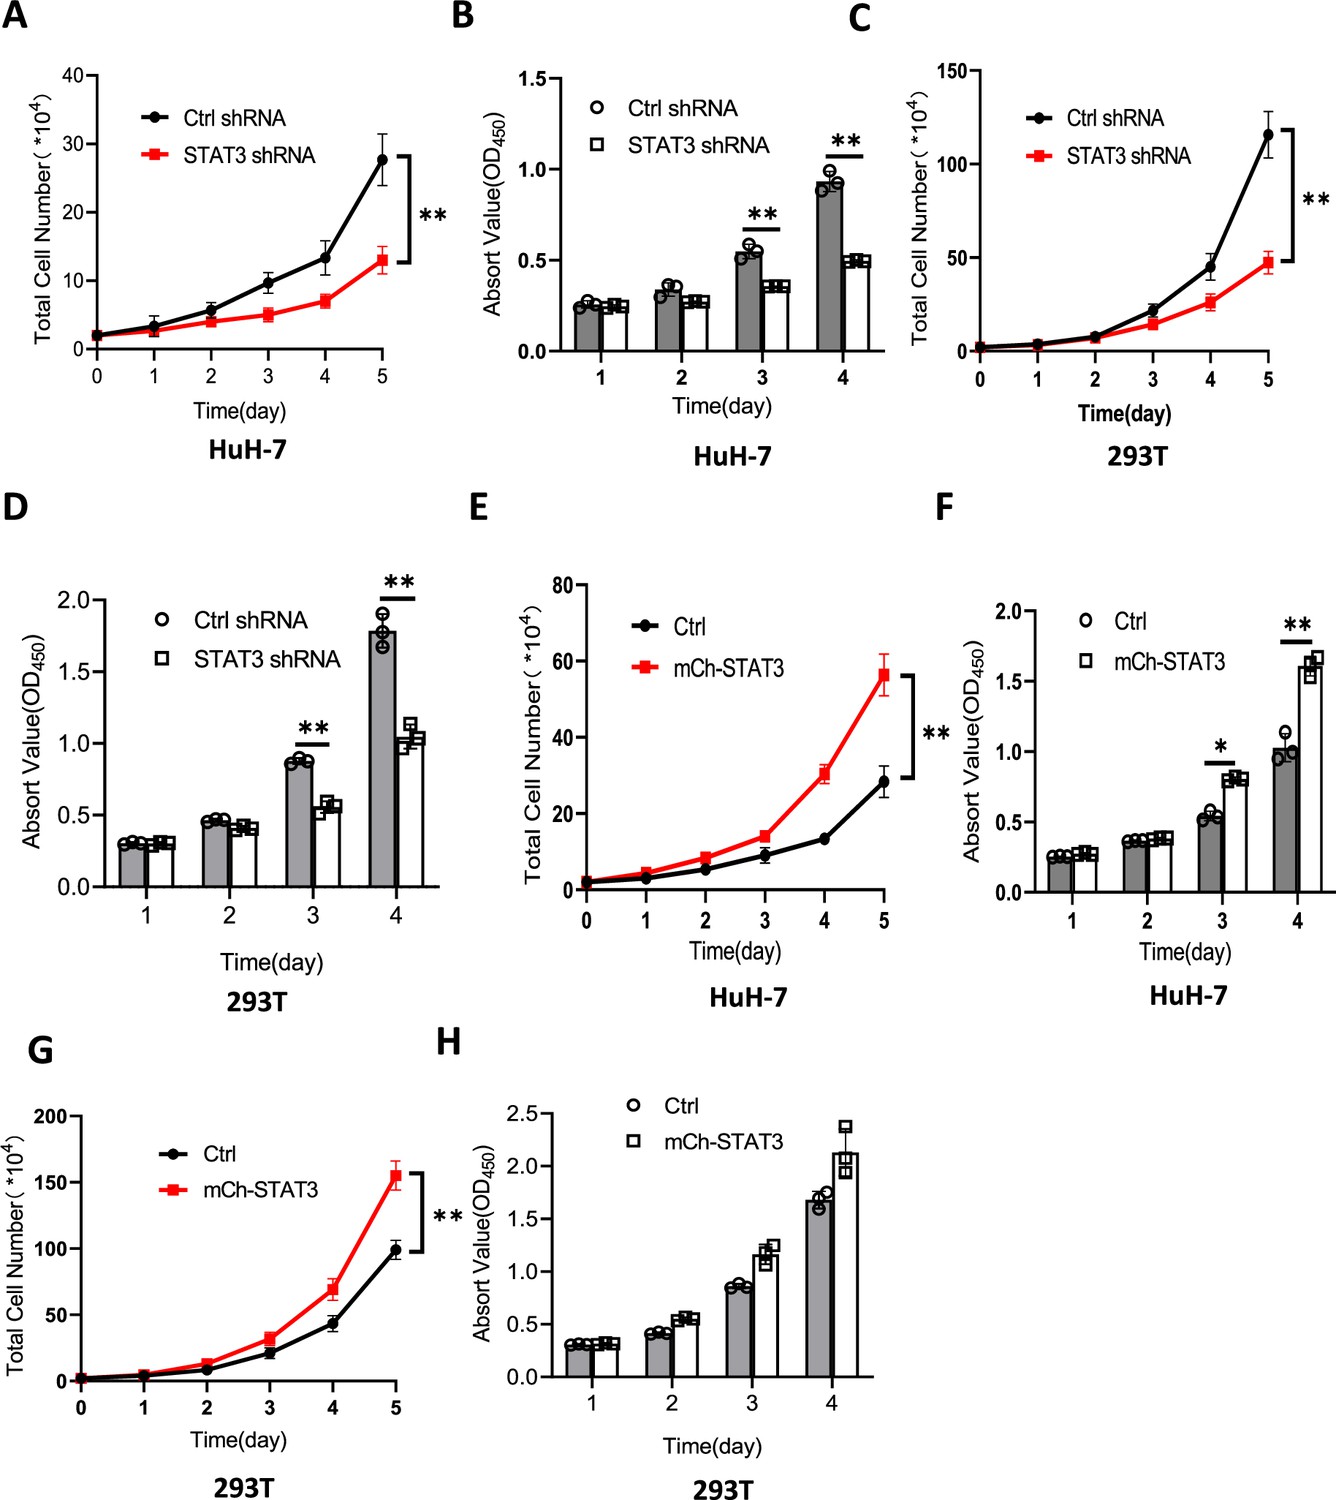
STAT3 promotes cell growth in vitro and in vivo.
(A and B) STAT3 silencing reduced the activity of HepG2 cell proliferation. Proliferative activity was determined by cell counting (A) and CCK-8 assays (B). (C and D) STAT3 overexpression enhanced the activity of HepG2 cell proliferation. Proliferative activity was determined by cell counting (C) and CCK-8 assays (D). (E and F) EdU assay results for HepG2 cells line expressing STAT3 shRNA or control shRNA. EdU-labeled cells were imaged under a fluorescent microscope (E), and the rate of EdU positive cells (F) was analyzed by ImageJ software based on the images obtained in E. Scale bars in C represent 50 μm. (G and H) EdU assay results for the HepG2 cell line with STAT3 overexpression and its control cell line. EdU-labeled cells were imaged under a fluorescent microscope (G) and the rate of EdU positive cells (H) was analyzed by ImageJ software based on the images obtained in G. Scale bars in C represent 50 μm. (I) The time course of tumor volumes during tumor formation. Amount of 1×10⁷ HepG2 cells expressing Ctrl shRNA or STAT3 shRNA were injected subcutaneously into nude mice (n=6). After 1 week, tumor sizes were measured by vernier caliper. (J and K) STAT3 silencing reduced the weights of tumors formed in nude mice. After nude mice were euthanized, tumors were taken out of the mice and pictured with a camera (J); the resulting tumors were weighed, and the resulting data were analyzed statistically (K). (L) STAT3 immunohistochemical staining for the tumor samples derived from HePG2 cells expressing control shRNA or STAT3 shRNA. Scale bars in the images represent 100 μm. Each column or point in histograms represents the mean ± SD of three biological replicates (n=3). *, p<0.05; **, p<0.01. p Values were obtained by Student’s t test (B, D, F, H, and K) or two-way ANOVA (A, C, and I). Mean, SD, and p values were calculated using GraphPad Prism 8 software.
-
Figure 2—source data 1
Original digital data for Figure 2.
- https://cdn.elifesciences.org/articles/82826/elife-82826-fig2-data1-v2.xlsx
Figure 2—figure supplement 1
Effect of STAT3 expression alteration on the activity of cell proliferation.
-
Figure 2—figure supplement 1—source data 1
Original digital data for Figure 2—figure supplement 1.
- https://cdn.elifesciences.org/articles/82826/elife-82826-fig2-figsupp1-data1-v2.xlsx
Figure 2—figure supplement 2
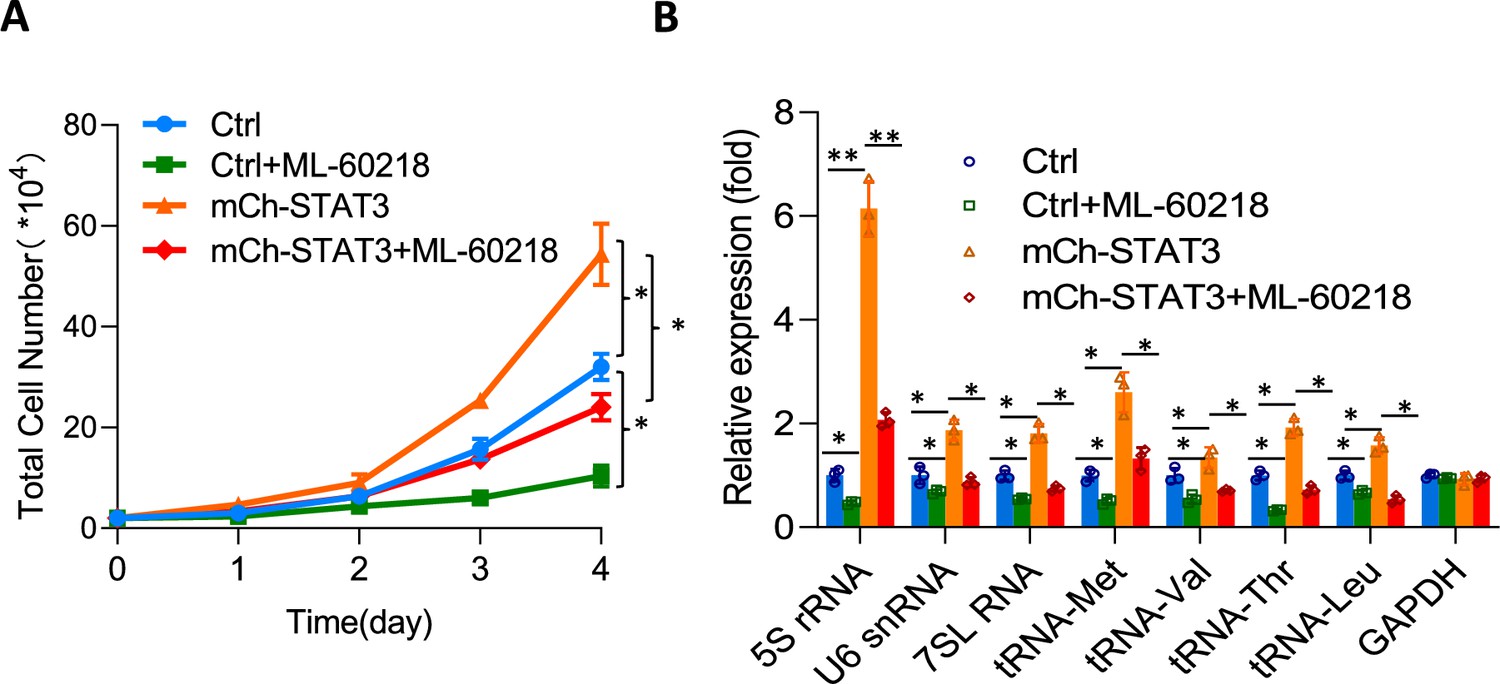
Effect of ML-60218 on cell proliferation and Pol III product expression in HepG2 cell lines with STAT3 overexpression.
-
Figure 2—figure supplement 2—source data 1
Original digital data for Figure 2—figure supplement 2.
- https://cdn.elifesciences.org/articles/82826/elife-82826-fig2-figsupp2-data1-v2.xlsx
Figure 2—figure supplement 3
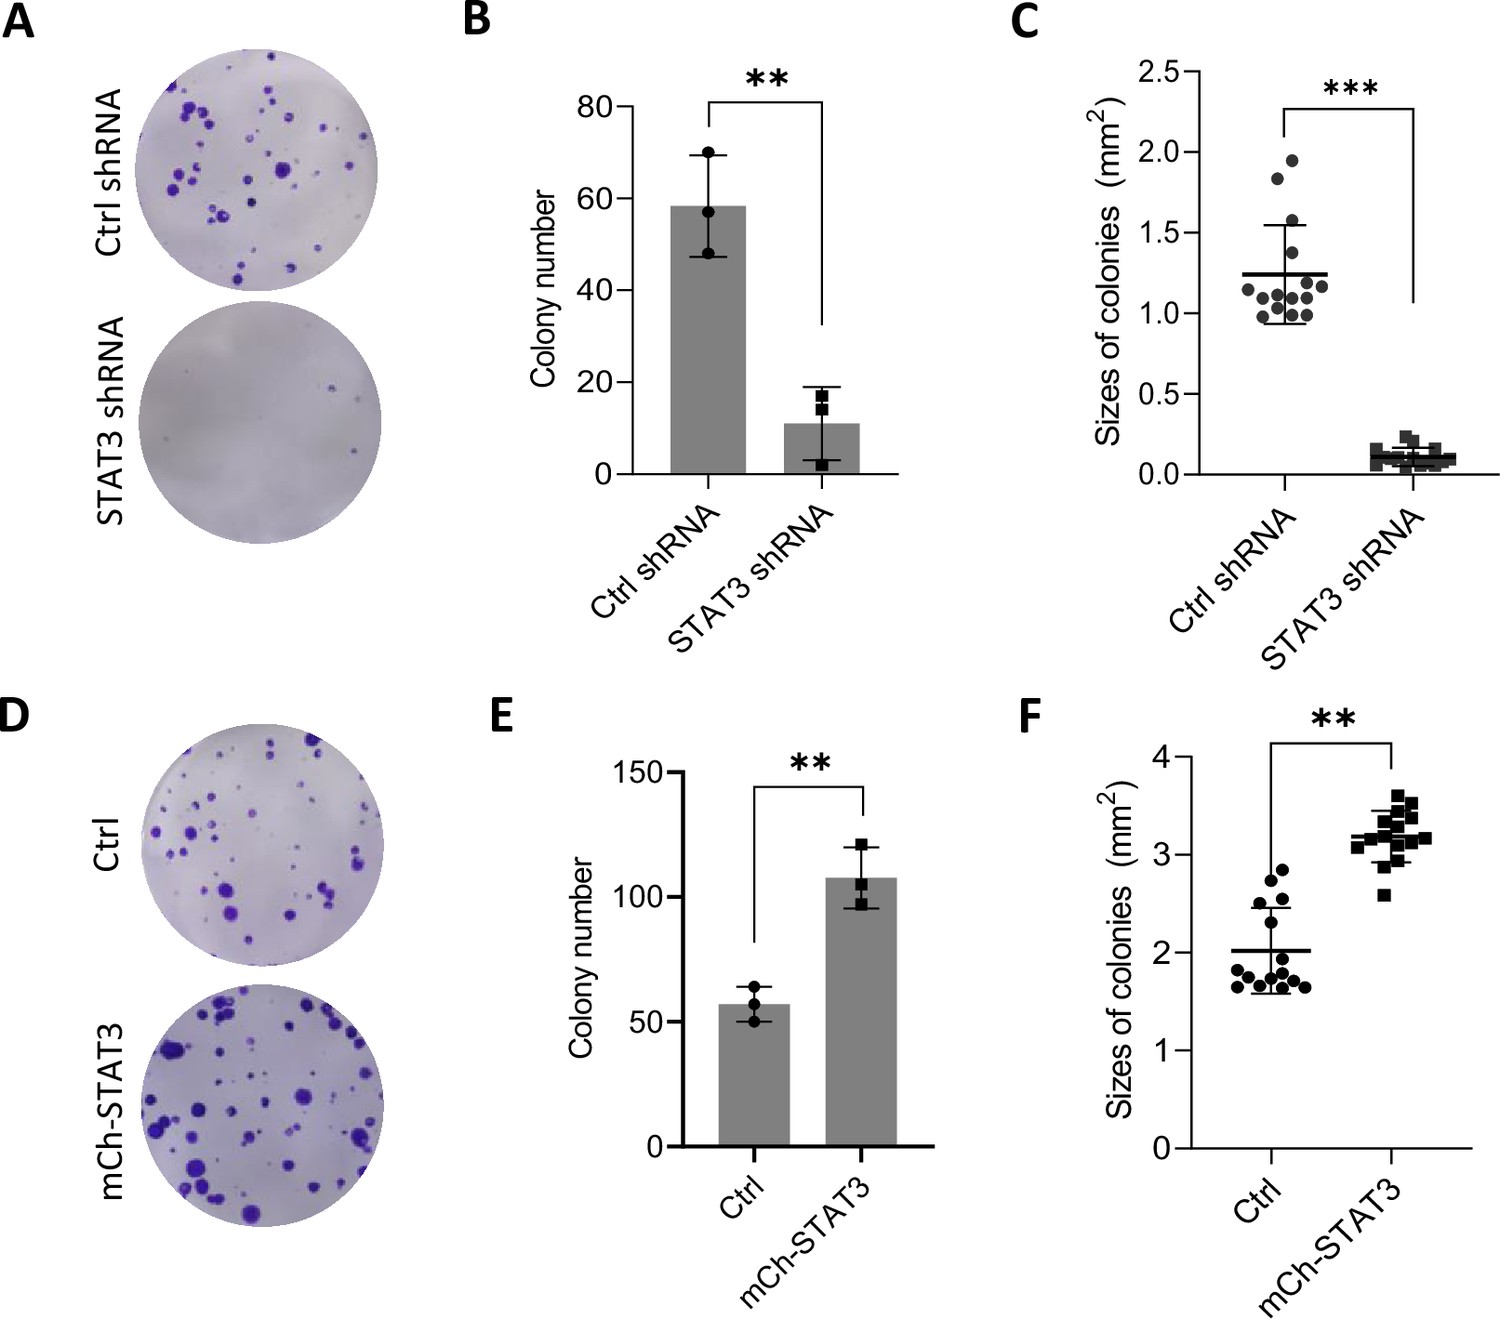
Alteration of STAT3 expression affected colony formation for HepG2 cells.
-
Figure 2—figure supplement 3—source data 1
Original digital data for Figure 2—figure supplement 3.
- https://cdn.elifesciences.org/articles/82826/elife-82826-fig2-figsupp3-data1-v2.xlsx
Figure 3
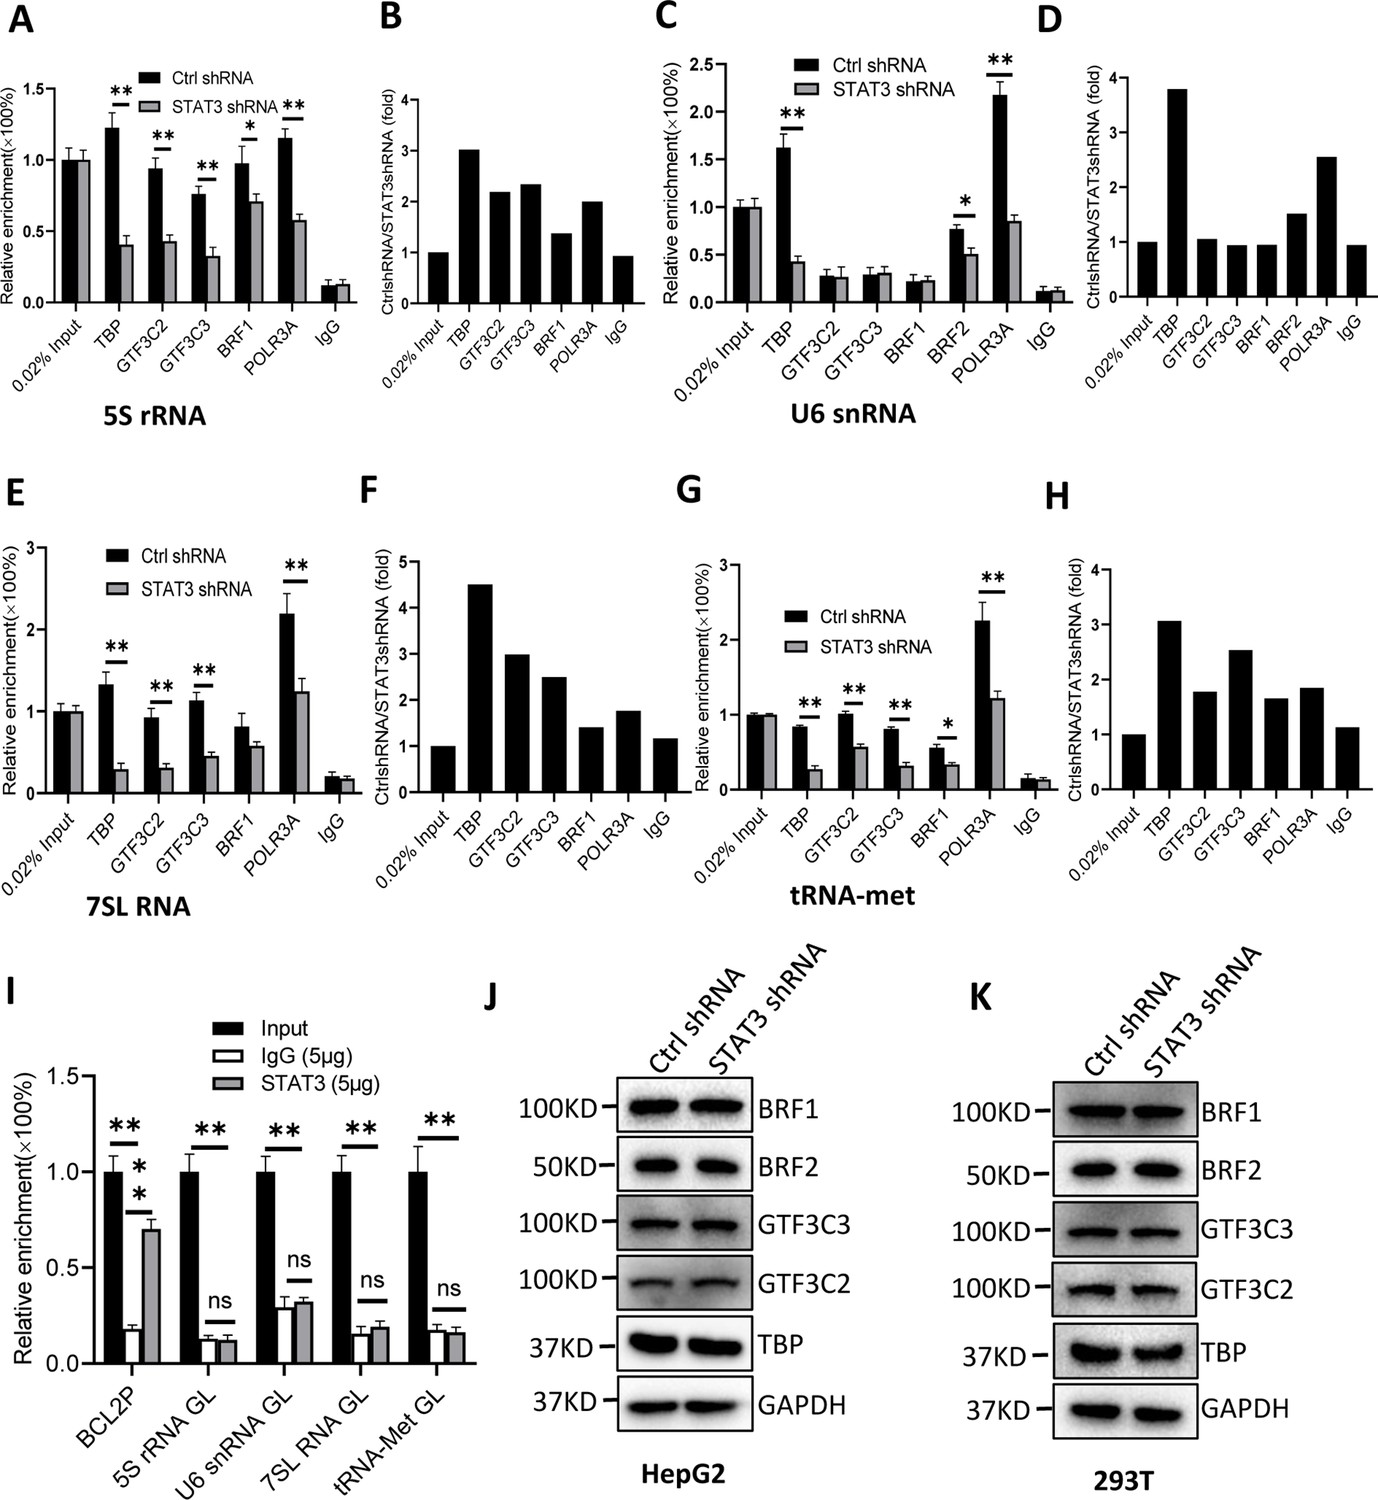
STAT3 silencing inhibited the recruitment of Pol III transcription machinery components to Pol III target loci.
(A and B) STAT3 knockdown reduced the occupancies of Pol III transcription machinery components at the DNA locus encoding 5S rRNA. Chromatin immunoprecipitation (ChIP) assays were performed using HepG2 cell lines stably expressing Ctrl shRNA or STAT3 shRNA and antibodies against the indicated factors. Relative enrichment (A) was obtained by comparing the quantity of target DNA in 1 μL of ChIP DNA sample to that in 0.02% of input DNA sample. Fold change (B) was obtained by comparing the mean of relative enrichment of target DNA in a control shRNA sample to that in a STAT3 shRNA sample obtained in A. (C and D) STAT3 knockdown decreased the recruitment of TBP, BRF2, and POLR3A to the DNA locus encoding U6 snRNA. Relative enrichment (C) and fold change (D) were obtained as described in A and B, respectively. (E and F) STAT3 knockdown inhibited the recruitment of Pol III transcription machinery components to the DNA locus encoding 7SL RNA. Relative enrichment (E) and fold change (F) were obtained as described in A and B, respectively. (G and H) STAT3 knockdown dampened the recruitment of Pol III transcription machinery components to the tRNA-Met promoter. Relative enrichment (G) and fold change (H) were obtained as described in A and B, respectively. (I) STAT3 did not bind to the DNA loci encoding 5S rRNA, U6 RNA, 7SL RNA, and tRNA-met but BCL2 promoter. ChIP assays were performed using HepG2 cells and an anti-STAT3 antibody. Relative enrichment (G) was obtained as described in A. (J and K) STAT3 silencing did not affect the expression of Pol III transcription factor subunits. HepG2 (J) and 293T (K) cell lines with STAT3 depletion were used to analyze the expression of pol III transcription factor subunits by western blot. Each column in A, C, E, G, and I represents the mean of SD of three biological replicates (n=3) *, p<0.05; **, p<0.01. p Values were obtained by Student’s t test performed with data for the control and treated samples. Mean, SD, and p values were calculated using GraphPad Prism 8 software.
-
Figure 3—source data 1
Raw images for Western blot data in Figure 3.
- https://cdn.elifesciences.org/articles/82826/elife-82826-fig3-data1-v2.zip
-
Figure 3—source data 2
Original digital data for Figure 3.
- https://cdn.elifesciences.org/articles/82826/elife-82826-fig3-data2-v2.xlsx
Figure 4 with 2 supplements
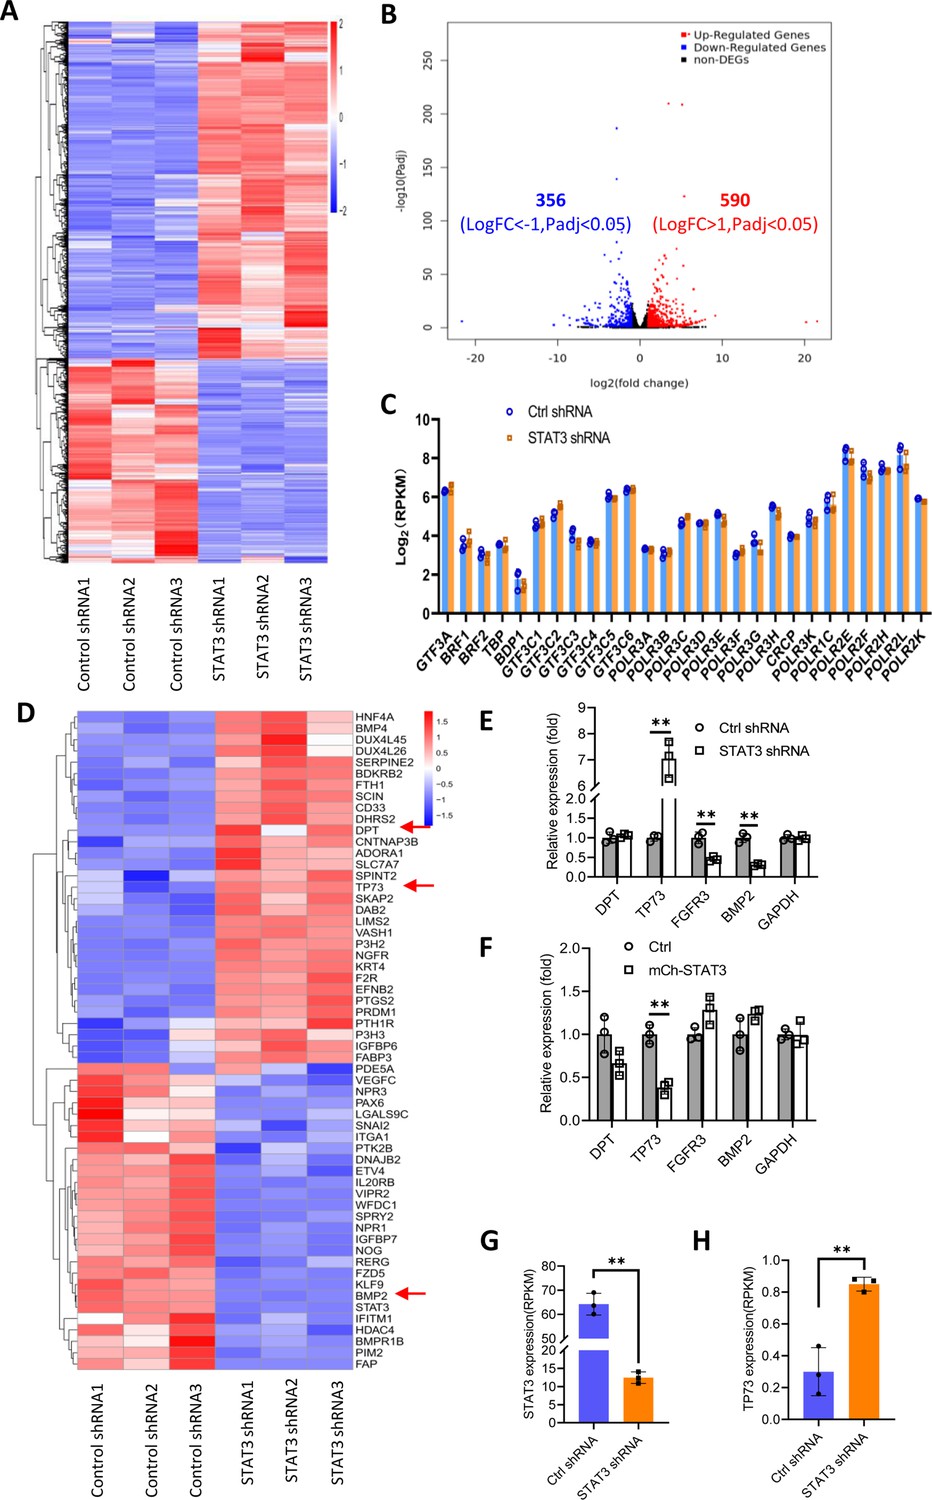
Effect of STAT3 silencing on genome-wide mRNA expression in HePG2 cells.
(A) A Heatmap showing the result of hierarchical cluster analysis based on the mRNA-seq data derive from HepG2 cell lines stably expressing control shRNA or STAT3 shRNA. (B) A volcano plot showing the number of significantly upregulated or downregulated genes obtained from the analysis of the RNA-seq data. (C) STAT3 silencing did not affect the expression of genes encoding Pol III transcription machinery components. Gene expression (log2[RPKM]) was obtained from the RNA-seq data. (D) A heatmap showing differential expression genes related to the pathways for negative regulation of cell proliferation. Expression for DPT, TP73, and BMP2 genes was pointed out by red arrows. (E and F) Effect of STAT3 silencing and overexpression on the expression of DPT, TP73, FGFR3, and BMP2 genes. RT-quantitative PCR (qPCR) was performed using HepG2 cell lines with STAT3 silencing (E) or overexpression (F). (G and H) The mRNA reads (RPKM) of STAT3 and TP73 genes obtained from the RNA-seq with HepG2 cells expressing STA3 shRNA or control shRNA. Each column in C and E–H represents the mean of SD of three biological replicates (n=3). **, p<0.01. p Values were obtained by Student’s t test performed with data for the control and treated samples. Mean, SD, and p values were calculated using GraphPad Prism 8 software.
-
Figure 4—source data 1
Original digital data for Figure 4.
- https://cdn.elifesciences.org/articles/82826/elife-82826-fig4-data1-v2.xlsx
Figure 4—figure supplement 1
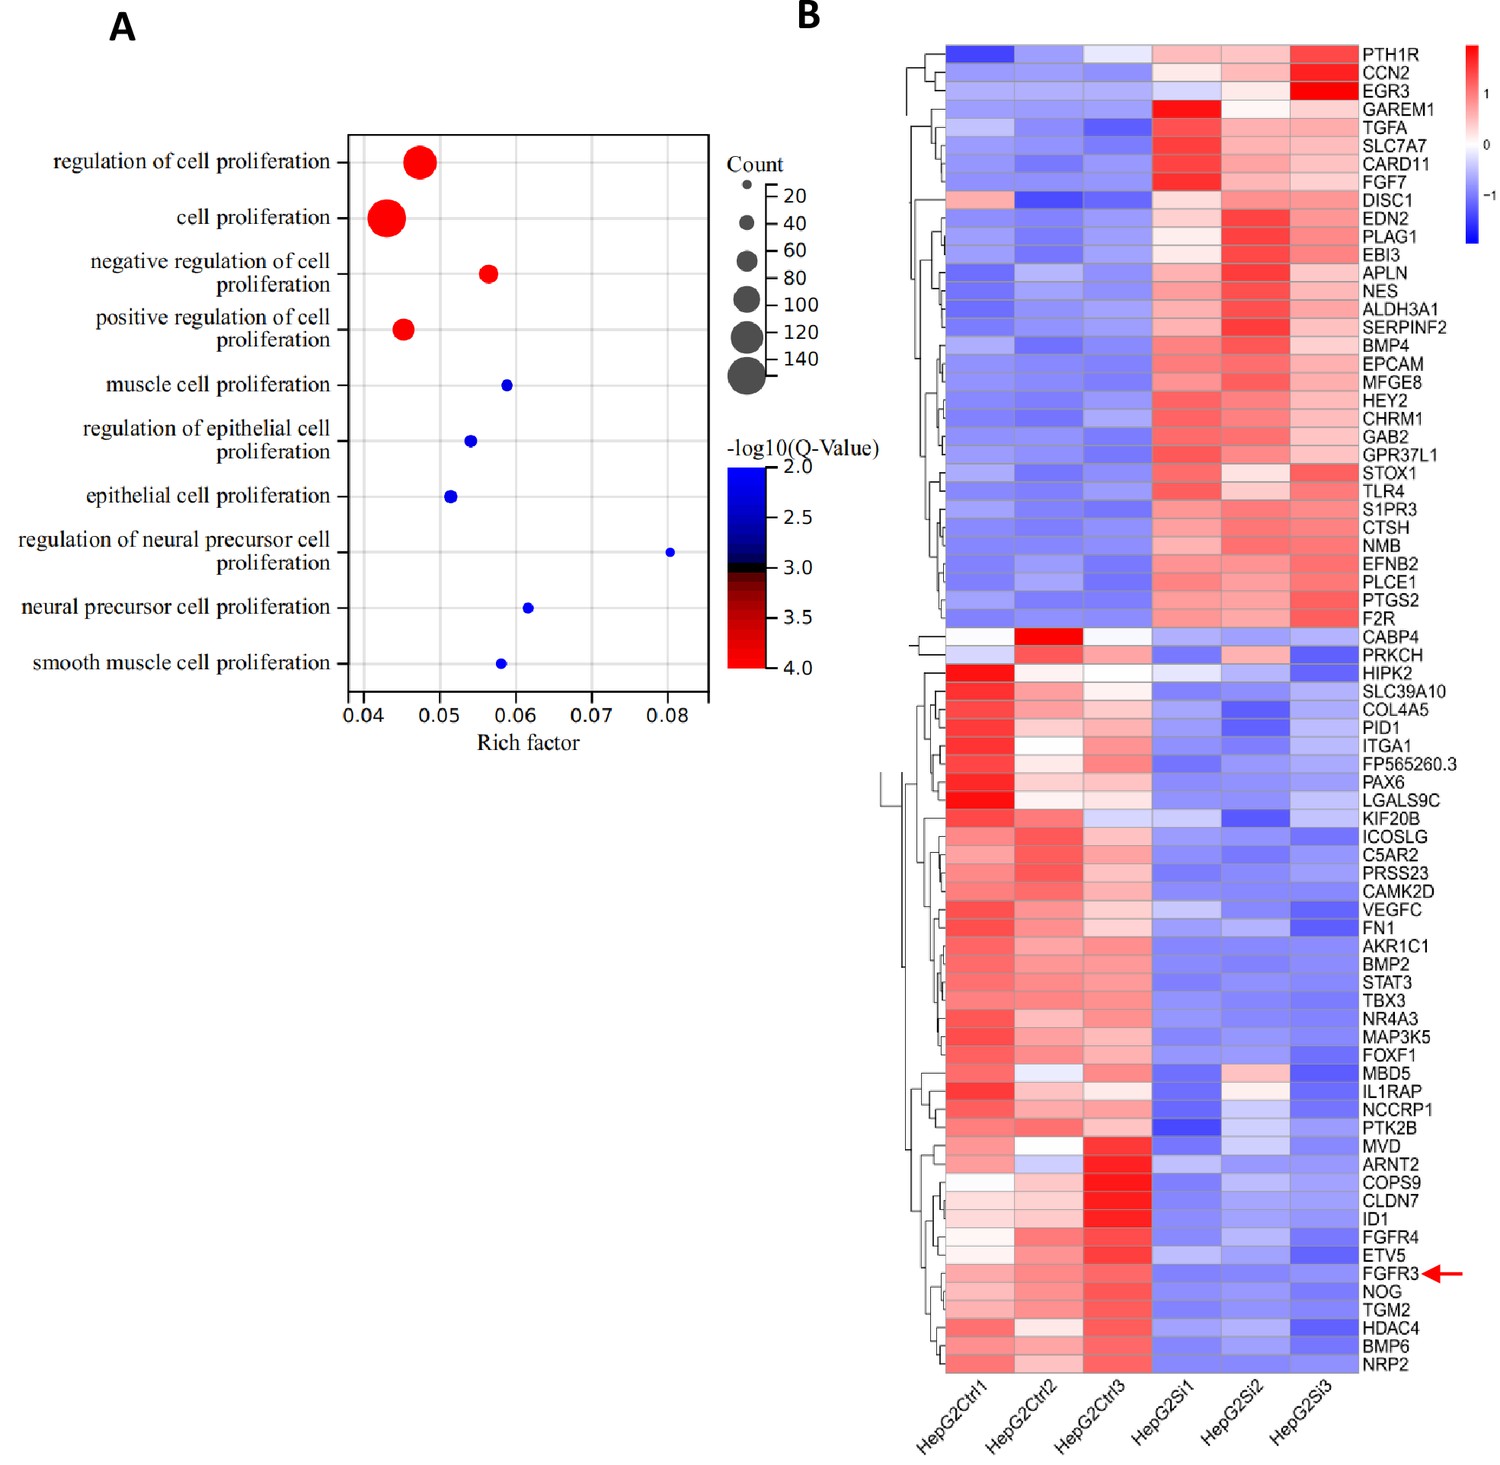
Effect of STAT3 silencing on the expression of genes related to cell proliferation.
-
Figure 4—figure supplement 1—source data 1
Original digital data for Figure 4—figure supplement 1.
- https://cdn.elifesciences.org/articles/82826/elife-82826-fig4-figsupp1-data1-v2.xlsx
Figure 4—figure supplement 2
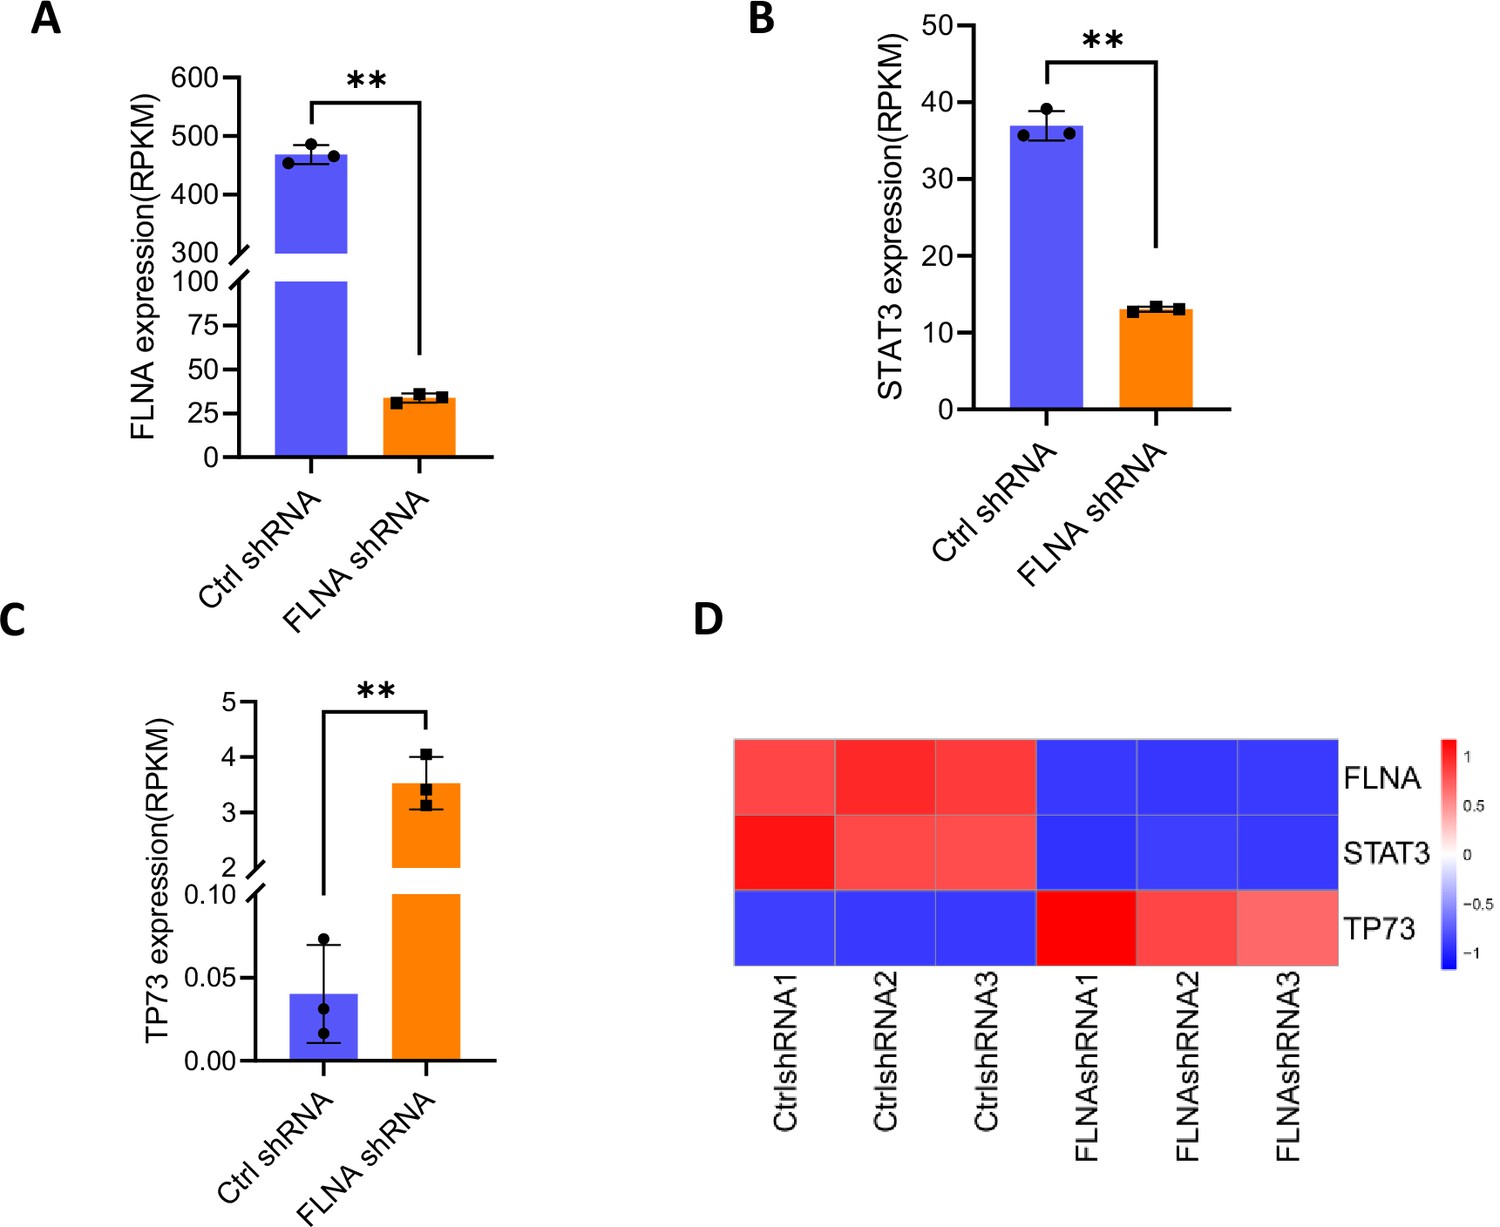
TP73 expression is opposite to STAT3 in FLNA-depleted cells.
-
Figure 4—figure supplement 2—source data 1
Original digital data for Figure 4—figure supplement 2.
- https://cdn.elifesciences.org/articles/82826/elife-82826-fig4-figsupp2-data1-v2.xlsx
Figure 5 with 3 supplements
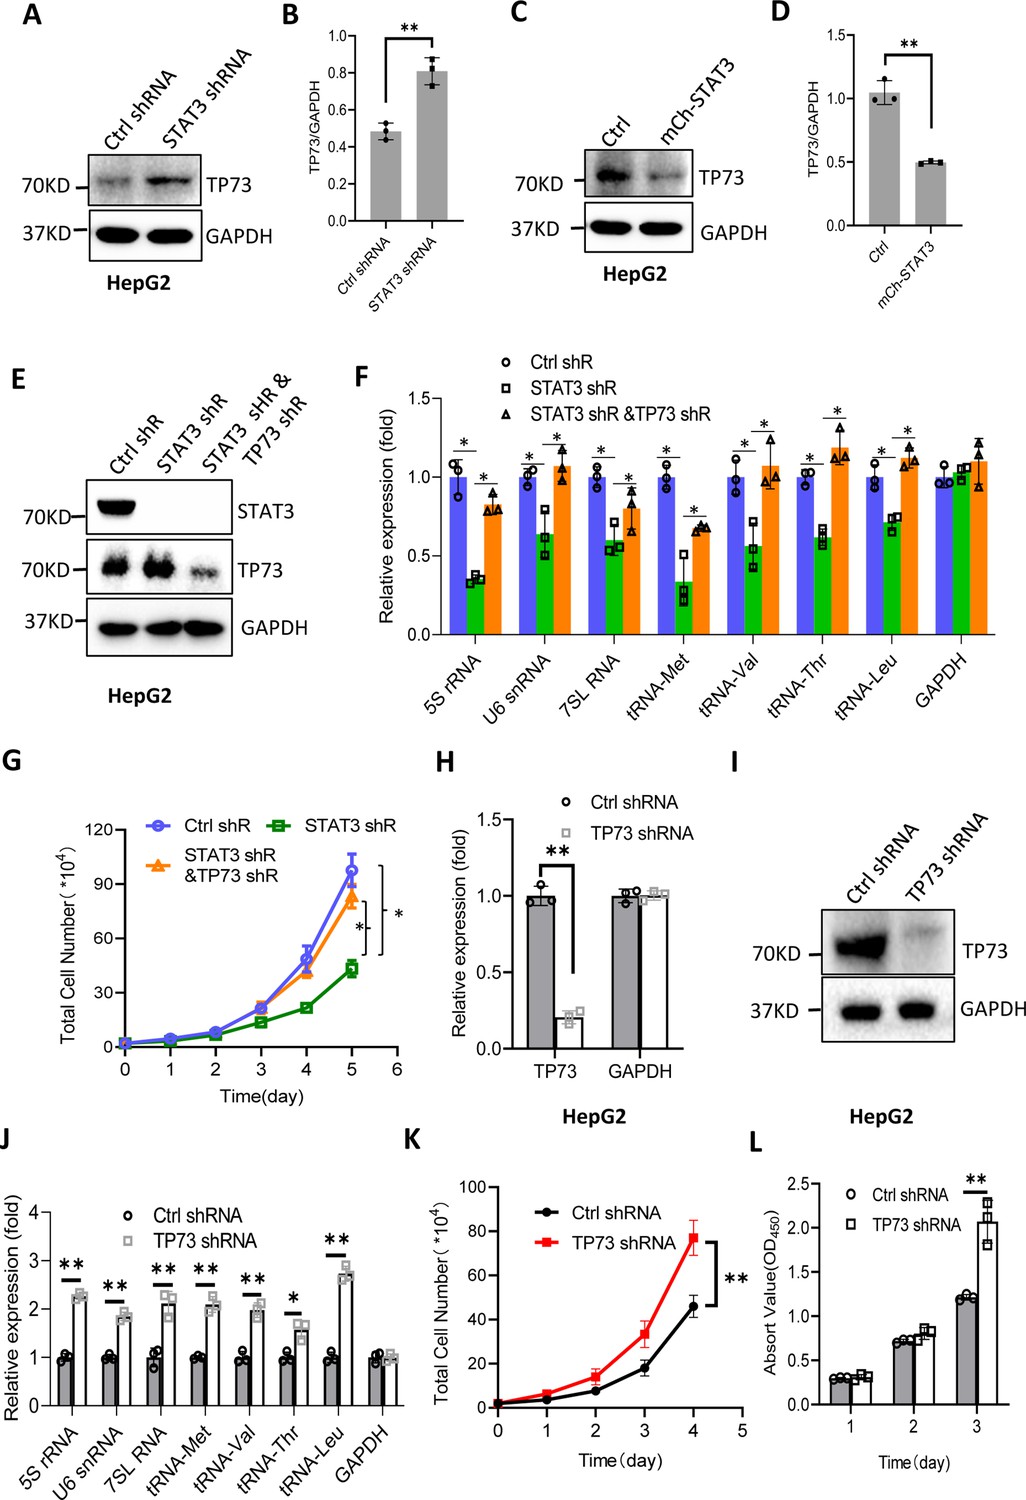
STAT3 modulates Pol III-directed transcription by inhibiting TP73 expression.
(A and B) STAT3 knockdown stimulated TP73 protein expression. HepG2 cells expressing STAT3 shRNA or control shRNA were cultured and harvested for western blot analysis. B is the quantified result for western blots obtained in A. (C and D) STAT3 overexpression reduced TP73 protein expression. Western blot was performed using the HepG2 cell line with STAT3 overexpression and the corresponding control cell line. D is the quantified result for western blots obtained in C. (E) Western blot results showing the generation of HepG2 cell lines expressing both STAT3 shRNA and TP73 shRNA. shR: shRNA. (F) TP73 silencing reversed the inhibition of Pol III product levels induced by STAT3 depletion. RT-quantitative PCR (qPCR) was performed using the cell lines generated in E. (G) TP73 silencing reversed the inhibition of cell proliferation caused by STAT3 depletion. Cell counting was performed using the cell lines established in E. (H and I) HepG2 cell lines stably expressing TP73 shRNA or control shRNA were generated and verified by RT-qPCR (H) and western blot (I). (J) TP73 silencing enhanced Pol III-directed transcription. RT-qPCR was performed using the cell lines generated in H and I. (K and L) TP73 silencing promoted proliferative activity of HePG2 cells. HepG2 cell lines obtained in H and I were used to analyze proliferative activity by cell counting and CCK-8 methods. Each column or point in histograms represents the mean of SD of three biological replicates (n=3). *, p<0.05; **, <0.01. p Values in B, D, F, H, and J were obtained by Student’s t test performed with the data from control and treated samples; whereas p values in G, K, and L were obtained by two-way ANOVA. Mean, SD, and p values were calculated using GraphPad Prism 8 software.
-
Figure 5—source data 1
Raw images for Western blot data in Figure 5.
- https://cdn.elifesciences.org/articles/82826/elife-82826-fig5-data1-v2.zip
-
Figure 5—source data 2
Original digital data for Figure 5.
- https://cdn.elifesciences.org/articles/82826/elife-82826-fig5-data2-v2.xlsx
Figure 5—figure supplement 1
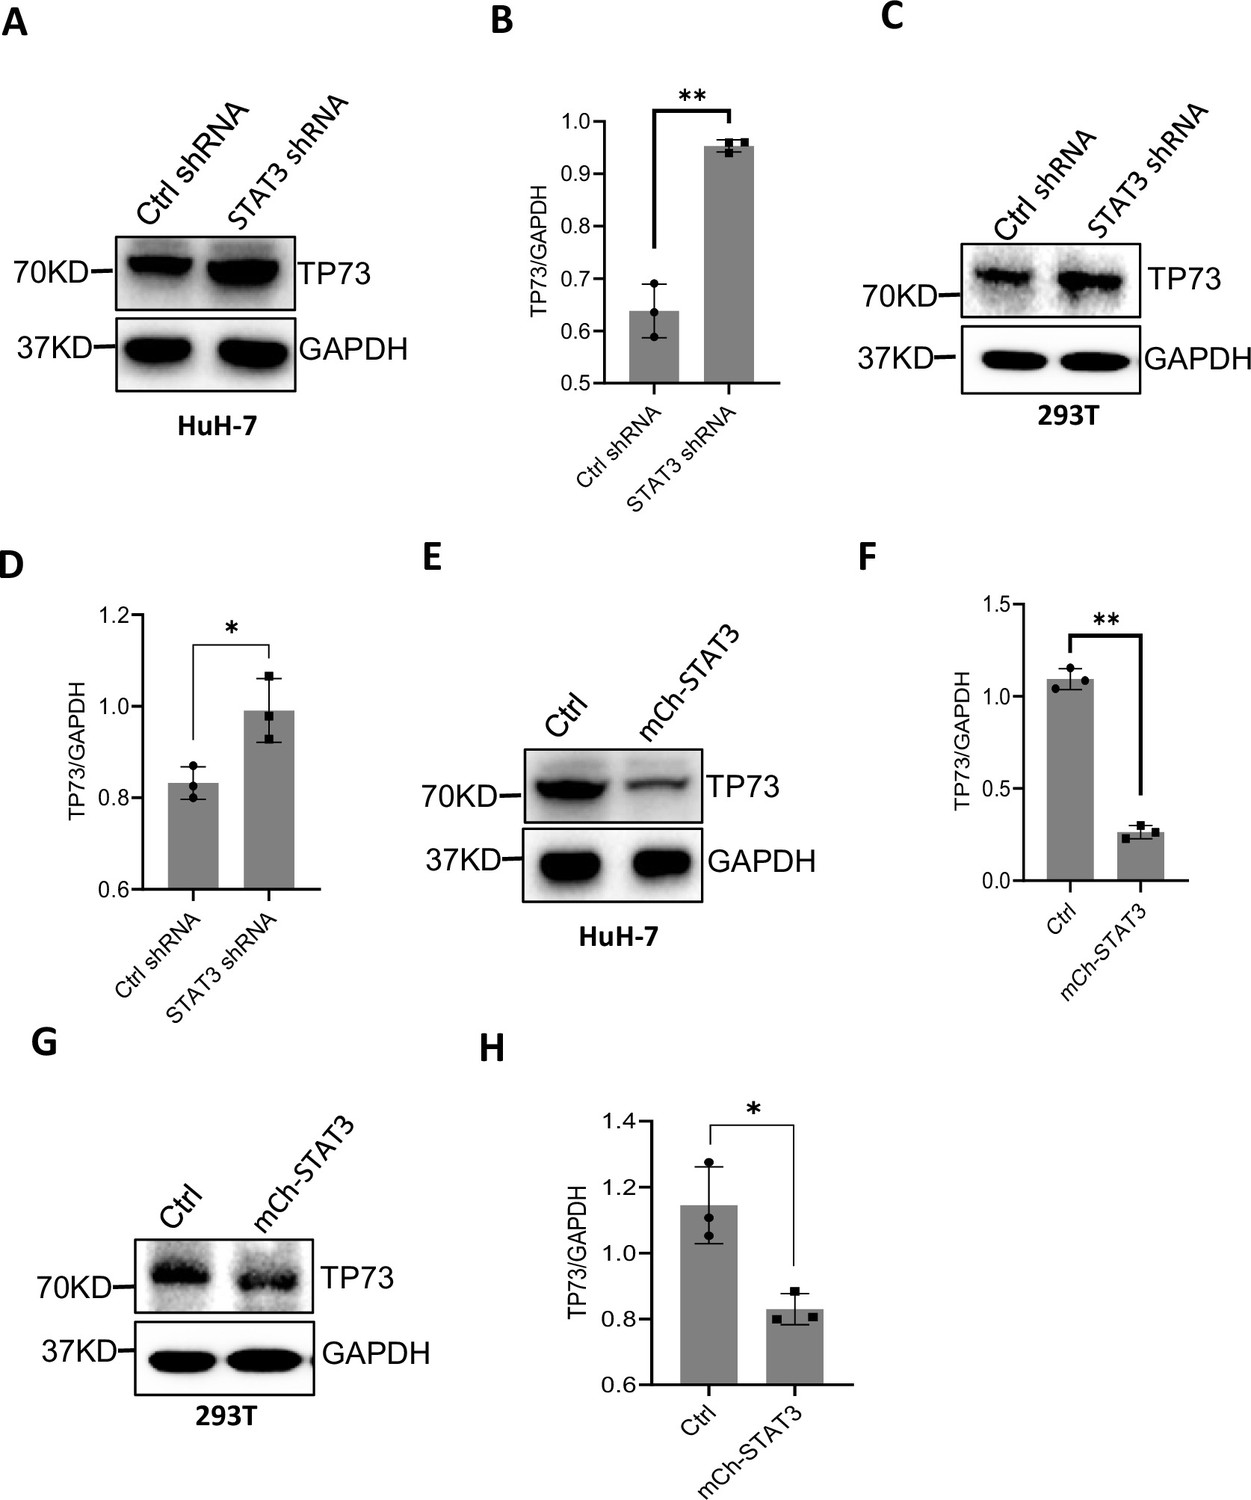
STAT3 inhibits TP73 expression.
-
Figure 5—figure supplement 1—source data 1
Raw images for Western blot data in Figure 5—figure supplement 1.
- https://cdn.elifesciences.org/articles/82826/elife-82826-fig5-figsupp1-data1-v2.zip
-
Figure 5—figure supplement 1—source data 2
Original digital data for Figure 5—figure supplement 1.
- https://cdn.elifesciences.org/articles/82826/elife-82826-fig5-figsupp1-data2-v2.xlsx
Figure 5—figure supplement 2
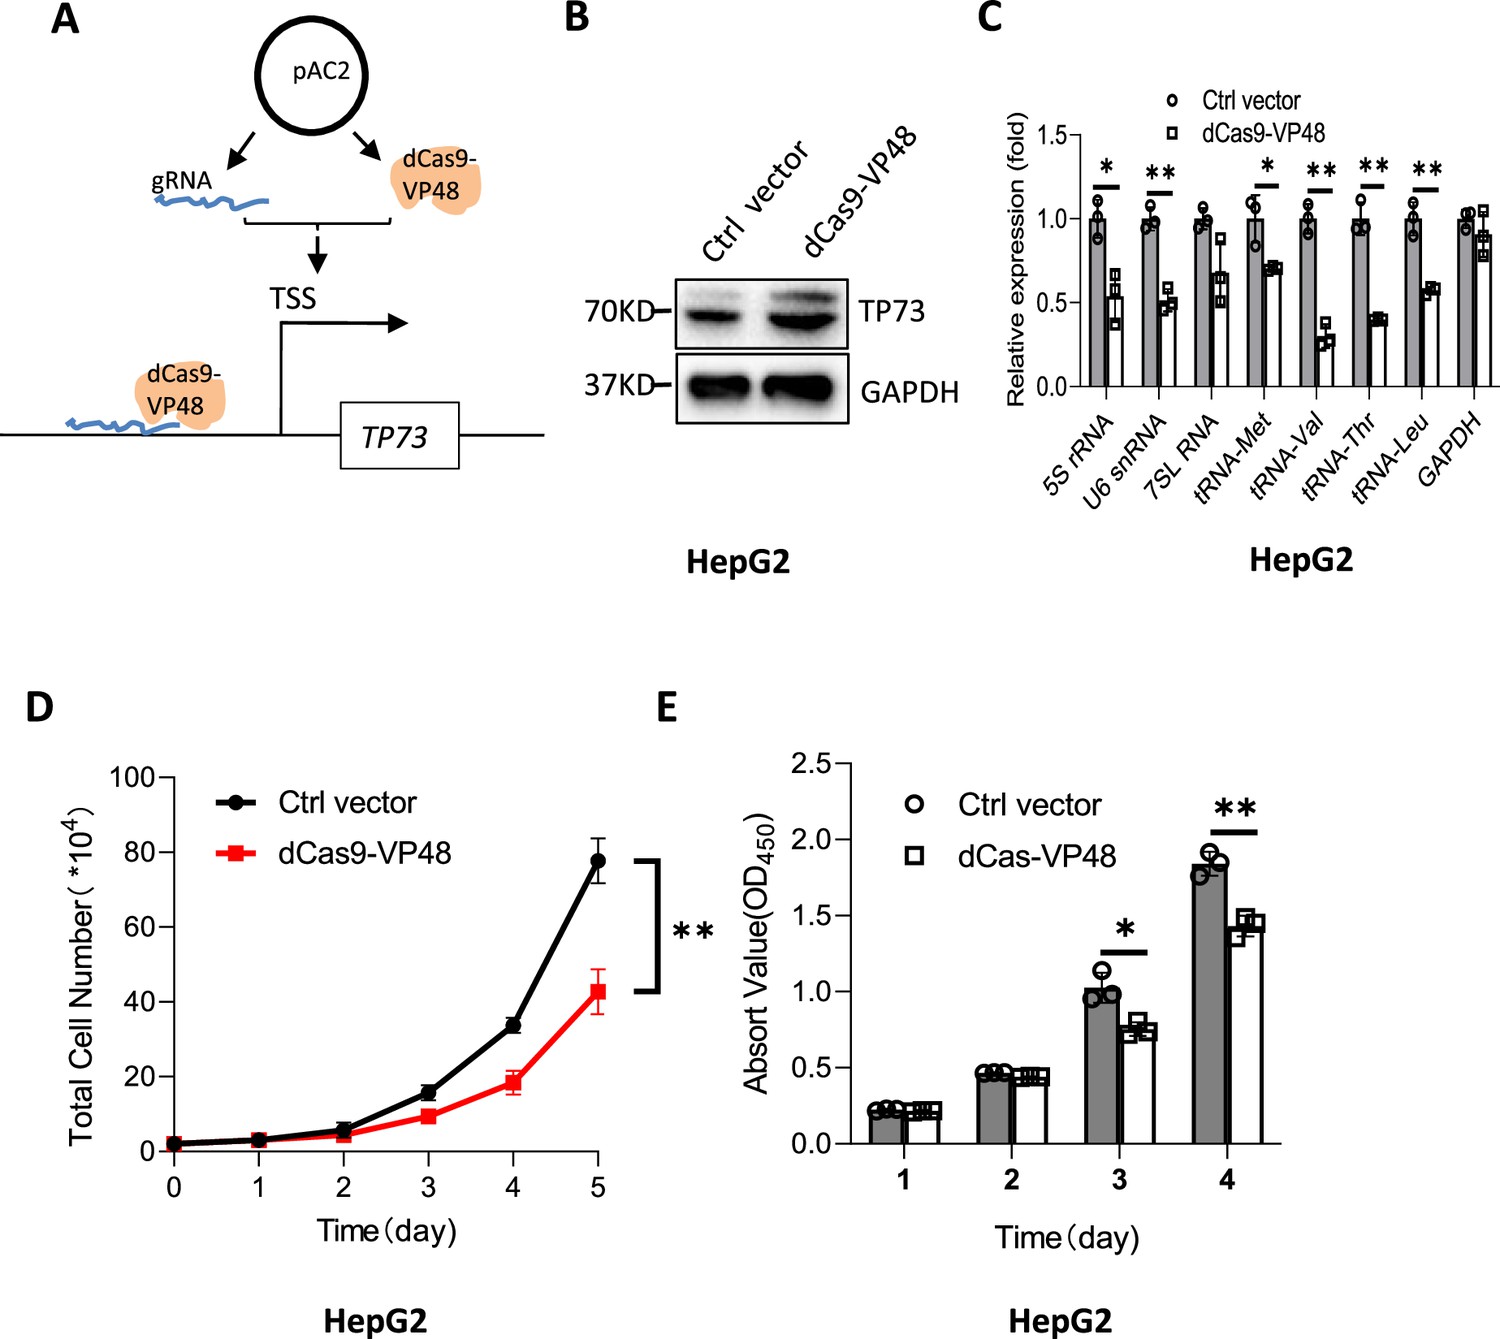
Activation of endogenous TP72 expression inhibited the synthesis of Pol III products and cell proliferation.
-
Figure 5—figure supplement 2—source data 1
Raw images for Western blot data in Figure 5—figure supplement 2.
- https://cdn.elifesciences.org/articles/82826/elife-82826-fig5-figsupp2-data1-v2.zip
-
Figure 5—figure supplement 2—source data 2
Original digital data for Figure 5—figure supplement 2.
- https://cdn.elifesciences.org/articles/82826/elife-82826-fig5-figsupp2-data2-v2.xlsx
Figure 5—figure supplement 3
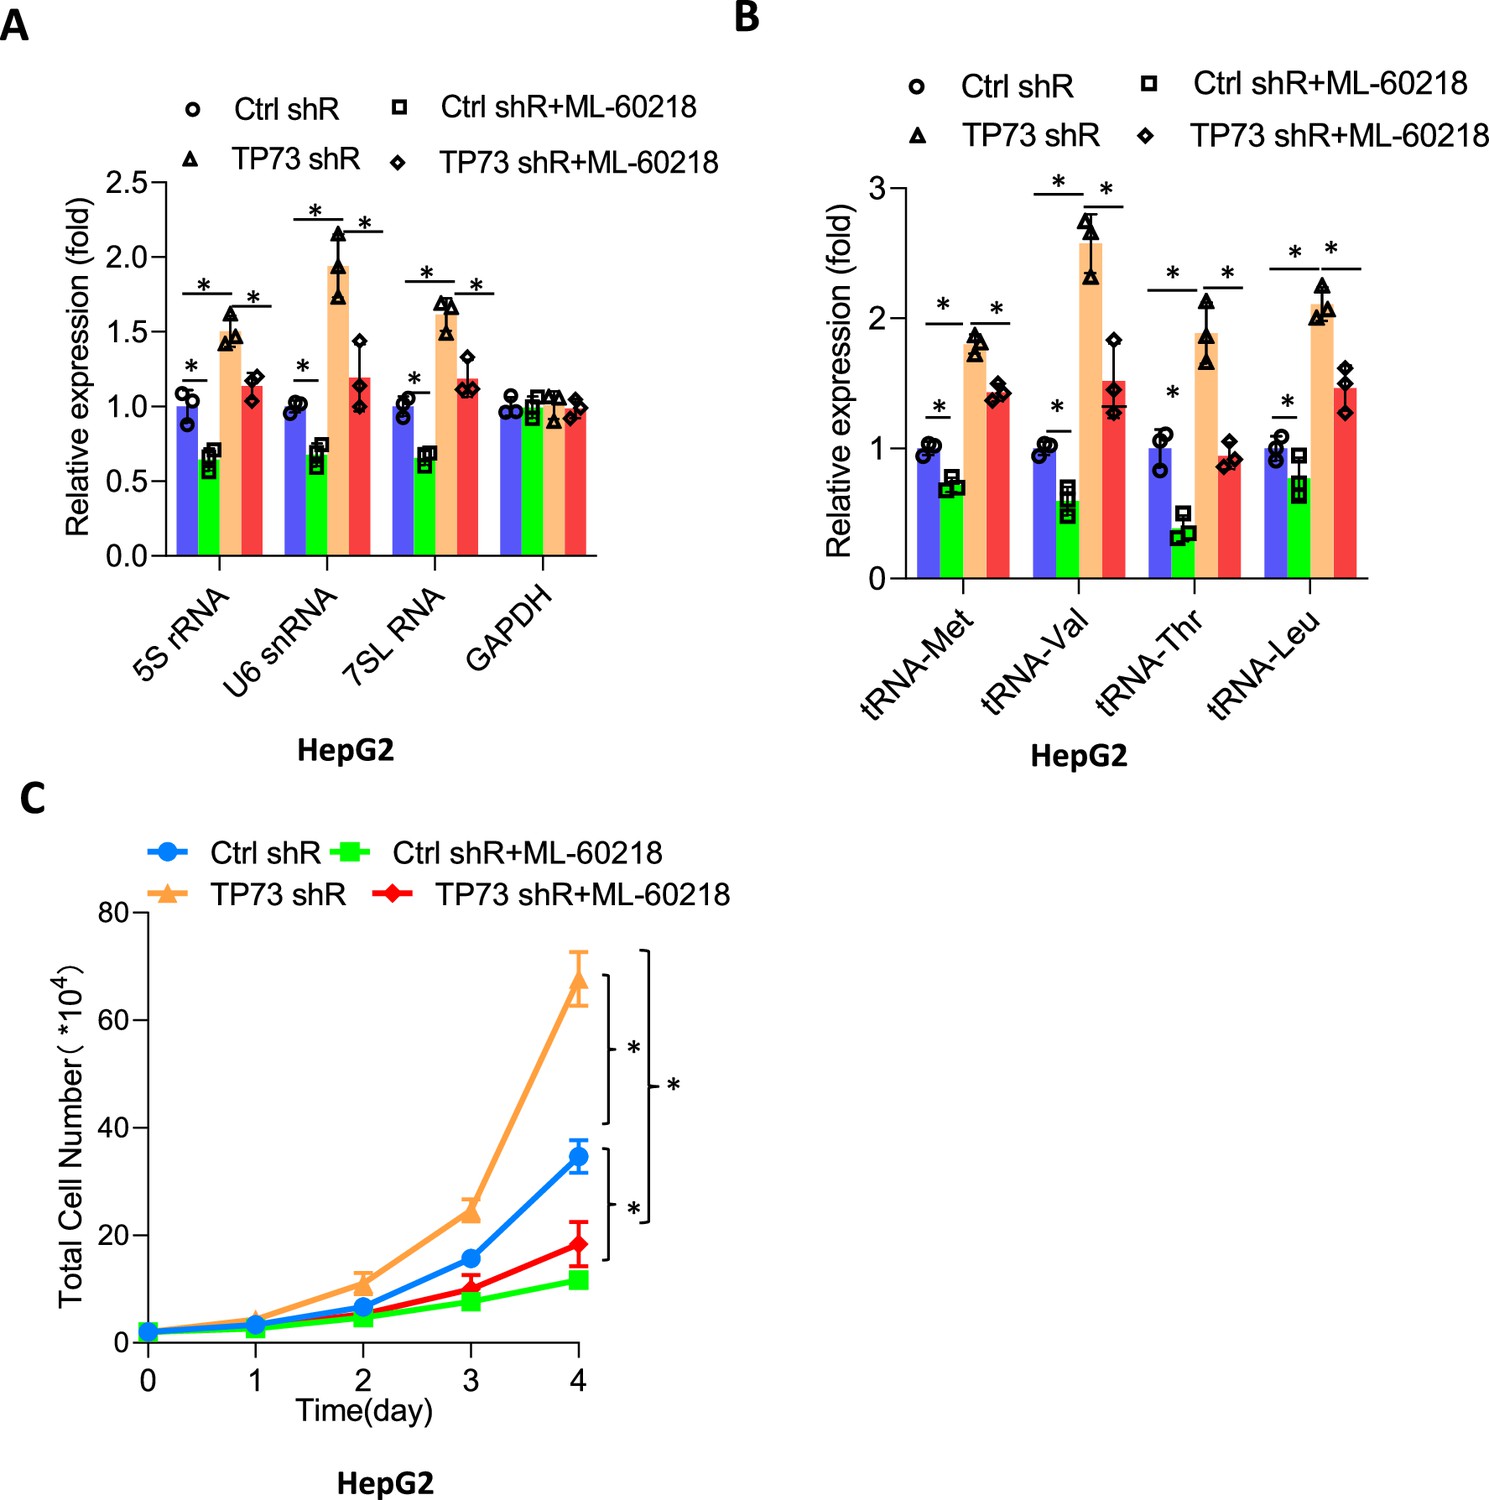
ML-60218 reversed the activation of Pol III-directed transcription and cell proliferation induced by TP73 silencing.
-
Figure 5—figure supplement 3—source data 1
Original digital data for Figure 5—figure supplement 3.
- https://cdn.elifesciences.org/articles/82826/elife-82826-fig5-figsupp3-data1-v2.xlsx
Figure 6 with 1 supplement
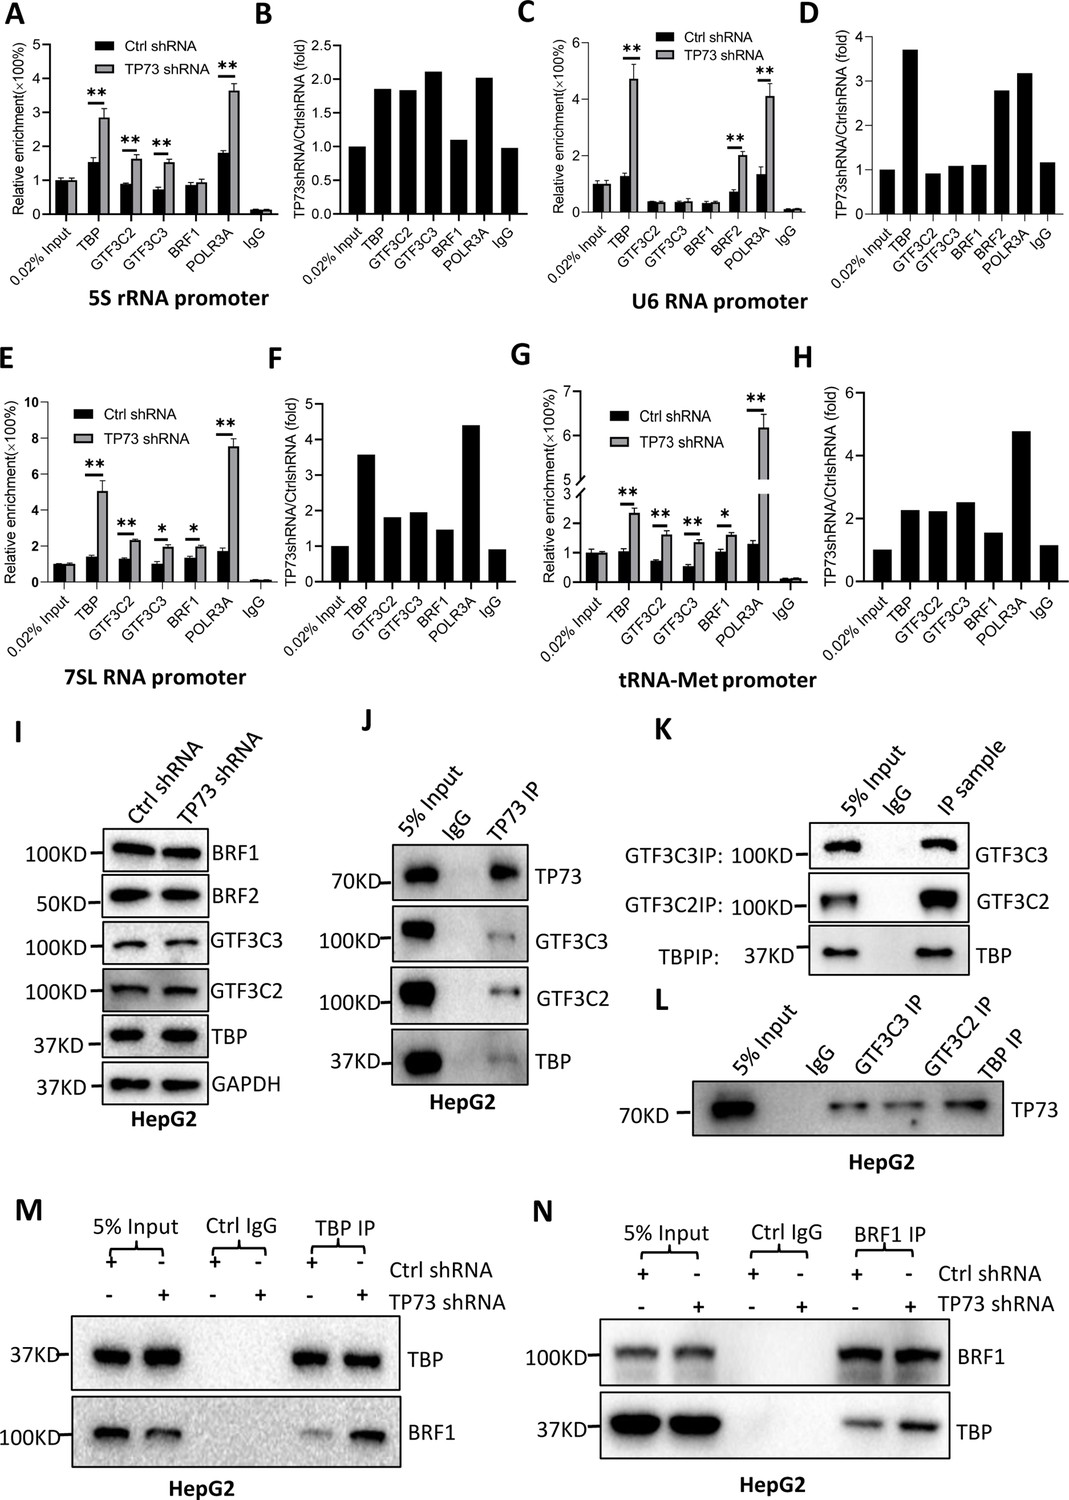
TP73 suppressesPol III-directed transcription by disrupting TFIIIB assembly.
(A–H) TP73 silencing increased the recruitment of the Pol III transcription machinery components to Pol III target loci. Chromatin immunoprecipitation (ChIP) assays were performed using HepG2 cell lines stably expressing TP73 shRNA or control shRNA. Relative enrichment (A, C, E, and G) was obtained by comparing the quantity of target DNA in 1 μL of ChIP DNA sample (1/40) to that in 0.02% of input DNA (1 ng genomic DNA). Fold change (B, D, F, and H) was obtained by comparing the mean of the relative enrichment of target DNA in TP73 shRNA samples to that in control shRNA samples. (I) Western blot images showing the effect of TP73 depletion on the expression of Pol III transcription machinery components. (J) Western blot images showing the results of TP73 co-immunoprecipitation (co-IP) assays. Co-IP assays were performed using an anti-TP73 antibody and HepG2 nuclei extract. (K and L) Western blot images showing the results of co-IP assays with antibodies against the indicated factors in K. The immunoprecipitation efficiency between antibody and antigen was verified by western blot (L). (M) TP73 silencing increased TBP binding to BRF1. Co-IP assays were performed using HepG2 cells expressing TP73 shRNA or control shRNA and an anti-TBP antibody. (N) TP73 silencing increased BRF1 binding to TBP. Co-IP assays were performed using HepG2 cells expressing TP73 shRNA or control shRNA and an anti-BRF1 antibody. Each column in A, C, E, and G represents the mean of SD of three biological replicates (n=3). *, p<0.05; **, p<0.01. p Values were obtained by Student’s t test performed with the data from control and treated samples. Mean, SD, and p values were calculated using GraphPad Prism 8 software.
-
Figure 6—source data 1
Raw images for Western blot data in Figure 6.
- https://cdn.elifesciences.org/articles/82826/elife-82826-fig6-data1-v2.zip
-
Figure 6—source data 2
Original digital data for Figure 6.
- https://cdn.elifesciences.org/articles/82826/elife-82826-fig6-data2-v2.xlsx
Figure 6—figure supplement 1
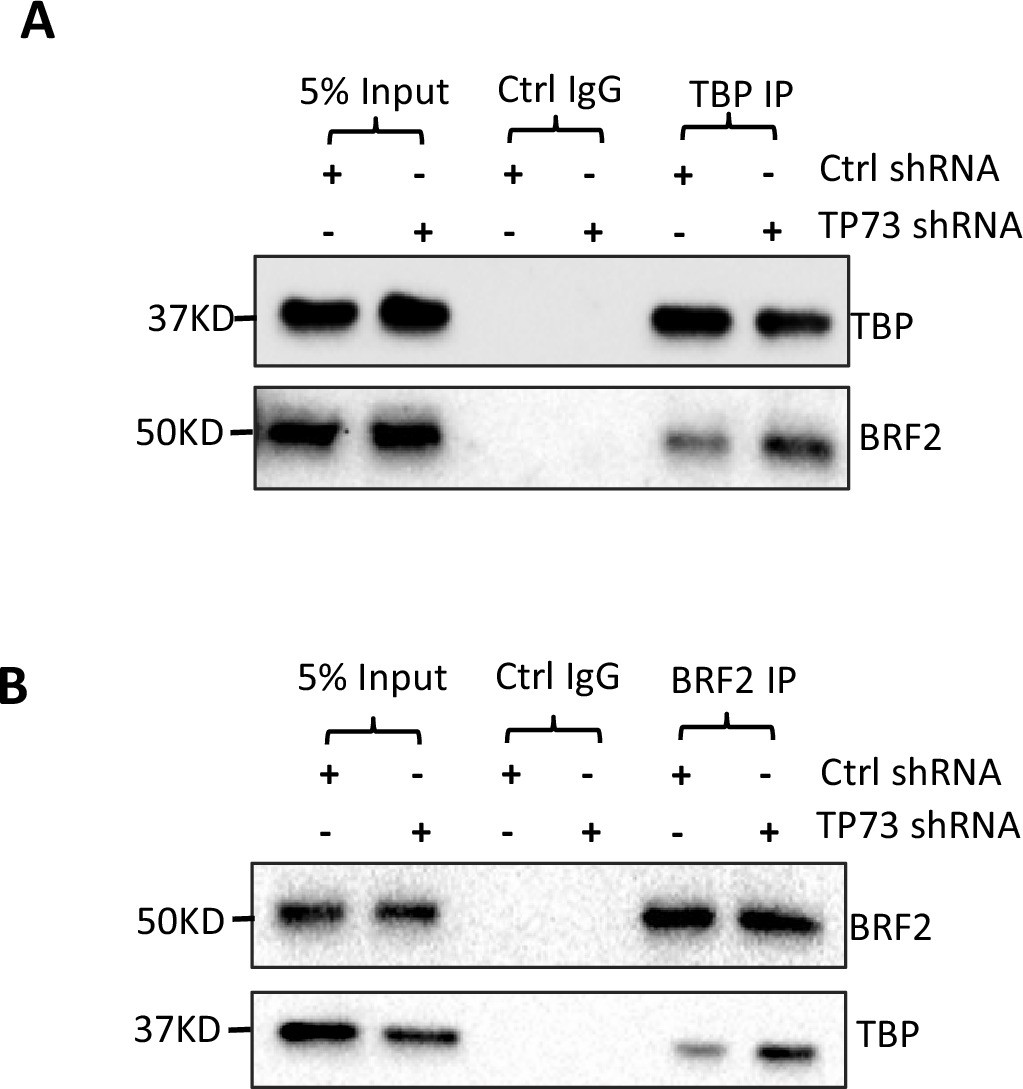
TP73 knockdown increased the interaction between TBP and BRF2.
-
Figure 6—figure supplement 1—source data 1
Raw images for Western blot data in Figure 6—figure supplement 1.
- https://cdn.elifesciences.org/articles/82826/elife-82826-fig6-figsupp1-data1-v2.zip
Figure 7 with 1 supplement
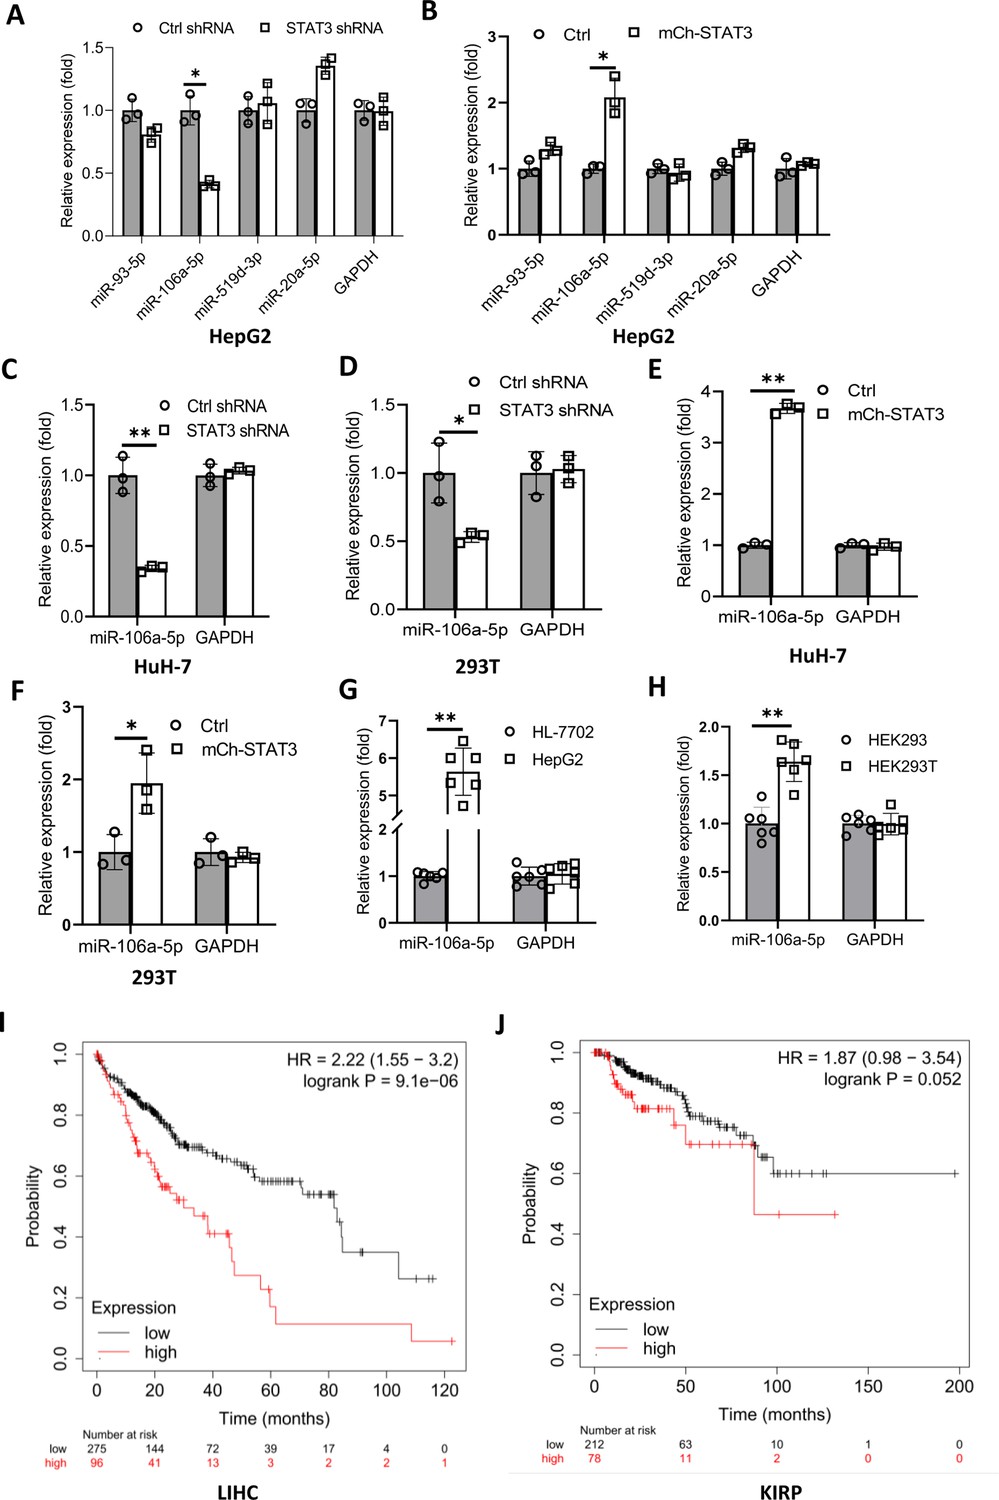
STAT3 positively regulates the expression of miR-106a-5p potentially targeting TP73 mRNA 3’ UTR.
(A and B) Alteration of STAT3 expression affected miR-106a-5p expression but did not affect the expression of other miRNA molecules, including miR-93–5 p, miR-519d-3p, and miR-20a-5p. RT-quantitative PCR (qPCR) was performed using HepG2 cell lines with STAT3 silencing or overexpression. (C and D) STAT3 depletion reduced the expression of miR-106a-5p in HuH-7 (C) and 293T (D) cells. RT-qPCR was performed using the cell lines expressing STAT3 shRNA or control shRNA. (E and F) STAT3 overexpression enhanced the expression of miR-106a-5p in HuH-7 (E) and 293T (F) cells. RT-qPCR analysis was performed using HuH-7 or 293T cell lines with STAT3 overexpression and the corresponding control cell lines. (G and H) Transformed cell lines showed the increased expression of miR-106a-5p compared to their corresponding normal cell lines. HepG2 and HEK293T cell lines and their corresponding normal cell lines, including HL-7702 (G) and HEK293 (H) were cultured and harvested for the analysis of miR-106a-5p expression by RT-qPCR. (I and J) Cancer patients with high expression of miR-106a-5p exhibit low-survival probability and shorter-survival time compared to those with low expression of miR-106a-5p in both liver hepatocellular carcinoma (LIHC, I) and kidney renal papillary cell carcinoma (KIRP (Kidney renal papillary cell carcinoma), J). Each column in A–H represents the mean of SD of three biological replicates (n=3). *, p<0.05; **, p<0.01. p Values were obtained by Student’s t test performed with the data from control and treated samples. Mean, SD, and p values were calculated using GraphPad Prism 8 software.
-
Figure 7—source data 1
The predicted top score miRNAs targeting TP73 mRNA.
- https://cdn.elifesciences.org/articles/82826/elife-82826-fig7-data1-v2.xlsx
-
Figure 7—source data 2
Original digital data for Figure 7.
- https://cdn.elifesciences.org/articles/82826/elife-82826-fig7-data2-v2.xlsx
Figure 7—figure supplement 1
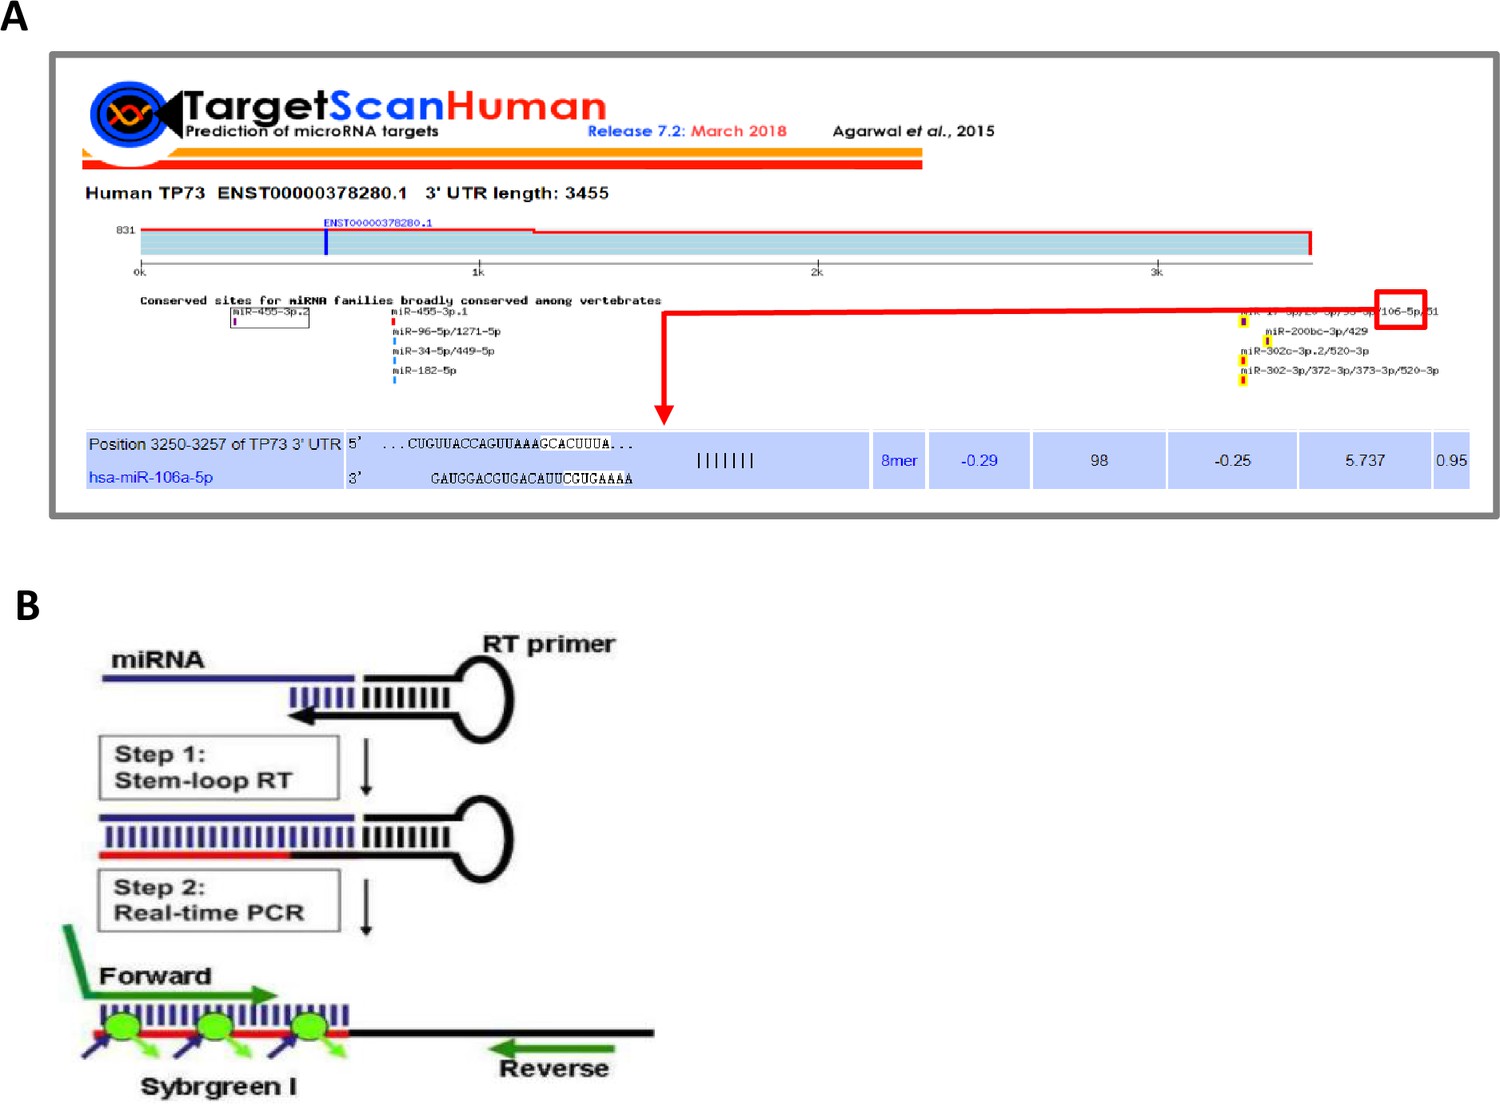
Schemes showing discovery and detection of miR-106a-5p.
Figure 8
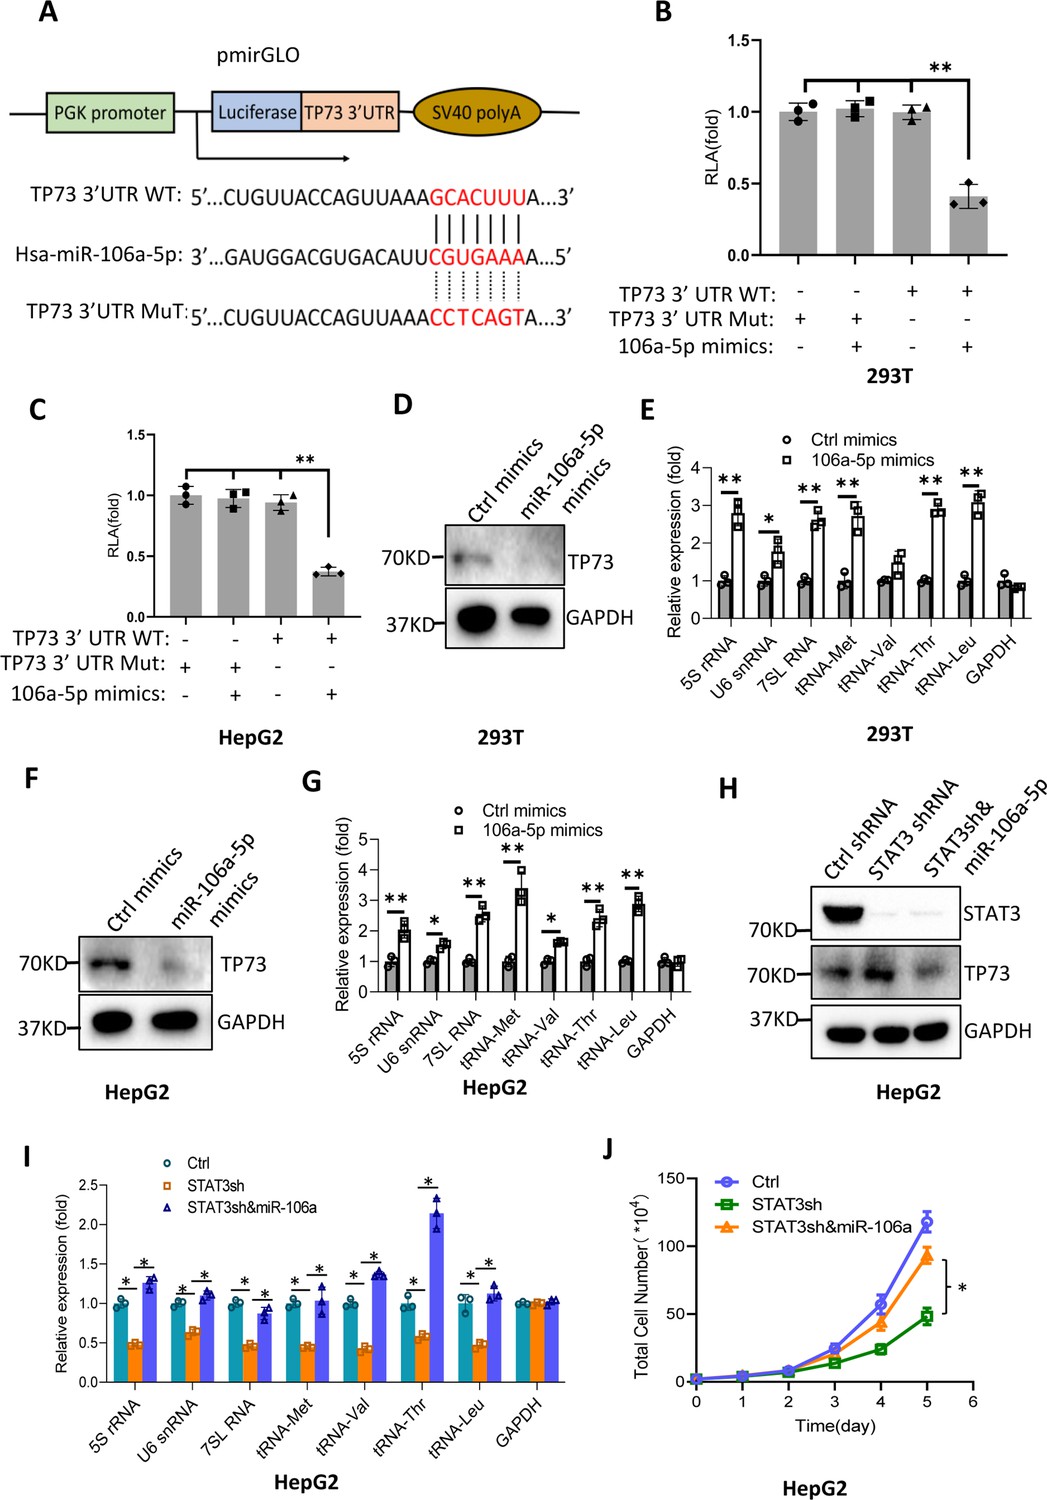
MiR-106a-5p activates Pol III-directed transcription by inhibiting TP73 expression.
(A) A diagram showing cloning of the TP73 3’UTR and the complementary region between miR-106a-5p and the wild-type TP73 3’UTR (WT) or the TP73 3’UTR mutant (MuT). (B and C) Co-transfection of miR-106a-5p mimics and reporter expression vectors containing a DNA fragment encoding the WT TP73 3’UTR decreased luciferase activity in 293T (B) and HepG2 cells (C). (D–G) Transfection of miR-106a-5p mimics activated the expression of Pol III products in both 293T (D and E) and HepG2 cells (F and G). TP73 and Pol III products were detected by western blot (D and F) and RT-qPCR (E and G), respectively. (H) Western blot results for HepG2 cells expressing STAT3 shRNA with or without transfection of miR-106a-5p mimics. (I) Transfection of miR-106a-5p mimics reversed the inhibition of Pol III-dependent transcription induced by STAT3 silencing. (J) Transfection of miR-106a-5p mimics reversed the inhibition of HepG2 cell proliferation induced by STAT3 silencing. Each column or point in histograms represents the mean of SD of three biological replicates (n=3). *, p<0.05; **, p<0.01. p Values were obtained by Student’s t test (B, C, E, G, and I) or two-way ANOVA (J). Mean, SD, and p values were calculated using GraphPad Prism 8 software.
-
Figure 8—source data 1
Raw images for Western blot data in Figure 8.
- https://cdn.elifesciences.org/articles/82826/elife-82826-fig8-data1-v2.zip
-
Figure 8—source data 2
Original digital data for Figure 8.
- https://cdn.elifesciences.org/articles/82826/elife-82826-fig8-data2-v2.xlsx
Figure 9 with 1 supplement

STAT3 positively regulates miR-106a-5p transcription by binding to the miR-106a-5p promoter.
(A) Chromatin immunoprecipitation (ChIP)-quantitative PCR (qPCR) results showing STAT3 binding to the miR-106a-5p promoter. ChIP assays were performed using HepG2 cells and an anti-STAT3 antibody. Relative enrichment was obtained as described in Figure 3A. (B) A scheme showing the cloning of the DNA fragment comprising the miR-106a-5p promoter and a miR-106a-5p gene. (C and D) Effect of STAT3 upregulation and downregulation on the activity of the miR-106a-5p promoter. HepG2 cell lines with STAT3 silencing (C) and overexpression (D) were transfected using the promoter-driven reporter vectors. Luciferase assays were performed using the cell lysate from transfected cell lines. (E and F) Effect of STAT3 upregulation and downregulation on the expression of exogenous miR-106a-5p. HepG2 cell lines with STAT3 silencing (E) and overexpression (F) were transfected with the promoter-driven reporter vectors. The expression of exogenous miR-106a-5p was detected by RT-qPCR using the primers targeting miR-106a-5p (FP) and luciferase mRNA (RP) as indicated in B. (G) A proposed model by which STAT3 regulates Pol III-directed transcription. Each column in A and C–F represents the mean of SD of three biological replicates (n=3). **, p<0.01. p Values were obtained by Student’s t test. Mean, SD, and p values were calculated using GraphPad Prism 8 software.
-
Figure 9—source data 1
Original digital data for Figure 9.
- https://cdn.elifesciences.org/articles/82826/elife-82826-fig9-data1-v2.xlsx
Figure 9—figure supplement 1
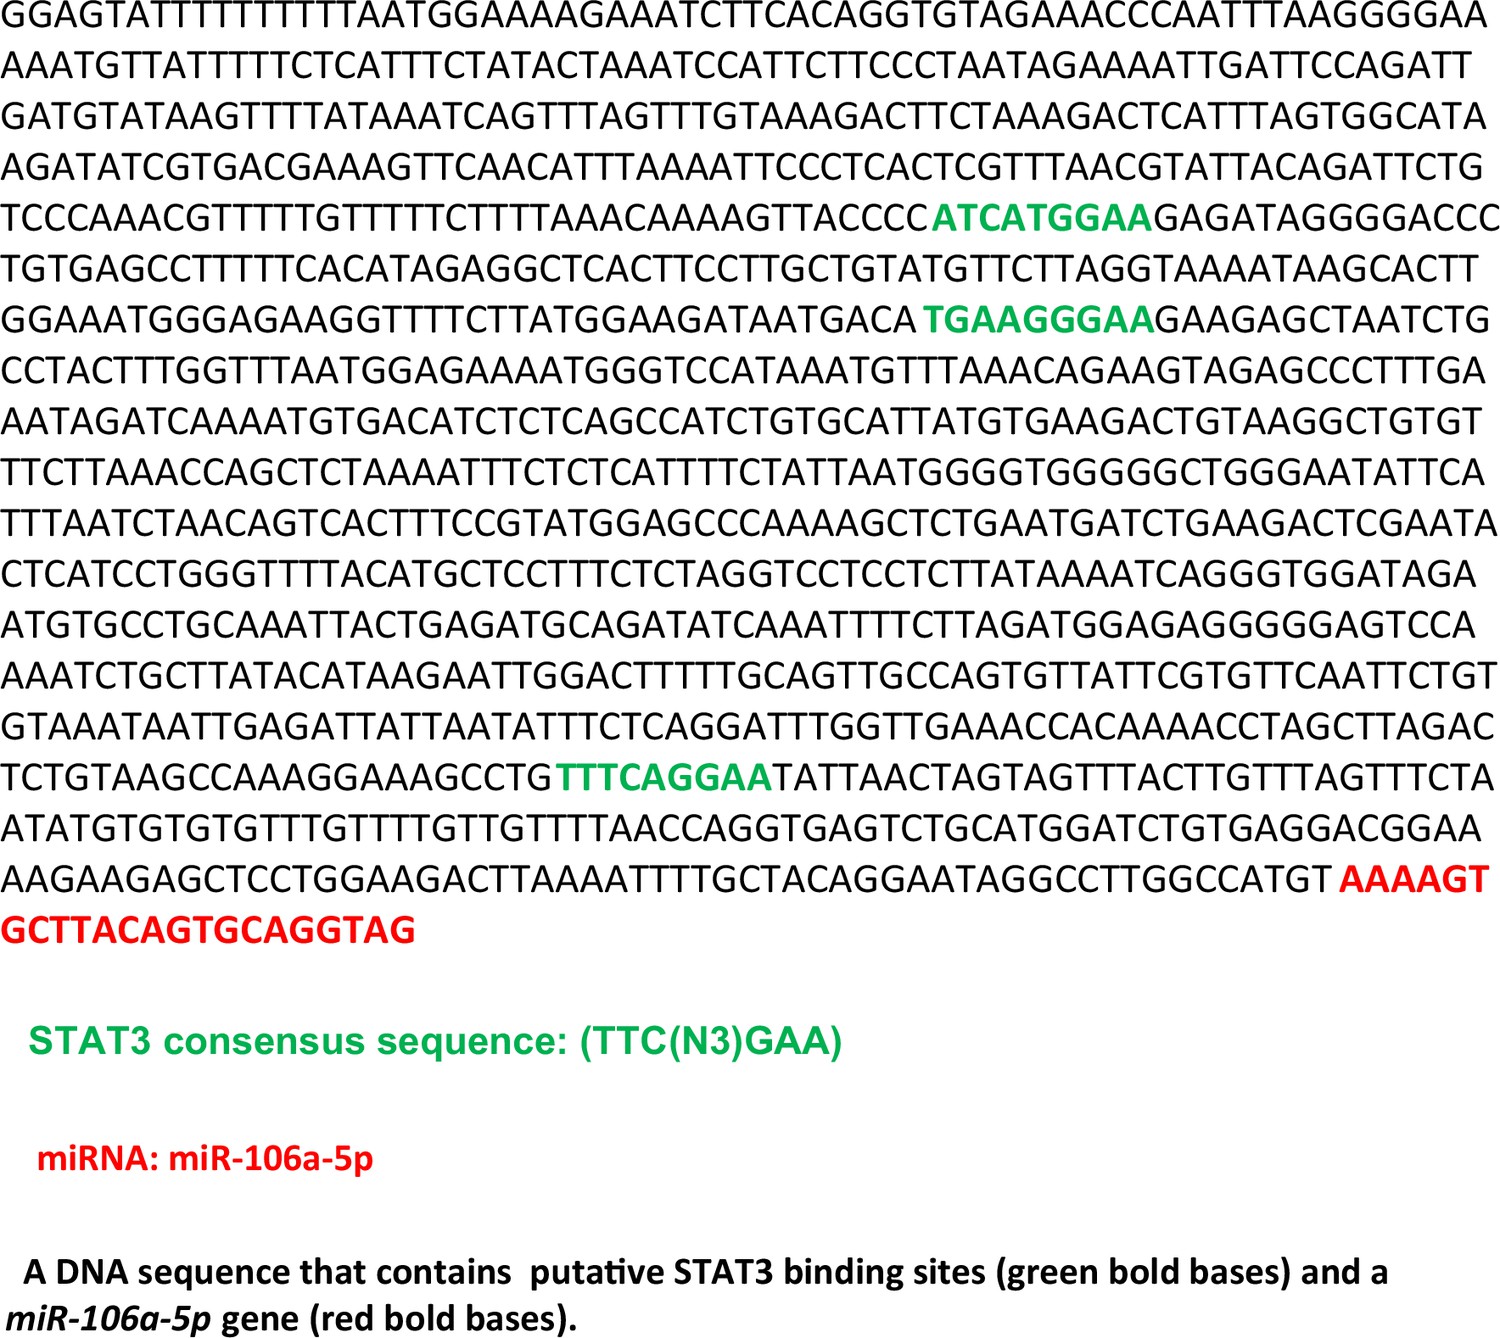
A DNA sequence that contains putative STAT3 binding sites (green bold bases) and a miR-106a-5p gene (red bold bases).
Additional files
-
Supplementary file 1
A table containing sequences for RT-qPCR primers and miRNAs.
- https://cdn.elifesciences.org/articles/82826/elife-82826-supp1-v2.xlsx
-
MDAR checklist
- https://cdn.elifesciences.org/articles/82826/elife-82826-mdarchecklist1-v2.docx
Download links
A two-part list of links to download the article, or parts of the article, in various formats.
Downloads (link to download the article as PDF)
Open citations (links to open the citations from this article in various online reference manager services)
Cite this article (links to download the citations from this article in formats compatible with various reference manager tools)
STAT3 promotes RNA polymerase III-directed transcription by controlling the miR-106a-5p/TP73 axis
eLife 12:e82826.
https://doi.org/10.7554/eLife.82826


