An extracellular vesicle targeting ligand that binds to Arc proteins and facilitates Arc transport in vivo
- Division of Biology and Biological Engineering, California Institute of Technology, United States
Figures
Figure 1 with 1 supplement
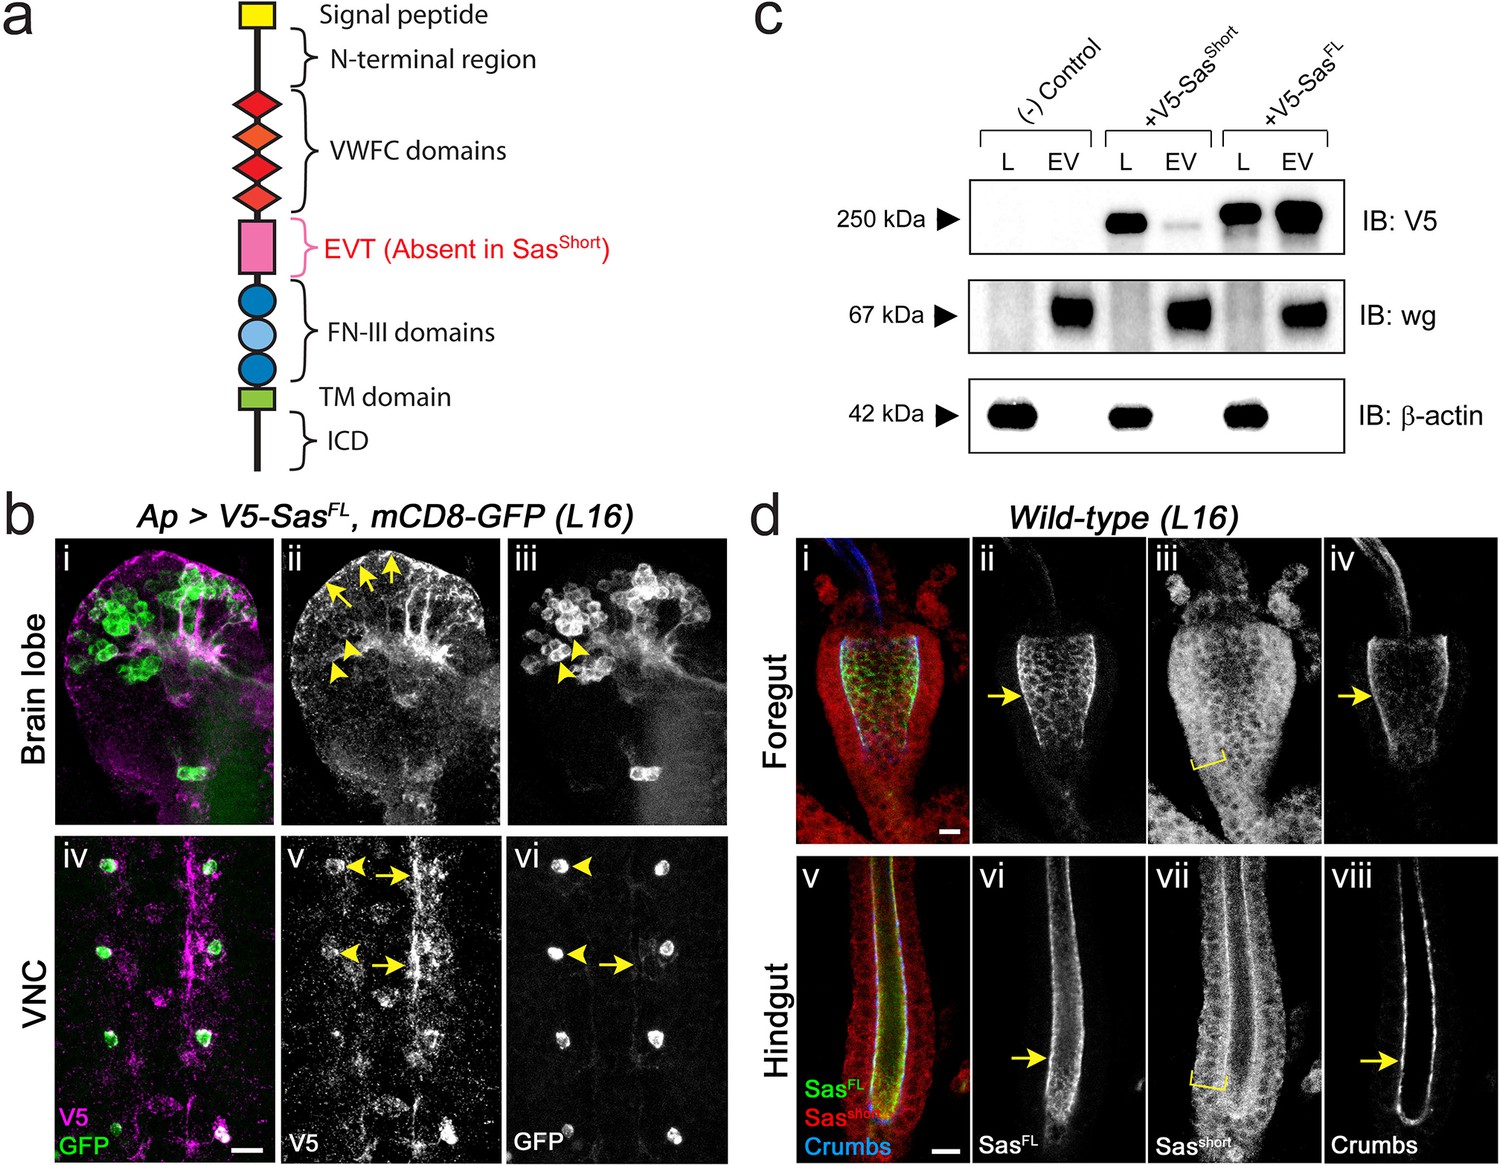
Localization of Sas isoforms.
(a) Schematic diagram of the SasFL protein. The Sasshort isoform lacks the EVT region. (b) SasFL moves away from expressing cells. V5-SasFL was expressed together with mCD8-GFP (transmembrane CSP) in Apterous neurons in late stage 16 embryos. (i,iv) double-labeling (V5, magenta; GFP, green); (ii, v) V5 channel; (iii, vi) GFP channel. (i-iii) Brain lobes. GFP labels cell bodies (arrowheads in iii) and axon tracts. V5 labels cell bodies only weakly (arrowheads in ii), strongly labels some axon tracts, and localizes to the periphery (sheath) of the brain lobes (arrows in ii). (iv-vi) Ventral nerve cord. GFP strongly labels Ap VNC cell bodies (arrowheads in vi) and weakly labels Ap axons (arrow in vi). V5 weakly labels cell bodies (arrowheads in v), and strongly labels segments of axons (arrows in v) and areas adjacent to the axons. These may be extracellular matrix and/or glial sheaths. Scale bar, 10 µm. (c) Western blot, showing that SasFL localizes to EVs. EVs were prepared from supernatants from S2 cells expressing the indicated protein, and equal amounts of cell lysate proteins and EV proteins were loaded on the gel. Top panel, anti-V5 blot. SasFL migrates slightly above the 250 kD marker, and Sasshort slightly below it. Middle panel, Wg (EV marker). Almost all of the Wg is in EVs. Bottom panel, anti-β-actin (cytoplasmic marker) blot. There is no signal in EVs. In these samples, 60% of SasFL and 10% of Sasshort is in EVs; the average over 4 experiments was 46% in EVs for SasFL and 10% for Sasshort. The absence of β-actin signal in the EVs shows that they are not heavily contaminated by cytosol. (d) Localization of endogenous Sas isoforms in the embryonic gut. Wild-type (wt) late stage 16 embryos were triple-stained for SasFL (using the [Schonbaum et al., 1992] antiserum, which primarily recognizes the EVT region; green), Sasshort (using our antipeptide antibody; red), and Crumbs (apical marker; blue). (i-iv) Foregut; (v-viii), hindgut. Note that in both gut regions SasFL colocalizes with Crumbs at the apical (luminal) cell surfaces (arrows), while anti-Sasshort labels the entire width of the gut wall (brackets). See Figure 1—figure supplement 1 for images of anti-Sasshort staining of wt and sas mutant embryos, demonstrating antibody specificity. Scale bar in d-i, 20 µm; in (d-v), 10 µm.
-
Figure 1—source data 1
Source data files for Figure 1 include raw and labelled images for the western blots shown in panel (c); source data files for Figure 1—figure supplement 1 include raw and labelled images for the western blots shown in panels (a) and (d).
- https://cdn.elifesciences.org/articles/82874/elife-82874-fig1-data1-v2.zip
Figure 1—figure supplement 1

Recognition of Sas isoforms by anti-Sas antibodies, retention of Sasshort by expressing cells, and comparison of EVs generated by ultracentrifugation and chemical reagents (Exosome Isolation Kit).
(a) Western blot of S2 cell lysates with antibodies against SasFL (Sas-PB/PD)(Schonbaum et al., 1992), Sasshort (Sas PA/PC), and β-tubulin. Left, S2 cells expressing SasFL; right, S2 cells expressing Sasshort. Anti-Sas-PB/PD recognizes a band of >250 kD, while anti-Sas-PA/PC recognizes a 180 kD band. (b) V5-Sasshort was expressed together with mCD8-GFP (transmembrane CSP) in Apterous neurons in late stage 16 embryos. Left panels: double-labeling (V5, magenta; GFP, green); middle panels: V5 channel; right panels: GFP channel. Top panels, brain lobes. GFP labels cell bodies (arrowheads). V5 labels a subset of these cell bodies (arrowheads). Bottom panels, ventral nerve cord. GFP strongly labels Ap VNC cell bodies (arrowheads). V5 labels cell bodies (arrowheads) and segments of axons. Scale bar, 10 µm. (c) Side views of late stage 16 wt (b) and sas15 (null mutant) (c) whole embryos, triple-stained with anti-SasFL, anti-Sasshort, and anti-Crumbs. ii’, v’ show the anti-SasFL channel only, and iii’’, vi’’ show the anti-Sasshort channel. Note that there is no detectable staining of the sas mutant embryo with either antibody, showing that the anti-Sasshort antibody recognizes Sas in vivo and does not detectably cross-react with other proteins. Scale bar, 50 µm. (d) Western blot with anti-V5 (top) and anti-Wg (bottom), comparing EVs made by a standard ultracentrifugation protocol (left) and using the Exosome Isolation Kit (right). Both EV samples contain the >250 kD SasFL and 67 kD Wg proteins.
-
Figure 1—figure supplement 1—source data 1
Raw data from western blots comparing two EV samples.
- https://cdn.elifesciences.org/articles/82874/elife-82874-fig1-figsupp1-data1-v2.zip
Figure 2 with 2 supplements
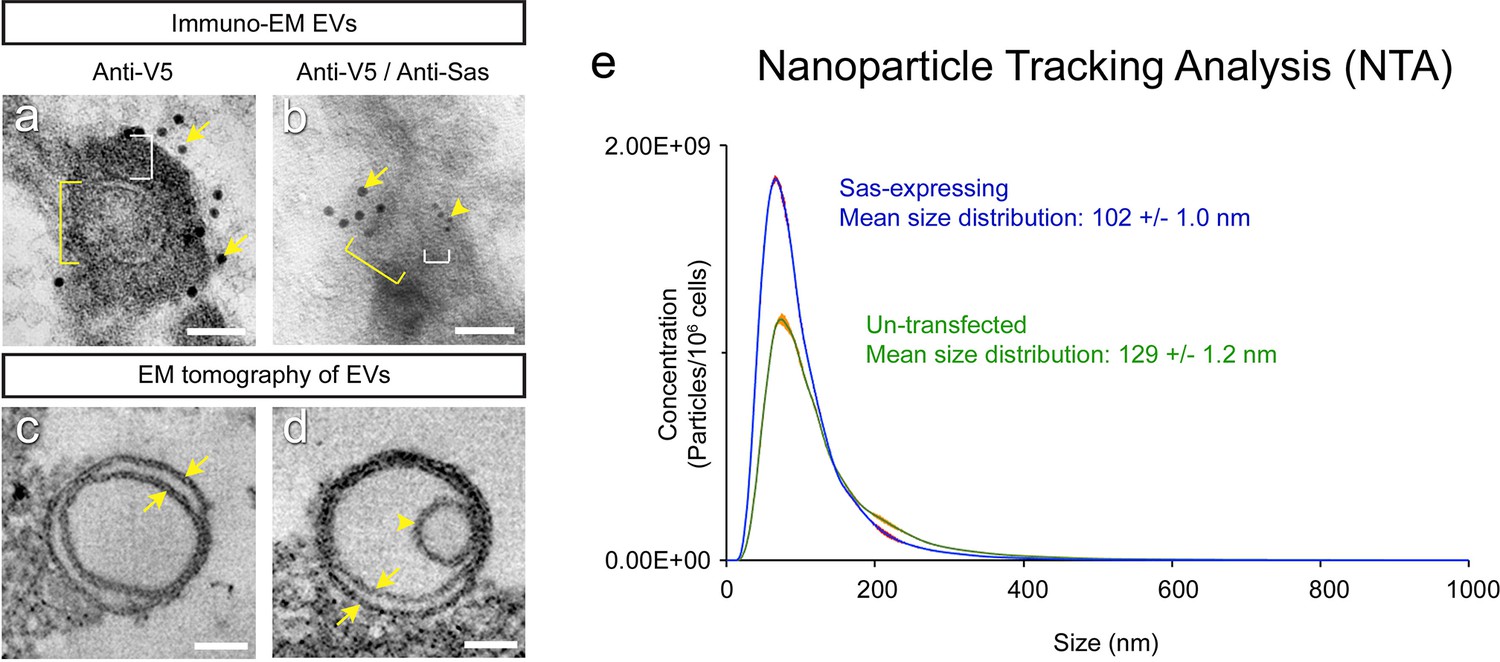
Analysis of EVs by electron microscopy and nanoparticle tracking analysis.
(a, b) Immuno-EM images of EVs from a purified EV prep from V5-SasFL-expressing S2 cells. EV outline (membrane) diameters are indicated by yellow brackets. White brackets, separation between EV outline and a gold particle. (a) Immuno-EM with 10 nm anti-V5 gold particles (arrows). (b) Immuno-EM with both 10 nm anti-V5 (large gold, arrow) and 5 nm anti-Sas (small gold, arrowhead). (c) EM tomogram of an empty double-membrane vesicle (arrows). Apparent EV sizes differ between immuno-EM and tomography, which use very different preparation methods. A low-mag view of a single slice from an EM tomogram of an EV preparation is shown in Figure 2—figure supplement 1. (d) EM tomogram of a double-membrane vesicle (arrows) with a capsid-sized denser object inside it (arrowhead). Figure 2—figure supplement 1 shows a 3D reconstruction of this EV. Empty and filled single-membrane EVs were also observed (Figure 2—figure supplement 1). Scale bars in (a–d), 50 nm. (e) Nanoparticle Tracking Analysis (conventional NTA with NanoSight) of purified EV preparations from untransfected (green curve) and SasFL-expressing (blue curve) S2 cells. The mean size distribution is indicated. Standard error indicated by red color around curves. Source data files include an Excel file of raw data for the NTA analysis, the conversion of the numbers from numbers of EVs per sample to numbers of EVs per cell, based on cell counts, and plots of the data.
-
Figure 2—source data 1
NTA raw data.
- https://cdn.elifesciences.org/articles/82874/elife-82874-fig2-data1-v2.zip
Figure 2—figure supplement 1
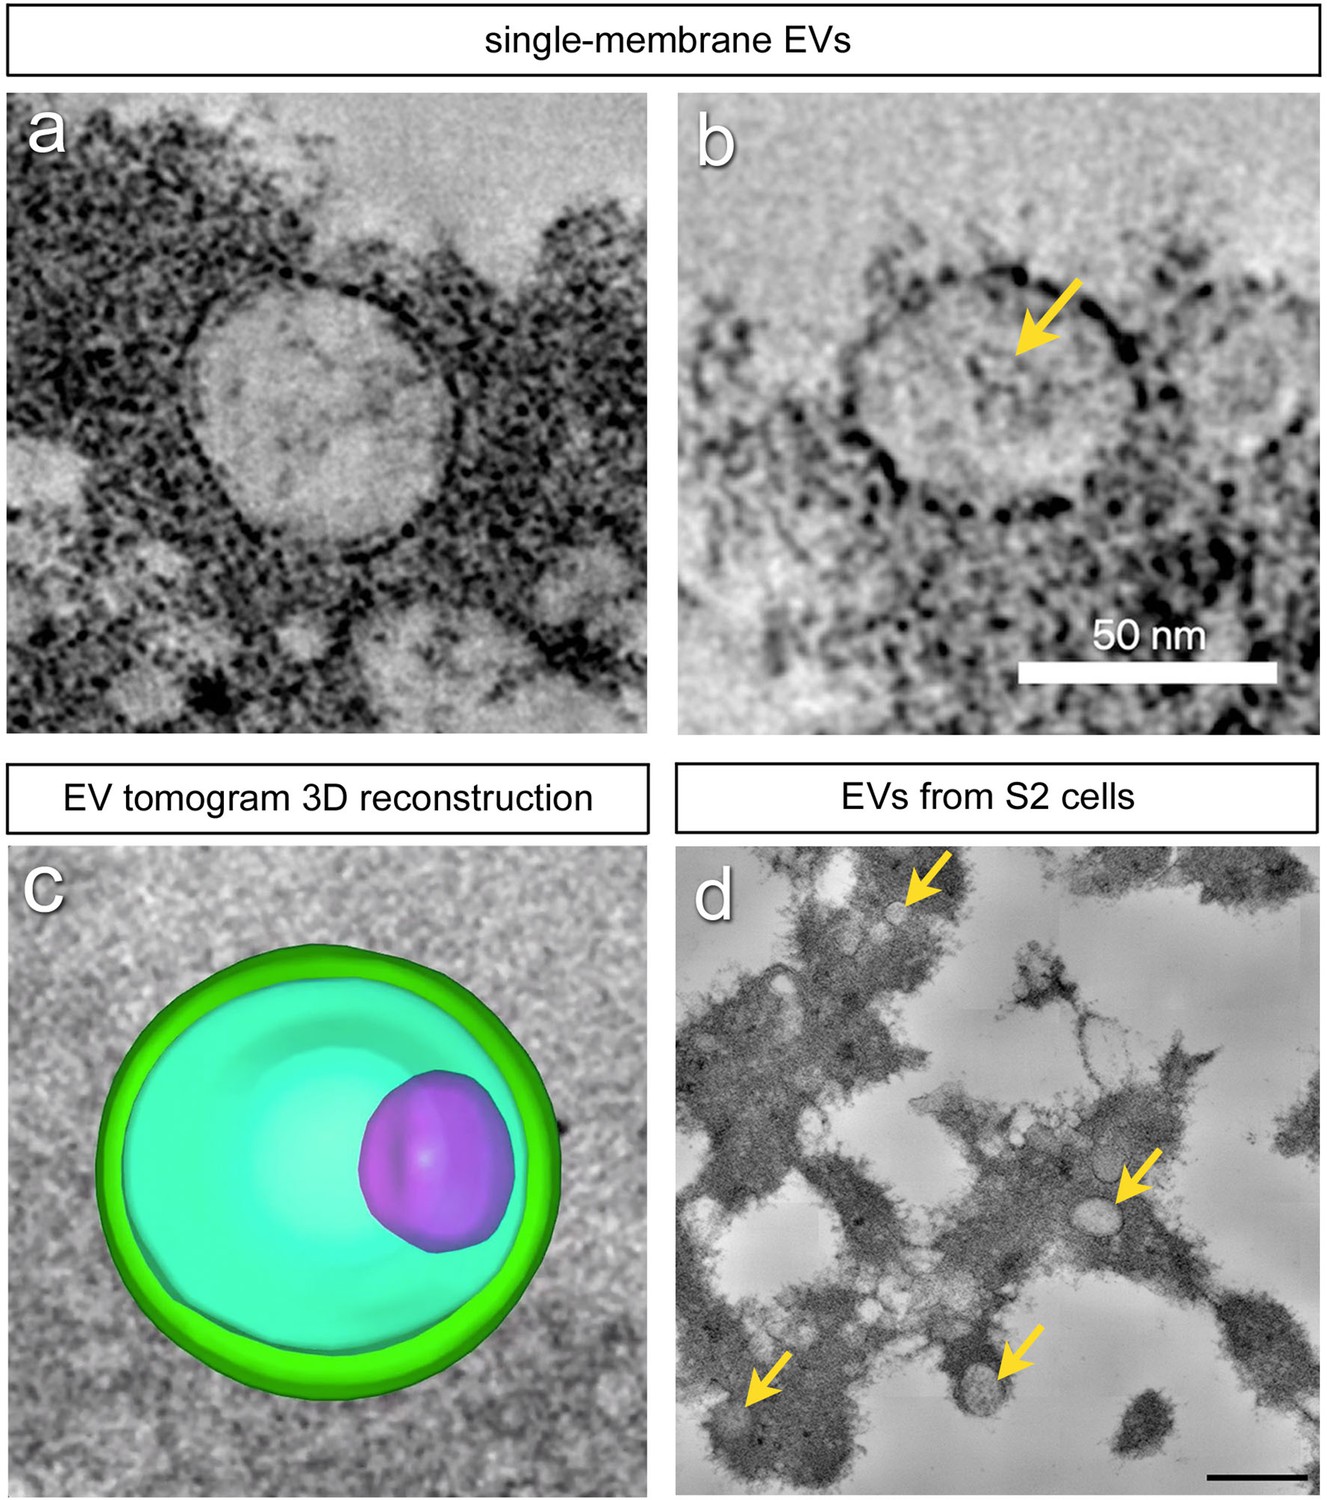
EM analysis of EVs from SasFL-expressing S2 cells.
(a) Tomogram of an empty single-membrane EV. (b) Tomogram of a single-membrane EV enclosing a denser object (arrow). Scale bars in (a–b), 50 nm. (c) A still image from , which displays a reconstruction of the double-membrane EV from Figure 2d. The denser object inside the EV is in magenta. (d) A low-magnification image of a single slice from a tomogram, showing multiple EVs of various sizes (arrows). Scale bar in (d), 200 nm.
Figure 2—video 1
This video shows the 3D reconstruction of the tomogram of the EV shown in Figure 2d, which contains a denser object within it.
Figure 3 with 1 supplement
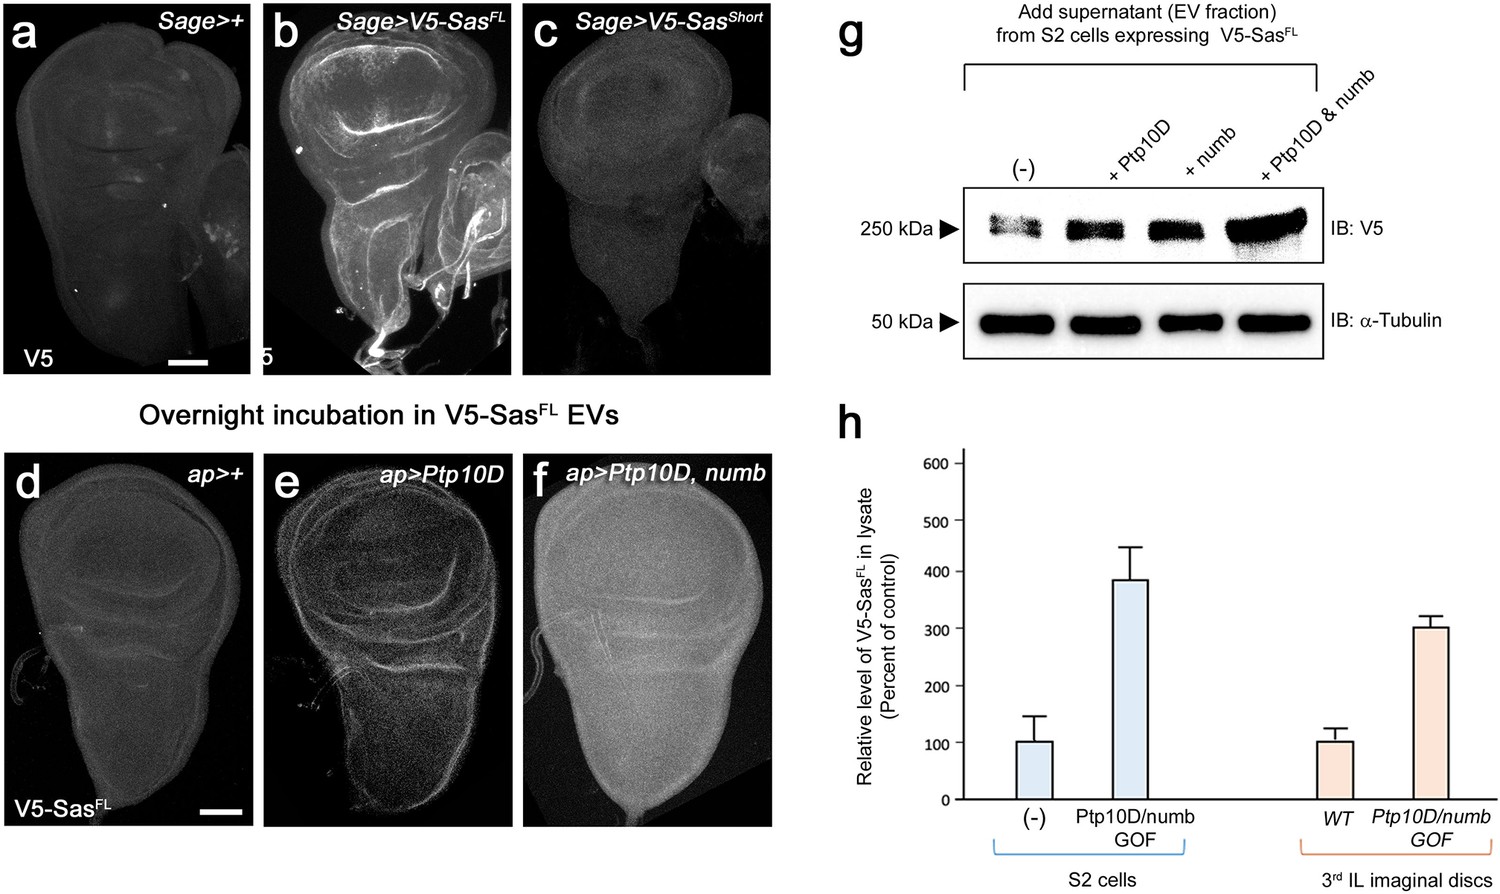
Transfer of SasFL to recipient cells.
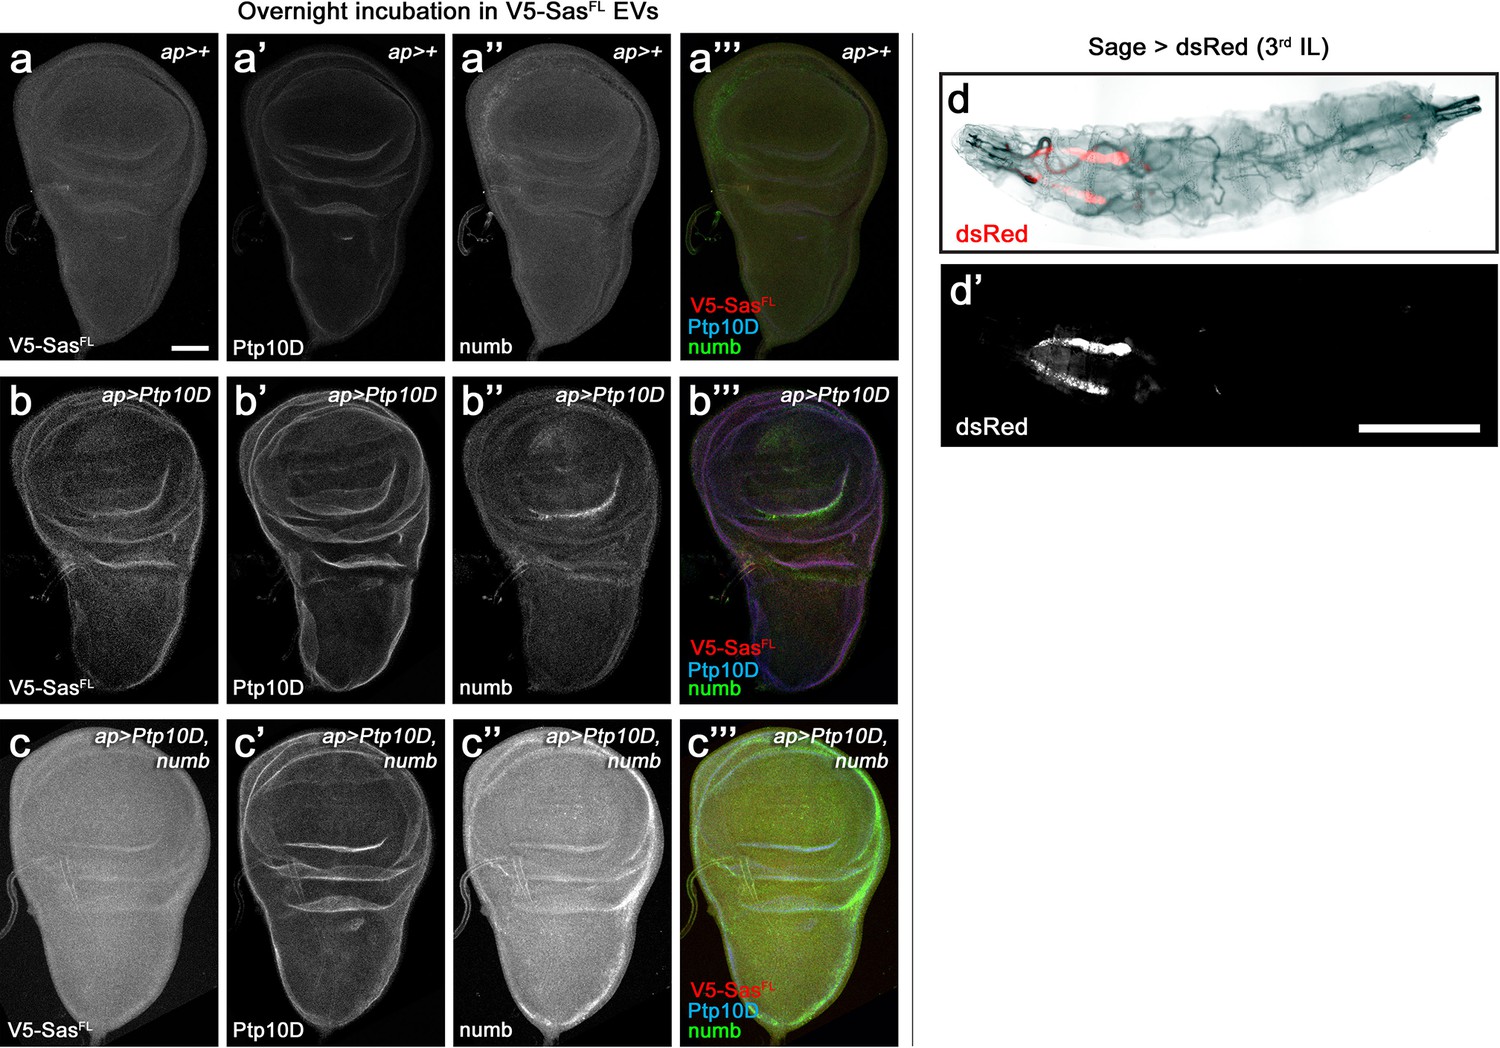
(a) A third instar wing disc, with a portion of the haltere disc (right side), from a Sage-GAL4/+ (SG-specific driver) larva, showing no V5 staining. (b) A wing disc, with a portion of the haltere disc, from a Sage >V5-SasFL larva, showing bright V5 staining. (c) A wing disc, with a portion of the haltere disc, from a Sage >V5-Sasshort larva, showing little or no V5 staining. Imaginal discs display no expression of GFP or mCherry reporters driven by Sage-GAL4. (d-f) Wing discs incubated with EVs from V5-SasFL-expressing S2 cells and stained with anti-V5. For anti-Ptp10D and anti-Numb staining, see Figure 3—figure supplement 1. (d) ap-GAL4/+; (e) ap >Ptp10 D; (f) ap >Ptp10 D+Numb. (d) Low levels of anti-V5 staining are observed. (e) Higher levels are observed in disc folds, which also express Ptp10D (Figure 3—figure supplement 1). (f) Bright anti-V5 staining is observed throughout the disc. This pattern matches anti-Numb staining (Figure 3—figure supplement 1). Scale bars in (a) and (d), 50 µm. (g) Transfer of SasFL from EVs into recipient S2 cells. Supernatants from S2 cells expressing V5-SasFL were incubated with cultures of untransfected S2 cells or cells expressing Ptp10D, Numb, or both, and cell lysates analyzed by western blotting with anti-V5. Note that V5-SasFL levels were elevated relative to control cells by expression of either Ptp10D or Numb, and that levels were further increased by coexpression of Ptp10D and Numb coexpression. (h) Quantitation of results from panels (d-f) and (g). Levels of transferred V5-SasFL were increased by ~fourfold relative to untransfected controls by Ptp10D+Numb coexpression in S2 cells (n=6), and by ~threefold relative to ap-GAL4/+control by Ptp10D+Numb coexpression in wing discs (n=5). Quantitation was done using Image J.
-
Figure 3—source data 1
Source data files include raw and labelled images for the western blots shown in panel (g), and an Excel file of the quantitation of the western blot and disc immunofluorescence signals used to generate panel (h).
- https://cdn.elifesciences.org/articles/82874/elife-82874-fig3-data1-v2.zip
Figure 3—figure supplement 1
Visualization of all three channels for the triple-stained wing discs shown in Figure 3, and expression of the Sage-GAL4 driver in SGs in whole larvae.
(a-c) show the anti-V5 channel, (a’-c’) the anti-Ptp10D channel, (a’’-c’’) the anti-Numb channel, and (a’’’-c’’’) all three channels. When Numb is overexpressed, it labels the entire disc (c’’). Ptp10D localizes to cells in disc folds when overexpressed (b’ and c’). These folds label brightly with anti-V5 in b. (d, d’) Whole larva expressing dsRed from the Sage-GAL4 driver. (d) Phase-contrast/fluorescent image, showing dsRed in SGs (red). (d’) Fluorescent signal alone, in white. Note that there is no fluorescence outside the SGs, demonstrating the specificity of the driver. Scale bar in (a), 50 µm; scale bar in d’, 1 mm.
Figure 4
Interactions of Sas, Appl, and APP with Arcs.
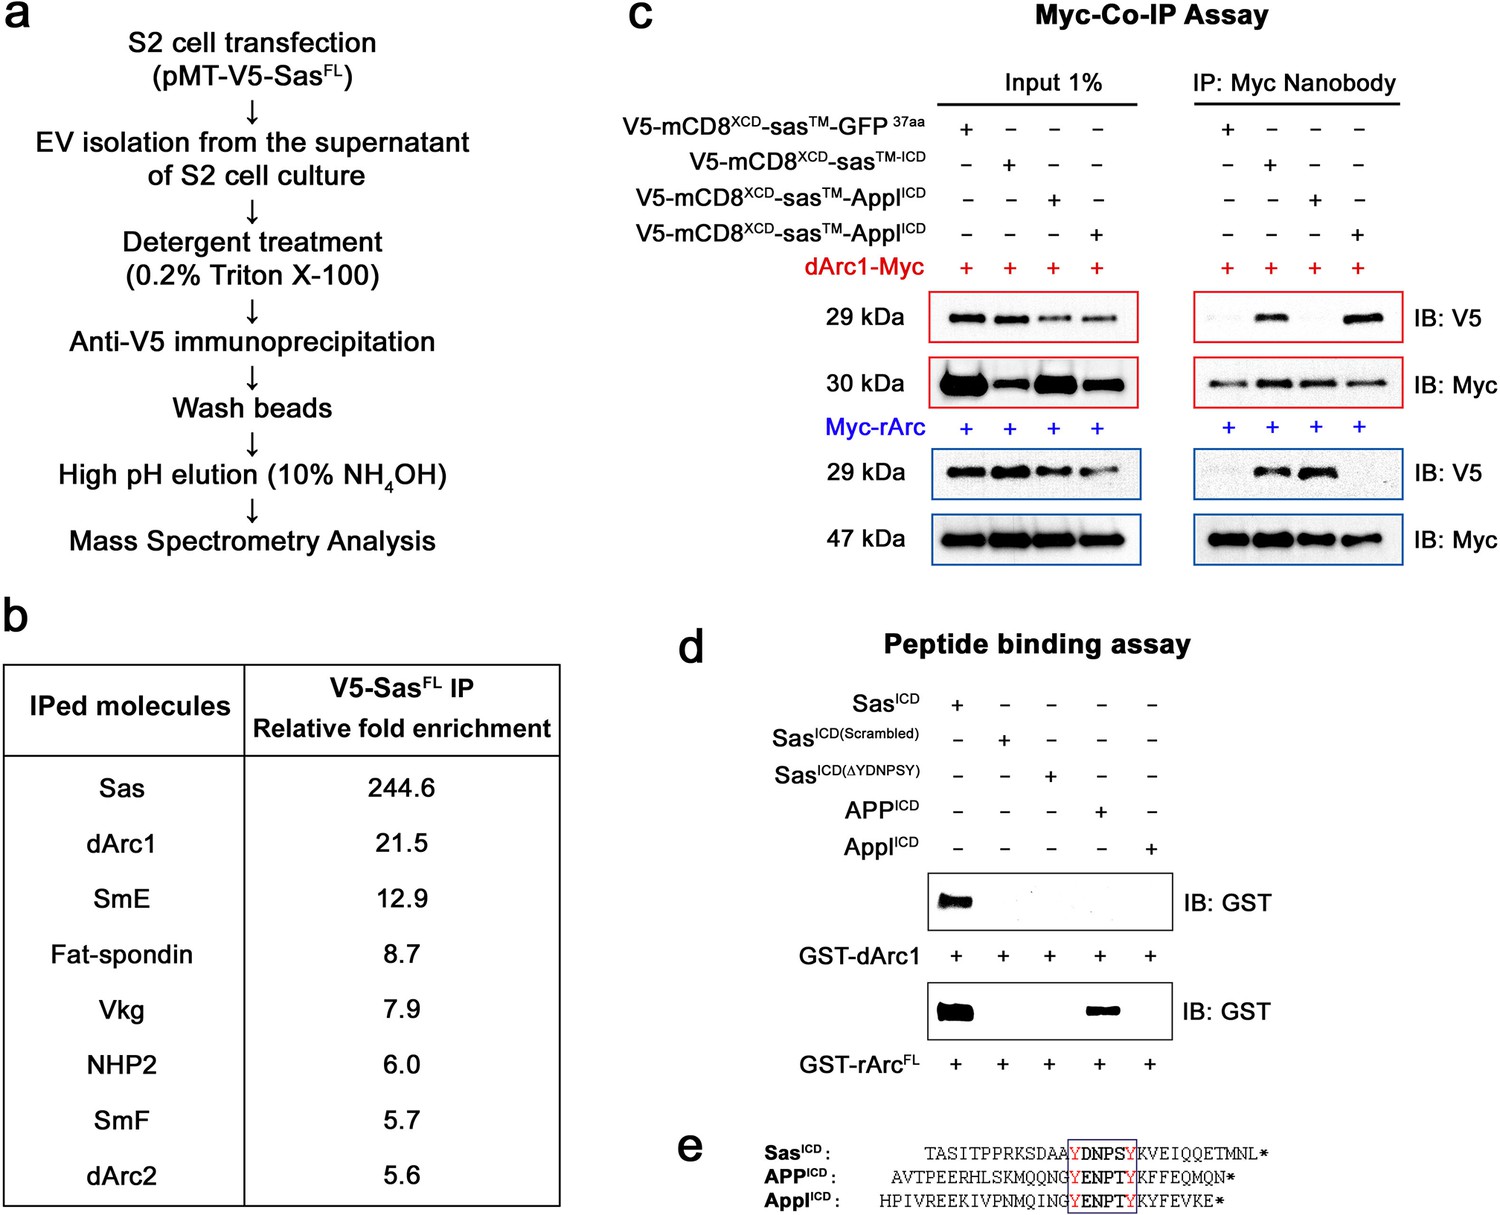
(a) Protocol for mass spectrometry analysis. Purified EVs from control S2 cells or S2 cells expressing V5-SasFL were lysed and IP’d with anti-V5, followed by protease digestion and mass spectrometry analysis. (b) Mass spectrometry results. The 7 proteins present at the highest levels in IPs from V5-SasFL EVs relative to IPs from control EVs (>6 fold ratio) are listed. Sas itself was the most highly enriched protein, as expected. dArc1 and dArc2 were enriched by 22-fold and 6-fold, respectively. (c) Co-IP/western blot analysis of association between Sas and Arc fusion proteins in transfected S2 cells. S2 cells were transfected with the V5-mCD8ECD-SasTM-ICD fusion protein construct, or with equivalent constructs in which the Sas ICD was replaced by the Appl or APP ICD, with or without Myc-tagged dArc1 or mammalian (rat) Arc (rArcFL) constructs. Lysates (Input 1%) were blotted with anti-Myc and anti-V5 (left), and IP’d with anti-Myc nanobody and blotted with anti-V5 and anti-Myc (right). Anti-V5 bands of the correct size were observed in anti-Myc IPs when dArc1-Myc was expressed with Sas or Appl ICD constructs (red symbols and boxes), and when Myc-rArcFL was expressed together with Sas or APP ICD constructs (blue symbols and boxes)(n=6). (d) Direct binding of purified GST-dArc1 and GST-rArcFL fusion proteins to Sas, APP, and Appl ICD peptides, as well as to scrambled and YDNPSY deletion mutant Sas peptides. Biotinylated peptides were bound to streptavidin magnetic beads, which were incubated with GST-Arc proteins, followed by western blotting of bead-bound proteins with anti-GST. GST-dArc1 bound to the wild-type, but not to scrambled or YDNPSY deletion mutant Sas ICD peptides, while GST-rArcFL bound to wild-type Sas and APP ICD peptides. (e) Sequences of the complete Sas, APP, and Appl ICDs, corresponding to biotinylated peptide sequences. The conserved tyrosine motif is boxed, with tyrosines in red. *, stop codons.
-
Figure 4—source data 1
Source data files include raw and labelled images for the western blots shown in panels (c) and (d) and an Excel file of the table in panel (b).
- https://cdn.elifesciences.org/articles/82874/elife-82874-fig4-data1-v2.zip
-
Figure 4—source data 2
Co-IP analyses raw data.
- https://cdn.elifesciences.org/articles/82874/elife-82874-fig4-data2-v2.zip
-
Figure 4—source data 3
Peptide binding assay raw data.
- https://cdn.elifesciences.org/articles/82874/elife-82874-fig4-data3-v2.zip
-
Figure 4—source data 4
MS analysis result table.
- https://cdn.elifesciences.org/articles/82874/elife-82874-fig4-data4-v2.xlsx
Figure 5 with 2 supplements
Sas facilitates transfer of dArc1 capsids bearing dArc1 mRNA into distant cells in vivo.
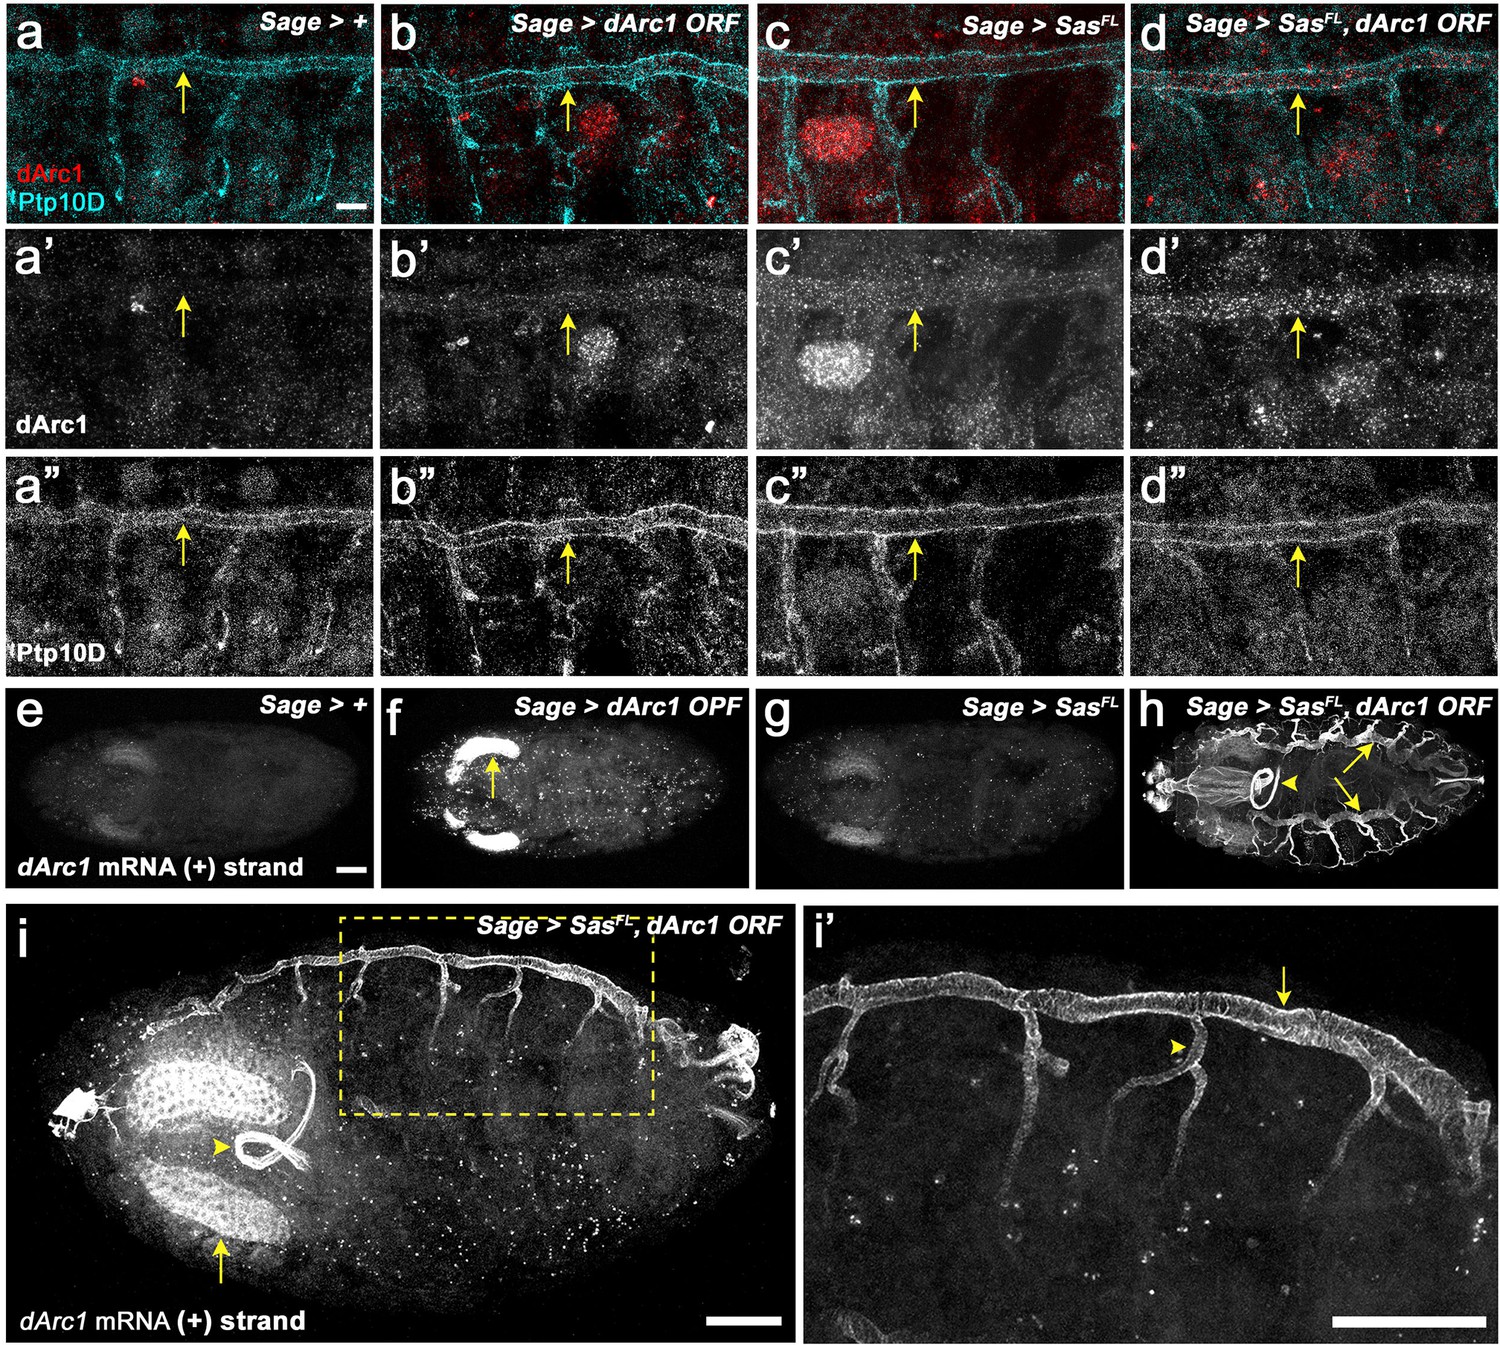
(a-d) Localization of dArc1 protein and Ptp10D in high-magnification views of body walls from fillets of late stage 16 embryos (anterior to the left, dorsal up). (a) Control (Sage-GAL4/+); (b) Sage >dArc1; (c), Sage >SasFL; (d), Sage >SasFL + dArc1. (a–d) show double-staining with anti-dArc1 (red) and anti-Ptp10D (blue). (a’-d’) show the dArc1 channel alone. (a’’-d’’) show the Ptp10D channel alone. Arrows, dorsal tracheal trunk. There are numerous bright dArc1 puncta in the tracheal trunk when SasFL and dArc1 are expressed together. Fewer and weaker puncta are observed when SasFL or dArc1 are expressed alone, and no puncta are seen in Sage-GAL4/+ controls. (e–i) dArc1 mRNA from the endogenous gene (+strand), detected by FISH with a 3’ UTR minus-strand (antisense) probe. (e) Control (Sage-GAL4/+); (f) Sage >dArc1; (g) Sage >SasFL; (h) Sage >SasFL + dArc1. There is weak expression of dArc1 mRNA in the SGs in controls. When dArc1 (from an ORF construct) is expressed alone, bright SG staining is observed, indicating that exogenous dArc1 increases expression of endogenous dArc1 mRNA. There are also scattered dArc1 mRNA puncta elsewhere in the embryo. When SasFL and dArc1 are expressed together, bright dArc1 mRNA FISH staining of the entire tracheal system is observed (arrows indicate dorsal tracheal trunks), as well as the foregut (arrowhead) and esophagus (n>100 embryos examined for each genotype; representative results are shown). i, i’, high-magnification views of dArc1 mRNA in the tracheae in an obliquely mounted (anterior to the left, dorsal up) embryo expressing SasFL and dArc1 in SGs. i’ is a higher-magnification inset (yellow dotted outline) from (i). Arrow in (i), SG; arrowhead, foregut loop. Arrow in i’, dorsal tracheal trunk; arrowhead, transverse connective. Scale bar in (e) (applies to e–h), 50 µm; scale bar in (a) (applies to a–d), 10 µm; scale bar in (i), 50 µm; scale bar in (i’), 50 µm.
Figure 5—figure supplement 1
Ptp10D expression in wt, and V5-SasFL and V5-Sasshort localization in embryos in which they are expressed from Sage-GAL4.
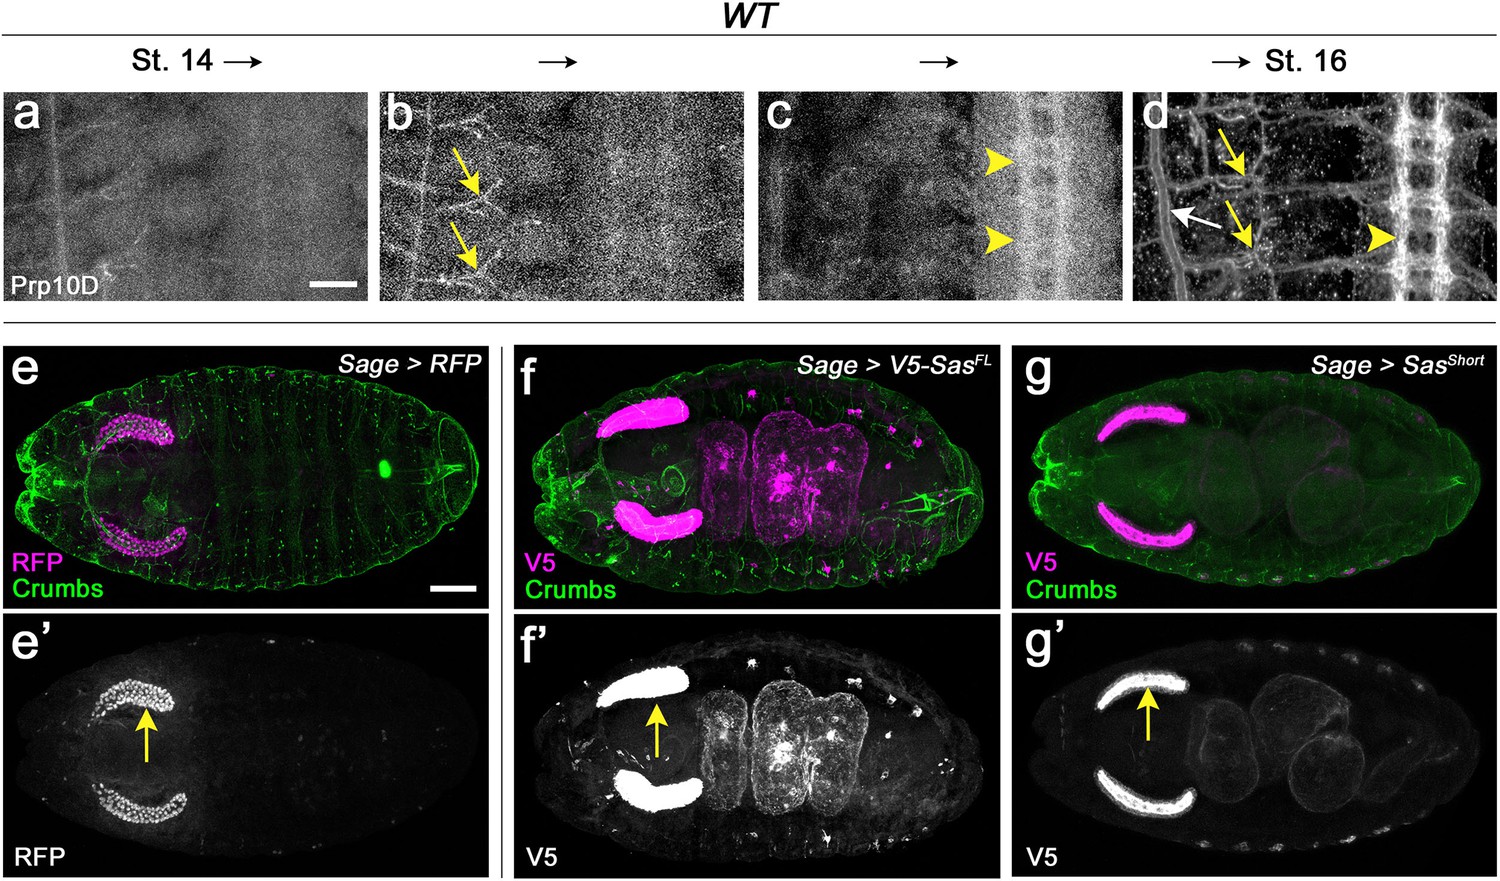
(a-d) Expression of Ptp10D in the tracheae (arrows) and VNC axons (arrowheads) of wt embryos of advancing age, from stage 14 (a), through stage 15 and early 16 (b and c), to late stage 16 (d). In (d), the white arrow indicates the dorsal tracheal trunk and the yellow arrows indicate transverse connectives (also indicated in b). (e–g) Localization of RFP (e), V5-SasFL (f), and V5-Sasshort (g), driven by Sage-GAL4. Whole-mount late stage 16 embryos (top-down view, anterior to the left) were double-stained with anti-RFP (e) or anti-V5 (f,g) (magenta) plus anti-Crumbs (apical marker, expressed in epithelia, including tracheae; green). e’ shows the RFP channel alone, and f’ and g’ show the V5 channel. Arrows, SGs. Note that V5-SasFL is observed in the gut and peripheral dots, while RFP and V5-Sasshort are retained in the SGs. Scale bar in a (applies to a–d), 20 µM; scale bar in e (applies to e–g), 50 µM.
Figure 5—figure supplement 2

dArc1 protein localization, and additional FISH results with the SV40 3’ UTR and dArc1 3’ UTR antisense and sense (control) probes.
(a-d) Localization of dArc1 protein in whole-mount late stage 16 embryos. (a) Control (Sage-GAL4/+); (b) Sage >dArc1 ORF; (c) Sage >SasFL; (d) Sage >SasFL + dArc1 ORF. (a–d) show double-staining with anti-dArc1 (magenta) and anti-Crumbs (green). (a’-d’) show the dArc1 channel alone. Arrows, SGs. Bright dArc1 SG staining is observed when dArc1 is expressed. When SasFL and dArc1 are both expressed, bright dArc1 staining of the gut and peripheral dots is observed. Weaker gut staining is observed when dArc1 is expressed alone. (e–h) FISH analysis of these 4 genotypes, using a + (sense) strand dArc1 3’ UTR probe, which would detect the (-) strand. No specific signal is observed. (i) FISH analysis of embryos expressing Sasshort and dArc1 ORF from Sage-GAL4. No signal is observed outside of the SGs (arrow). (j) FISH analysis of dArc1 mRNA expression in embryos expressing SasECD-TM-GFP and dArc1 ORF from Sage-GAL4. No signal is observed outside of the SGs. (i’-j’), FISH analysis of these two genotypes, using a + (sense) strand dArc1 3’ UTR probe. No specific signal is observed. (k–m), FISH analysis of embryos expressing dArc1 ORF, SasFL and dArc1 ORF, and Sasshort and dArc1 ORF from Sage-GAL4, with SV40 3’ UTR antisense strand (+) (k–m) and SV40 3’ UTR sense strand (-) (k’-m’) probes. Signal is observed only in the SGs (arrows) with the antisense probe (detecting the +strand), and no signal is observed with the sense probe. Scale bars in (a) and (e) (applies to all panels), 50 µm.
Figure 6
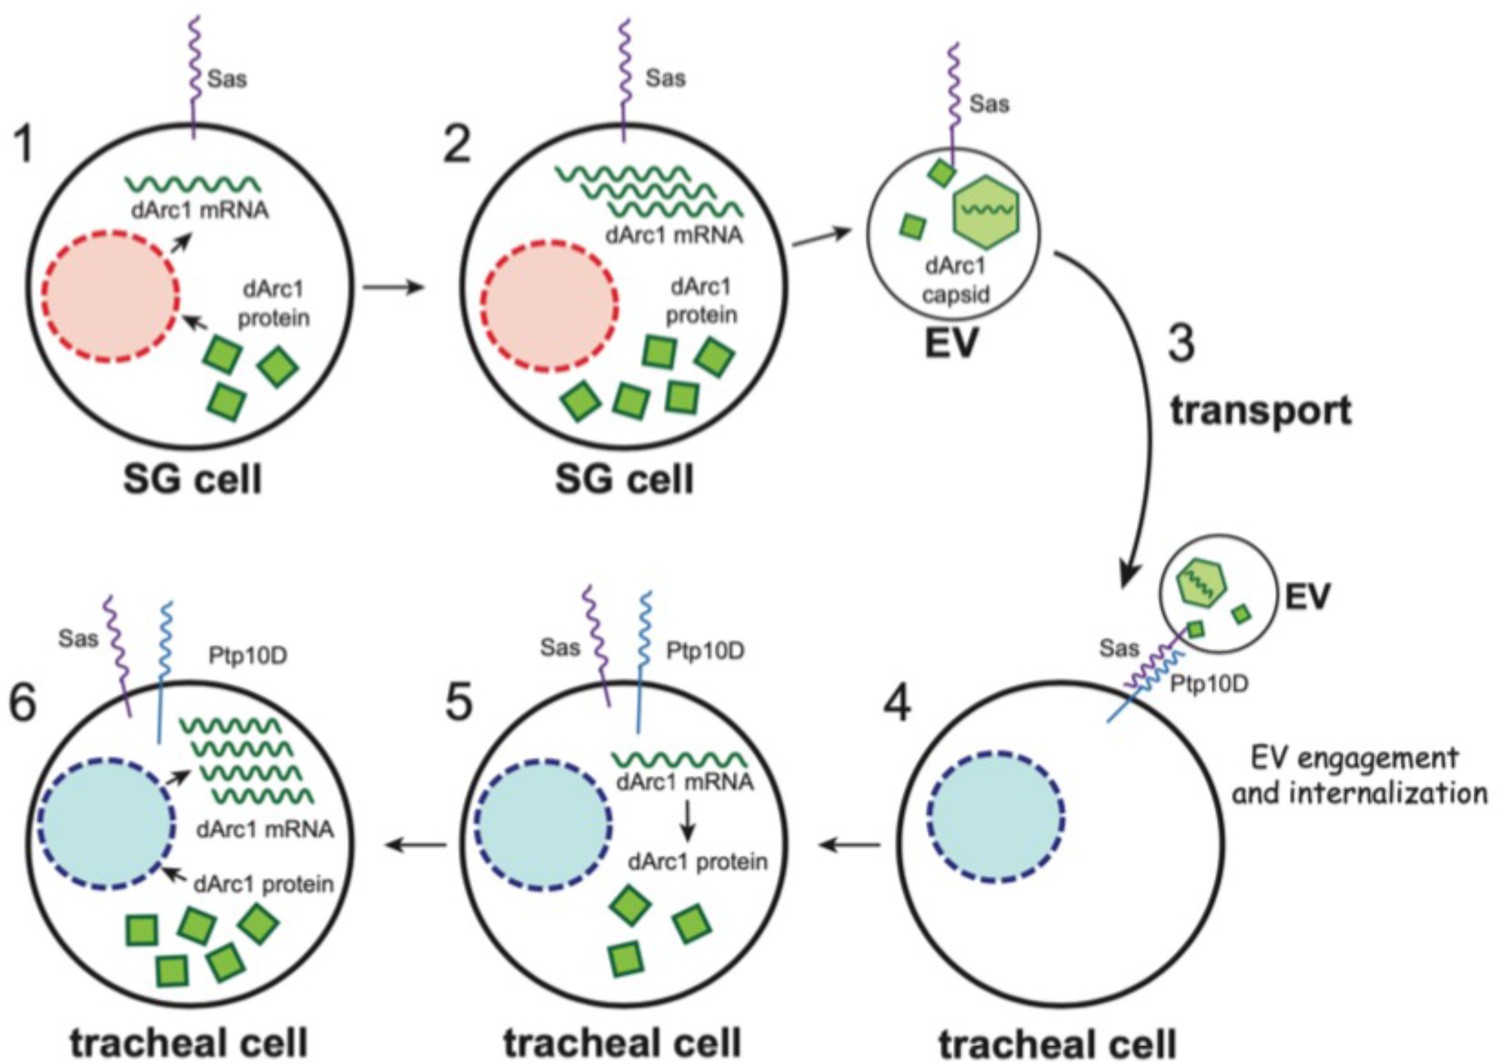
Schematic diagram of the processes involved in movement of EVs bearing SasFL and dArc1 capsids from salivary glands to tracheal cells.
Steps 1 and 2, the presence of the dArc1 protein made from a UAS-dArc1 ORF construct increases expression of endogenous dArc1 mRNA in embryonic SGs. EVs with SasFL on their surfaces bearing dArc1 capsids containing endogenous dArc1 mRNA diffuse or are transported through the hemolymph (Step 3) and bind to Ptp10D-expressing tracheal cells (Step 4). The EVs internalize into the tracheal cells and release dArc1 mRNA (Step 5), and dArc1 protein translated from that mRNA induces expression of more endogenous dArc1 mRNA (Steps 5 and 6). Nuclei, orange circles in 1–2 and blue circles in 4–6.
Additional files
-
Supplementary file 1
Sas IP MS analysis raw data.
- https://cdn.elifesciences.org/articles/82874/elife-82874-supp1-v2.xlsx
-
MDAR checklist
- https://cdn.elifesciences.org/articles/82874/elife-82874-mdarchecklist1-v2.docx
Download links
A two-part list of links to download the article, or parts of the article, in various formats.
Downloads (link to download the article as PDF)
Open citations (links to open the citations from this article in various online reference manager services)
Cite this article (links to download the citations from this article in formats compatible with various reference manager tools)
An extracellular vesicle targeting ligand that binds to Arc proteins and facilitates Arc transport in vivo
eLife 12:e82874.
https://doi.org/10.7554/eLife.82874


