A cryogenic, coincident fluorescence, electron, and ion beam microscope
- Department of Imaging Physic, Delft University of Technology, Netherlands
- Delmic B.V, Netherlands
- Kavli Institute of Nanoscience, Delft University of Technology, Netherlands
- California Institute of Technology, United States
- Brigham Young University, United States
- Department of Cell and Chemical Biology, Leiden University Medical Center, Netherlands
- CryoEM Technology, Max Planck Institute of Biochemistry, Germany
- Department of Structural Biochemistry, Max Planck Institute of Molecular Physiology, Germany
- Centre for Microscopy and Microanalysis, University of Queensland, Australia
Figures
Figure 1
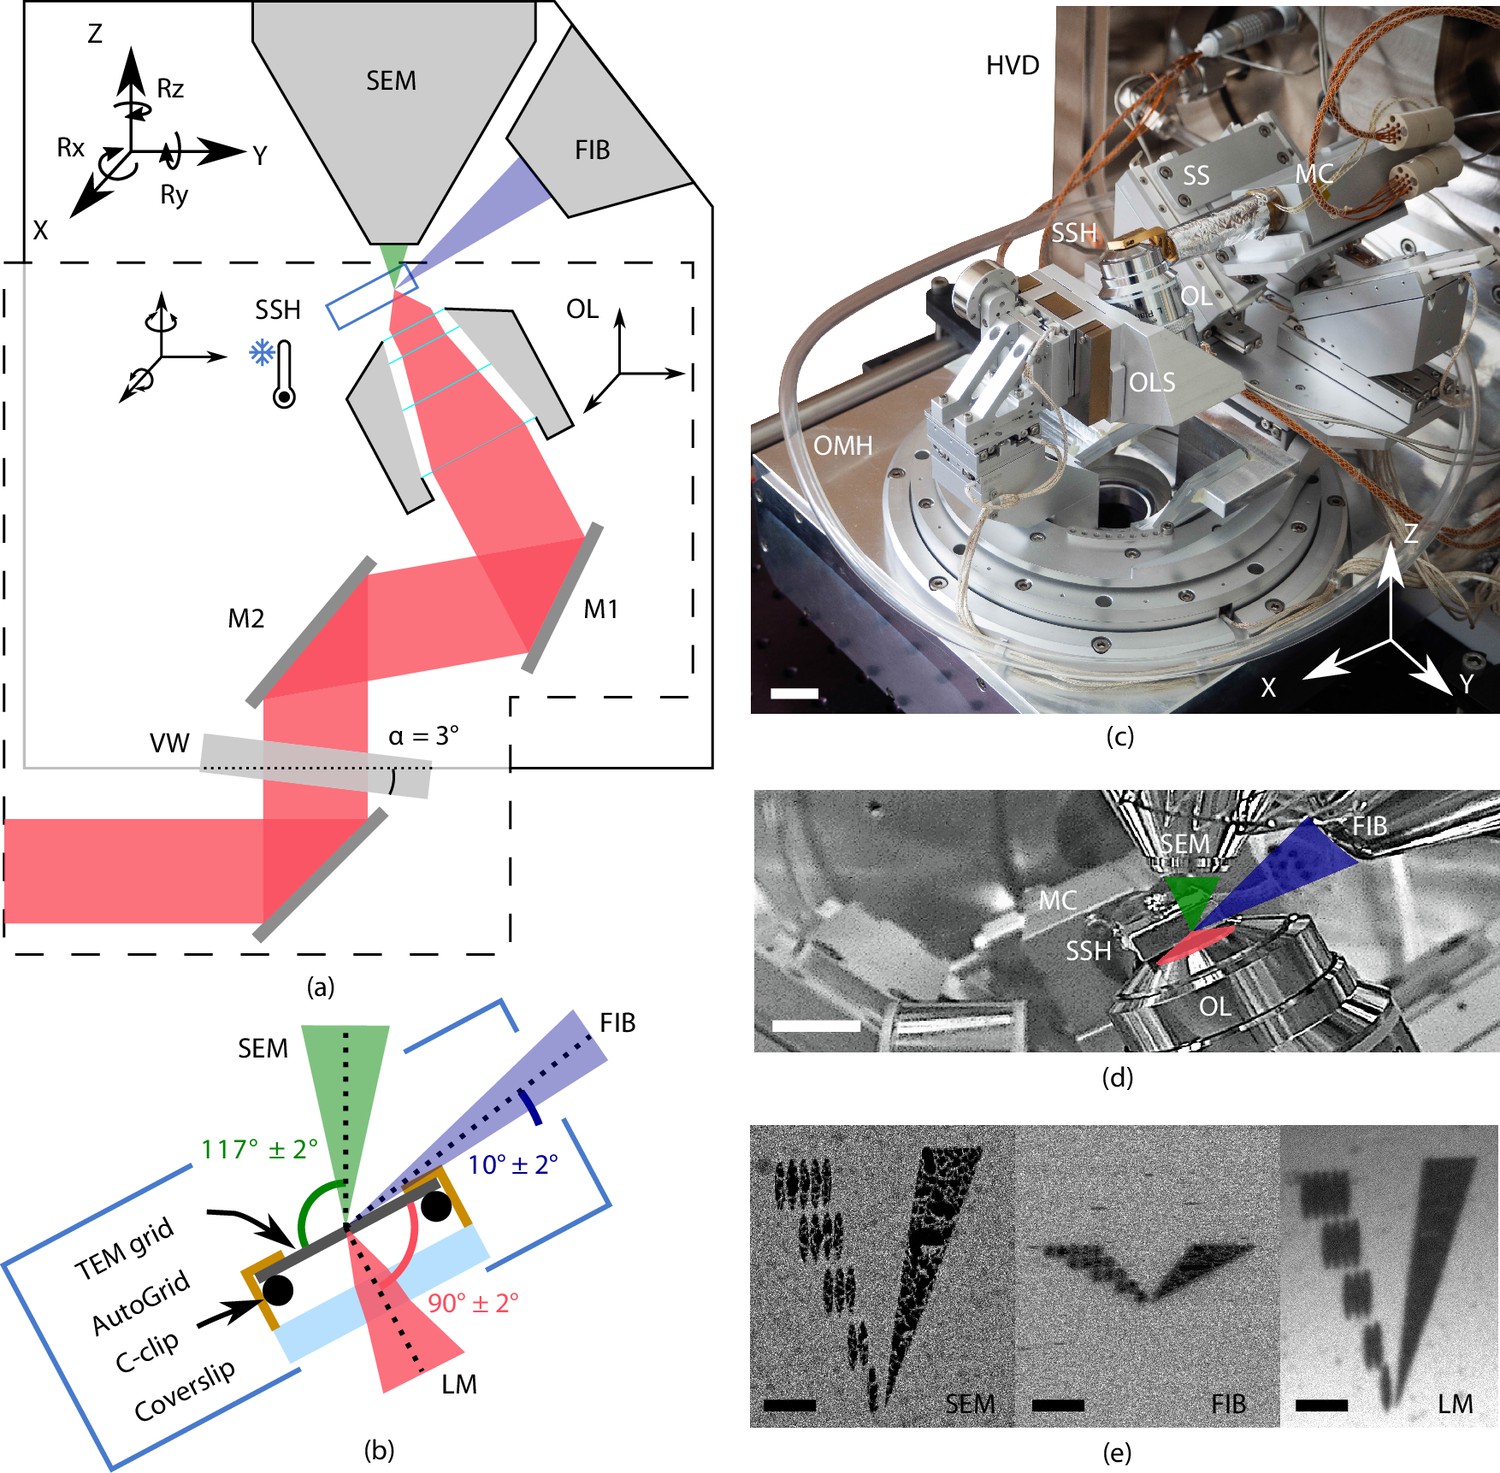
Cryogenic, coincident fluorescence, electron, and ion beam microscope.
(a) Schematic illustration showing the retrofitted hardware (dashed box) separated from the focused ion-beam scanning electron microscope (FIB-SEM) hardware in, respectively, the lower and upper half-spaces of the microscope. (b) Schematic illustration of the sample shuttle holder (SSH) with the transmission electron microscope (TEM) grid (sample) clipped into an AutoGrid placed on top of the coverslip. The coincident point is formed by the electron-, ion-, and light beams. Incident angles indicated are limited by the FIB access hole in the sample shuttle holder. (c) Photograph of the setup showing the HV door (HVD), optical module housing (OMH) on which the sample positioning stage (SS), objective lens stage (OLS), objective lens (OL), and microcooler (MC) are mounted. Scale bar 2 cm. (d) Infrared photograph acquired with the charge-coupled device (CCD) camera mounted on the FIB-SEM host system showing the microcooler and OL mounted inside the HV chamber. Scale bar 10 mm. (e) Images of an alignment pattern in the three imaging modalities, the light microscopy image is acquired by collecting reflected light from the sample. The alignment pattern is milled in the TEM grid coating using the FIB. Scale bar 3.5 μm.
Figure 2
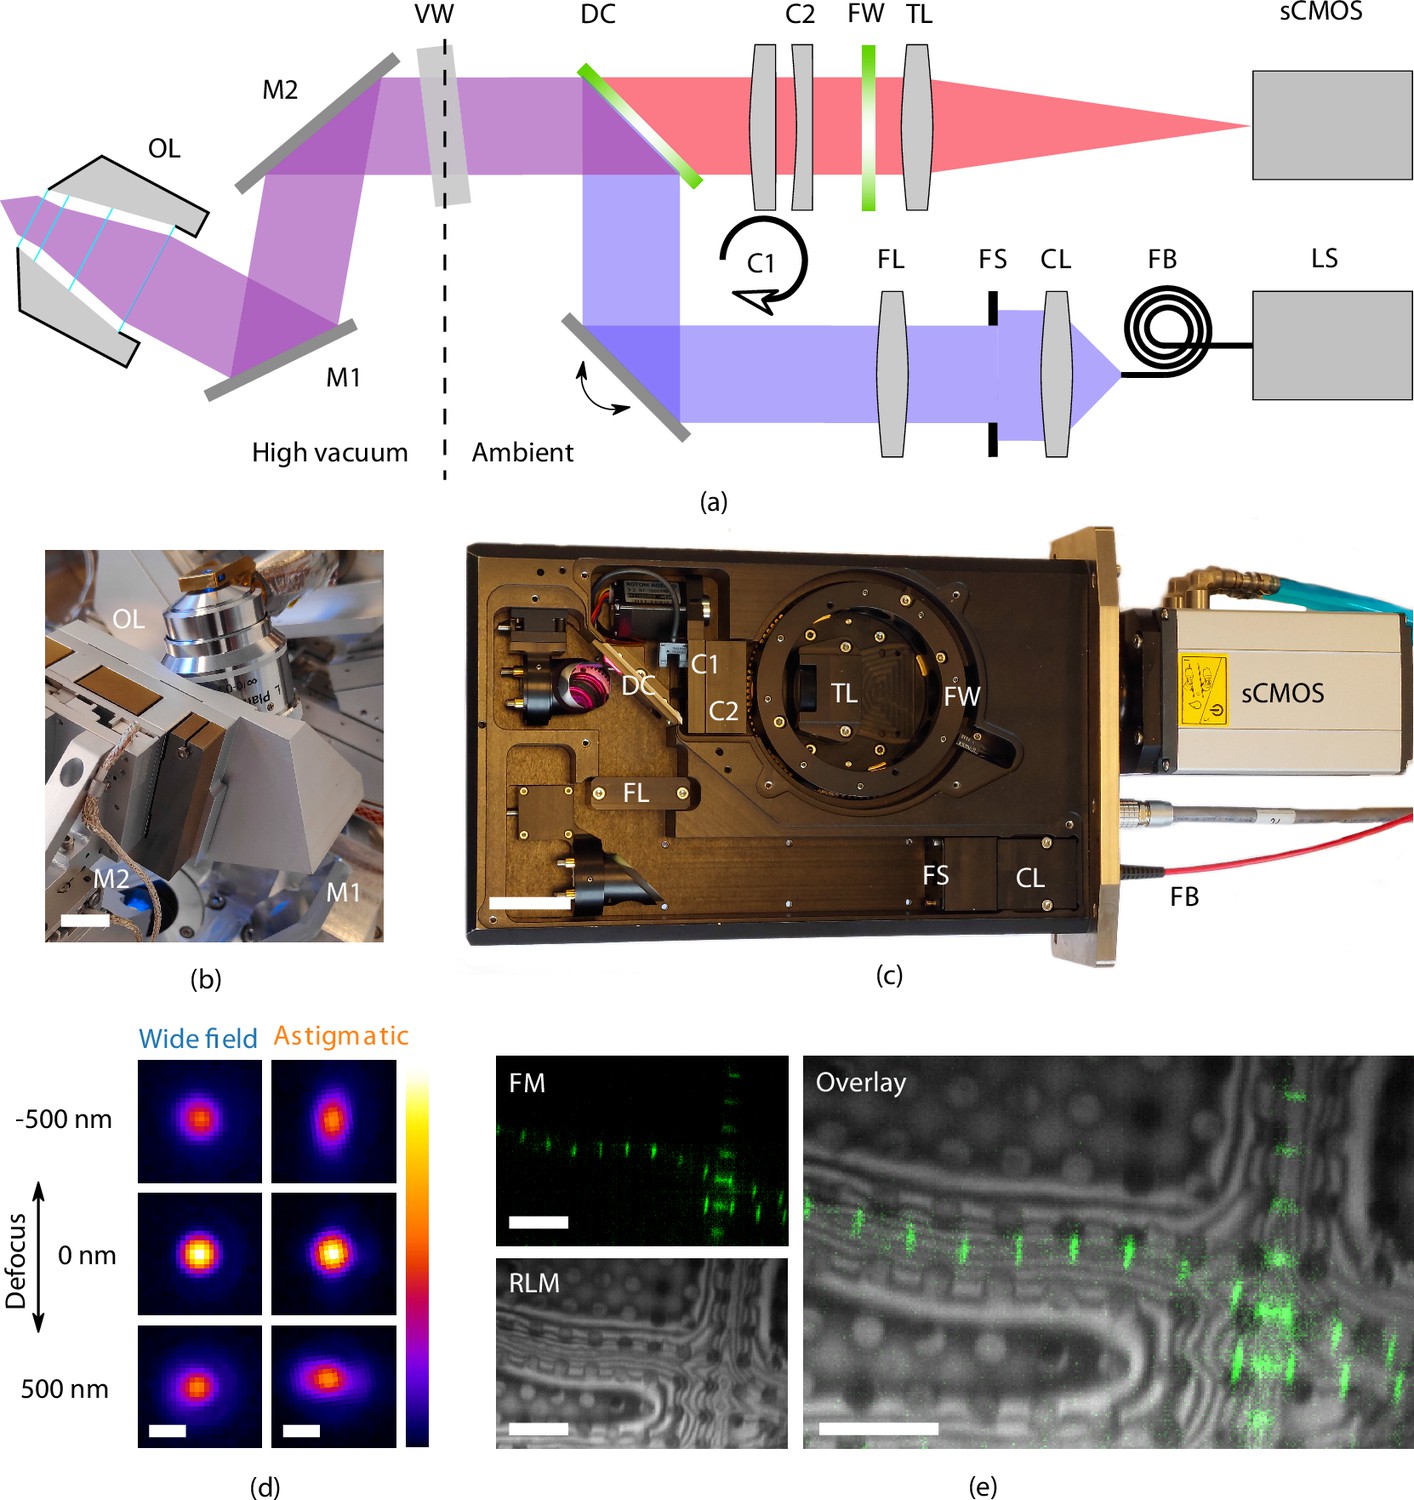
High-resolution fluorescence and reflected light microscopy allows to overlay fluorescence markers on sample structural layout.
(a) Schematic illustration showing the layout of the epifluorescence microscope. and form a folding mirror residing in high vacuum together with the objective lens (OL). The vacuum window (VW) separates the high vacuum from ambient conditions. Excitation and emission paths are separated by the dichroic mirror (DC). Two cylindrical lenses ( and ) are placed in the emission path to allow for astigmatic point spread function shaping. Emission filters are mounted in the filter wheel (FW), and the tube lens (TL) focuses the image on the camera (sCMOS). The light source (LS) is coupled by a fiber (FB) to the optical module. Light emitted from the fiber is collected by the collector lens (CL), clipped by the field stop (FS) and imaged into the OL object plane by the field lens (FS). (b) Optical OL mounted on 3DOF stage along with and . Scale bar 1 cm. (c) Annotated photograph showing the optical module. Scale bar 4 cm. (d) slices from point spread functions of the optical microscope, at different levels of defocus, both in case of widefield imaging and with induced astigmatic shaping. The point spread functions have been obtained by imaging and averaging individual fluorescent beads (, , ). Scale bar 0.5 μm. (e) Imaging modalities of the optical microscope. Left top: fluorescence microscope (FM) image of Drosophila myofibrils where Sls(700) is tagged with Alexa Fluor 488. Left bottom: reflected light microcopy (RLM) image of the same area as the FM image. Right: overlay of the FM and RLM images. The circular pattern originates from the Quantifoil R 2/2 film and interference fringes are visible along the radial direction of the myofibrils due to the changing thickness. Scale bar 8 μm.
Figure 3
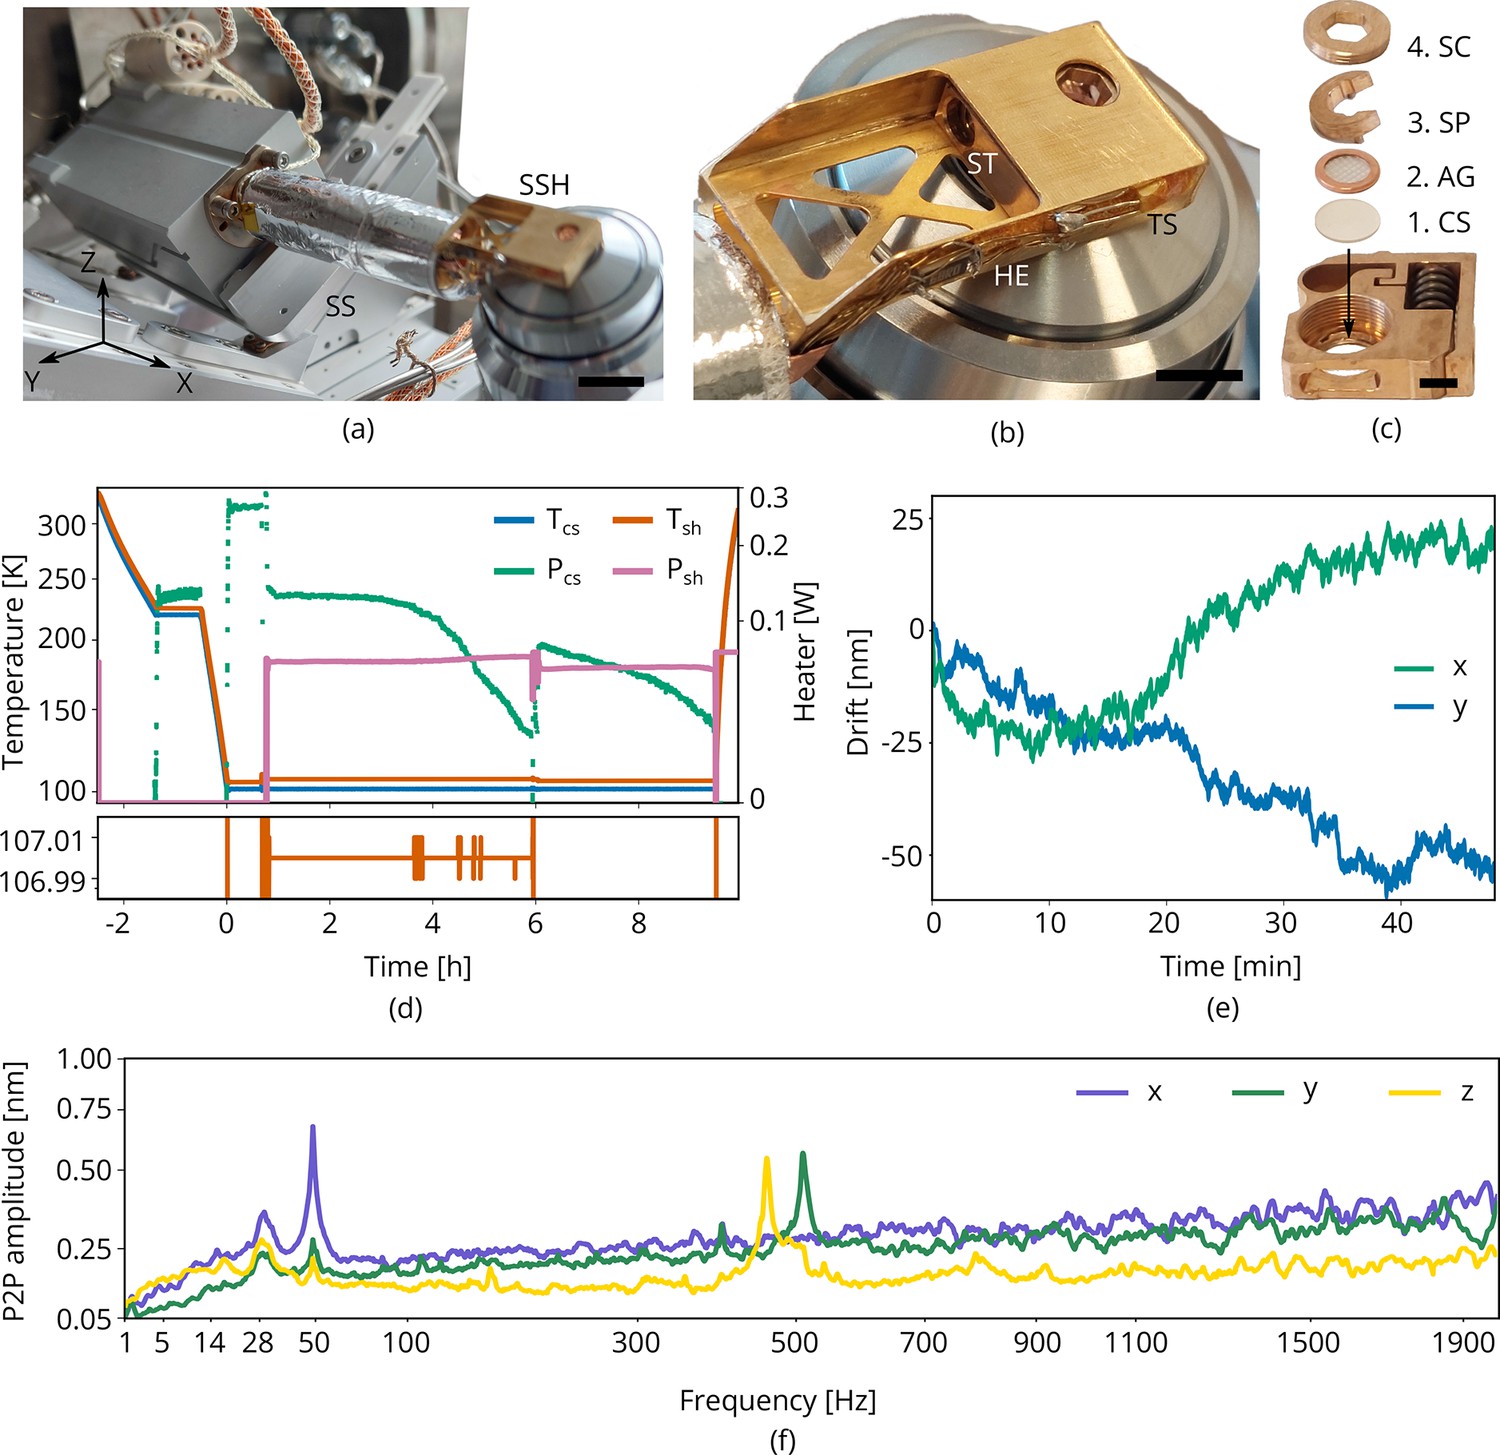
Cryogenic microcooler design and performance.
Photographs of (a) the microcooler mounted on the sample positioning stage (SS), (b) the sample shuttle holder (SSH) in detail, and (c) the shuttle (ST) and the stacking order of the coverslip (CS), AutoGrid (AG), spacer ring (SP), and screw (SC). Scale bars 10 mm, 5 mm, and 2 mm, respectively. (d) Microcooler thermal performance over time. and refer to the cold stage and shuttle holder temperatures (101.5 K and 107 K, respectively, when stabilized). The heater power required for temperature stabilization is also plotted ( and ). The shuttle holder temperature is stabilized within 10 to 20 mK as shown at the bottom. As cryopumping water from the rest gas slowly increases the radiative heat load, we changed the set point to 106 K at t = 6 h to have more heater power available for temperature stabilization. (e) Drift measured whilst regulating both cooler- and shuttle holder temperatures. (f) Peak-to-peak vibration amplitude as a function of frequency at 101 K cooler temperature () and different directions. These spectra were measured with the microcooler mounted on an aluminium dummy stage inside the focused ion-beam scanning electron microscope (FIB-SEM) system. The peak at 50 Hz originates from electrical interference.
Figure 4
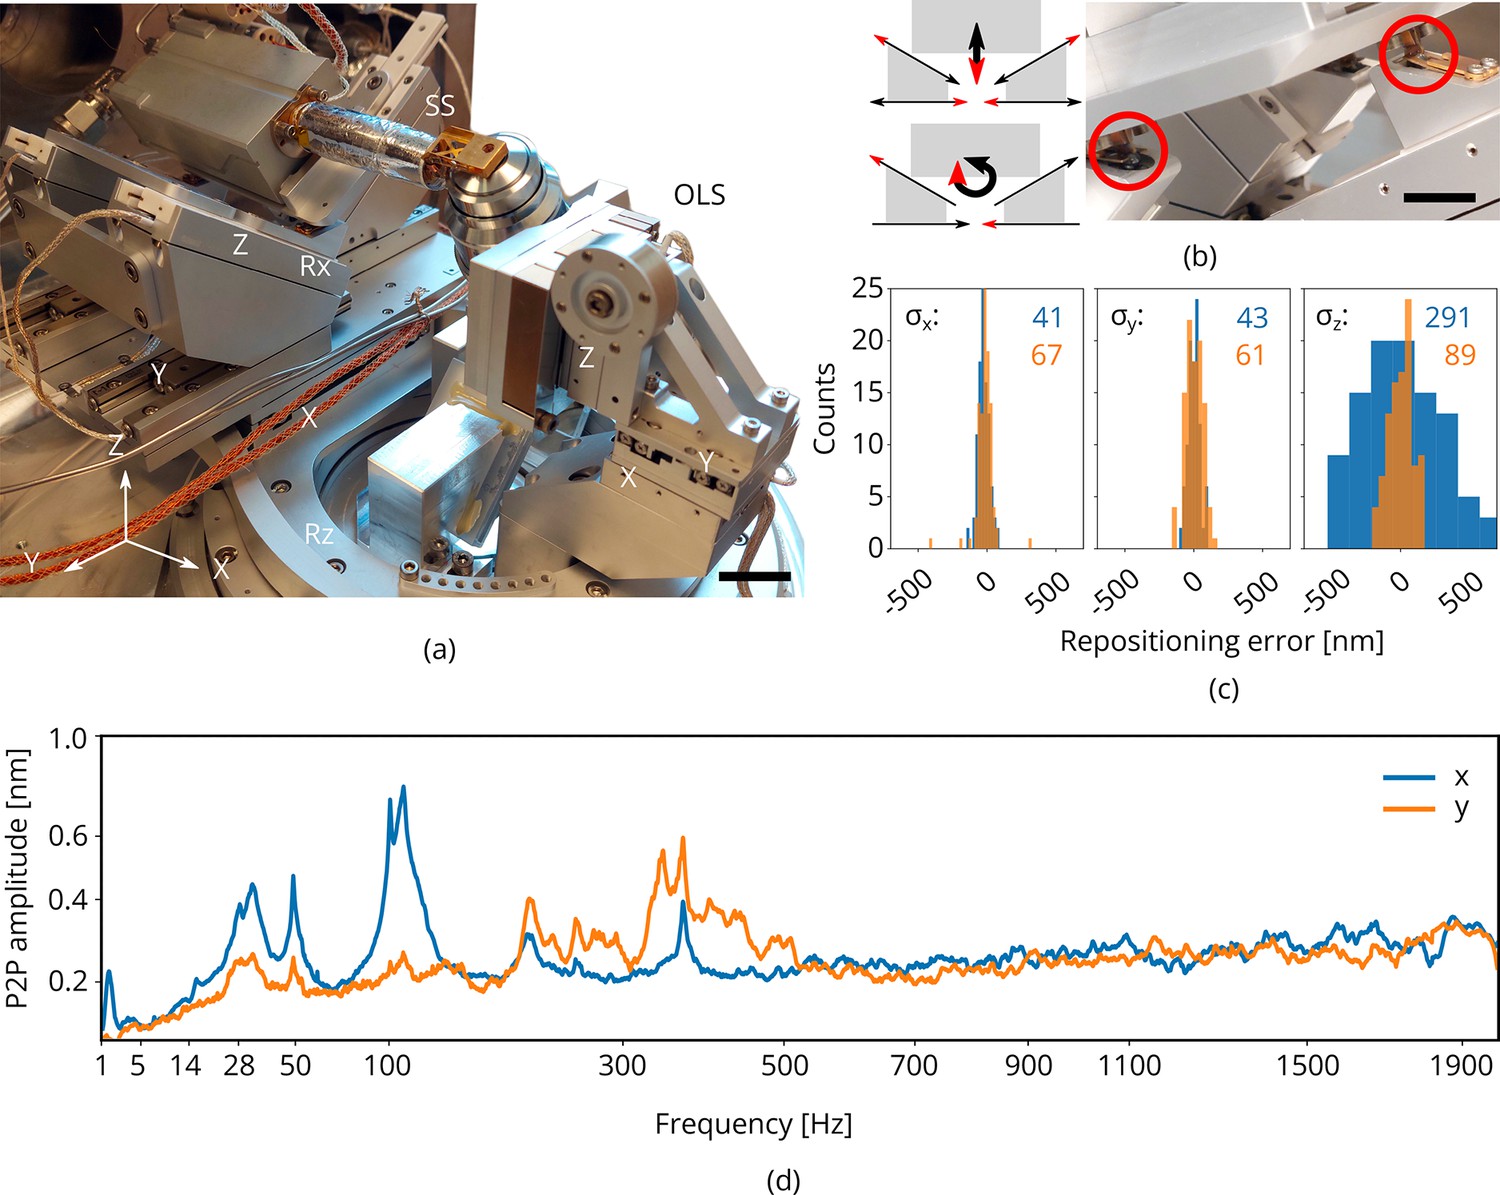
Piezo positioning stage design and performance.
(a) Photograph of the piezo positioning stages used in the setup. The 5 degrees of freedom (DOF) sample stage (SS) moves the microcooler including sample holder around and the 3DOF stage (OLS) positions the OL. Scale bar 2 cm. (b) Schematic showing kinematic geometry for movements along and . The microcooler is mounted on an interface plate having three ceramic ball contacts and mount to three kinematic mounts; two v-grooves and one point contact. Scale bar 1 cm. (c) Repositioning error as measured when using the light microscope (LM) to repetitively centering and focusing the same feature in reflected light microcopy (RLM). Images of the sample are acquired with the scanning electron microscope (SEM) and focused ion beam (FIB) and the image-to-image shifts are used to determine the repositioning error in the , , and directions (sample coordinate system). indicated in blue and orange in nanometer. Number of measurements . (d) Peak-to-peak vibration amplitude as a function of frequency with the microcooler mounted on the 5DOF stage inside the FIB-SEM system. The peak at 50 Hz originates from electrical interference. Due to reduced stiffness of the sample stage (as compared to the aluminum dummy stage), an overall increase is measured whilst staying well below 1 nm peak-to-peak.
Figure 5
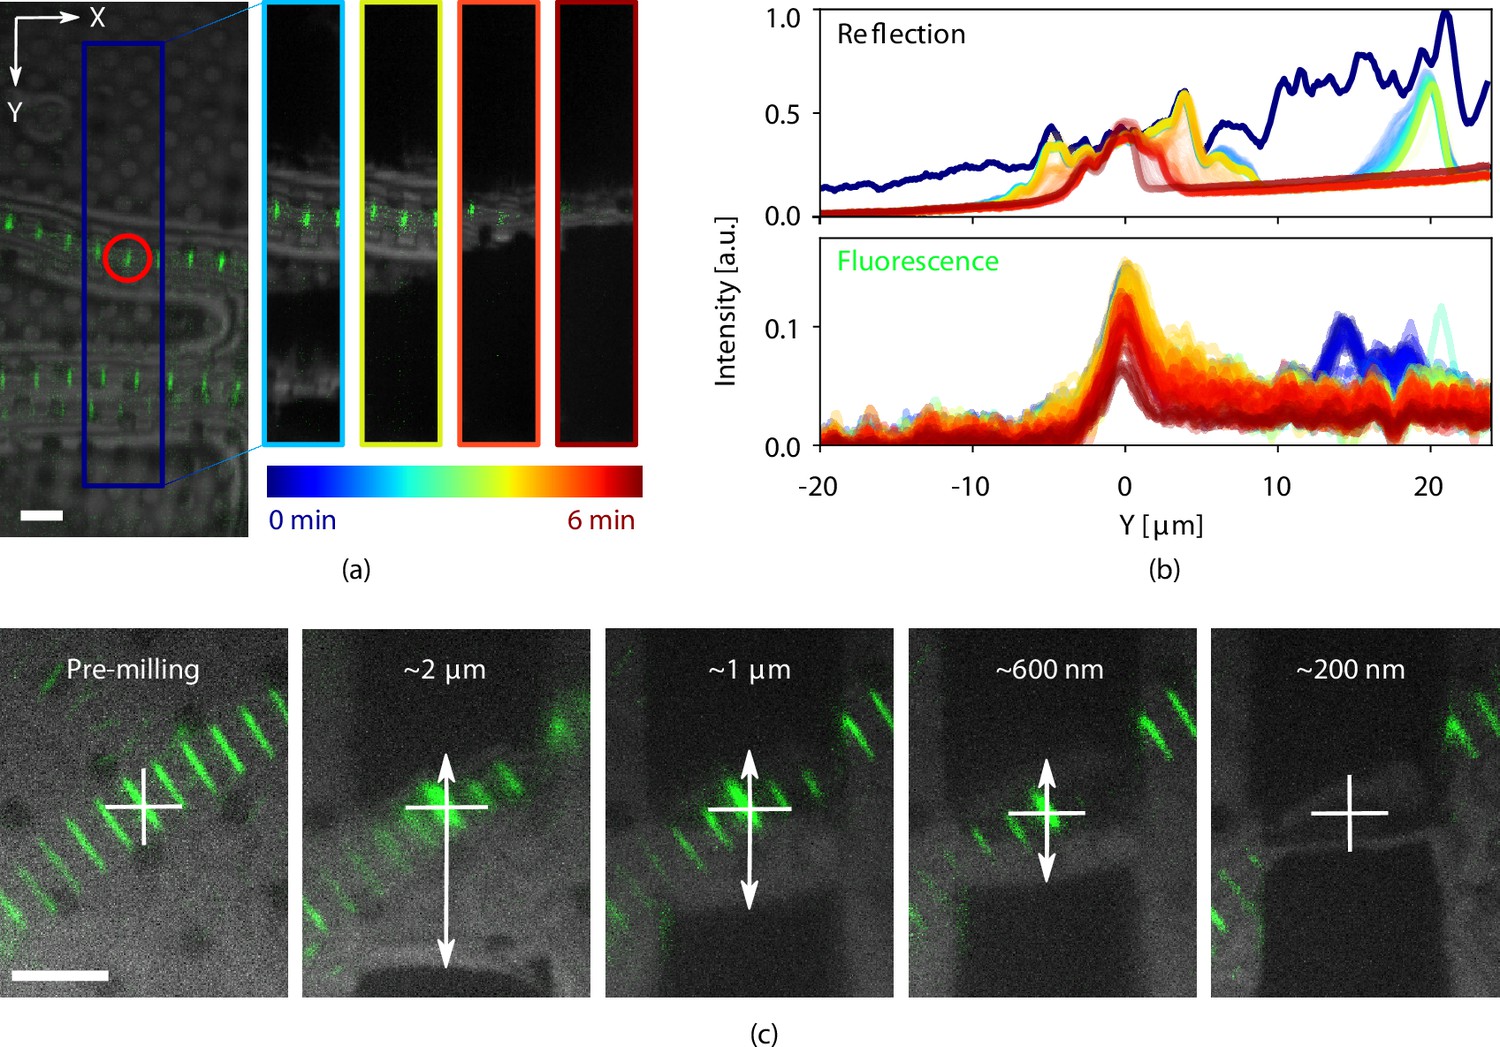
Light assisted focused ion beam (FIB) milling of frozen-hydrated lamellae.
(a) Reflected light microcopy (RLM) and fluorescence microscope (FM) images were recorded whilst milling. The image on the left shows the indicated milling area marked in dark blue. The four images to the right show snapshots at different stages of milling, denoted with the varying color scale. This color scale is also used in (b) where the normalized integrated pixel intensity across the milling area direction is shown for both the reflection and fluorescence channels. (c) Stepwise milling progression as observed by RLM and FM. Estimated lamella thickness based on FIB images indicated at the top of the images. The fluorescent feature of interest is marked by the white cross and any misalignment (white arrows) can be corrected for. All scale bars are 5 μm. Drosophila and zebrafish myofibrils in (a) and (c), respectively. Fluorescence marks the Z-disc of the sarcomere.
Figure 6

Light targeted focused ion beam (FIB) milling of frozen-hydrated lamellae.
(a) First the sample is brought into the center of the field of view (FOV) and focused properly. Green and yellow: autophagosomes and red: autophagolysosomes. (b) Close-up of (a) showing the milling area in more detail. (c) Snapshot taken at an intermediate milling step. (d) Left: the lamella finished and polished, imaged in the fluorescence microscope (FM) and the contrast enhanced to show the feature of interest. Right: a snapshot acquired with the FIB showing the polished lamella. (e) The reflected light microcopy (RLM) channel is used to align the light microscope data with the transmission electron microscope (TEM) overview image. The fluorescent feature of interest indicates where the tomogram should be acquired. (f) slices of the reconstructed TEM tomogram with (g) segmentated membranes. Annotated are autophagolysosome outer membrane (green), autophagolysosome membraneous content (blue and red). Scale bars: (a) −40 μm, (b) −10 μm, (c) −5 μm, (d) left −10 μm and right −5 μm, (e) −5 μm, (f) −0.25 μm, and (g) −0.1 μm.
Figure 7

Scanning electron microscope (SEM) vibration analysis procedure.
(a) A series of SEM images acquired with different dwell times and thus line times (the latter indicated at the top). (b) The edge position as a function of time for one of these images. (c) The vibration displacement as a function of time. Finally in (d), the scalloping loss corrected fast fourier transform (FFT). Processing all images acquired with the same scan rotation finally yields (e). Scale bar 25 nm.
Figure 8
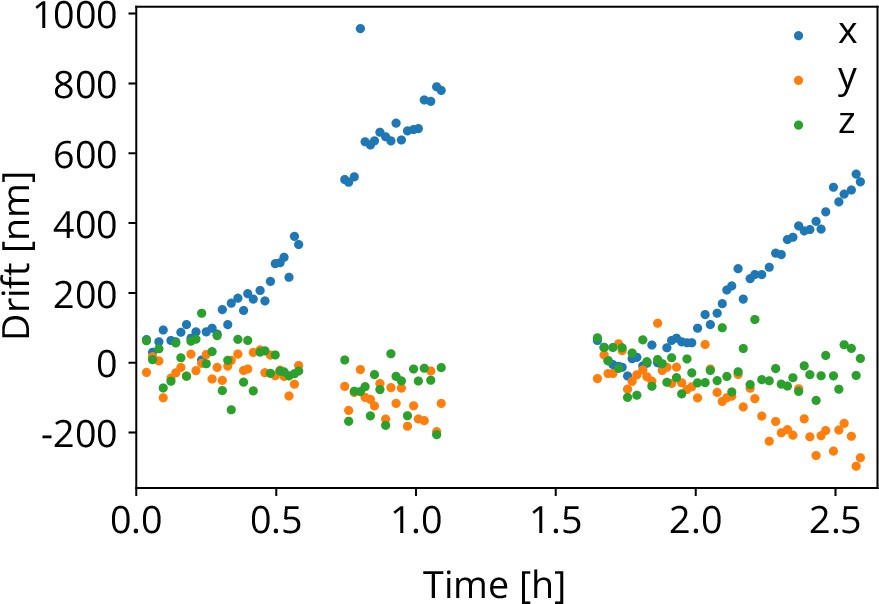
Objective lens (OL) stage drift as a function of time as measured during the stage repositioning moves.
Videos
Video 1
Live LM imaging whilst milling.
Movie showing RLM (grayscale) and FM (green) images recorded whilst FIB milling a frozen hydrated lamella. The 3-beam coincident geometry allows FM and RLM images to be acquired during lamella milling in a Drosophila myofibril sample. The fluorescence from Sls(700) tagged with Alexa Fluor 488 (green) is overlaid on the reflected light (grayscale).
Additional files
Download links
A two-part list of links to download the article, or parts of the article, in various formats.
Downloads (link to download the article as PDF)
Open citations (links to open the citations from this article in various online reference manager services)
Cite this article (links to download the citations from this article in formats compatible with various reference manager tools)
A cryogenic, coincident fluorescence, electron, and ion beam microscope
eLife 11:e82891.
https://doi.org/10.7554/eLife.82891


