Exploring the role of the outer subventricular zone during cortical folding through a physics-based model
- Friedrich-Alexander-Universität Erlangen-Nürnberg, Institute of Applied Mechanics, Germany
- University Hospitals Erlangen, Institute of Neuropathology, Germany
Figures
Figure 1
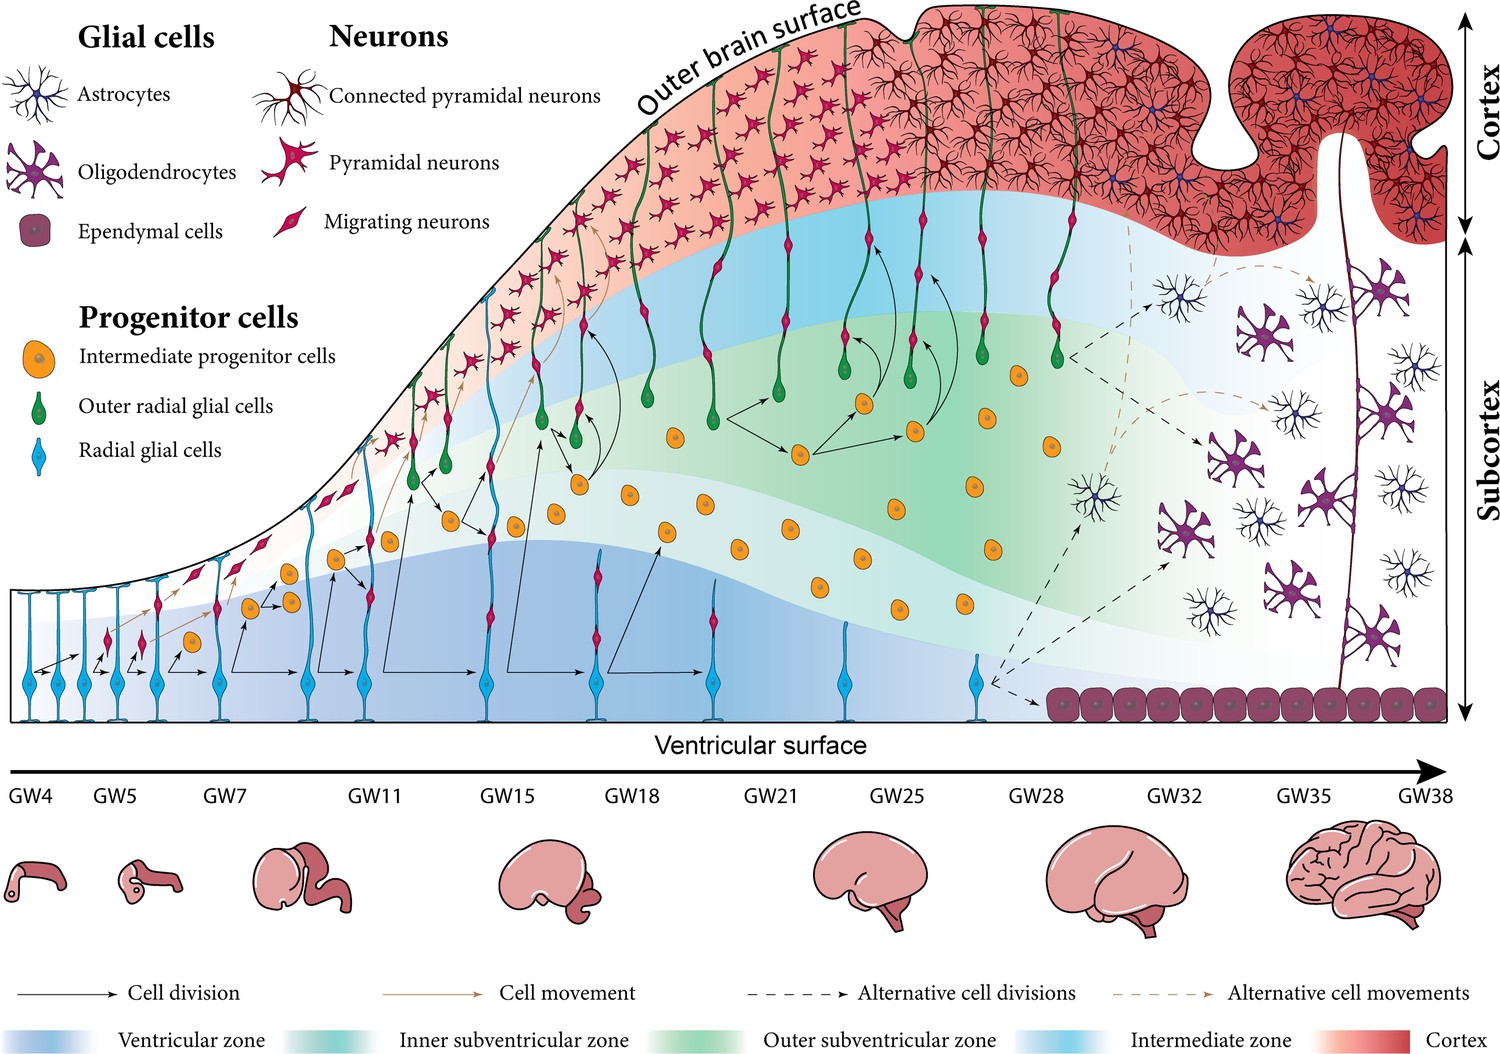
Schematic illustration of human brain development between gestational weeks (GW) 4 and 38 at the cellular scale (top) and the organ scale (bottom).
In the early stage of development, the repetitive division of radial glial cells in the ventricular zone (VZ) significantly increases the total number of brain cells. The newly born intermediate progenitor cells accumulate above the VZ and form a new layer called the inner subventricular zone. The outer radial glial cells (ORGCs) that are produced around gestational week 11 form a new layer called the outer subventricular zone (OSVZ). The neurons generated from progenitor cells migrate along radial glial cell fibers towards the cortex. Around gestational week 28, the migration process is almost finished, and the radial glial cells switch to produce different types of glial cells like astrocytes and oligodendrocytes.
Figure 2
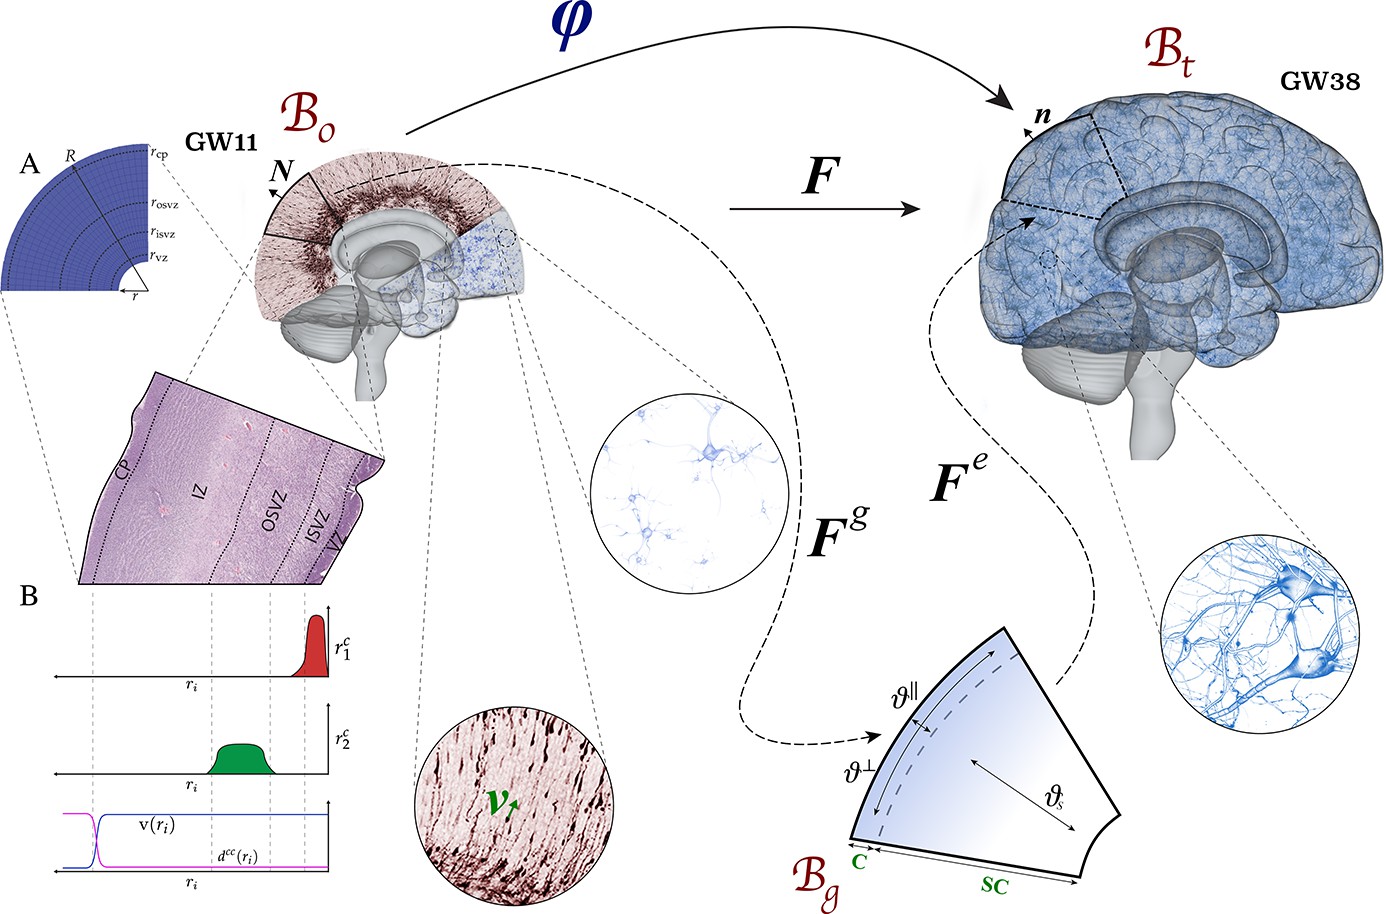
Kinematics of the multifield brain growth model.
The reference configuration represents the initial state of the brain at gestational week (GW) 11. The spatial configuration represents the state of the brain at any time during development. The stress-free (intermediate) growth configuration is inserted between reference and spatial configurations. (A) Simulation domain representing a part of the human brain’s frontal lobe. (B) Distribution of model parameters () along the brain’s radial direction ri from the ventricular surface to the outer cortical surface.
Figure 3
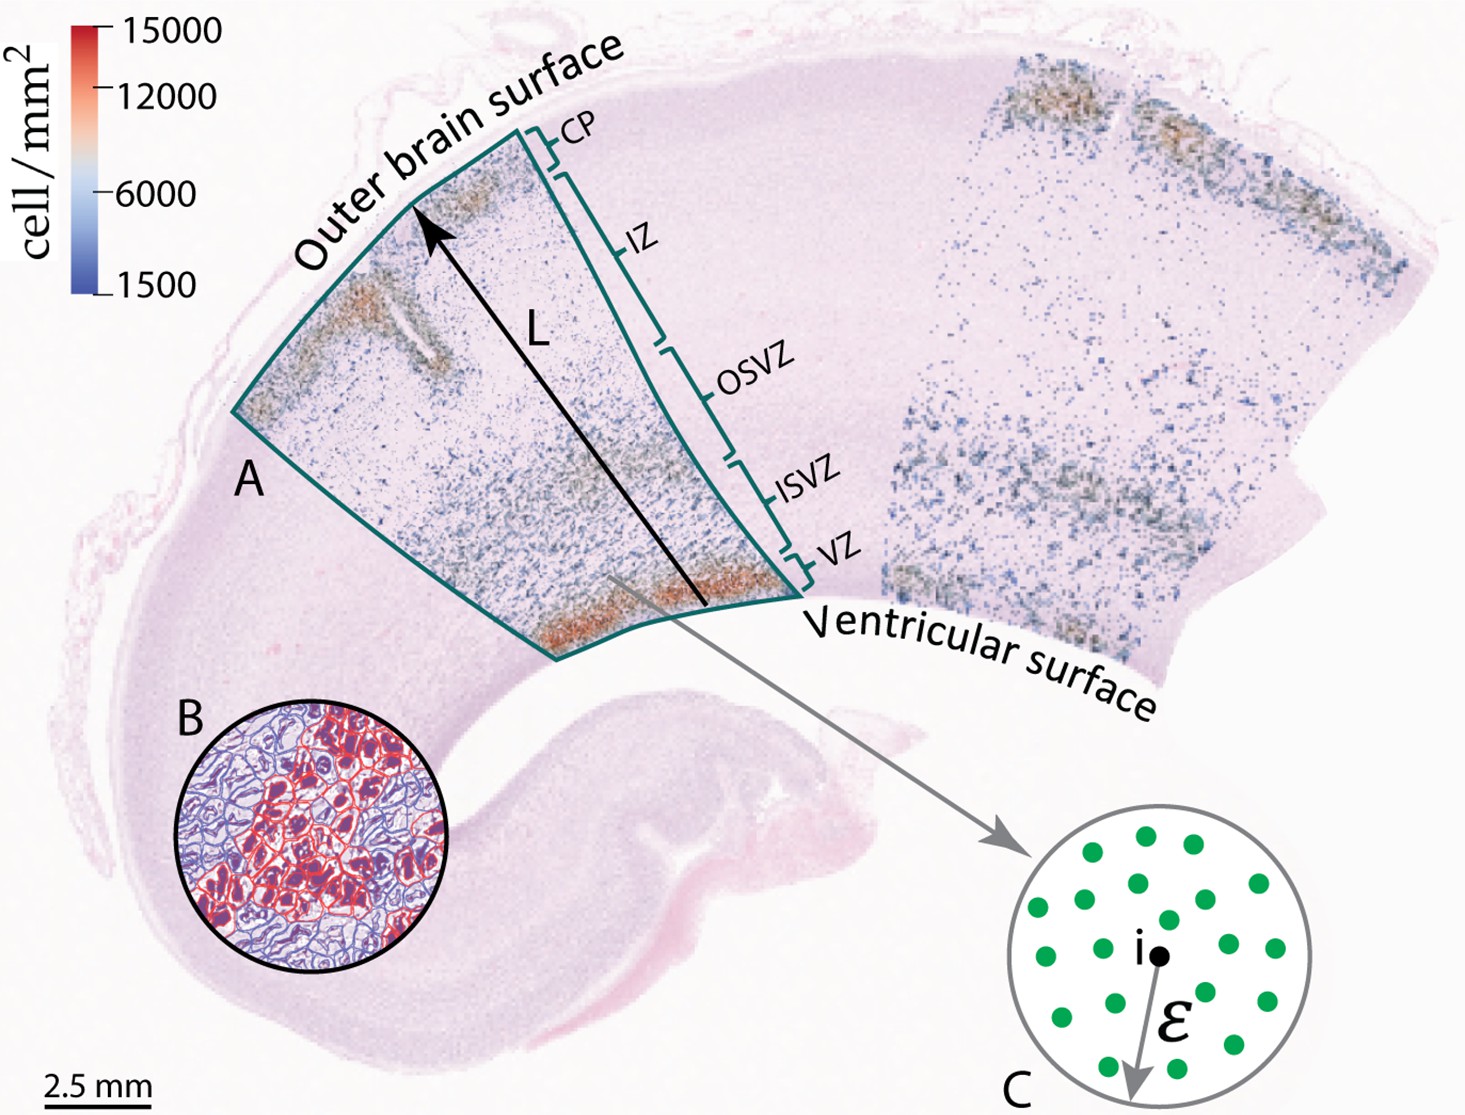
Part of the frontal lobe of a histologically stained section of the human fetal brain at gestational week 17.
(A) Annotated area with final cell density distribution. (B) Example of cell detection by using Qupath. Red cells depict neurons and blue cells glial cells. (C) Procedure to determine the cell density.
Figure 4

Evolution of the normalized cell density in the normalized radial direction from the ventricular surface to the outer cortical surface for numerical simulations and histologically stained human brain sections (HBS) at gestational week (GW) 17.
The simulation results correspond to the varying cortical stiffness case with a stiffness ratio of 3, and a ventricular zone (VZ) division rate . The stained human brain sections results correspond to line L in Figure 3.
Figure 5
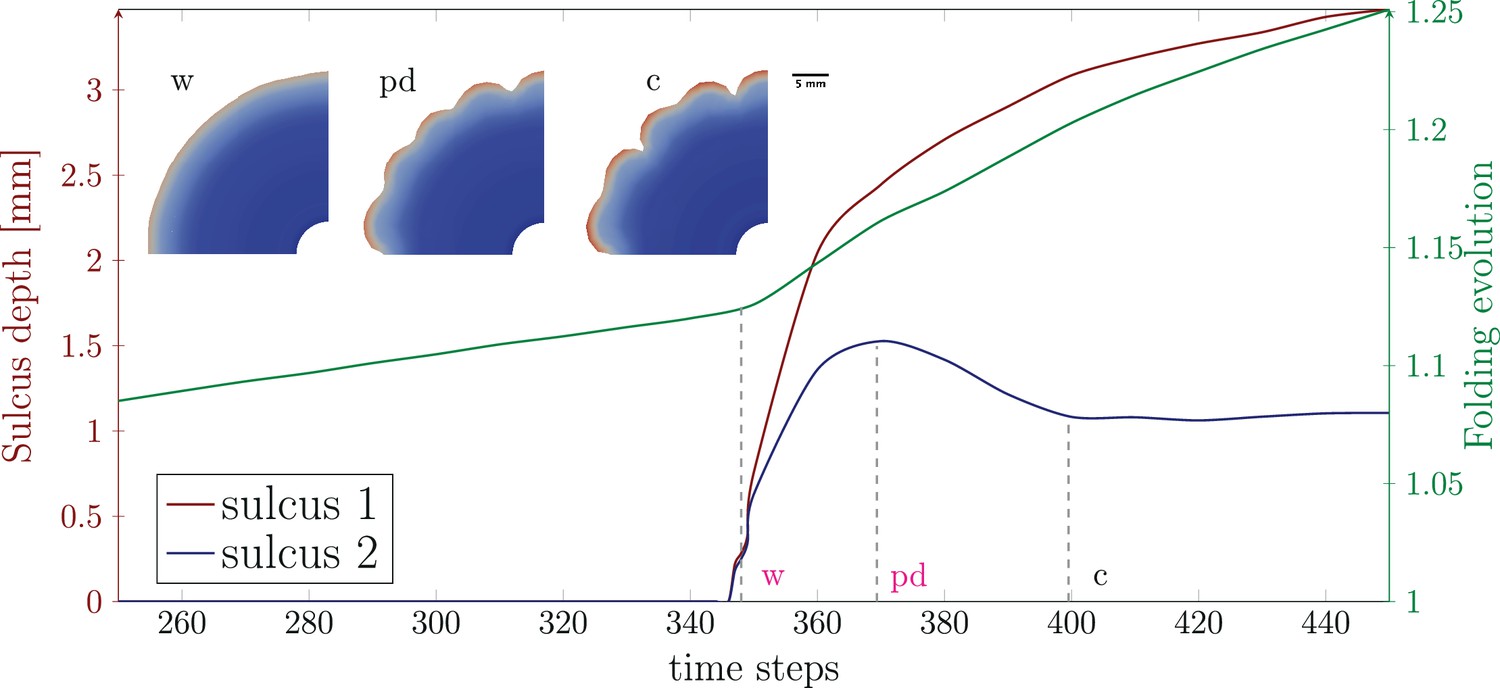
Primary and secondary mechanical instabilities in the developing brain.
The temporal courses of the depth of two sulci (red and blue curve) and the folding evolution (green curve), as denoted in Figure 6, indicate the mechanical instability points. Initially, the brain surface is smooth, the sulcus depth is zero, and the folding evolution increases only gradually. At the first instability point, the cortex starts to fold into wrinkles (w), where the sulci deepen uniformly. Due to the transition from a smooth to a wrinkled surface, the folding evolution now shows a more rapid increase. At the second instability point, a pitchfork-like bifurcation occurs, where every second sulcus continues to deepen while those in between become shallower. This results in a period doubling (pd) pattern, which is well visible and fully established at state c. The results correspond to the varying stiffness case with , , and a stiffness ratio .
Figure 6
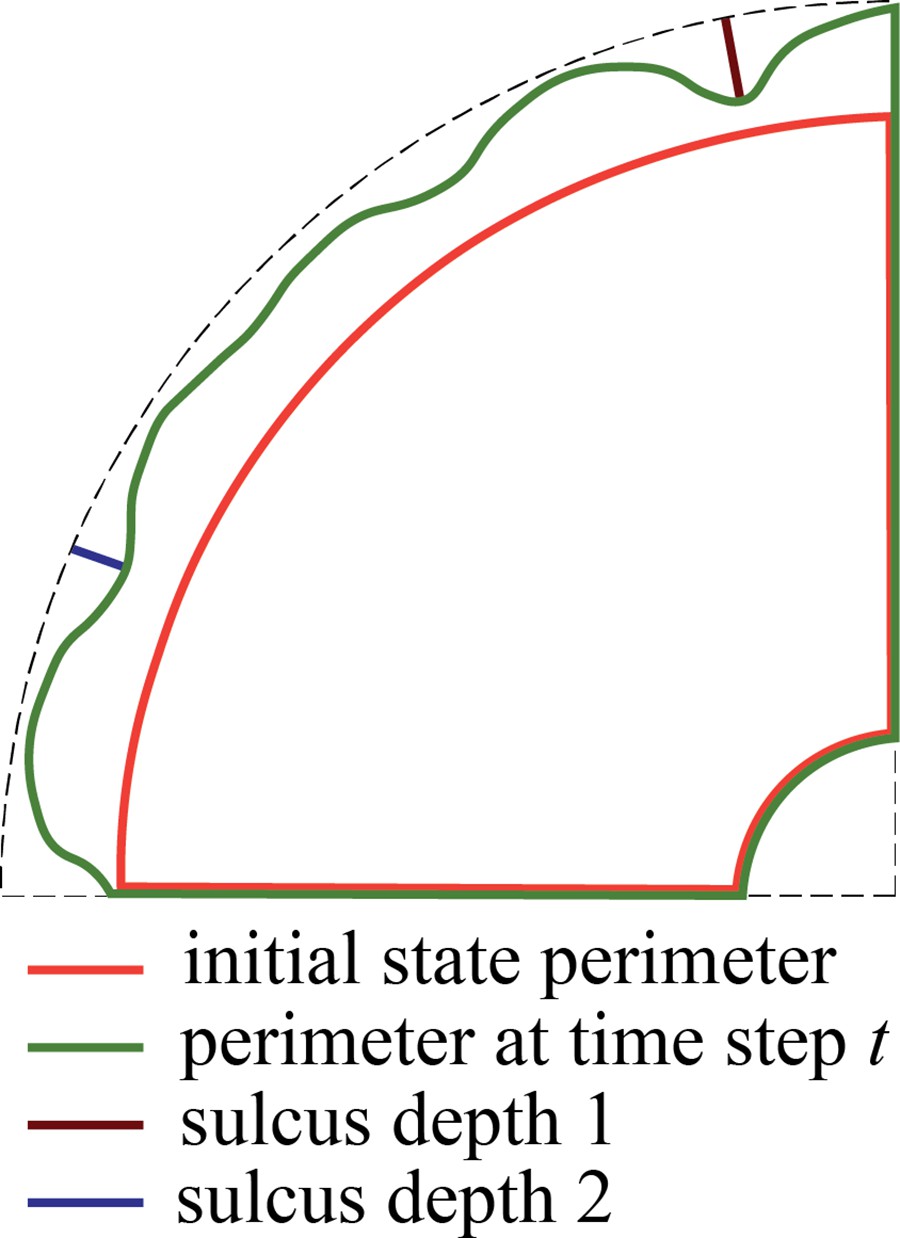
Quantification of the depth of two sulci (sulcus 1 and sulcus 2) and the folding evolution, defined as the ratio between the outer perimeter at time step and the initial perimeter.
Figure 7
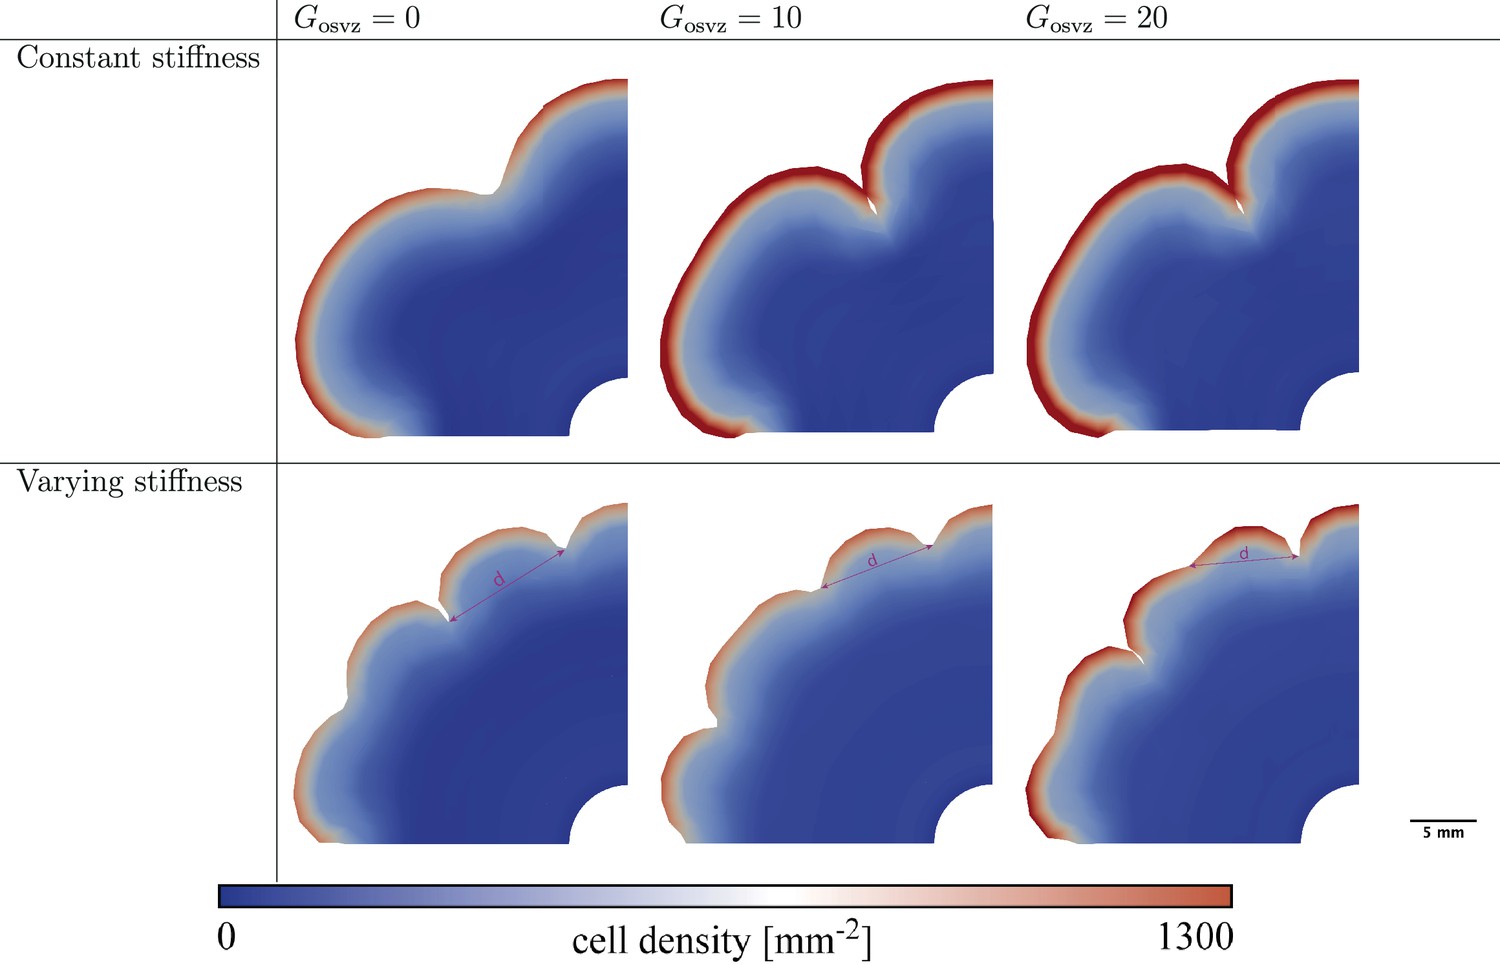
Final folding patterns at gestational week 36 for different values of the division rate in the outer subventricular zone (OSVZ) for the constant (top) and varying (bottom) cortical stiffness cases.
The remaining parameters are fixed as follows: division rate in the ventricular zone (VZ) , stiffness ratio for constant stiffness, and for varying stiffness. The marked distance between sulci d decreases with increasing .
Figure 8
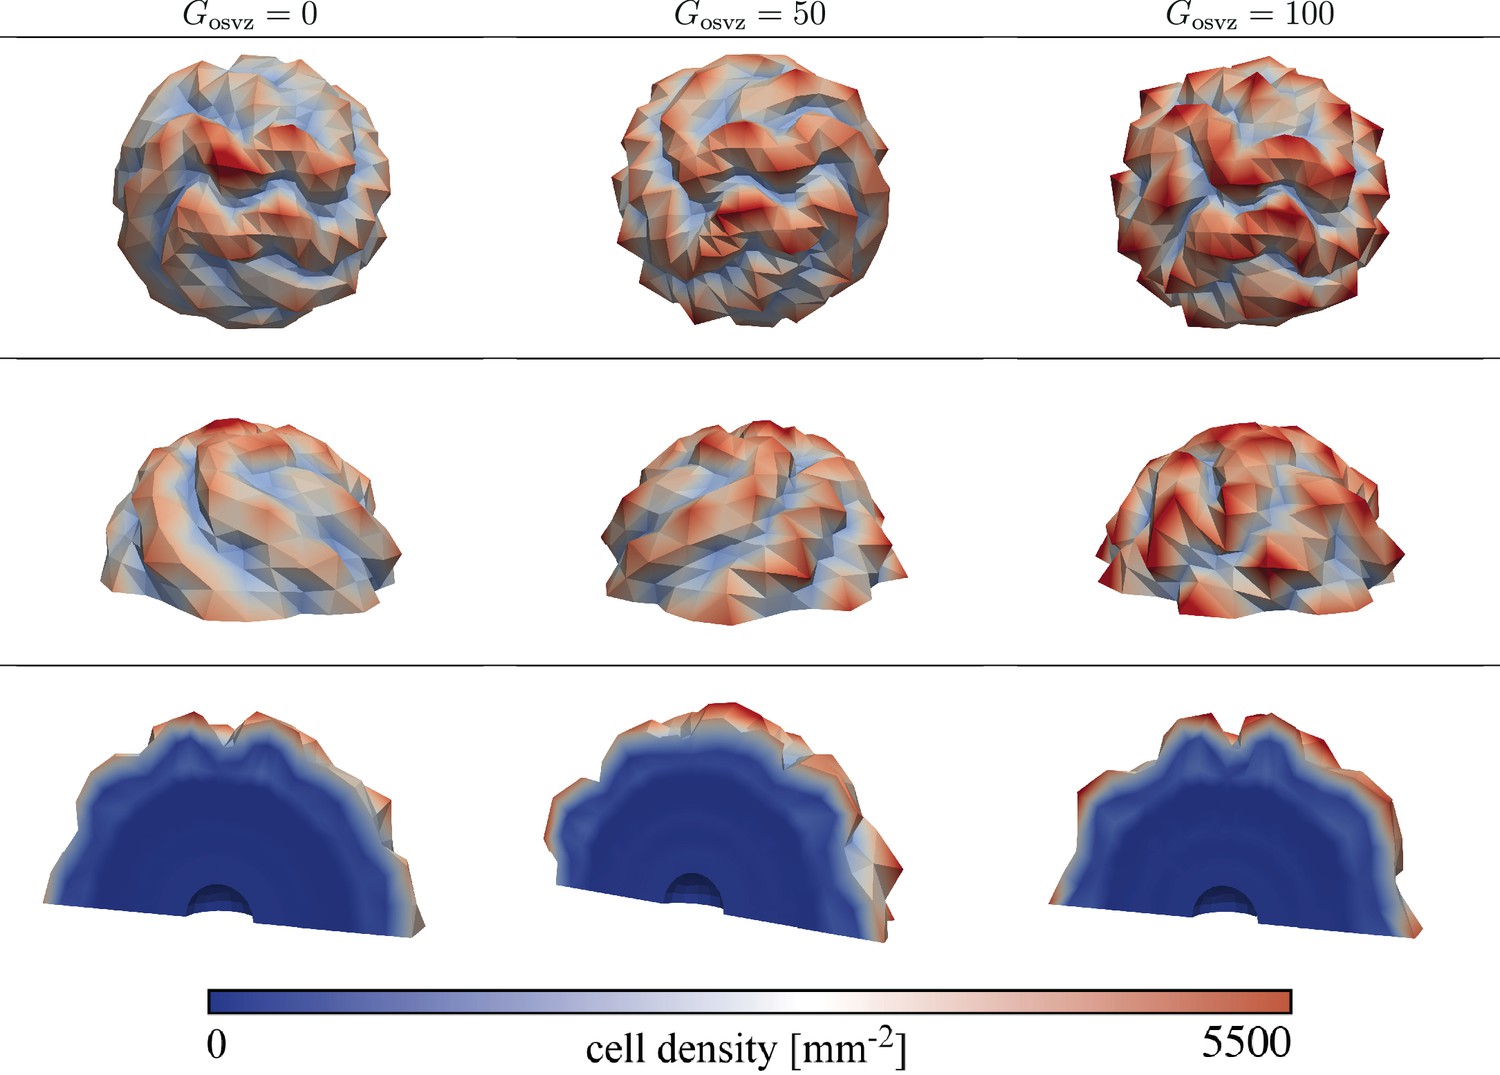
Final folding patterns at gestational week 36 for the hree-dimensional (3D) model with varying cortical stiffness, a stiffness ratio of 3, a growth ratio of 3, and an initial division rate in the ventricular zone (VZ) .
The folding complexity increases with increasing initial division rate in the outer subventricular zone (OSVZ) .
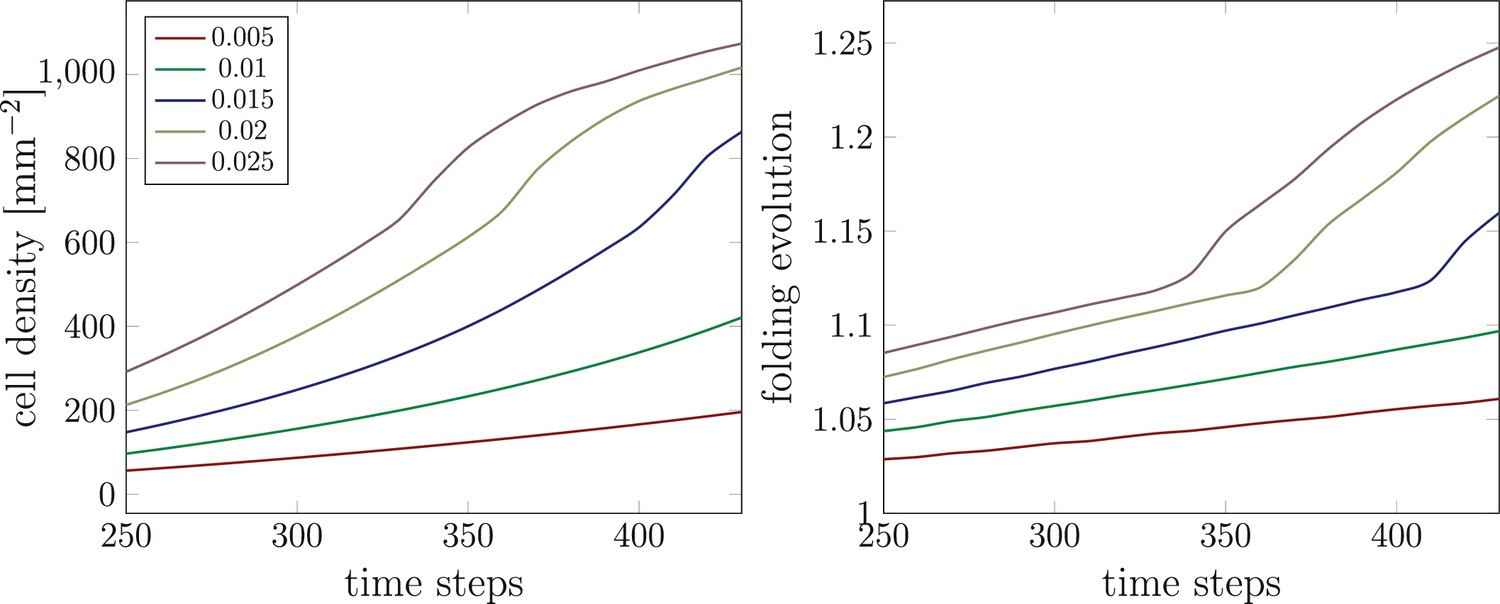
Figure 9
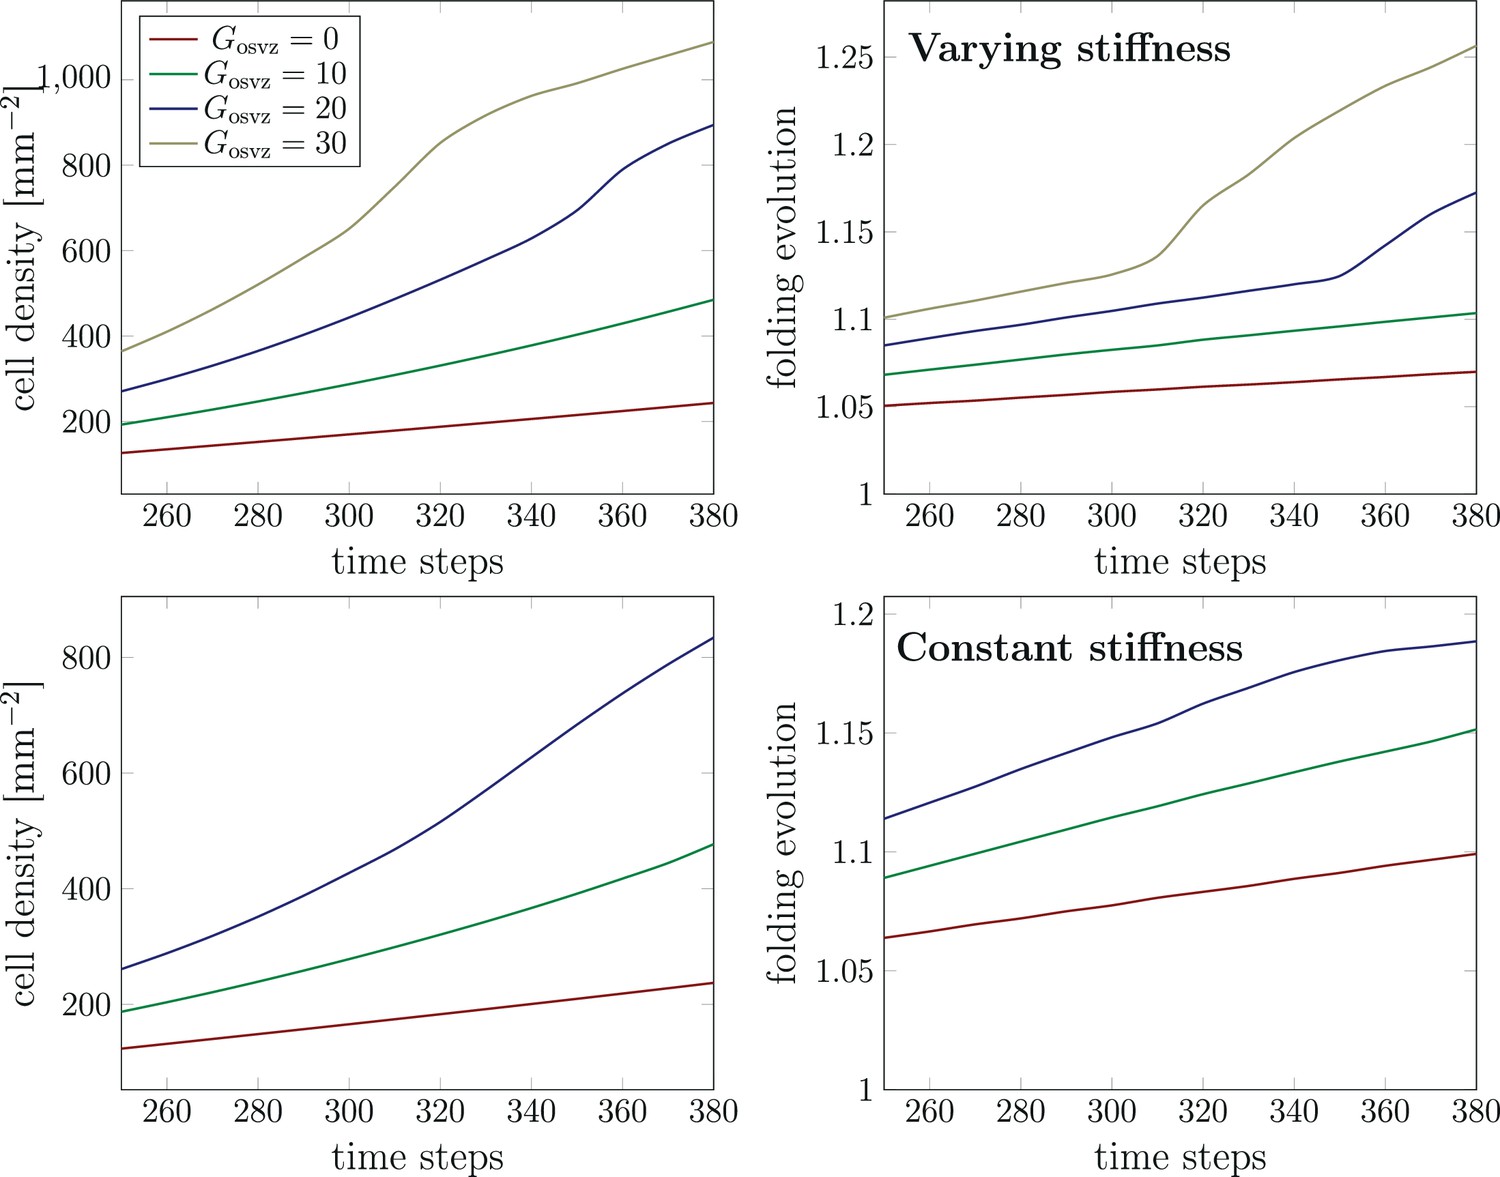
Temporal evolution of the maximum cell density and the folding evolution (the current outer perimeter divided by the initial perimeter, as indicated in Figure 6) at a constant division rate in the ventricular zone (VZ) and different initial division rates in the outer subventricular zone (OSVZ) .
The results in the top row correspond to the varying cortical stiffness case with a stiffness ratio of 3. The results in the bottom row correspond to the constant cortical stiffness case with a stiffness ratio of 8.
Figure 10

Temporal evolution of the maximum cell density and the folding evolution for different division rates in the ventricular zone (VZ) and outer subventricular zone (OSVZ) .
The results in the top row correspond to the varying cortical stiffness case with a stiffness ratio of 3. The results in the bottom row correspond to the constant cortical stiffness case with a stiffness ratio of 8.
Figure 11
Temporal evolution of the maximum cell density and the folding evolution for different values of the mitotic small translocation (MST) factor.
The results correspond to the varying cortical stiffness case with a stiffness ratio of 3, a division rate in the ventricular zone (VZ) , and an initial division rate in the outer subventricular zone (OSVZ) .
Figure 12
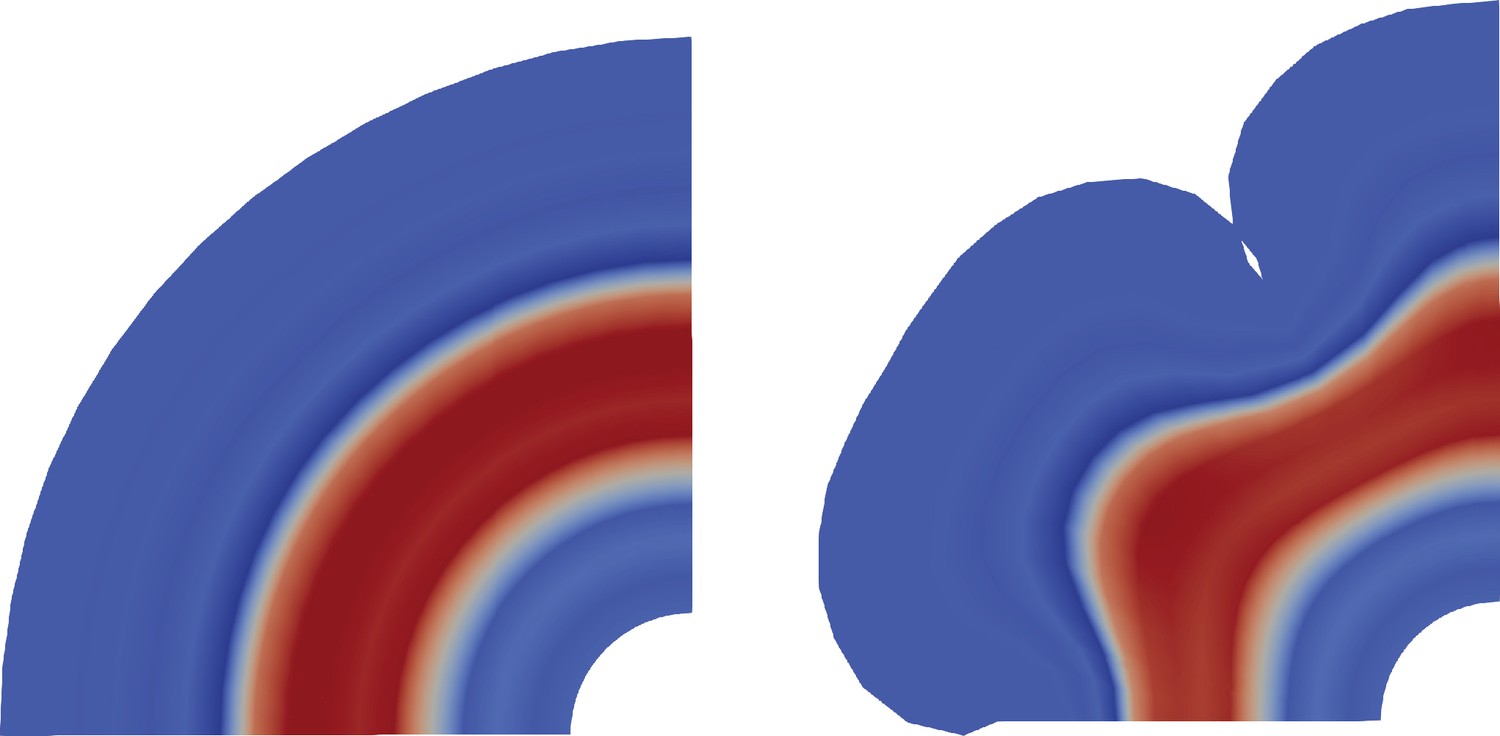
The effect of cortical folding on the outer subventricular zone (OSVZ).
While the OSVZ has a constant thickness before cortical folds emerge (left), it later becomes thicker beneath gyri than beneath sulci (right).
Figure 13
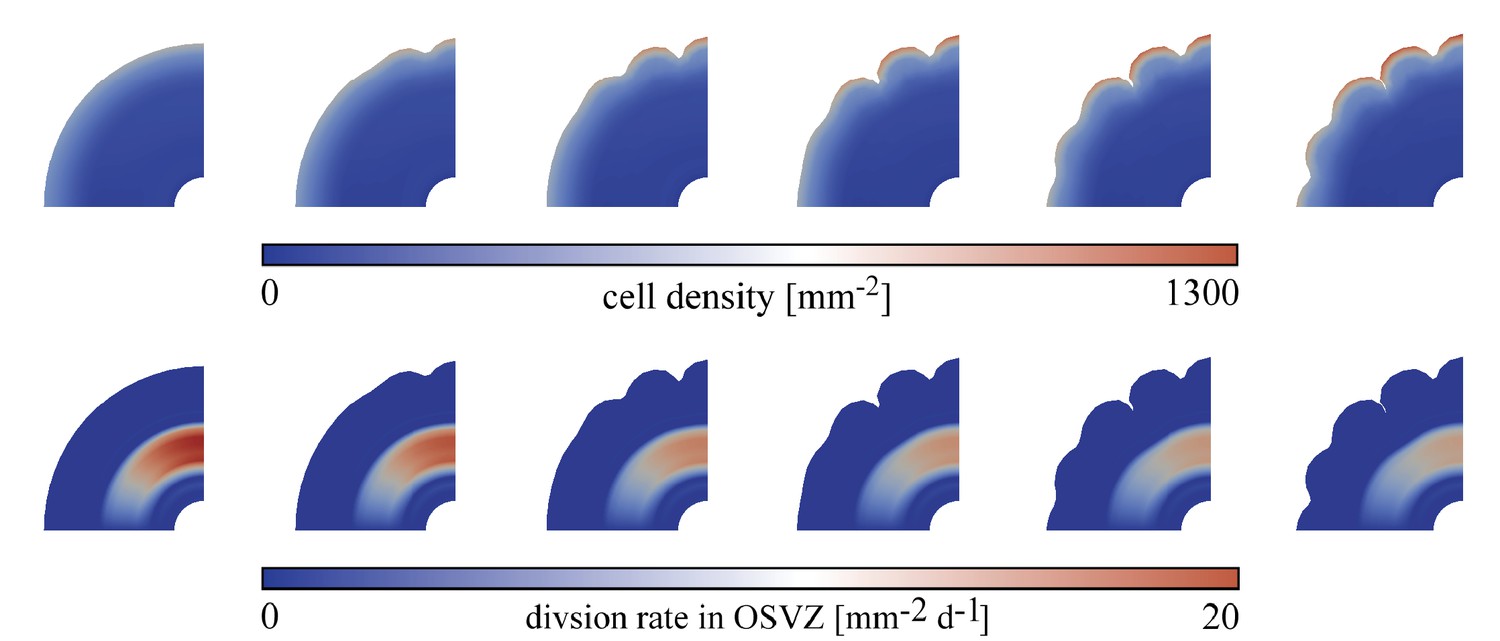
Temporal evolution of cortical folds for a gradually decreasing outer subventricular zone (OSVZ) division rate along the circumferential direction between time steps 325 and 450 for the varying cortical stiffness case, an initial division rate in the ventricular zone (VZ) , and varying division rates in the OSVZ with an initial value of 20.
The top row shows the cell density distribution and the bottom row the actual division rate in the OSVZ.
Figure 14
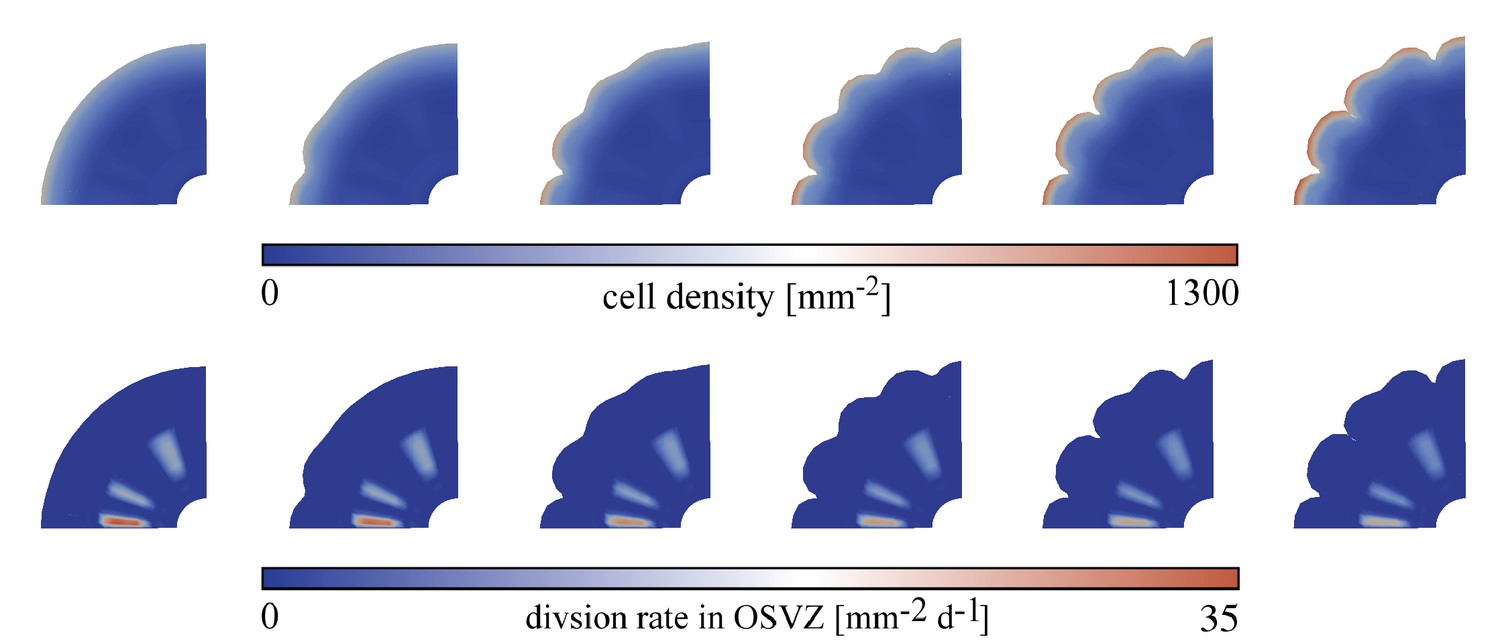
Temporal evolution of cortical folds for a random distribution of the outer subventricular zone (OSVZ) division rate between time steps 450 and 670 for the varying cortical stiffness case, an initial division rate in the ventricular zone (VZ) , and varying division rates in the OSVZ with an initial value of 20.
The top row shows the cell density distribution and the bottom row the actual division rate in the OSVZ.
Tables
Table 1
Model parameters in the two-dimensional case.
| Geometry parameters | Cell density problem parameters | ||||||
|---|---|---|---|---|---|---|---|
| Parameter | Value | Unit | Parameter | Value | Unit | ||
| Outer brain radius | 2 | mm | Division rate in VZ | [30-120] | mm–2d–1 | ||
| Inner brain radius | 0.4 | mm | Division rate in OSVZ | [10-30] | mm–2d–1 | ||
| VZ radius | 0.5 | mm | Migration speed | v | 5 | mm d–1 | |
| ISVZ radius | 0.8 | mm | Migration threshold | c0 | 500 | mm–2 | |
| Cortex radius | 1.8 | mm | Heaviside exponent | 0.008 | – | ||
| MST factor | 0.02 | mm d–1 | Diffusivity | 0.11 | mm–2d–1 | ||
| Mechanical problem parameters | Mechanical growth problem parameters | ||||||
| Parameter | Value | Unit | Parameter | Value | Unit | ||
| Cortex shear modulus | 2.07 | kPa | Growth parameter | mm2 | |||
| Poisson ratio | 0.38 | – | Growth exponent | 1.65 | – | ||
| Stiffness ratio | 3,8 | – | Growth ratio | 1.5,3 | – | ||
| Maximum threshold | 700 | mm–2 | |||||
| Minimum threshold | 200 | mm–2 | |||||
Additional files
Download links
A two-part list of links to download the article, or parts of the article, in various formats.
Downloads (link to download the article as PDF)
Open citations (links to open the citations from this article in various online reference manager services)
Cite this article (links to download the citations from this article in formats compatible with various reference manager tools)
Exploring the role of the outer subventricular zone during cortical folding through a physics-based model
eLife 12:e82925.
https://doi.org/10.7554/eLife.82925


