Proteomic characteristics reveal the signatures and the risks of T1 colorectal cancer metastasis to lymph nodes
- State Key Laboratory of Genetic Engineering and Collaborative Innovation Center for Genetics and Development, Human Phenome Institute, School of Life Sciences, Institutes of Biomedical Sciences, Department of Colorectal Surgery, Colorectal Cancer Center, Zhongshan Hospital, Fudan University, China
- Xiamen University Research Center of Retroperitoneal Tumor Committee of Oncology Society of Chinese Medical Association, College of Medicine, Xiamen University, China
- Cancer Center, Zhongshan Hospital, Fudan University, China
- State Key Laboratory of Proteomics, Beijing Proteome Research Center, National Center for Protein Sciences, China
- Research Unit of Proteomics Driven Cancer Precision Medicine, Chinese Academy of Medical Sciences, China
- State Key Laboratory of Cell Differentiation and Regulation, Henan International Joint Laboratory of Pulmonary Fibrosis, Henan Center for Outstanding Overseas Scientists of Pulmonary Fibrosis, College of Life Science, Institute of Biomedical Science, Henan Normal University, China
Figures
Figure 1 with 2 supplements
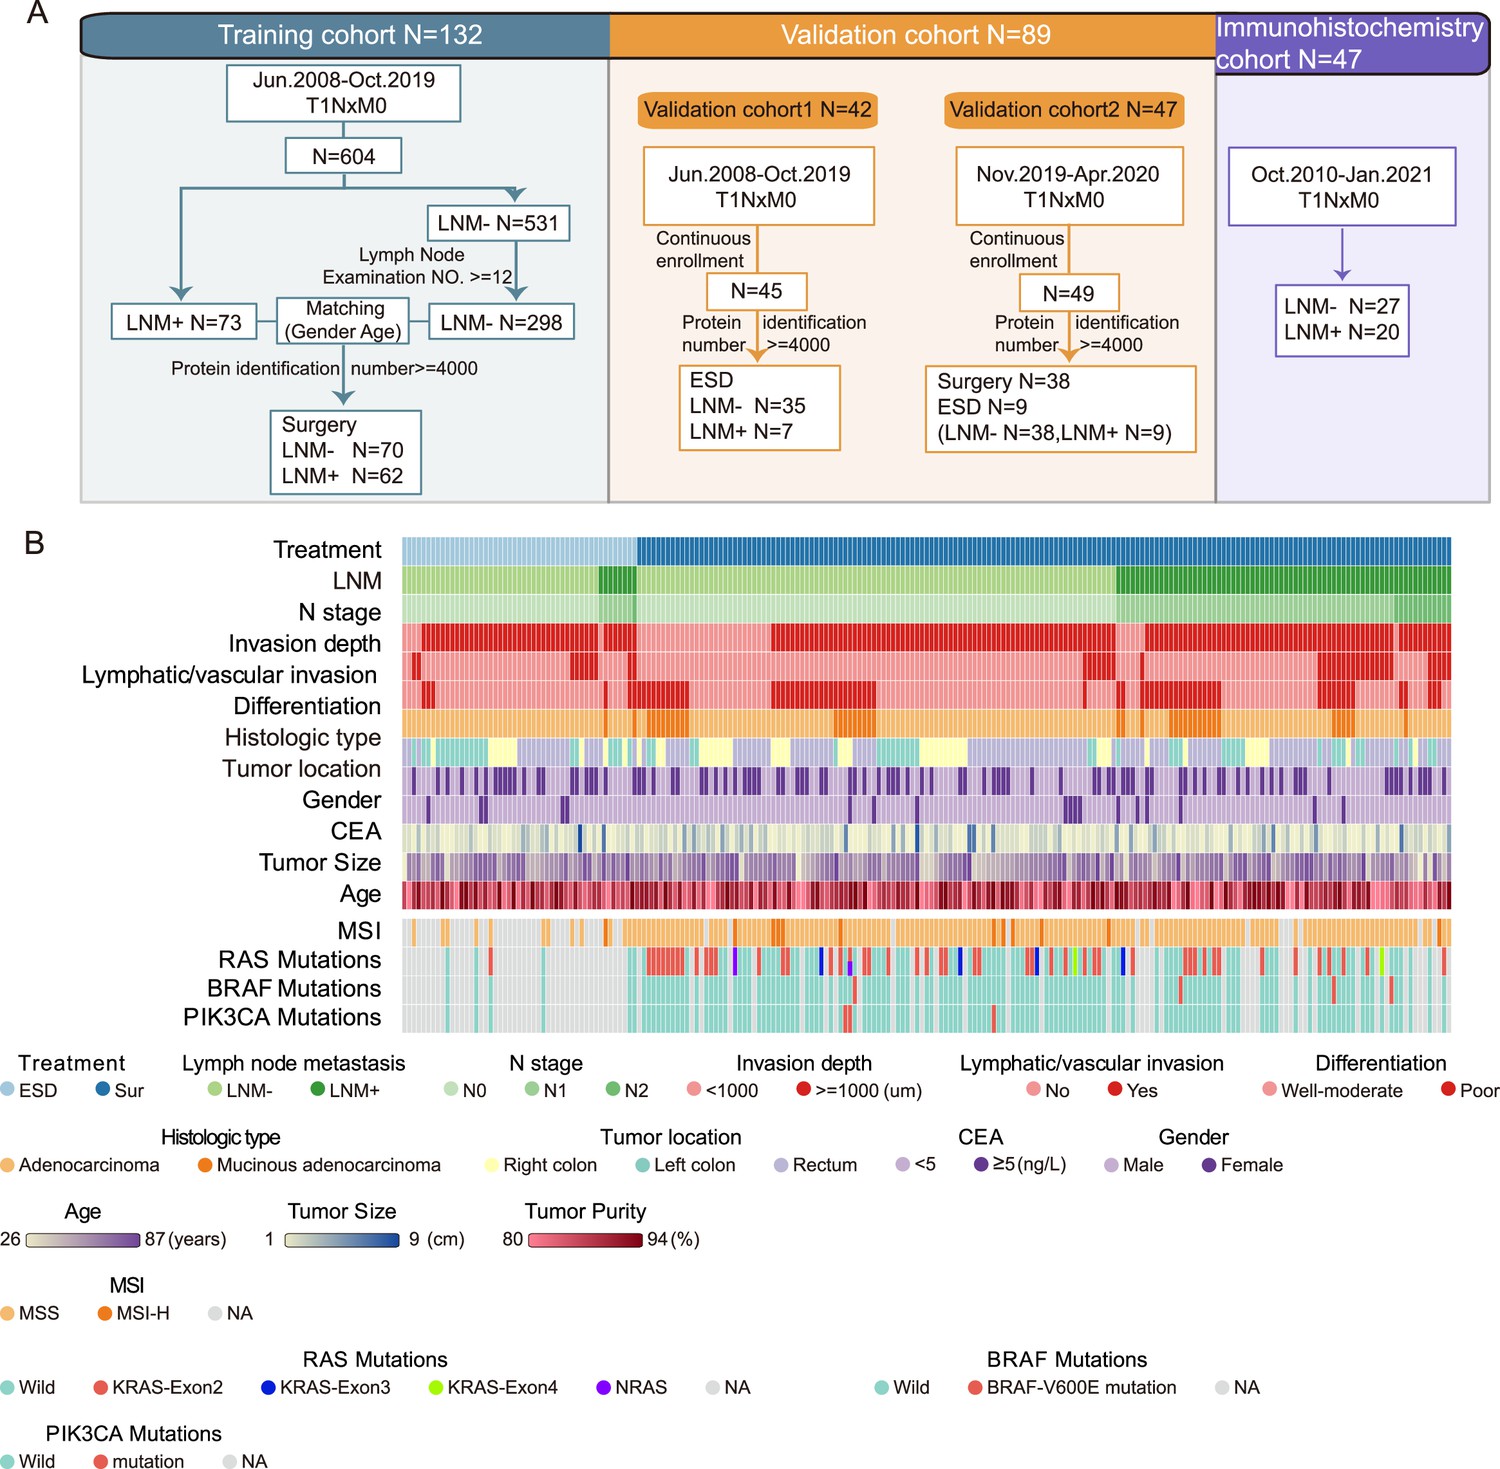
Sample selection and proteomics landscape of T1 colorectal cancer (CRC) with or without lymph node metastasis (LNM).
(A) In total, 221 samples were divided into three cohorts: a training cohort (N=132), validation cohort 1 (N=42), and validation cohort 2 (N=47); 47 samples were used for immunohistochemistry (IHC) staining. (B) The study included 143 LNM-negative and 78 LNM-positive patients with T1 CRC and 51 and 170 patients treated with endoscopic submucosal dissection (ESD) or surgical resection, respectively. Clinical parameters are shown in the heatmap. Also, see Figure 1—figure supplement 1.
-
Figure 1—source data 1
Clinicopathologic features.
- https://cdn.elifesciences.org/articles/82959/elife-82959-fig1-data1-v2.zip
-
Figure 1—source data 2
All identified proteins.
- https://cdn.elifesciences.org/articles/82959/elife-82959-fig1-data2-v2.zip
-
Figure 1—source data 3
Filtered proteomics data.
- https://cdn.elifesciences.org/articles/82959/elife-82959-fig1-data3-v2.zip
Figure 1—figure supplement 1
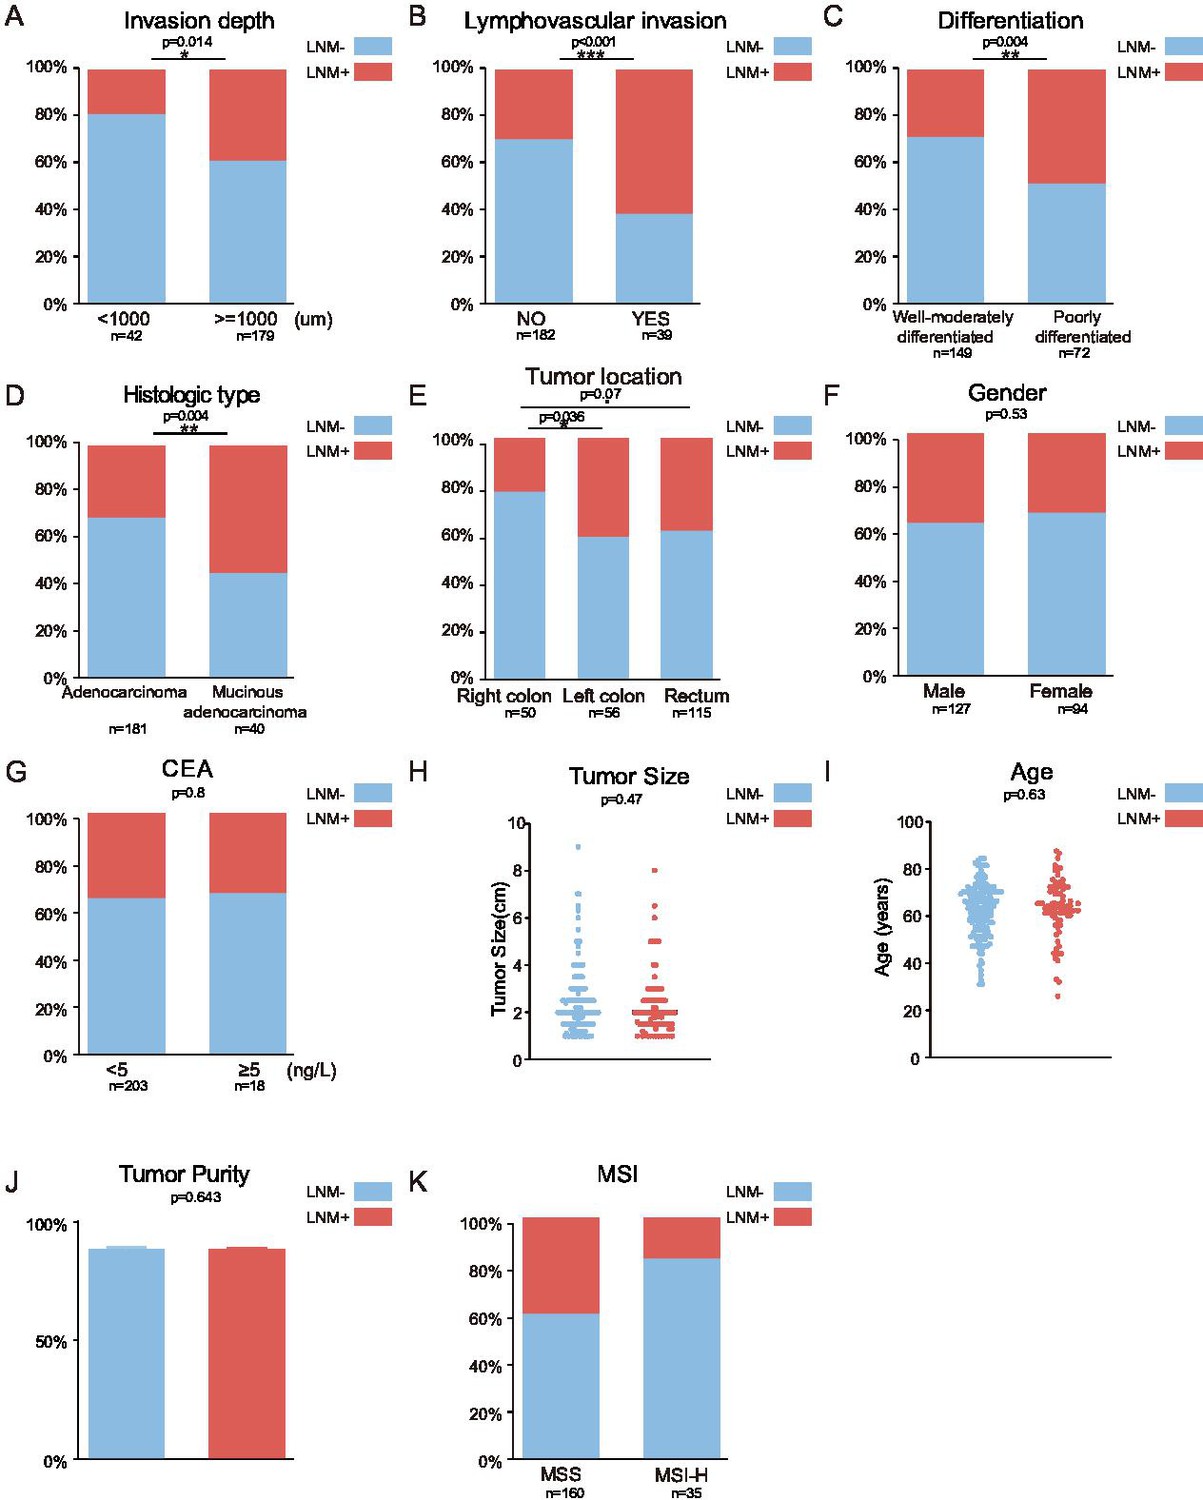
Association between clinical parameters and lymph node metastasis (LNM).
Related to Figure 1. (A–I) The following clinical parameters were examined: invasion depth (A), lymphovascular invasion (B), differentiation (C), histologic type (D), tumor location (E), sex (F), CEA (G), tumor size (H), and age (I), tumor purity (J), and MSI (K) (*p<0.05; **p<0.01, ***p<0.001, chi-square test).
Figure 1—figure supplement 2
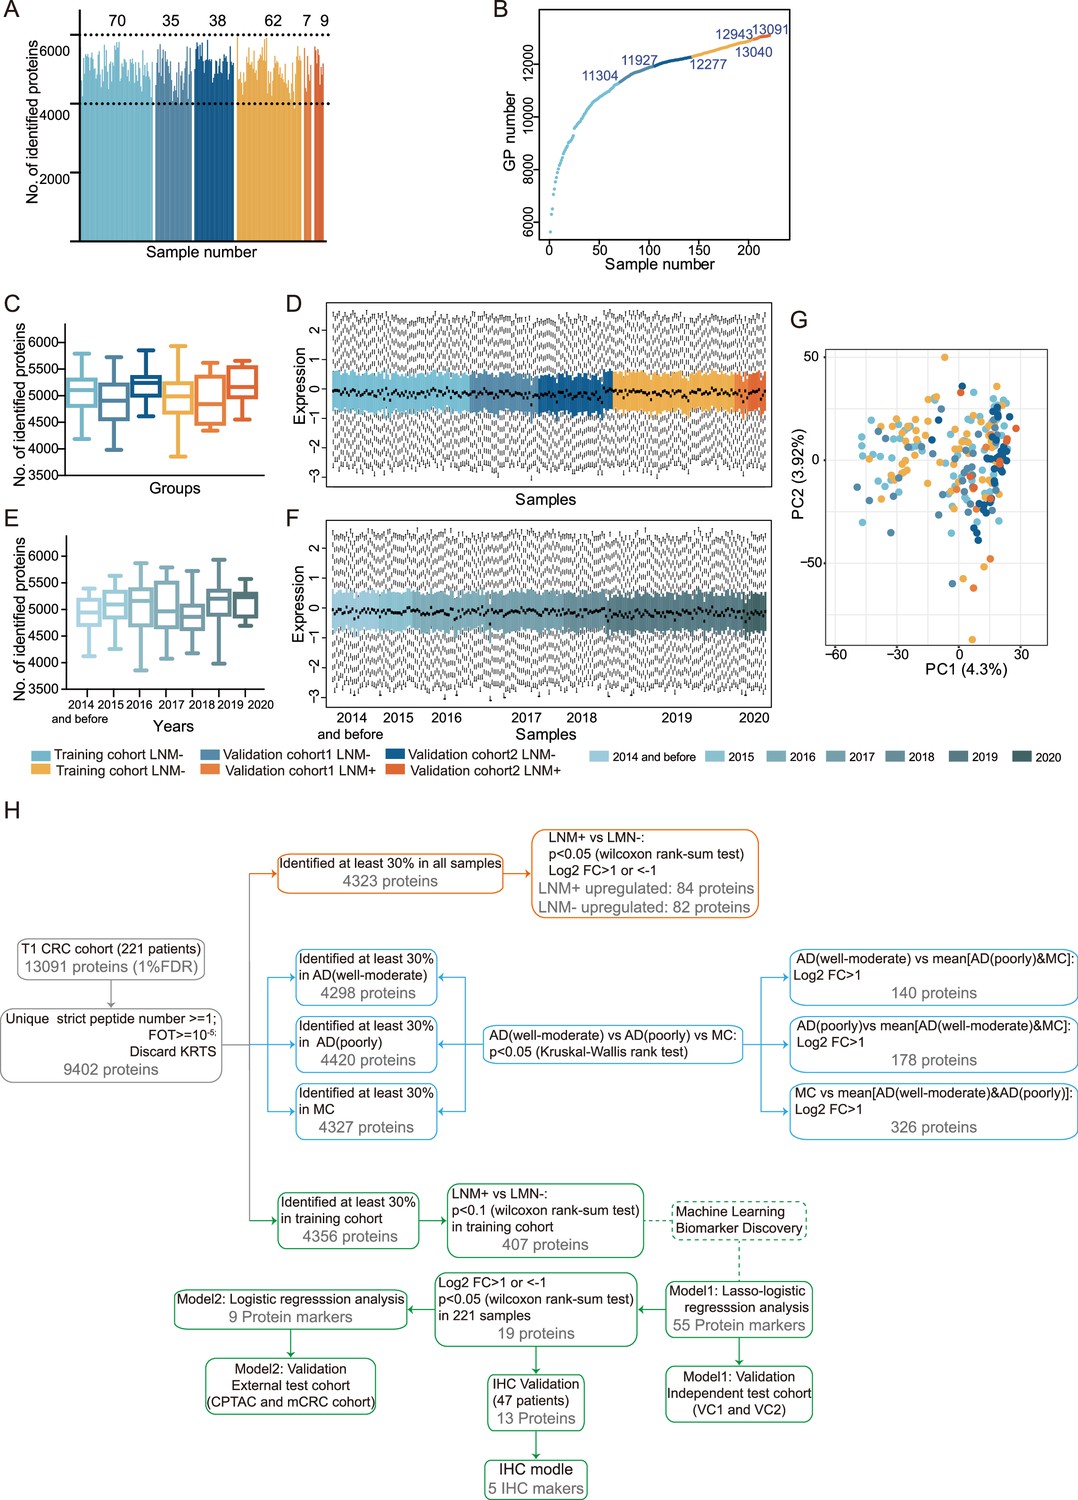
Quality assessment of proteomic data and summary of the analysis.
Related to Figure 1. (A) Total number of proteins quantified in 221 samples lymph node metastasis (LNM)-positive samples from the training cohort (light orange), validation cohort 1 (orange), and validation cohort 2 (dark orange); LNM-negative samples from the training cohort (light blue), validation cohort 1 (blue), and validation cohort 2 (dark blue). (E) Cumulative number of proteins identified. (B) Cumulative number of proteins identified. (C & E) Box plots of the proteins identified in LNM-negative and LNM-positive samples from different cohorts (C) sample collection time (E). LNM-negative samples from the training cohort (light blue), validation cohort 1 (blue), validation cohort 2 (dark blue); LNM-positive samples from the training cohort (light orange), validation cohort 1 (orange), and validation cohort 2 (dark orange). (D & F) Distribution of log10-transformed iBAQ abundance of identified proteins in 221 proteome samples from different cohorts (D) sample collection time (F) that passed quality control. (G) Principal component analysis across different cohorts. The study samples were intermixed, suggesting a limited batch effect, and the quality control samples (QCs) clustered together, indicating good technical reproducibility. (H) Proteomic datasets filtered at different levels for various statistical analyses.
Figure 2 with 2 supplements
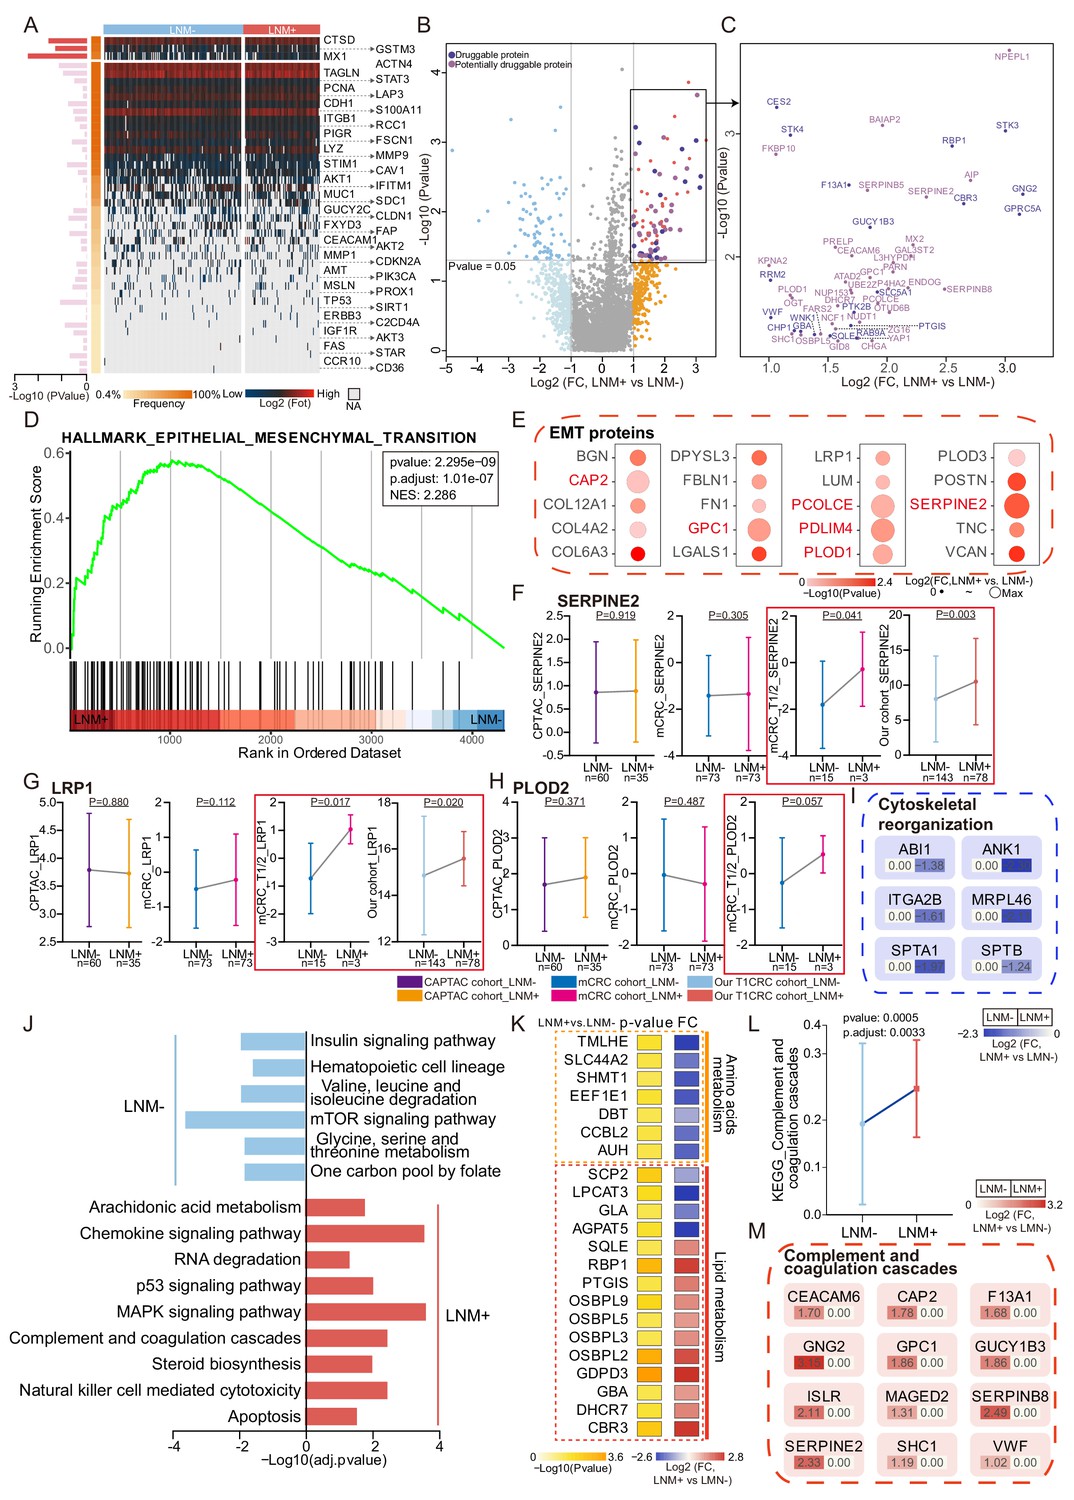
Protein signatures and functional differences between lymph node metastasis (LNM)-negative and LNM-positive patients with T1 colorectal cancer (CRC).
(A) Forty-four reported protein markers associated with LNM in CRC. (B) A volcano plot showing proteins overexpressed in LNM-negative or LNM-positive patients (light blue and orange indicate proteins found in >30% of samples and a fold change of more than two, whereas blue and red indicate proteins with p<0.05; other proteins are shown in gray). Dark and light purple represent druggable and potentially druggable proteins based on the Drug Gene Interaction Database (http://www.dgidb.org/). (C) A scatterplot showing druggable (dark purple, N=19) and potentially druggable (light purple, N=34) proteins based on the Drug Gene Interaction Database (http://www.dgidb.org/) overexpressed in LNM-positive patients. (D) Gene set enrichment analysis plot of the Hallmark Epithelial Mesenchymal Transition (EMT) gene set, identified as significantly enriched (FDR of <0.05) using unbiased geneset enrichment analysis. (E) Details of proteins involved in the EMT. (F, G, H) Comparison of SERPINE2 (F), LRP1 (G), and PLOD2 (H) expression between LNM-negative group and LNM-positive group in CPTAC cohort, mCRC cohort, T1/2 patients of mCRC cohort and our cohort (Wilcoxon rank-sum test). (I) Details of proteins involved in the cytoskeletal remodeling. (J) Single sample Gene Set Enrichment Analysis (ssGSEA) of LNM-negative group patients compared with LNM-positive group patients. (K) Dysregulation of metabolic bioprocesses in T1 CRC. Alterations of representative proteins depicted as-log10 p-value and log2 FC (LNM+/LNM−, Wilcoxon rank-sum test). (L & M) Comparison of Complement and coagulation cascade scores between the LNM-negative group and LNM-positive (LNM+/LNM−, limma approach) (L) and the details of proteins involved in the cytoskeletal remodeling and coagulation cascades (M).
-
Figure 2—source data 1
Log2 transformed proteomics data.
- https://cdn.elifesciences.org/articles/82959/elife-82959-fig2-data1-v2.zip
-
Figure 2—source data 2
Druggability based on the Drug Gene Interaction Database.
- https://cdn.elifesciences.org/articles/82959/elife-82959-fig2-data2-v2.zip
-
Figure 2—source data 3
GSEA.
- https://cdn.elifesciences.org/articles/82959/elife-82959-fig2-data3-v2.zip
-
Figure 2—source data 4
Immune composition of T1 colorectal cancer (CRC) from xCell.
- https://cdn.elifesciences.org/articles/82959/elife-82959-fig2-data4-v2.zip
-
Figure 2—source data 5
D2-40 immunohistochemistry (IHC) staining score.
- https://cdn.elifesciences.org/articles/82959/elife-82959-fig2-data5-v2.zip
Figure 2—figure supplement 1
Protein signatures across three cohorts.
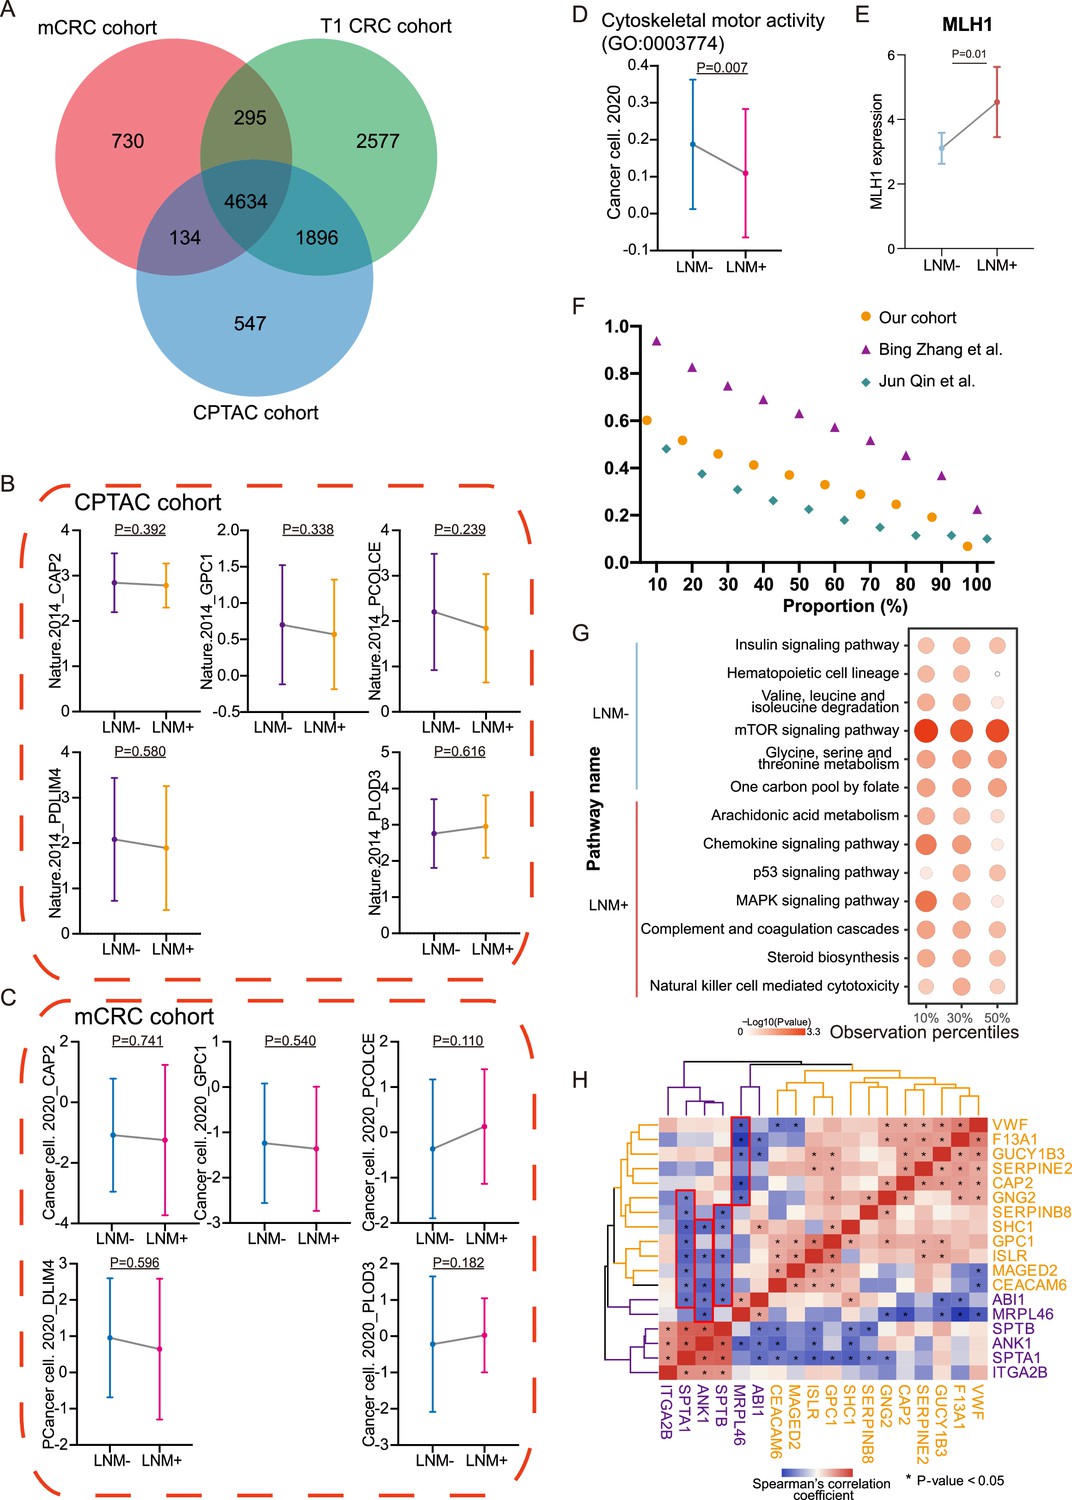
(A) VENN plot of proteins identified among different cohorts. (B & C) Comparison of epithelial-mesenchymal transition (EMT) proteins (CAP2, GPC1, PCOLCE, PDLM4, and PLOD3) expression between lymph node metastasis (LNM)-negative group and LNM-positive group in CPTAC cohort (LNM-, N=60; LNM+, N=35) (B) and mCRC cohort (LNM-, N=73; LNM+, N=73) The p-value was calculated by the Wilcoxon rank-sum test (C). (D) Cytoskeletal remodeling pathway (single sample Gene Set Enrichment Analysis: ssGSEA) of LNM-negative group patients compared with LNM-positive group patients in mCRC cohort The p-value was calculated by the limma approach. (E) Comparison of MLH1 expression between LNM-negative and positive groups. The p-value was calculated by the Wilcoxon rank-sum test. (F) Number of proteins identified with different criterion in our cohort, Bing Zhang et al., cohort and Jun Qin et al., cohort. (G) Represented pathways Enrichment of DEPs from four thresholds (20%, 40%, 60%, and 80%). (H) Correlation between cytoskeletal remodeling and coagulation cascades related proteins.
Figure 2—figure supplement 2
Protein differences by differentiation and histologic type and proteogenomic characteristics of mucinous colorectal adenocarcinoma.
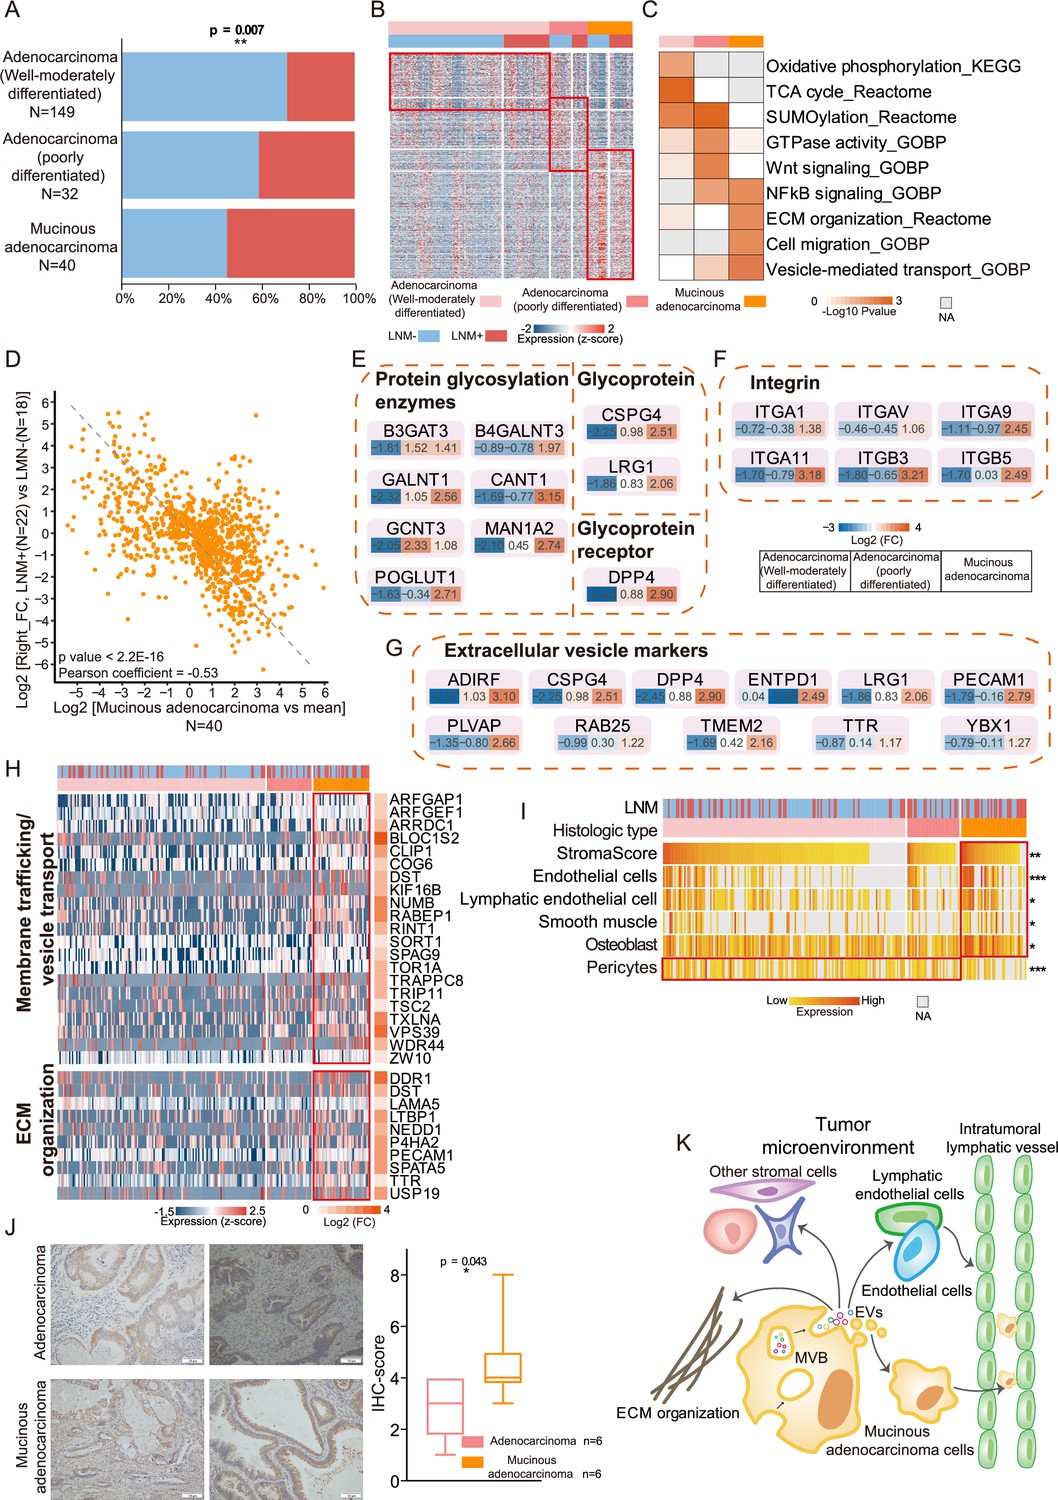
(A) Bar graphs illustrating the relative proportion of lymph node metastasis (LNM) in well to moderately-differentiated adenocarcinoma, poorly-differentiated adenocarcinoma, and mucinous adenocarcinoma. p-values were calculated from the chi-square test. (B) Upregulated proteins (proteins found in >30% of samples, a fold change more than two and p<0.05 (Kruskal-Wallis test)) in T1 colorectal cancer (CRC) with varying degrees of differentiation and different histologic types. Also, see Figure 1—figure supplement 2H. (C) Pathway enrichment (Reactome, KEGG, and GO) analysis showing upregulated pathways in T1 CRC with varying degrees of differentiation and different histologic types. (D) Correlation of protein expression fold changes in LNM-positive/LNM-negative patients with histologic type (mucinous adenocarcinoma vs. the mean). (E, F, G) Glycoprotein- and glycosylation-related protein (E), Integrins (F), and extracellular vesicle markers (G) were overexpressed in mucinous colorectal adenocarcinoma. (H) Proteins in two pathways (membrane trafficking and/or vesicle transport and extracellular matrix (ECM) organization) that were overexpressed in mucinous colorectal adenocarcinoma. (I) Stromal score and signatures from xCell (*p<0.05; **p<0.01, ***p<0.001, Kruskal-Wallis test). (J) Immunohistochemistry (IHC) staining of D2-40. Scale bar, 100mm. Boxplots show the quantification of the IHC results (Student’s t-test). (K) Model of LNM progression in mucinous colorectal adenocarcinoma.
Figure 3 with 1 supplement
Development and validation of a protein classifier to predict lymph node metastasis (LNM) with T1 colorectal cancer (CRC).
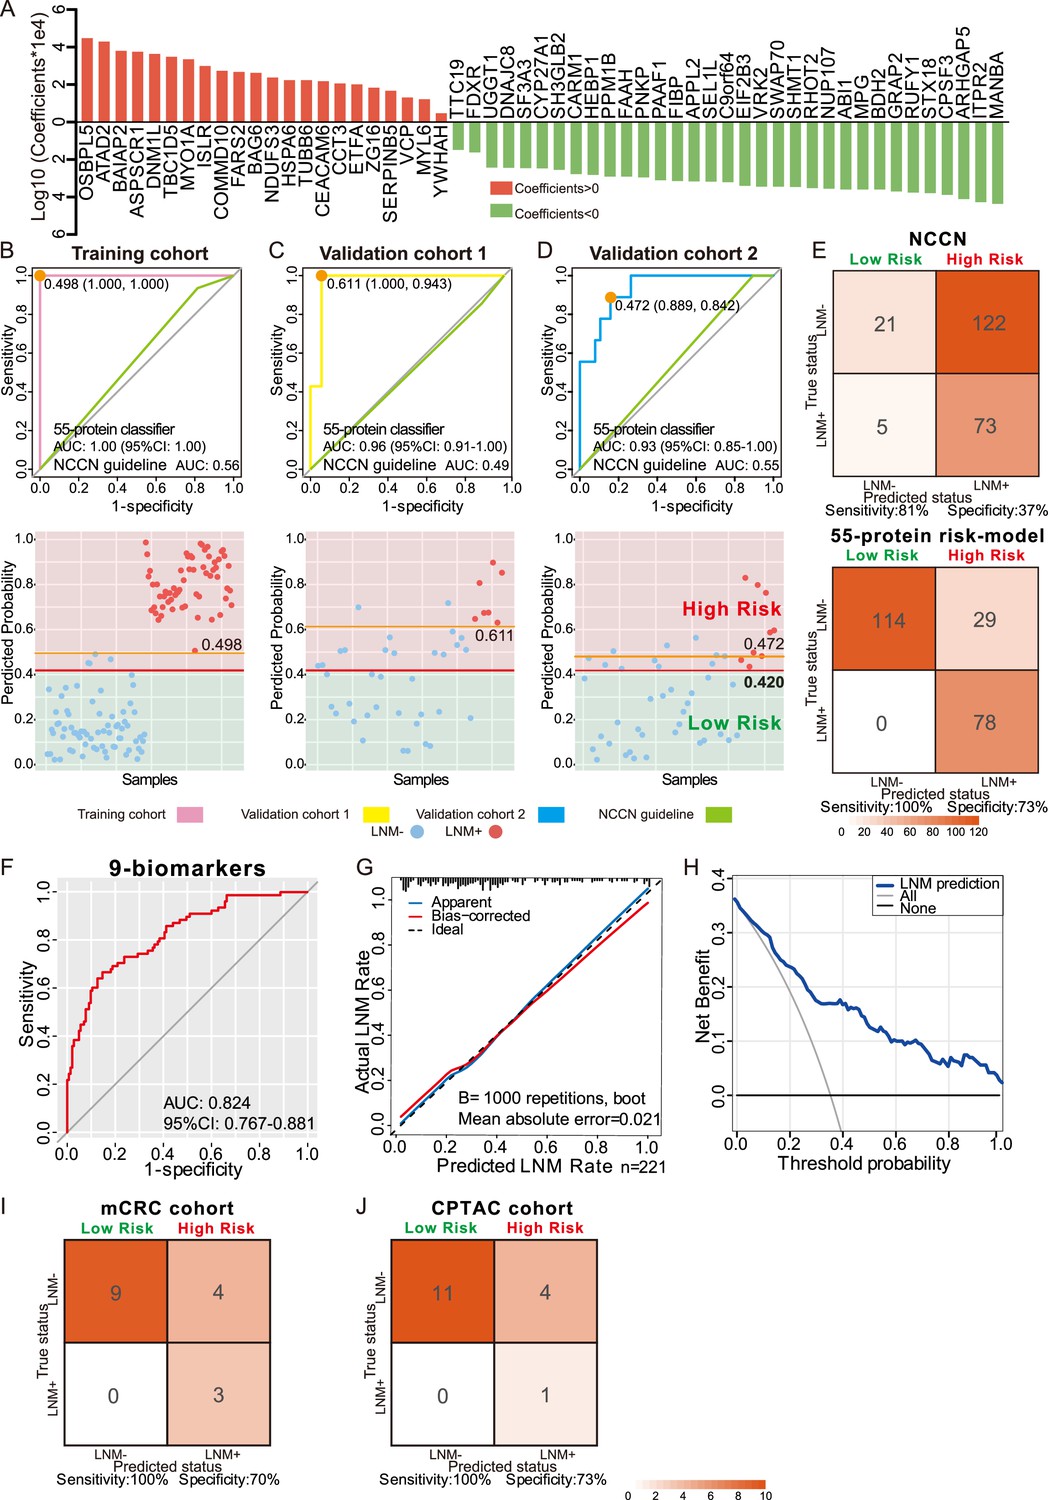
(A) The predictive relevance of all 55 protein markers to distinguish LNM-positive from LNM-negative T1 CRC patients is represented by a bar chart, and their least absolute shrinkage and selection operator (LASSO) coefficients are indicated. Also, see Figure 1—figure supplement 2H, Figure 3—figure supplement 1A, B. (B, C, D) Top: Receiver operating characteristic (ROC) curve with the area under the curve (AUC) for the protein classifier of the training cohort (B), validation cohort 1 (C), and validation cohort 2 (D). Bottom: Scatterplot representing the score of each patient with (red dot) or without (blue dot) LNM, the optimal threshold (Youden’s index) of each curve (orange line) and the safety cutoff line (red line). (E) Classification error matrix using NCCN guidelines and safety cutoff from our 55-protein model. (F, G, H) ROC curve of the optimized 9-biomarker classifier using binary logistic regression (F), calibration curve of the optimized model (G), and cost-benefit decision curves (H) in 221 patients. (I & J) Classification confusion matrix of the simplified classifier in mCRC cohort (I) and CPTAC cohort (J). The number of samples identified is noted in each box.
-
Figure 3—source data 1
Coefficients of 55 protein markers and the lymph node metastasis (LNM) scores of samples using least absolute shrinkage and selection operator (LASSO)-logistic regression.
- https://cdn.elifesciences.org/articles/82959/elife-82959-fig3-data1-v2.zip
-
Figure 3—source data 2
Predicting risk score for lymph node metastasis (LNM) of each patient.
- https://cdn.elifesciences.org/articles/82959/elife-82959-fig3-data2-v2.zip
-
Figure 3—source data 3
Coefficients of nine protein-markers.
- https://cdn.elifesciences.org/articles/82959/elife-82959-fig3-data3-v2.zip
-
Figure 3—source data 4
External validation.
- https://cdn.elifesciences.org/articles/82959/elife-82959-fig3-data4-v2.zip
Figure 3—figure supplement 1
Details of the least absolute shrinkage and selection operator (LASSO) regression model and immunohistochemistry (IHC) staining of targeted proteins.
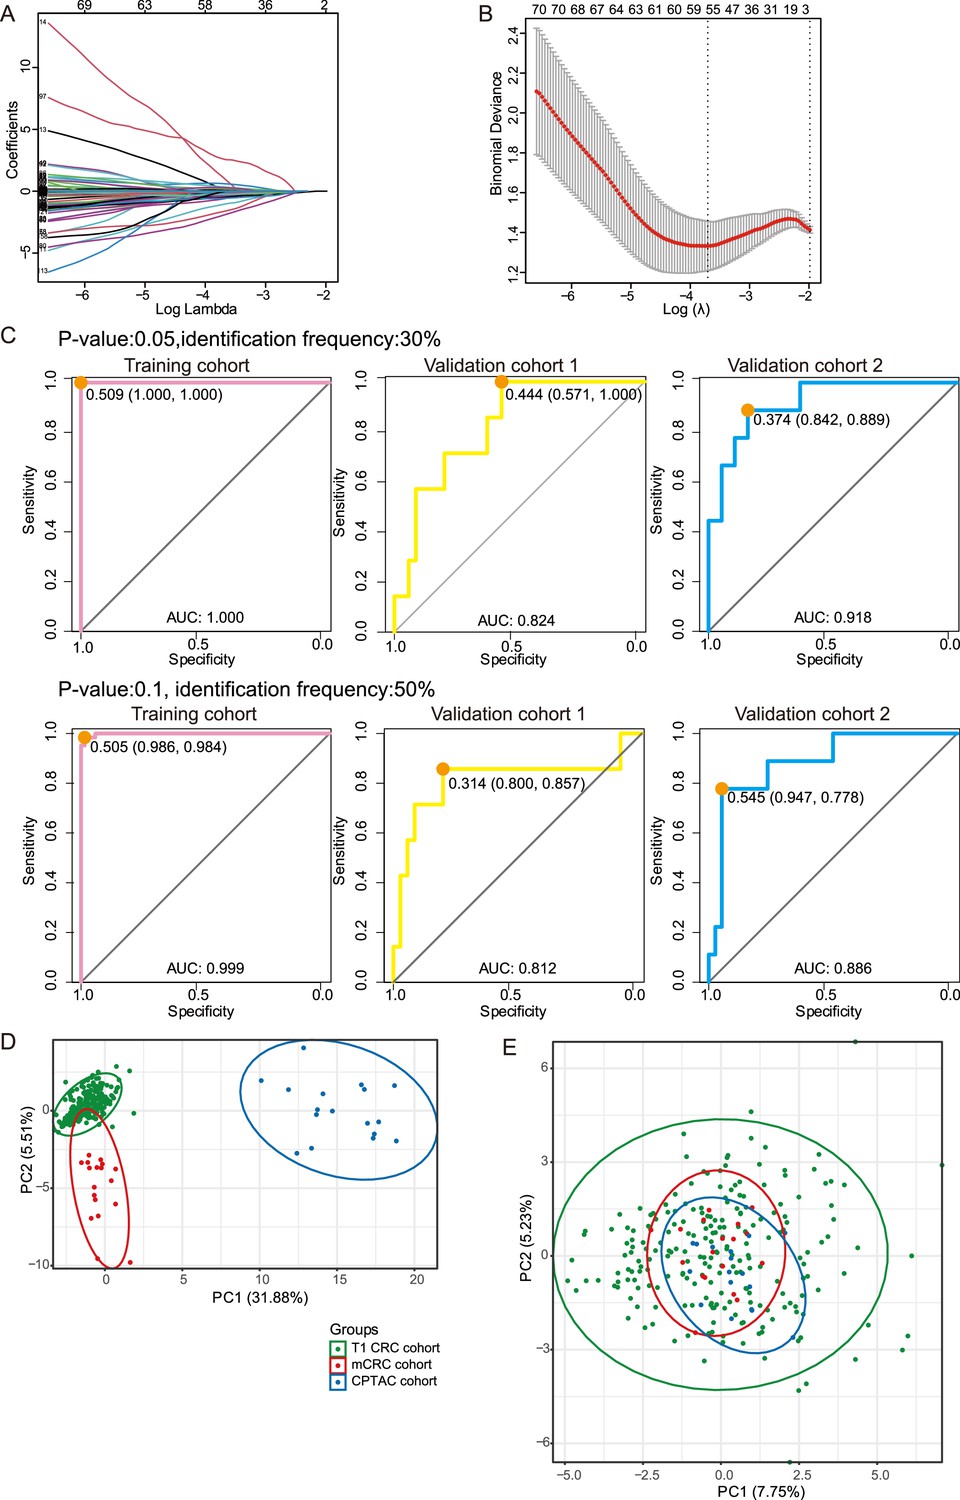
Related to Figure 3. (A) Tuning parameter (l) selection in the LASSO model via minimum criteria. (B) LASSO coefficient profiles of the 105 texture features. A coefficient profile plot was produced against the log (l) sequence. A vertical line was drawn at the value selected using LASSO, where optimal l resulted in 55 nonzero coefficients. (C) Receiver operating characteristic (ROC) curve with the area under curve (AUC) for the protein classifier using p-value 0.05 (upper) or identification frequency 50% (lower) as a cutoff in the training cohort, validation cohort 1 and validation cohort 2. (D & E) The PCA analysis shows the T1/2 samples of T1 colorectal cancer (CRC) (our), mCRC, and CPTAC cohort, (D) before batch correction, (E) after batch correction.
Figure 4 with 1 supplement
Immunohistochemical staining of targeted proteins.
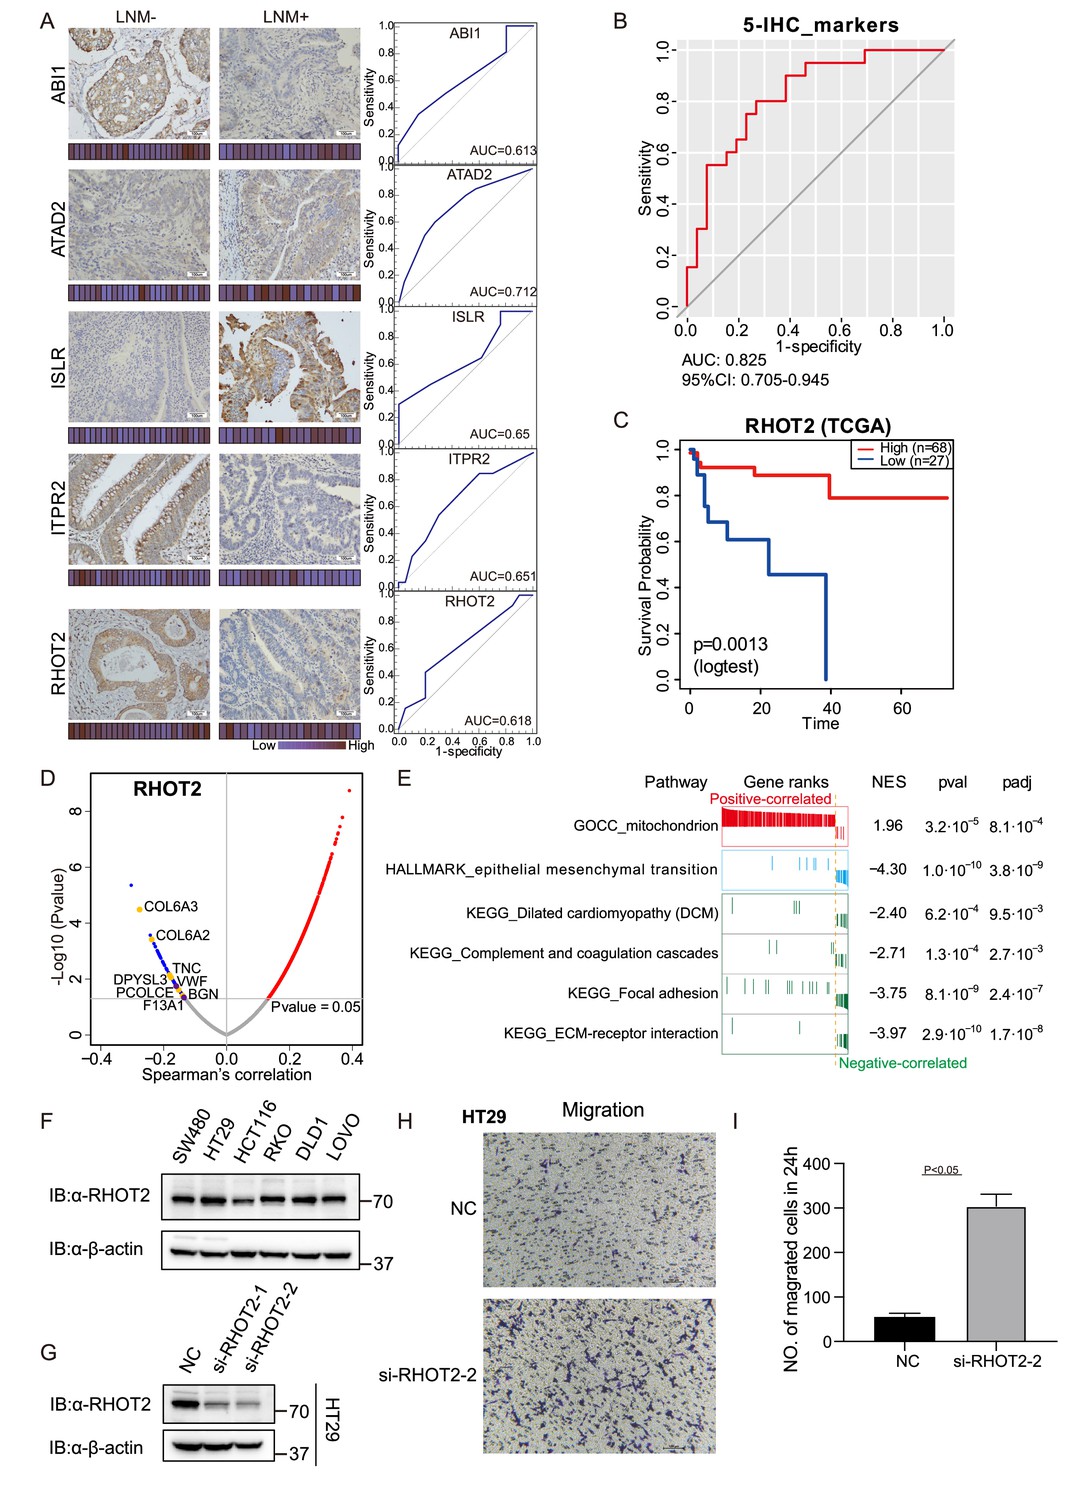
(A) T1 colorectal cancer (CRC) samples from a set of 47 cases were used to verify the abundance of ABI1, ITPR2, RHOT2, ATAD2, and ISLR. The scores that represent the sum of the intensities and percentage of protein staining in the lymph node metastasis (LNM)-positive or LNM-negative patients are shown as a heat map. (Histological images were obtained using a × 40 objective, scale bars, 100um). The receiver operating characteristic (ROC) curve of each protein was built by their immunohistochemistry (IHC) score. (B) ROC curve of the five proteins classifier using IHC score by binary logistic regression. (C) The overall survival of patients with colon cancer was analyzed on the basis of The Cancer Genome Atlas (TCGA) database. (D) Correlations between RHOT2 activities and protein abundances in the T1 CRC cohort. (E) Gene set enrichment analysis (GSEA) pathways using the single-gene method of RHOT2. (F) The RHOT2 protein expression in human colon cancer cells (SW480, HT29, HCT-116, RKO, DLD1, and LoVo) was measured by western blotting. (G) The protein expression of RHOT2 in HT29. (H & I) The migration ability of HT29 cells was detected by transwell assay (images were obtained using a × 20 objective, scale bars, 100um) (Student’s t-test).
-
Figure 4—source data 1
Immunohistochemistry (IHC) staining score.
- https://cdn.elifesciences.org/articles/82959/elife-82959-fig4-data1-v2.zip
-
Figure 4—source data 2
RHOT2 western blot source images.
- https://cdn.elifesciences.org/articles/82959/elife-82959-fig4-data2-v2.zip
Figure 4—figure supplement 1
Immunohistochemical staining of targeted proteins.
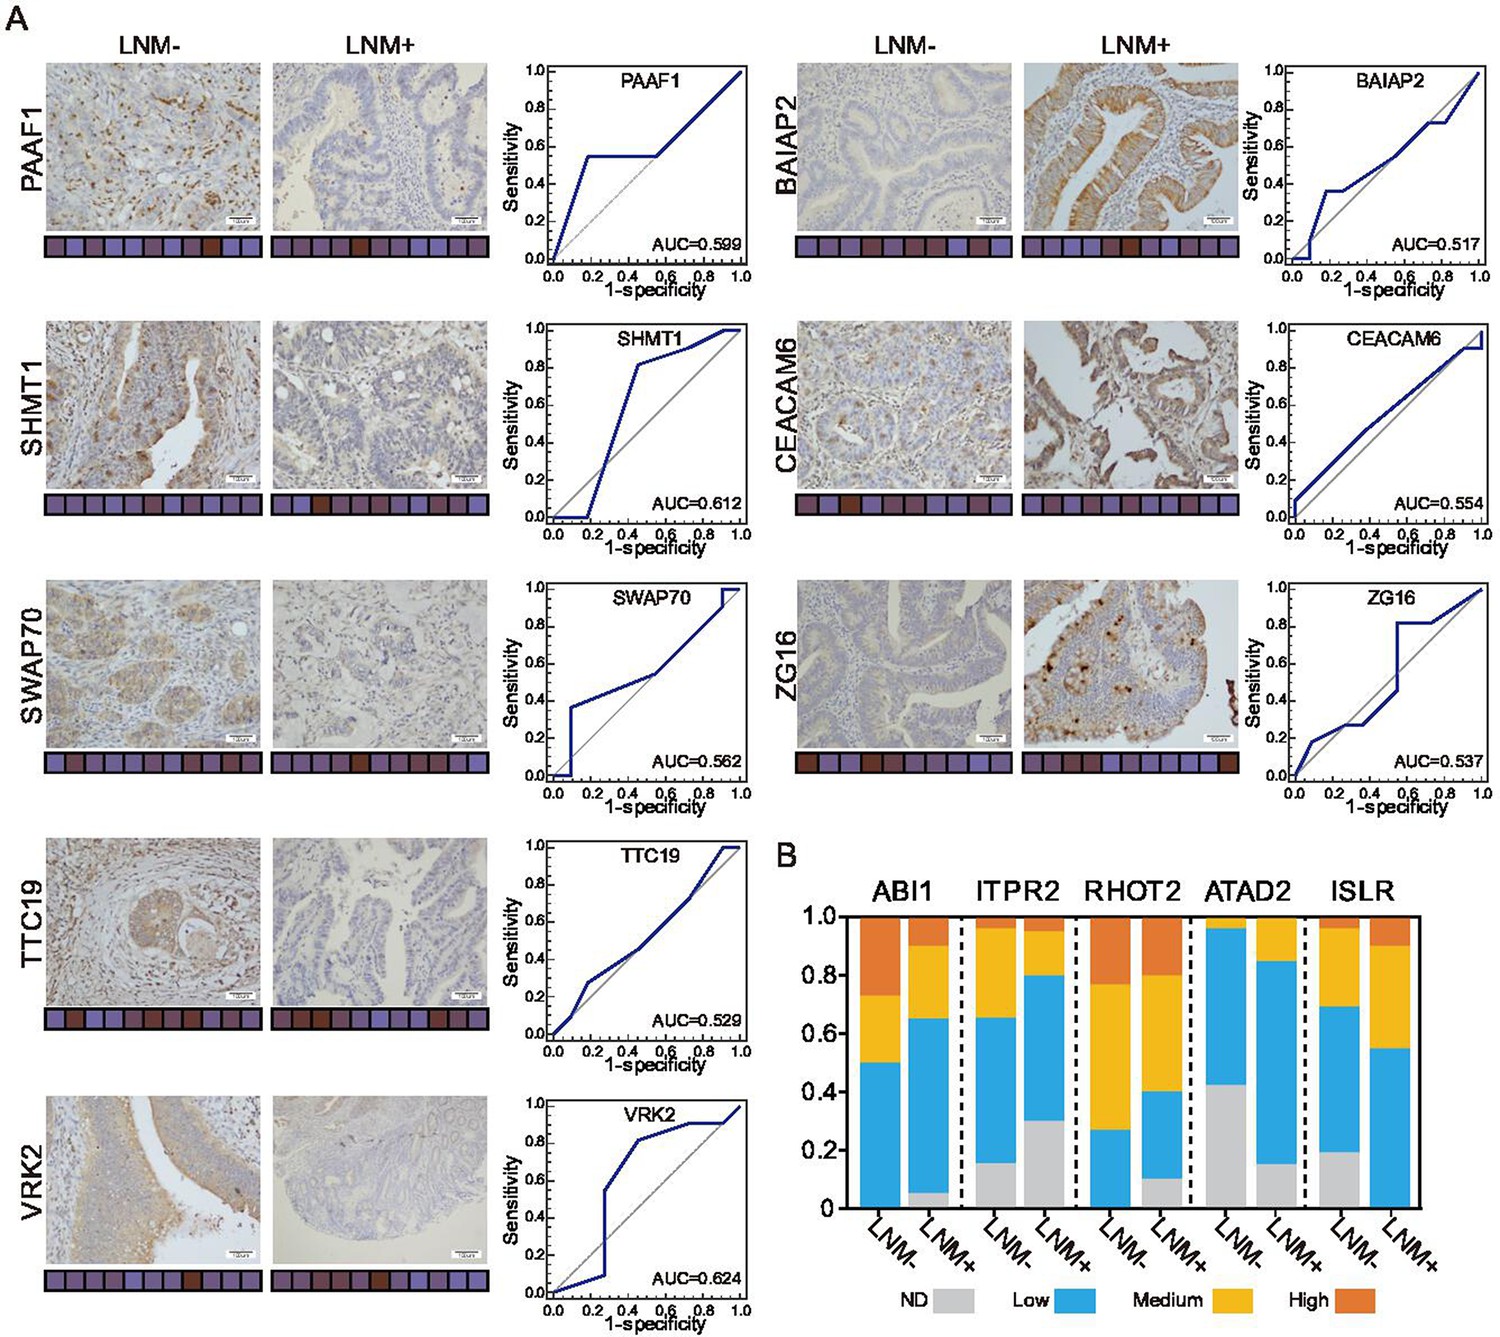
Related to Figure 4. (A) T1 colorectal cancer (CRC) samples from 22 patients were used to verify the abundance of PAAF1, SHMT1, SWAP70, TTC19, and VRK2 (left), and 21 samples were used to verify the abundance of BAIAP2, CEACAM6, and ZG16 (right) (Histological images were obtained using a × 40 objective, scale bars, 100um). The scores that represent the product of the intensities and percentage of protein staining in the lymph node metastasis (LNM)-negative or LNM-positive samples are shown as a heat map. (B) Proportions of immunohistochemistry (IHC) samples with high (IHC score: 9–12), medium (IHC score: 5–8), or low (IHC score: 1–4) staining. ND: not detected.
Author response image 1
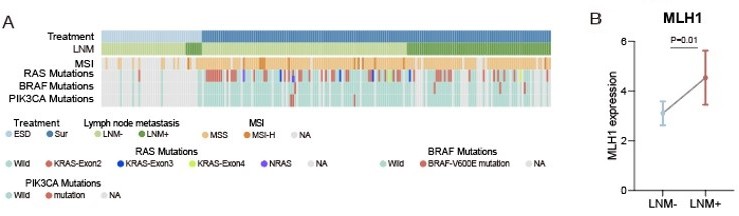
(A) Heatmap of Clinical parameters, MSI and gene mutations (RAS, BRAF and PIK3CA).
(B) Comparison of MLH1 expression between LNM-negative and positive groups. The p value was calculated by Wilcoxon rank-sum test.
Additional files
Download links
A two-part list of links to download the article, or parts of the article, in various formats.
Downloads (link to download the article as PDF)
Open citations (links to open the citations from this article in various online reference manager services)
Cite this article (links to download the citations from this article in formats compatible with various reference manager tools)
Proteomic characteristics reveal the signatures and the risks of T1 colorectal cancer metastasis to lymph nodes
eLife 12:e82959.
https://doi.org/10.7554/eLife.82959


